Topsail Beach, NC Map & Demographics
Topsail Beach Map
Topsail Beach Overview
$84,063
PER CAPITA INCOME
$159,205
AVG FAMILY INCOME
$112,708
AVG HOUSEHOLD INCOME
41.2%
WAGE / INCOME GAP [ % ]
58.8¢/ $1
WAGE / INCOME GAP [ $ ]
0.50
INEQUALITY / GINI INDEX
471
TOTAL POPULATION
225
MALE POPULATION
246
FEMALE POPULATION
91.46
MALES / 100 FEMALES
109.33
FEMALES / 100 MALES
64.6
MEDIAN AGE
2.4
AVG FAMILY SIZE
1.9
AVG HOUSEHOLD SIZE
197
LABOR FORCE [ PEOPLE ]
43.8%
PERCENT IN LABOR FORCE
2.5%
UNEMPLOYMENT RATE
Topsail Beach Area Codes
Income in Topsail Beach
Income Overview in Topsail Beach
Per Capita Income in Topsail Beach is $84,063, while median incomes of families and households are $159,205 and $112,708 respectively.
| Characteristic | Number | Measure |
| Per Capita Income | 471 | $84,063 |
| Median Family Income | 153 | $159,205 |
| Mean Family Income | 153 | $187,578 |
| Median Household Income | 245 | $112,708 |
| Mean Household Income | 245 | $156,635 |
| Income Deficit | 153 | $0 |
| Wage / Income Gap (%) | 471 | 41.24% |
| Wage / Income Gap ($) | 471 | 58.76¢ per $1 |
| Gini / Inequality Index | 471 | 0.50 |
Earnings by Sex in Topsail Beach
Average Earnings in Topsail Beach are $53,750, $73,750 for men and $43,333 for women, a difference of 41.2%.
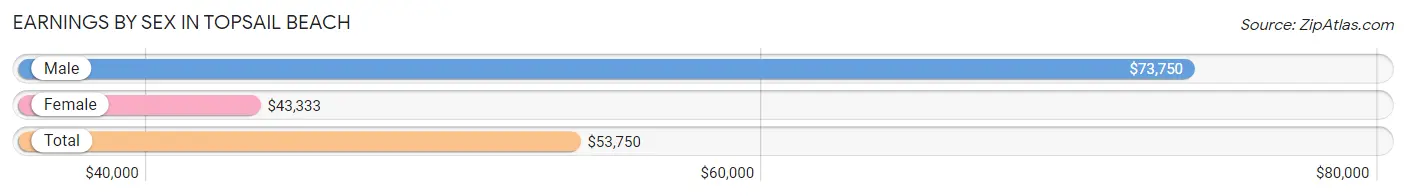
| Sex | Number | Average Earnings |
| Male | 124 (56.4%) | $73,750 |
| Female | 96 (43.6%) | $43,333 |
| Total | 220 (100.0%) | $53,750 |
Earnings by Sex by Income Bracket in Topsail Beach
The most common earnings brackets in Topsail Beach are $100,000+ for men (51 | 41.1%) and $100,000+ for women (26 | 27.1%).
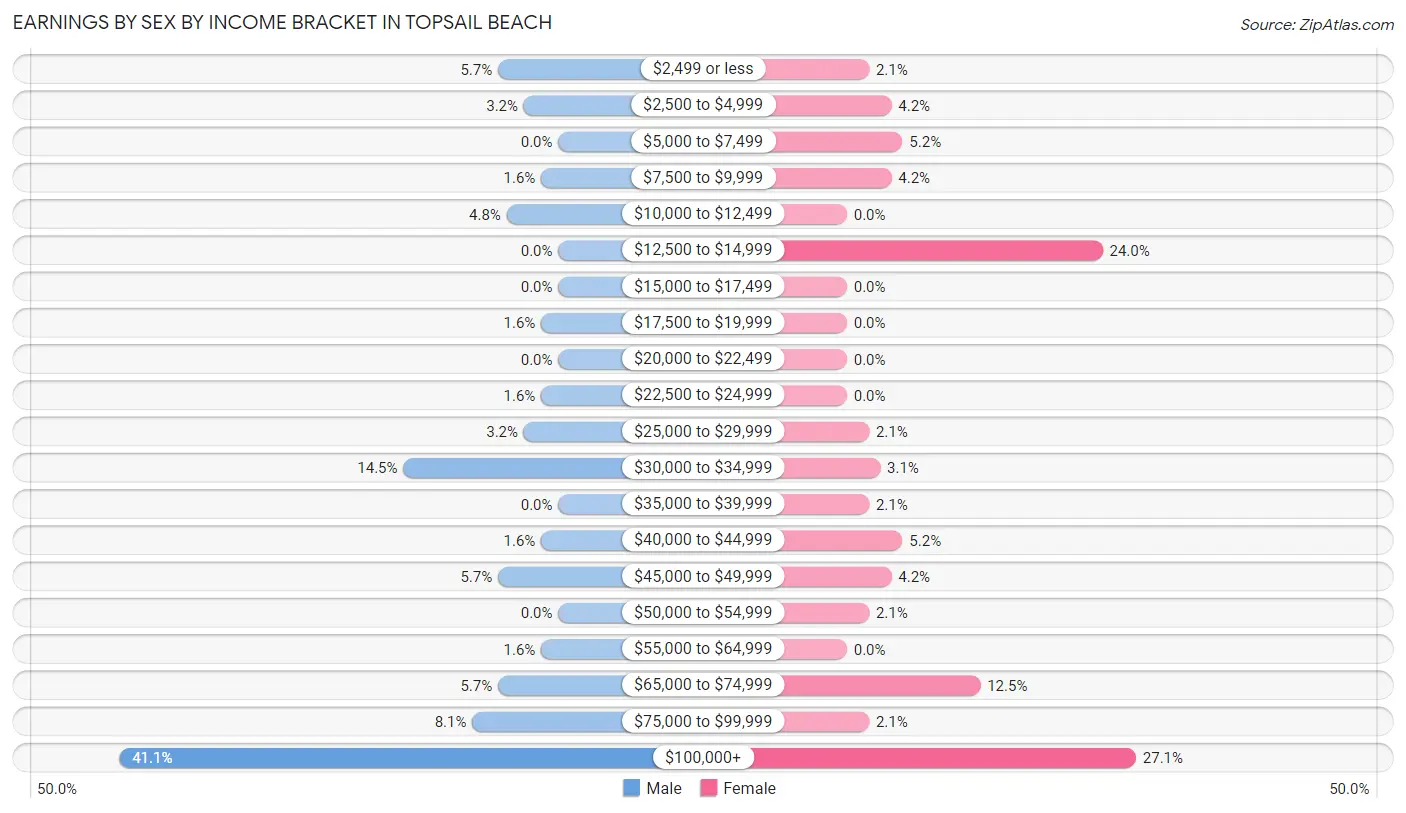
| Income | Male | Female |
| $2,499 or less | 7 (5.7%) | 2 (2.1%) |
| $2,500 to $4,999 | 4 (3.2%) | 4 (4.2%) |
| $5,000 to $7,499 | 0 (0.0%) | 5 (5.2%) |
| $7,500 to $9,999 | 2 (1.6%) | 4 (4.2%) |
| $10,000 to $12,499 | 6 (4.8%) | 0 (0.0%) |
| $12,500 to $14,999 | 0 (0.0%) | 23 (24.0%) |
| $15,000 to $17,499 | 0 (0.0%) | 0 (0.0%) |
| $17,500 to $19,999 | 2 (1.6%) | 0 (0.0%) |
| $20,000 to $22,499 | 0 (0.0%) | 0 (0.0%) |
| $22,500 to $24,999 | 2 (1.6%) | 0 (0.0%) |
| $25,000 to $29,999 | 4 (3.2%) | 2 (2.1%) |
| $30,000 to $34,999 | 18 (14.5%) | 3 (3.1%) |
| $35,000 to $39,999 | 0 (0.0%) | 2 (2.1%) |
| $40,000 to $44,999 | 2 (1.6%) | 5 (5.2%) |
| $45,000 to $49,999 | 7 (5.7%) | 4 (4.2%) |
| $50,000 to $54,999 | 0 (0.0%) | 2 (2.1%) |
| $55,000 to $64,999 | 2 (1.6%) | 0 (0.0%) |
| $65,000 to $74,999 | 7 (5.7%) | 12 (12.5%) |
| $75,000 to $99,999 | 10 (8.1%) | 2 (2.1%) |
| $100,000+ | 51 (41.1%) | 26 (27.1%) |
| Total | 124 (100.0%) | 96 (100.0%) |
Earnings by Sex by Educational Attainment in Topsail Beach
Average earnings in Topsail Beach are $80,000 for men and $44,167 for women, a difference of 44.8%. Men with an educational attainment of graduate degree enjoy the highest average annual earnings of $111,250, while those with graduate degree education earn the least with $111,250. Women with an educational attainment of graduate degree earn the most with the average annual earnings of $111,875, while those with high school diploma education have the smallest earnings of $14,079.
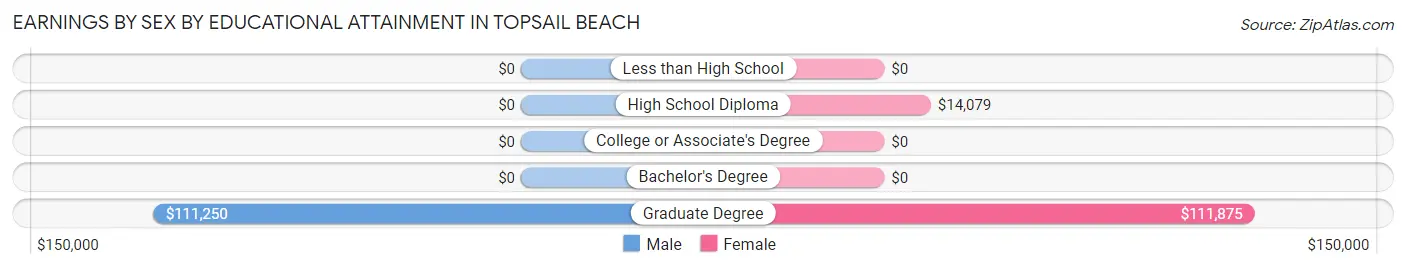
| Educational Attainment | Male Income | Female Income |
| Less than High School | - | - |
| High School Diploma | - | - |
| College or Associate's Degree | - | - |
| Bachelor's Degree | - | - |
| Graduate Degree | $111,250 | $111,875 |
| Total | $80,000 | $44,167 |
Family Income in Topsail Beach
Family Income Brackets in Topsail Beach
According to the Topsail Beach family income data, there are 45 families falling into the $200,000+ income range, which is the most common income bracket and makes up 29.4% of all families.
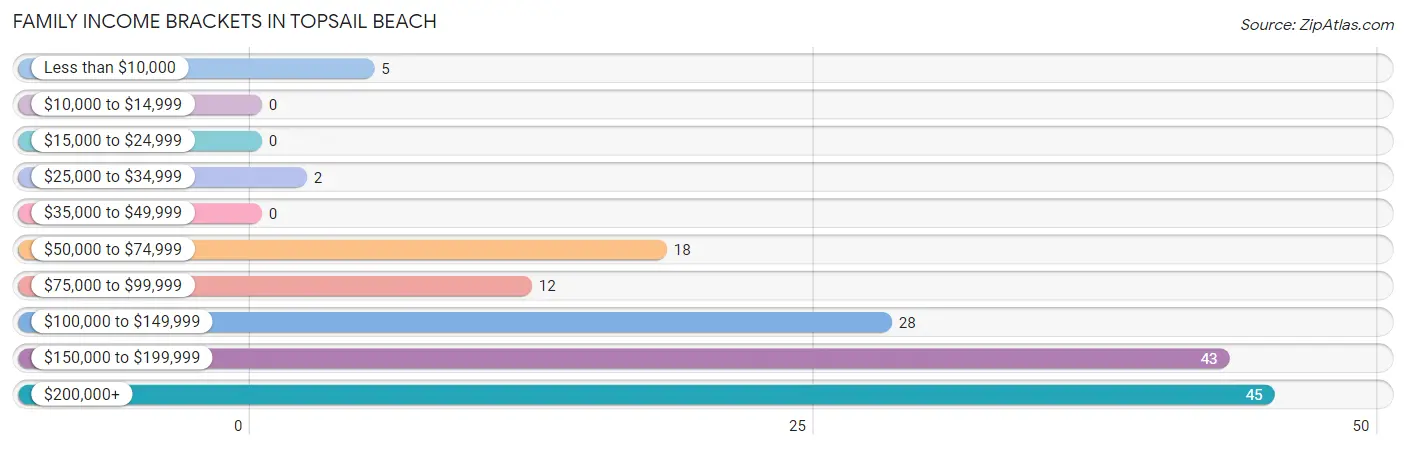
| Income Bracket | # Families | % Families |
| Less than $10,000 | 5 | 3.3% |
| $10,000 to $14,999 | 0 | 0.0% |
| $15,000 to $24,999 | 0 | 0.0% |
| $25,000 to $34,999 | 2 | 1.3% |
| $35,000 to $49,999 | 0 | 0.0% |
| $50,000 to $74,999 | 18 | 11.8% |
| $75,000 to $99,999 | 12 | 7.8% |
| $100,000 to $149,999 | 28 | 18.3% |
| $150,000 to $199,999 | 43 | 28.1% |
| $200,000+ | 45 | 29.4% |
Family Income by Famaliy Size in Topsail Beach
4-person families (11 | 7.2%) account for the highest median family income in Topsail Beach with $186,250 per family, while 2-person families (126 | 82.4%) have the highest median income of $79,204 per family member.
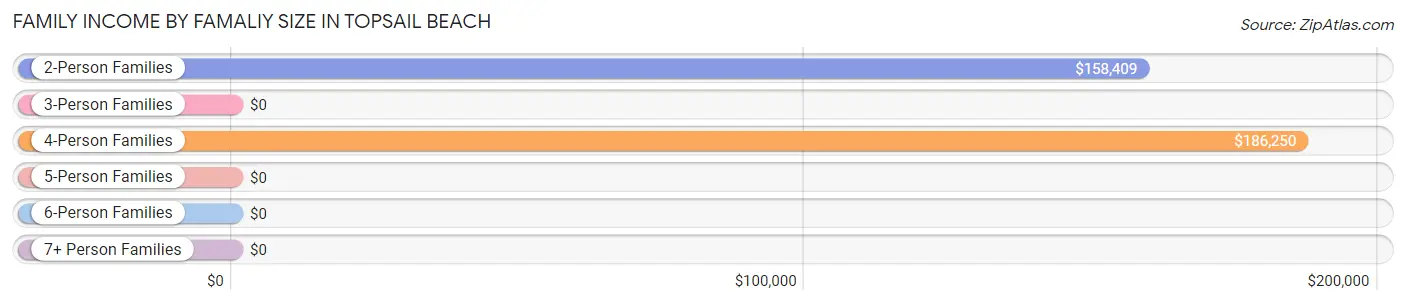
| Income Bracket | # Families | Median Income |
| 2-Person Families | 126 (82.4%) | $158,409 |
| 3-Person Families | 13 (8.5%) | $0 |
| 4-Person Families | 11 (7.2%) | $186,250 |
| 5-Person Families | 3 (2.0%) | $0 |
| 6-Person Families | 0 (0.0%) | $0 |
| 7+ Person Families | 0 (0.0%) | $0 |
| Total | 153 (100.0%) | $159,205 |
Family Income by Number of Earners in Topsail Beach
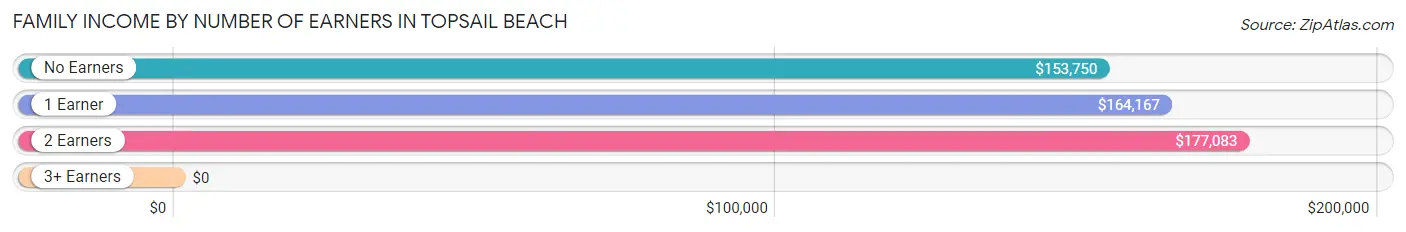
| Number of Earners | # Families | Median Income |
| No Earners | 56 (36.6%) | $153,750 |
| 1 Earner | 46 (30.1%) | $164,167 |
| 2 Earners | 47 (30.7%) | $177,083 |
| 3+ Earners | 4 (2.6%) | $0 |
| Total | 153 (100.0%) | $159,205 |
Household Income in Topsail Beach
Household Income Brackets in Topsail Beach
With 53 households falling in the category, the $200,000+ income range is the most frequent in Topsail Beach, accounting for 21.6% of all households. In contrast, only 4 households (1.6%) fall into the $15,000 to $24,999 income bracket, making it the least populous group.
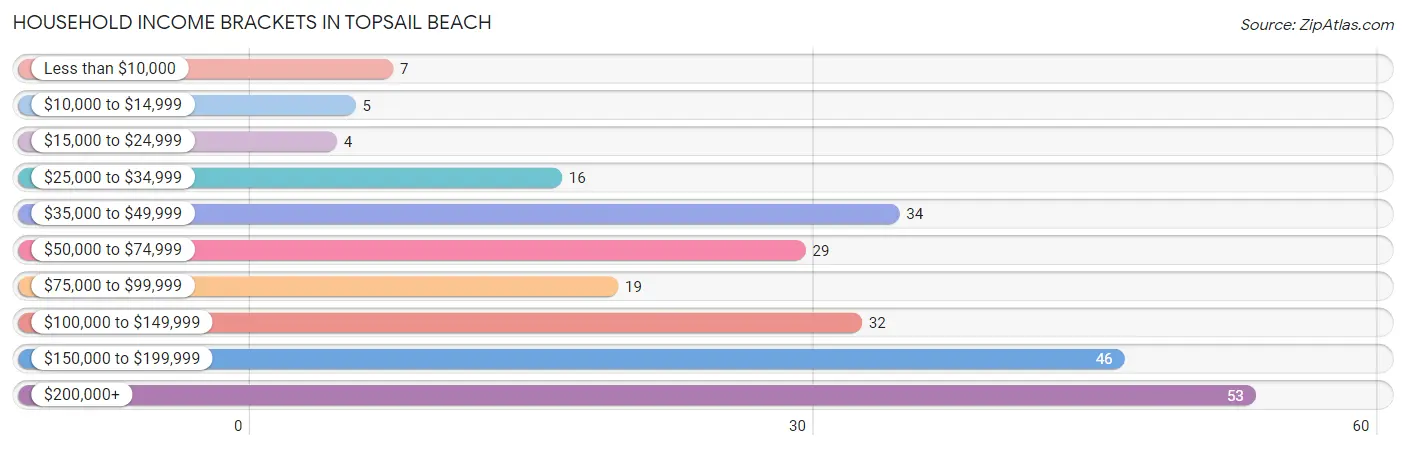
| Income Bracket | # Households | % Households |
| Less than $10,000 | 7 | 2.9% |
| $10,000 to $14,999 | 5 | 2.0% |
| $15,000 to $24,999 | 4 | 1.6% |
| $25,000 to $34,999 | 16 | 6.5% |
| $35,000 to $49,999 | 34 | 13.9% |
| $50,000 to $74,999 | 29 | 11.8% |
| $75,000 to $99,999 | 19 | 7.8% |
| $100,000 to $149,999 | 32 | 13.1% |
| $150,000 to $199,999 | 46 | 18.8% |
| $200,000+ | 53 | 21.6% |
Household Income by Householder Age in Topsail Beach
The median household income in Topsail Beach is $112,708, with the highest median household income of $171,250 found in the 25 to 44 years age bracket for the primary householder. A total of 18 households (7.3%) fall into this category.
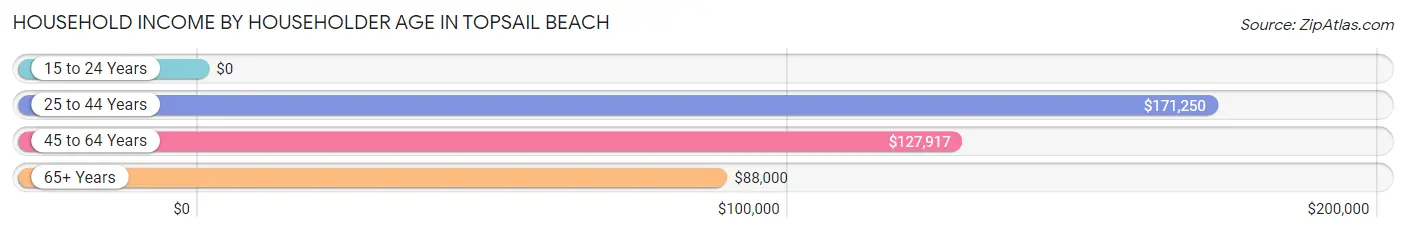
| Income Bracket | # Households | Median Income |
| 15 to 24 Years | 0 (0.0%) | $0 |
| 25 to 44 Years | 18 (7.3%) | $171,250 |
| 45 to 64 Years | 77 (31.4%) | $127,917 |
| 65+ Years | 150 (61.2%) | $88,000 |
| Total | 245 (100.0%) | $112,708 |
Poverty in Topsail Beach
Income Below Poverty by Sex and Age in Topsail Beach
With 5.3% poverty level for males and 10.6% for females among the residents of Topsail Beach, 45 to 54 year old males and 55 to 64 year old females are the most vulnerable to poverty, with 7 males (33.3%) and 16 females (29.6%) in their respective age groups living below the poverty level.
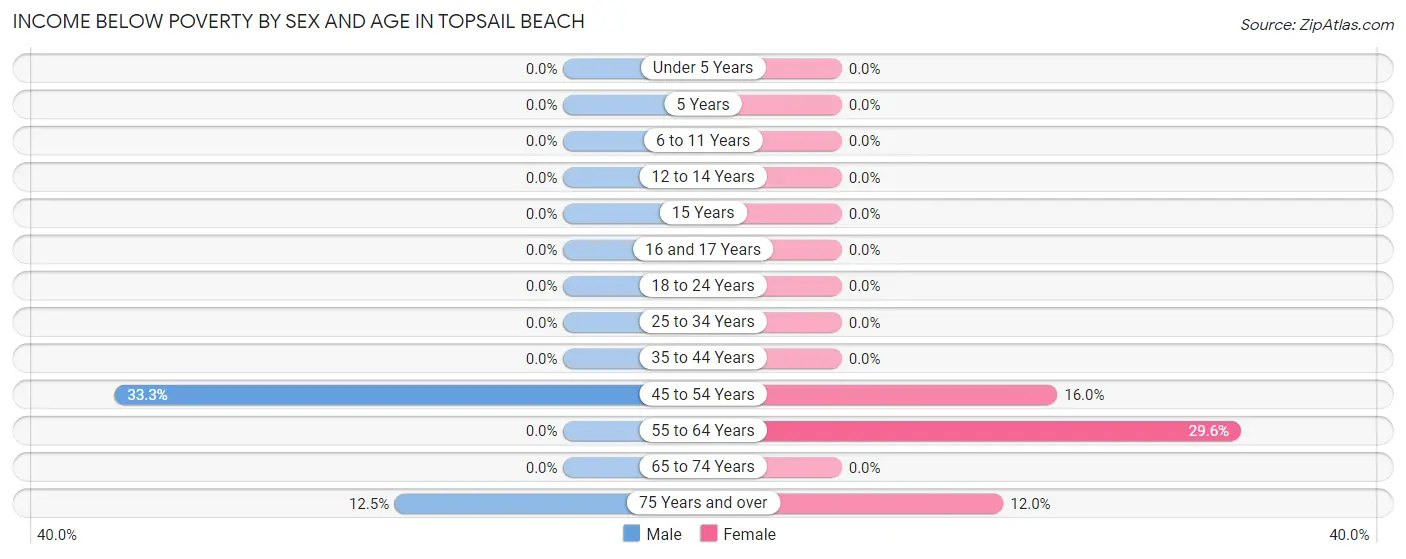
| Age Bracket | Male | Female |
| Under 5 Years | 0 (0.0%) | 0 (0.0%) |
| 5 Years | 0 (0.0%) | 0 (0.0%) |
| 6 to 11 Years | 0 (0.0%) | 0 (0.0%) |
| 12 to 14 Years | 0 (0.0%) | 0 (0.0%) |
| 15 Years | 0 (0.0%) | 0 (0.0%) |
| 16 and 17 Years | 0 (0.0%) | 0 (0.0%) |
| 18 to 24 Years | 0 (0.0%) | 0 (0.0%) |
| 25 to 34 Years | 0 (0.0%) | 0 (0.0%) |
| 35 to 44 Years | 0 (0.0%) | 0 (0.0%) |
| 45 to 54 Years | 7 (33.3%) | 4 (16.0%) |
| 55 to 64 Years | 0 (0.0%) | 16 (29.6%) |
| 65 to 74 Years | 0 (0.0%) | 0 (0.0%) |
| 75 Years and over | 5 (12.5%) | 6 (12.0%) |
| Total | 12 (5.3%) | 26 (10.6%) |
Income Above Poverty by Sex and Age in Topsail Beach
According to the poverty statistics in Topsail Beach, males aged under 5 years and females aged 6 to 11 years are the age groups that are most secure financially, with 100.0% of males and 100.0% of females in these age groups living above the poverty line.
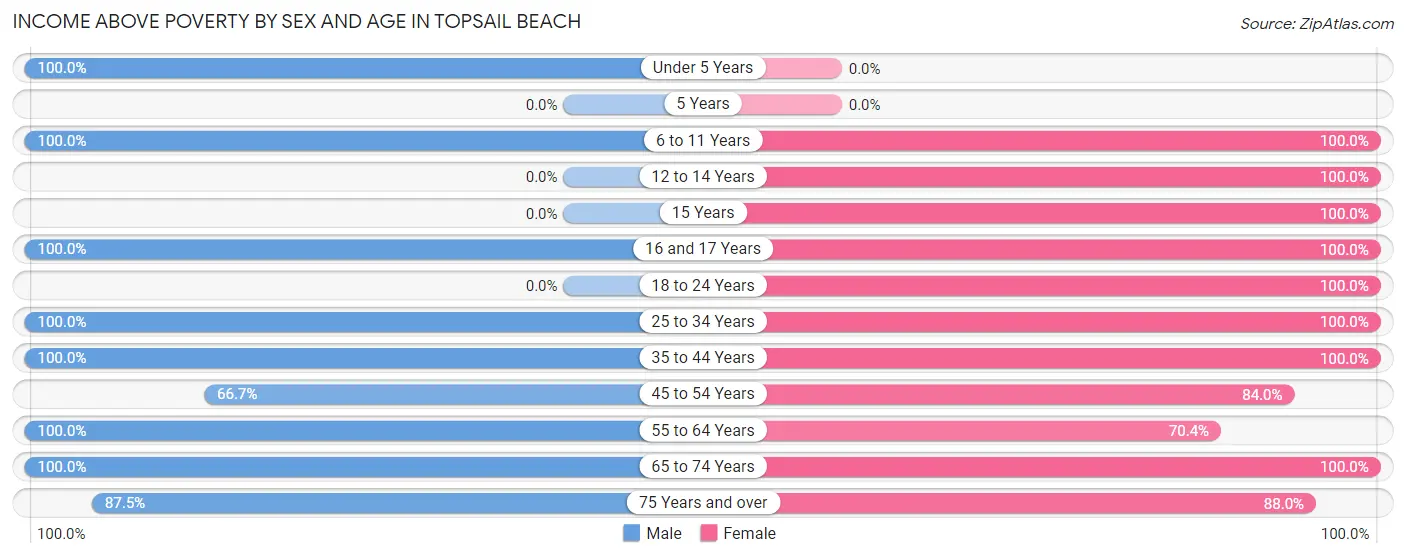
| Age Bracket | Male | Female |
| Under 5 Years | 1 (100.0%) | 0 (0.0%) |
| 5 Years | 0 (0.0%) | 0 (0.0%) |
| 6 to 11 Years | 6 (100.0%) | 10 (100.0%) |
| 12 to 14 Years | 0 (0.0%) | 2 (100.0%) |
| 15 Years | 0 (0.0%) | 2 (100.0%) |
| 16 and 17 Years | 9 (100.0%) | 9 (100.0%) |
| 18 to 24 Years | 0 (0.0%) | 2 (100.0%) |
| 25 to 34 Years | 16 (100.0%) | 2 (100.0%) |
| 35 to 44 Years | 17 (100.0%) | 15 (100.0%) |
| 45 to 54 Years | 14 (66.7%) | 21 (84.0%) |
| 55 to 64 Years | 50 (100.0%) | 38 (70.4%) |
| 65 to 74 Years | 65 (100.0%) | 75 (100.0%) |
| 75 Years and over | 35 (87.5%) | 44 (88.0%) |
| Total | 213 (94.7%) | 220 (89.4%) |
Income Below Poverty Among Married-Couple Families in Topsail Beach
The poverty statistics for married-couple families in Topsail Beach show that 3.5% or 5 of the total 143 families live below the poverty line. Families with no children have the highest poverty rate of 4.1%, comprising of 5 families. On the other hand, families with 1 or 2 children have the lowest poverty rate of 0.0%, which includes 0 families.
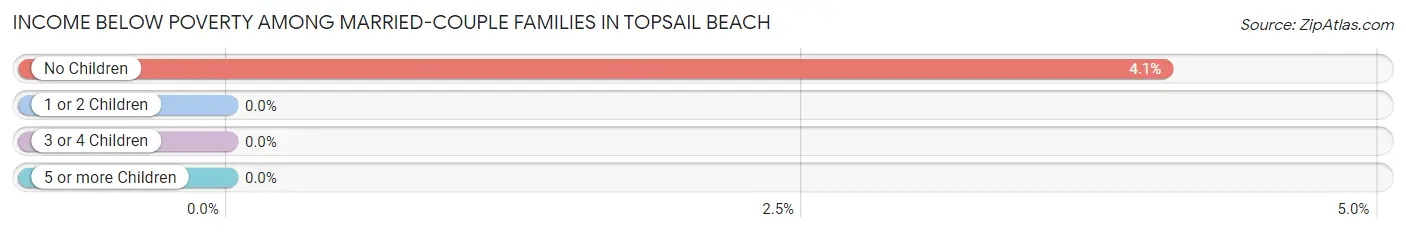
| Children | Above Poverty | Below Poverty |
| No Children | 118 (95.9%) | 5 (4.1%) |
| 1 or 2 Children | 17 (100.0%) | 0 (0.0%) |
| 3 or 4 Children | 3 (100.0%) | 0 (0.0%) |
| 5 or more Children | 0 (0.0%) | 0 (0.0%) |
| Total | 138 (96.5%) | 5 (3.5%) |
Income Below Poverty Among Single-Parent Households in Topsail Beach
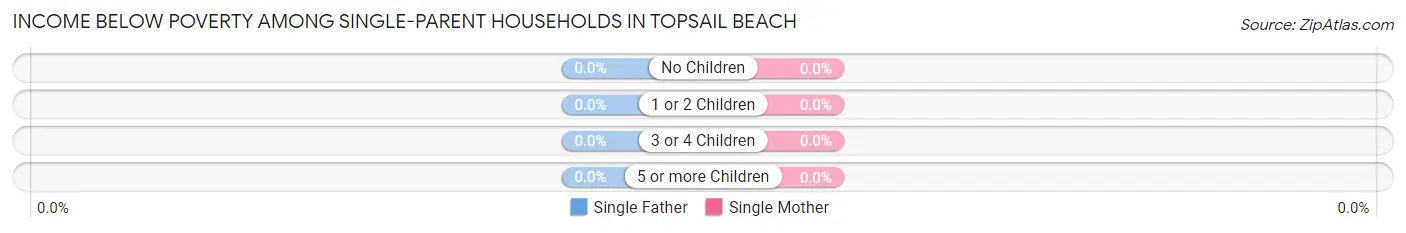
| Children | Single Father | Single Mother |
| No Children | 0 (0.0%) | 0 (0.0%) |
| 1 or 2 Children | 0 (0.0%) | 0 (0.0%) |
| 3 or 4 Children | 0 (0.0%) | 0 (0.0%) |
| 5 or more Children | 0 (0.0%) | 0 (0.0%) |
| Total | 0 (0.0%) | 0 (0.0%) |
Income Below Poverty Among Married-Couple vs Single-Parent Households in Topsail Beach
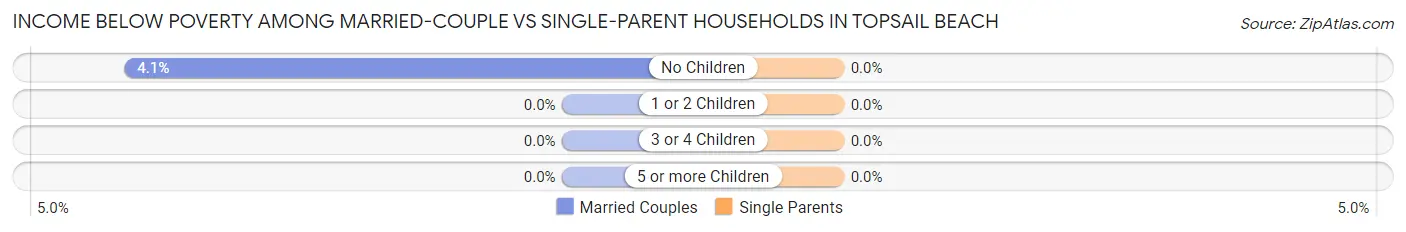
| Children | Married-Couple Families | Single-Parent Households |
| No Children | 5 (4.1%) | 0 (0.0%) |
| 1 or 2 Children | 0 (0.0%) | 0 (0.0%) |
| 3 or 4 Children | 0 (0.0%) | 0 (0.0%) |
| 5 or more Children | 0 (0.0%) | 0 (0.0%) |
| Total | 5 (3.5%) | 0 (0.0%) |
Race in Topsail Beach
The most populous races in Topsail Beach are White / Caucasian (465 | 98.7%), and Two or more Races (6 | 1.3%).
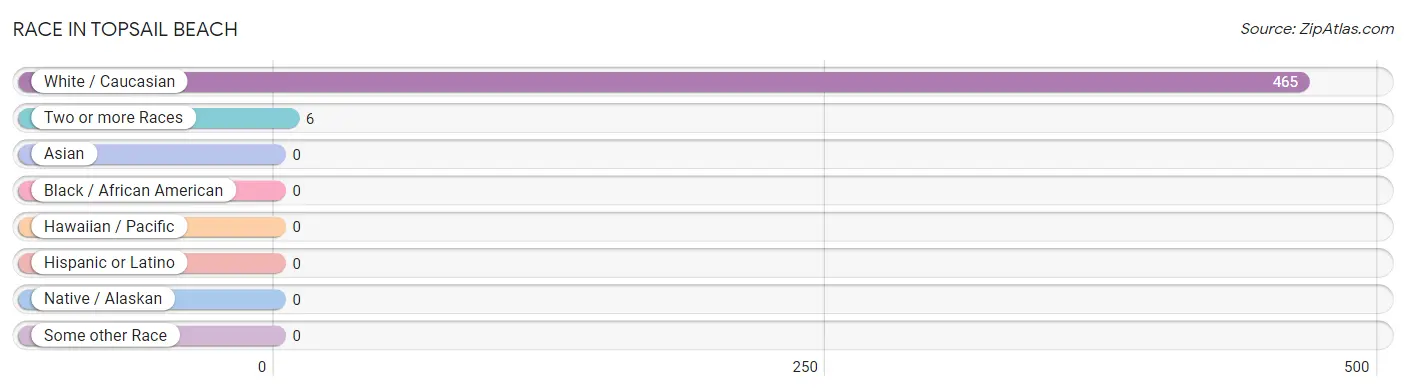
| Race | # Population | % Population |
| Asian | 0 | 0.0% |
| Black / African American | 0 | 0.0% |
| Hawaiian / Pacific | 0 | 0.0% |
| Hispanic or Latino | 0 | 0.0% |
| Native / Alaskan | 0 | 0.0% |
| White / Caucasian | 465 | 98.7% |
| Two or more Races | 6 | 1.3% |
| Some other Race | 0 | 0.0% |
| Total | 471 | 100.0% |
Ancestry in Topsail Beach
The most populous ancestries reported in Topsail Beach are English (112 | 23.8%), German (63 | 13.4%), Irish (53 | 11.3%), Scottish (49 | 10.4%), and Italian (39 | 8.3%), together accounting for 67.1% of all Topsail Beach residents.
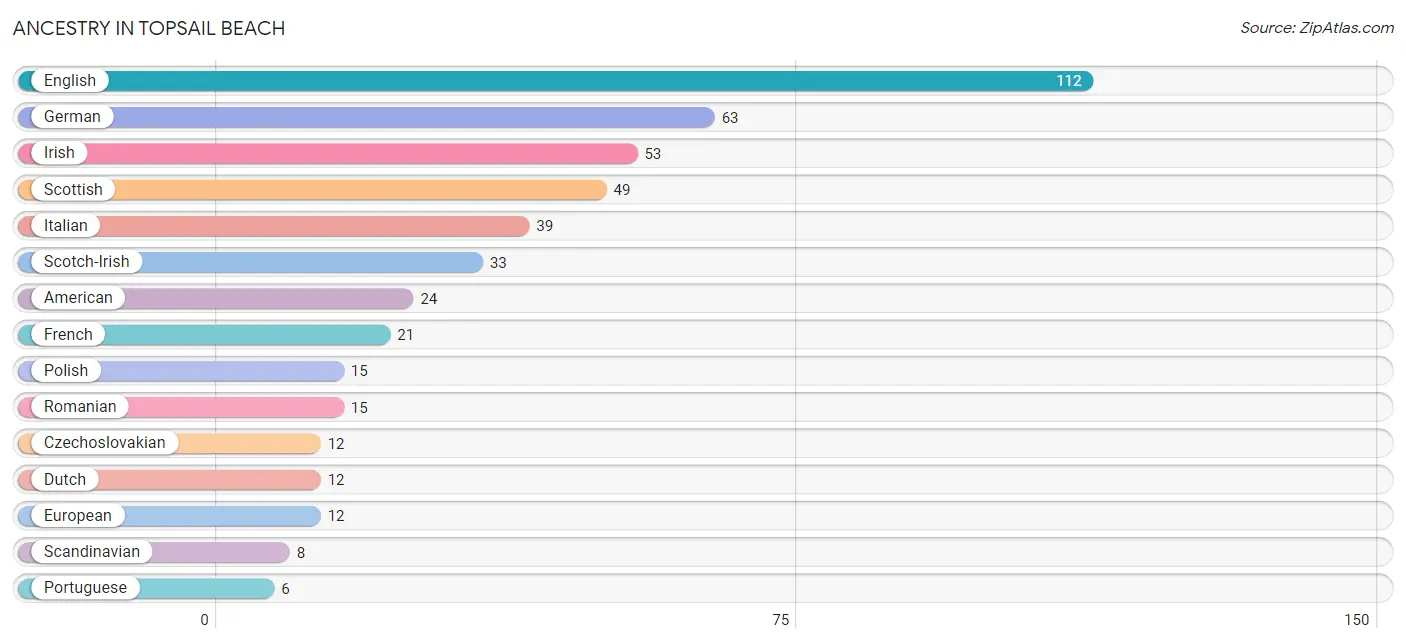
| Ancestry | # Population | % Population |
| American | 24 | 5.1% |
| British | 4 | 0.9% |
| Croatian | 5 | 1.1% |
| Czechoslovakian | 12 | 2.5% |
| Dutch | 12 | 2.5% |
| Eastern European | 2 | 0.4% |
| English | 112 | 23.8% |
| European | 12 | 2.5% |
| French | 21 | 4.5% |
| French Canadian | 4 | 0.9% |
| German | 63 | 13.4% |
| Irish | 53 | 11.3% |
| Italian | 39 | 8.3% |
| Norwegian | 4 | 0.9% |
| Polish | 15 | 3.2% |
| Portuguese | 6 | 1.3% |
| Romanian | 15 | 3.2% |
| Russian | 1 | 0.2% |
| Scandinavian | 8 | 1.7% |
| Scotch-Irish | 33 | 7.0% |
| Scottish | 49 | 10.4% |
| Swedish | 2 | 0.4% |
| Swiss | 3 | 0.6% |
| Welsh | 3 | 0.6% | View All 24 Rows |
Immigrants in Topsail Beach

| Immigration Origin | # Population | % Population | View All 0 Rows |
Sex and Age in Topsail Beach
Sex and Age in Topsail Beach
The most populous age groups in Topsail Beach are 65 to 69 Years (36 | 16.0%) for men and 65 to 69 Years (55 | 22.4%) for women.
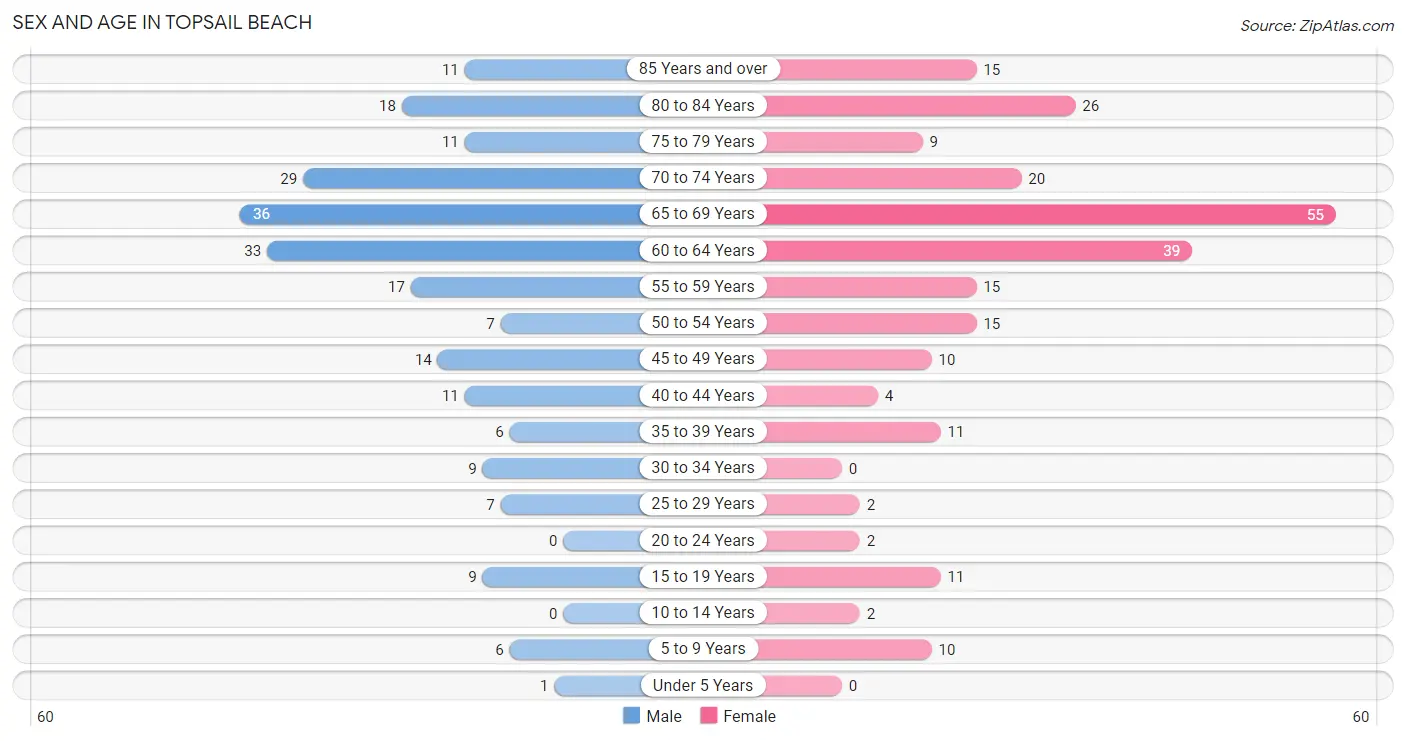
| Age Bracket | Male | Female |
| Under 5 Years | 1 (0.4%) | 0 (0.0%) |
| 5 to 9 Years | 6 (2.7%) | 10 (4.1%) |
| 10 to 14 Years | 0 (0.0%) | 2 (0.8%) |
| 15 to 19 Years | 9 (4.0%) | 11 (4.5%) |
| 20 to 24 Years | 0 (0.0%) | 2 (0.8%) |
| 25 to 29 Years | 7 (3.1%) | 2 (0.8%) |
| 30 to 34 Years | 9 (4.0%) | 0 (0.0%) |
| 35 to 39 Years | 6 (2.7%) | 11 (4.5%) |
| 40 to 44 Years | 11 (4.9%) | 4 (1.6%) |
| 45 to 49 Years | 14 (6.2%) | 10 (4.1%) |
| 50 to 54 Years | 7 (3.1%) | 15 (6.1%) |
| 55 to 59 Years | 17 (7.6%) | 15 (6.1%) |
| 60 to 64 Years | 33 (14.7%) | 39 (15.9%) |
| 65 to 69 Years | 36 (16.0%) | 55 (22.4%) |
| 70 to 74 Years | 29 (12.9%) | 20 (8.1%) |
| 75 to 79 Years | 11 (4.9%) | 9 (3.7%) |
| 80 to 84 Years | 18 (8.0%) | 26 (10.6%) |
| 85 Years and over | 11 (4.9%) | 15 (6.1%) |
| Total | 225 (100.0%) | 246 (100.0%) |
Families and Households in Topsail Beach
Median Family Size in Topsail Beach
The median family size in Topsail Beach is 2.36 persons per family, with single male/father families (3 | 2.0%) accounting for the largest median family size of 3.67 persons per family. On the other hand, married-couple families (143 | 93.5%) represent the smallest median family size with 2.30 persons per family.
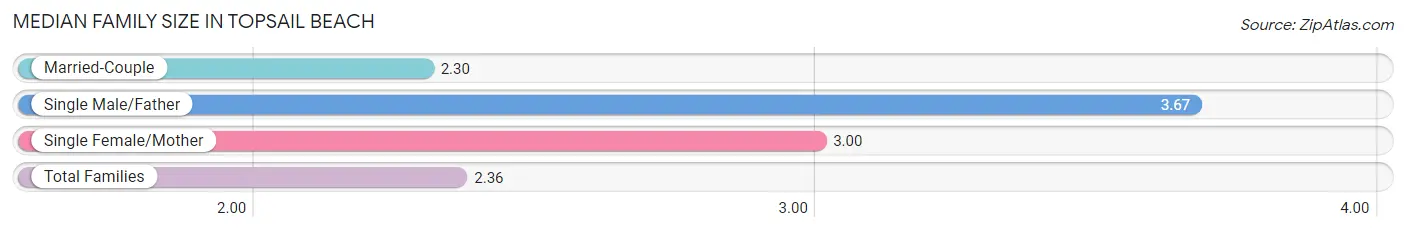
| Family Type | # Families | Family Size |
| Married-Couple | 143 (93.5%) | 2.30 |
| Single Male/Father | 3 (2.0%) | 3.67 |
| Single Female/Mother | 7 (4.6%) | 3.00 |
| Total Families | 153 (100.0%) | 2.36 |
Median Household Size in Topsail Beach
The median household size in Topsail Beach is 1.92 persons per household, with single male/father households (3 | 1.2%) accounting for the largest median household size of 3.67 persons per household. non-family households (92 | 37.6%) represent the smallest median household size with 1.20 persons per household.
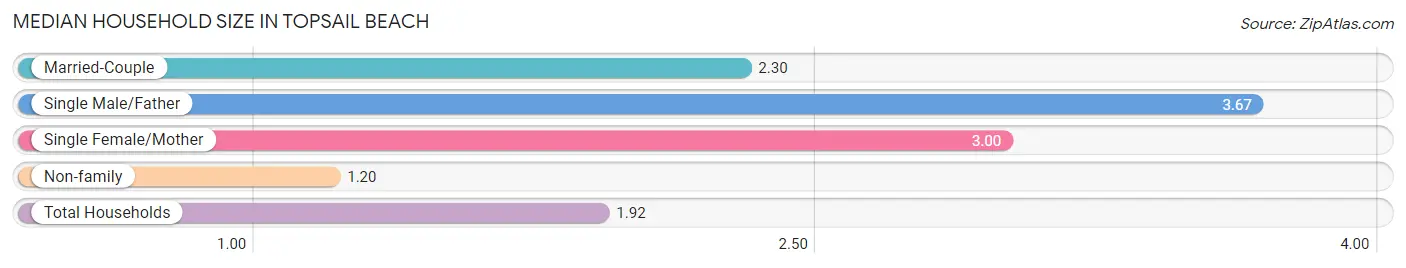
| Household Type | # Households | Household Size |
| Married-Couple | 143 (58.4%) | 2.30 |
| Single Male/Father | 3 (1.2%) | 3.67 |
| Single Female/Mother | 7 (2.9%) | 3.00 |
| Non-family | 92 (37.6%) | 1.20 |
| Total Households | 245 (100.0%) | 1.92 |
Household Size by Marriage Status in Topsail Beach
Out of a total of 245 households in Topsail Beach, 153 (62.5%) are family households, while 92 (37.6%) are nonfamily households. The most numerous type of family households are 2-person households, comprising 126, and the most common type of nonfamily households are 1-person households, comprising 79.
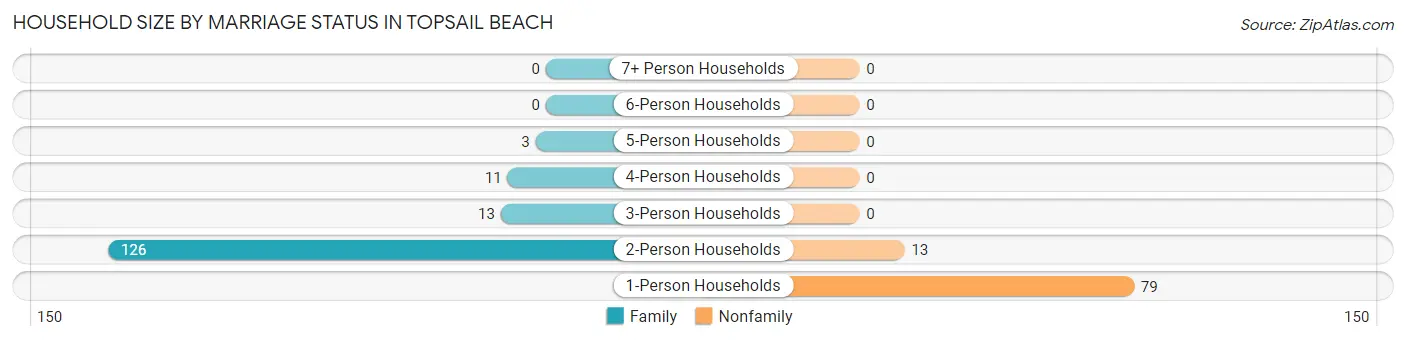
| Household Size | Family Households | Nonfamily Households |
| 1-Person Households | - | 79 (32.2%) |
| 2-Person Households | 126 (51.4%) | 13 (5.3%) |
| 3-Person Households | 13 (5.3%) | 0 (0.0%) |
| 4-Person Households | 11 (4.5%) | 0 (0.0%) |
| 5-Person Households | 3 (1.2%) | 0 (0.0%) |
| 6-Person Households | 0 (0.0%) | 0 (0.0%) |
| 7+ Person Households | 0 (0.0%) | 0 (0.0%) |
| Total | 153 (62.5%) | 92 (37.6%) |
Female Fertility in Topsail Beach
Fertility by Age in Topsail Beach
| Age Bracket | Women with Births | Births / 1,000 Women |
| 15 to 19 years | 0 (0.0%) | 0.0 |
| 20 to 34 years | 0 (0.0%) | 0.0 |
| 35 to 50 years | 0 (0.0%) | 0.0 |
| Total | 0 (0.0%) | 0.0 |
Fertility by Age by Marriage Status in Topsail Beach
| Age Bracket | Married | Unmarried |
| 15 to 19 years | 0 (0.0%) | 0 (0.0%) |
| 20 to 34 years | 0 (0.0%) | 0 (0.0%) |
| 35 to 50 years | 0 (0.0%) | 0 (0.0%) |
| Total | 0 (0.0%) | 0 (0.0%) |
Fertility by Education in Topsail Beach
| Educational Attainment | Women with Births | Births / 1,000 Women |
| Less than High School | 0 (0.0%) | 0.0 |
| High School Diploma | 0 (0.0%) | 0.0 |
| College or Associate's Degree | 0 (0.0%) | 0.0 |
| Bachelor's Degree | 0 (0.0%) | 0.0 |
| Graduate Degree | 0 (0.0%) | 0.0 |
| Total | 0 (0.0%) | 0.0 |
Fertility by Education by Marriage Status in Topsail Beach
| Educational Attainment | Married | Unmarried |
| Less than High School | 0 (0.0%) | 0 (0.0%) |
| High School Diploma | 0 (0.0%) | 0 (0.0%) |
| College or Associate's Degree | 0 (0.0%) | 0 (0.0%) |
| Bachelor's Degree | 0 (0.0%) | 0 (0.0%) |
| Graduate Degree | 0 (0.0%) | 0 (0.0%) |
| Total | 0 (0.0%) | 0 (0.0%) |
Employment Characteristics in Topsail Beach
Employment by Class of Employer in Topsail Beach
Among the 191 employed individuals in Topsail Beach, private company employees (95 | 49.7%), self-employed (not incorporated) (31 | 16.2%), and self-employed (incorporated) (29 | 15.2%) make up the most common classes of employment.
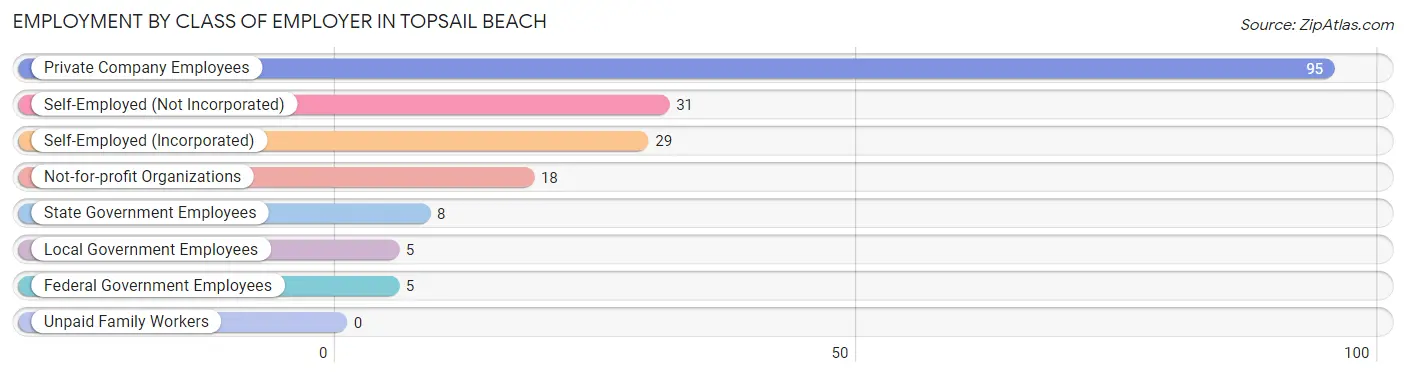
| Employer Class | # Employees | % Employees |
| Private Company Employees | 95 | 49.7% |
| Self-Employed (Incorporated) | 29 | 15.2% |
| Self-Employed (Not Incorporated) | 31 | 16.2% |
| Not-for-profit Organizations | 18 | 9.4% |
| Local Government Employees | 5 | 2.6% |
| State Government Employees | 8 | 4.2% |
| Federal Government Employees | 5 | 2.6% |
| Unpaid Family Workers | 0 | 0.0% |
| Total | 191 | 100.0% |
Employment Status by Age in Topsail Beach
According to the labor force statistics for Topsail Beach, out of the total population over 16 years of age (450), 43.8% or 197 individuals are in the labor force, with 2.5% or 5 of them unemployed. The age group with the highest labor force participation rate is 20 to 24 years, with 100.0% or 2 individuals in the labor force. Within the labor force, the 75 years and over age range has the highest percentage of unemployed individuals, with 11.1% or 1 of them being unemployed.
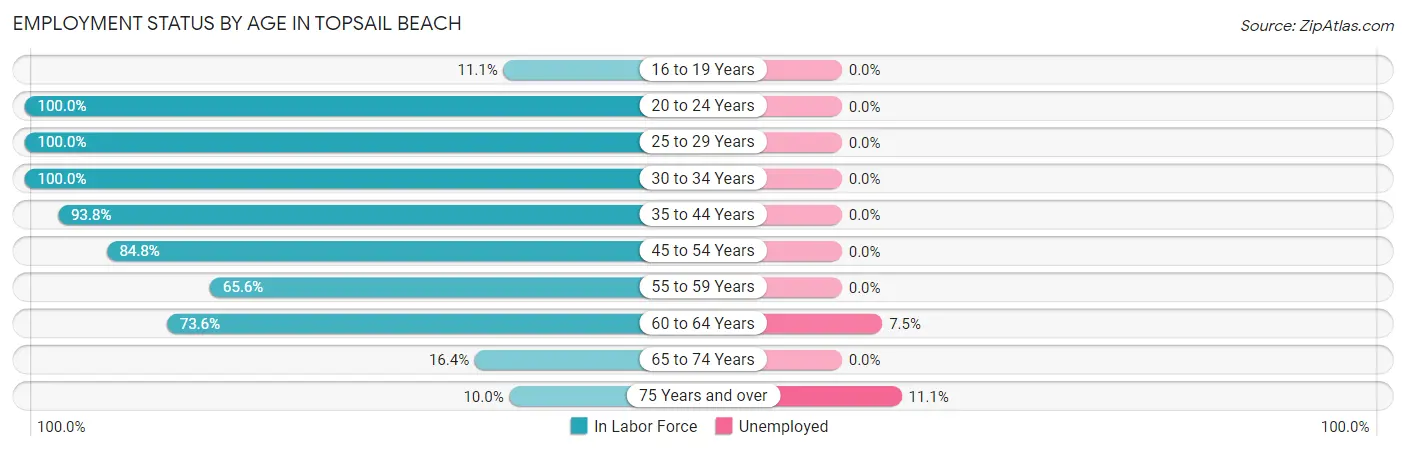
| Age Bracket | In Labor Force | Unemployed |
| 16 to 19 Years | 2 (11.1%) | 0 (0.0%) |
| 20 to 24 Years | 2 (100.0%) | 0 (0.0%) |
| 25 to 29 Years | 9 (100.0%) | 0 (0.0%) |
| 30 to 34 Years | 9 (100.0%) | 0 (0.0%) |
| 35 to 44 Years | 30 (93.8%) | 0 (0.0%) |
| 45 to 54 Years | 39 (84.8%) | 0 (0.0%) |
| 55 to 59 Years | 21 (65.6%) | 0 (0.0%) |
| 60 to 64 Years | 53 (73.6%) | 4 (7.5%) |
| 65 to 74 Years | 23 (16.4%) | 0 (0.0%) |
| 75 Years and over | 9 (10.0%) | 1 (11.1%) |
| Total | 197 (43.8%) | 5 (2.5%) |
Employment Status by Educational Attainment in Topsail Beach
According to labor force statistics for Topsail Beach, 80.5% of individuals (161) out of the total population between 25 and 64 years of age (200) are in the labor force, with 2.5% or 4 of them being unemployed. The group with the highest labor force participation rate are those with the educational attainment of college / associate degree, with 100.0% or 33 individuals in the labor force. Within the labor force, individuals with bachelor's degree or higher education have the highest percentage of unemployment, with 4.4% or 4 of them being unemployed.
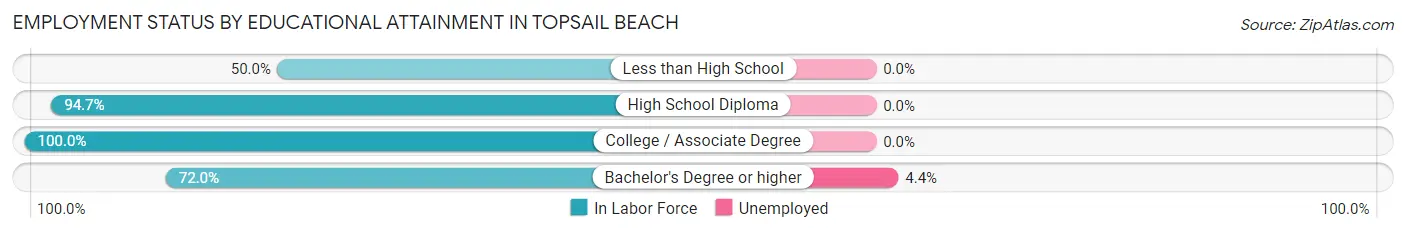
| Educational Attainment | In Labor Force | Unemployed |
| Less than High School | 2 (50.0%) | 0 (0.0%) |
| High School Diploma | 36 (94.7%) | 0 (0.0%) |
| College / Associate Degree | 33 (100.0%) | 0 (0.0%) |
| Bachelor's Degree or higher | 90 (72.0%) | 6 (4.4%) |
| Total | 161 (80.5%) | 5 (2.5%) |
Employment Occupations by Sex in Topsail Beach
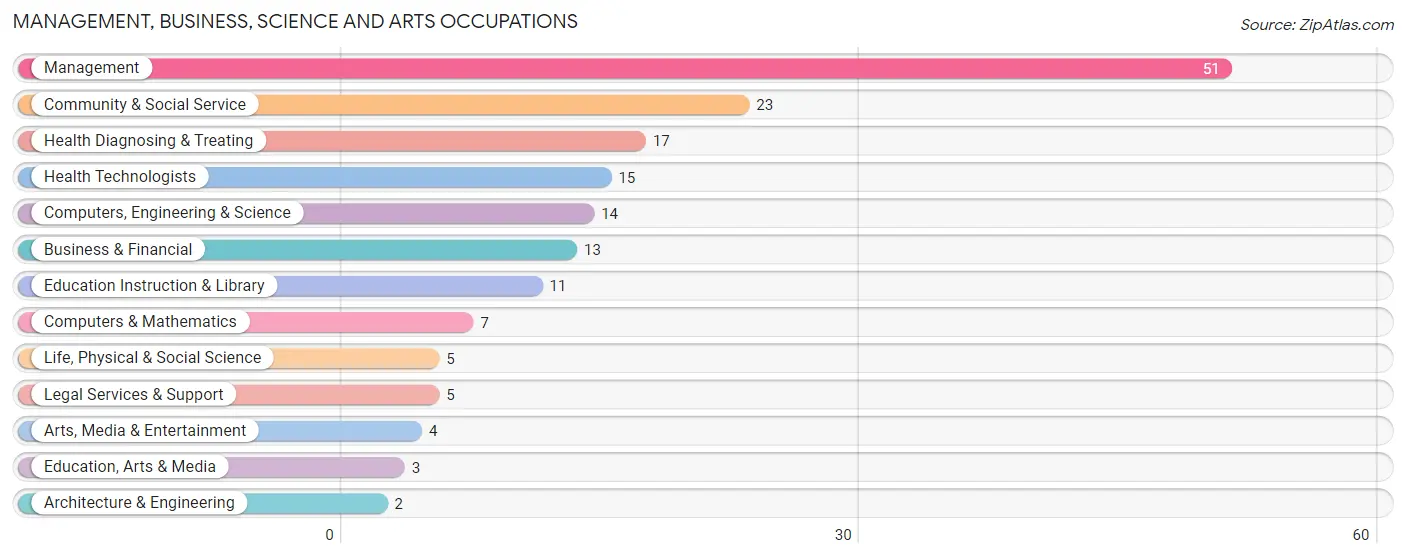
Management, Business, Science and Arts Occupations
The most common Management, Business, Science and Arts occupations in Topsail Beach are Management (51 | 26.6%), Community & Social Service (23 | 12.0%), Health Diagnosing & Treating (17 | 8.8%), Health Technologists (15 | 7.8%), and Computers, Engineering & Science (14 | 7.3%).
Management, Business, Science and Arts Occupations by Sex
Within the Management, Business, Science and Arts occupations in Topsail Beach, the most male-oriented occupations are Architecture & Engineering (100.0%), Legal Services & Support (100.0%), and Education Instruction & Library (81.8%), while the most female-oriented occupations are Life, Physical & Social Science (100.0%), Education, Arts & Media (100.0%), and Arts, Media & Entertainment (100.0%).
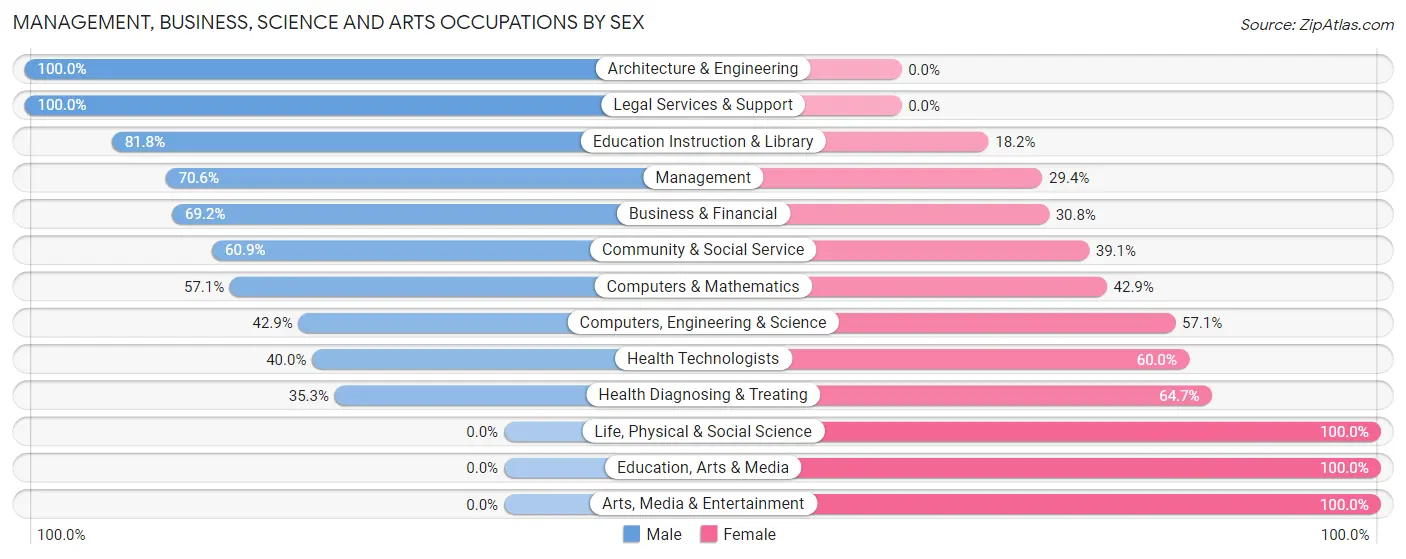
| Occupation | Male | Female |
| Management | 36 (70.6%) | 15 (29.4%) |
| Business & Financial | 9 (69.2%) | 4 (30.8%) |
| Computers, Engineering & Science | 6 (42.9%) | 8 (57.1%) |
| Computers & Mathematics | 4 (57.1%) | 3 (42.9%) |
| Architecture & Engineering | 2 (100.0%) | 0 (0.0%) |
| Life, Physical & Social Science | 0 (0.0%) | 5 (100.0%) |
| Community & Social Service | 14 (60.9%) | 9 (39.1%) |
| Education, Arts & Media | 0 (0.0%) | 3 (100.0%) |
| Legal Services & Support | 5 (100.0%) | 0 (0.0%) |
| Education Instruction & Library | 9 (81.8%) | 2 (18.2%) |
| Arts, Media & Entertainment | 0 (0.0%) | 4 (100.0%) |
| Health Diagnosing & Treating | 6 (35.3%) | 11 (64.7%) |
| Health Technologists | 6 (40.0%) | 9 (60.0%) |
| Total (Category) | 71 (60.2%) | 47 (39.8%) |
| Total (Overall) | 114 (59.4%) | 78 (40.6%) |
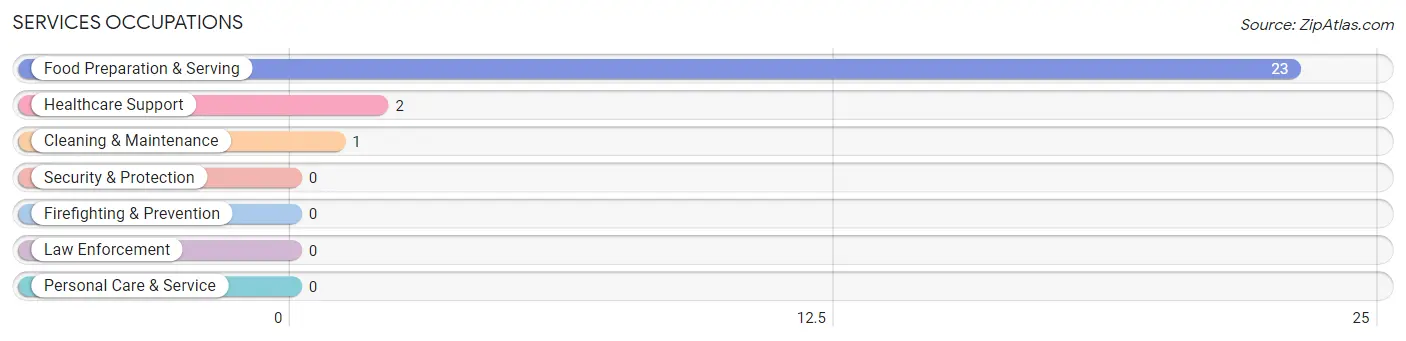
Services Occupations
The most common Services occupations in Topsail Beach are Food Preparation & Serving (23 | 12.0%), Healthcare Support (2 | 1.0%), and Cleaning & Maintenance (1 | 0.5%).
Services Occupations by Sex
Within the Services occupations in Topsail Beach, the most male-oriented occupations are Cleaning & Maintenance (100.0%), and Food Preparation & Serving (34.8%), while the most female-oriented occupations are Healthcare Support (100.0%), and Food Preparation & Serving (65.2%).
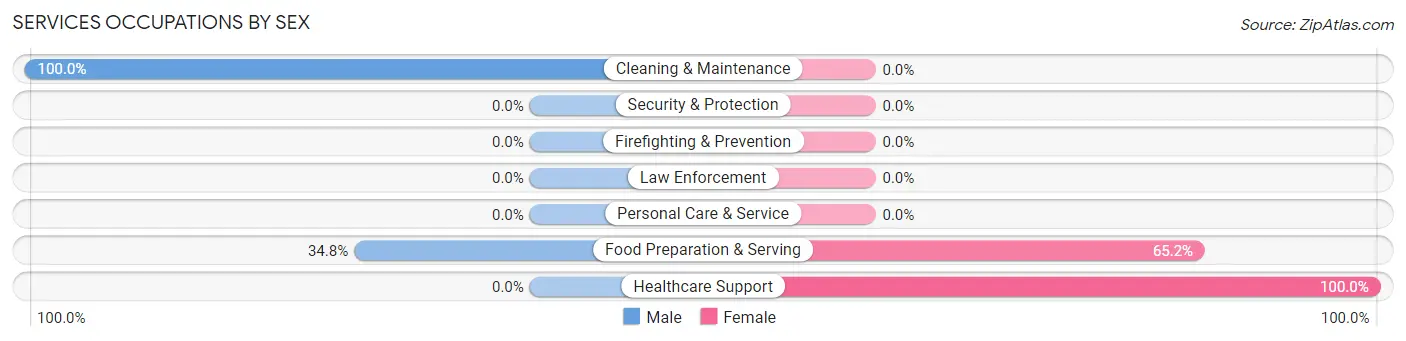
| Occupation | Male | Female |
| Healthcare Support | 0 (0.0%) | 2 (100.0%) |
| Security & Protection | 0 (0.0%) | 0 (0.0%) |
| Firefighting & Prevention | 0 (0.0%) | 0 (0.0%) |
| Law Enforcement | 0 (0.0%) | 0 (0.0%) |
| Food Preparation & Serving | 8 (34.8%) | 15 (65.2%) |
| Cleaning & Maintenance | 1 (100.0%) | 0 (0.0%) |
| Personal Care & Service | 0 (0.0%) | 0 (0.0%) |
| Total (Category) | 9 (34.6%) | 17 (65.4%) |
| Total (Overall) | 114 (59.4%) | 78 (40.6%) |
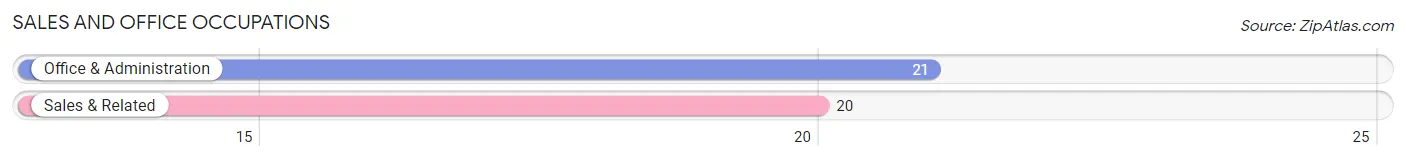
Sales and Office Occupations
The most common Sales and Office occupations in Topsail Beach are Office & Administration (21 | 10.9%), and Sales & Related (20 | 10.4%).
Sales and Office Occupations by Sex
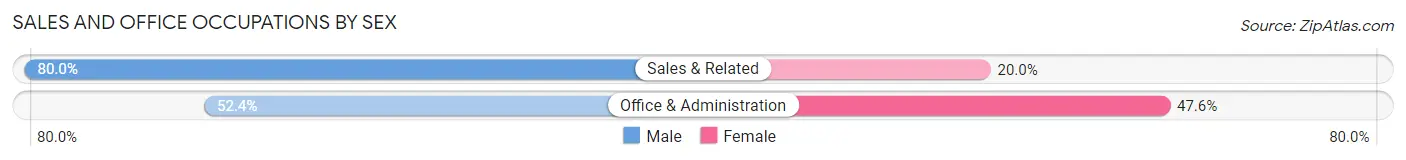
| Occupation | Male | Female |
| Sales & Related | 16 (80.0%) | 4 (20.0%) |
| Office & Administration | 11 (52.4%) | 10 (47.6%) |
| Total (Category) | 27 (65.8%) | 14 (34.2%) |
| Total (Overall) | 114 (59.4%) | 78 (40.6%) |
Natural Resources, Construction and Maintenance Occupations
The most common Natural Resources, Construction and Maintenance occupations in Topsail Beach are , and Construction & Extraction (7 | 3.6%).
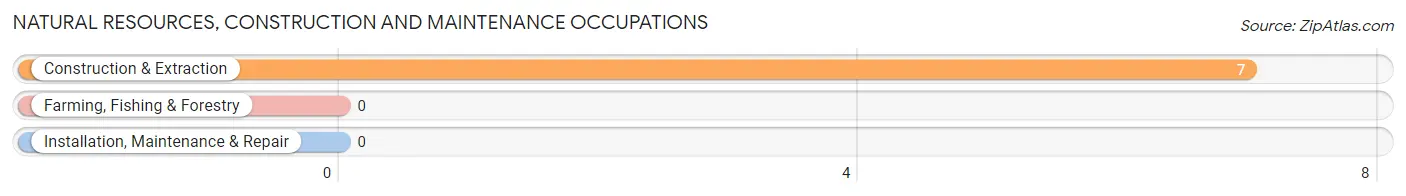
Natural Resources, Construction and Maintenance Occupations by Sex
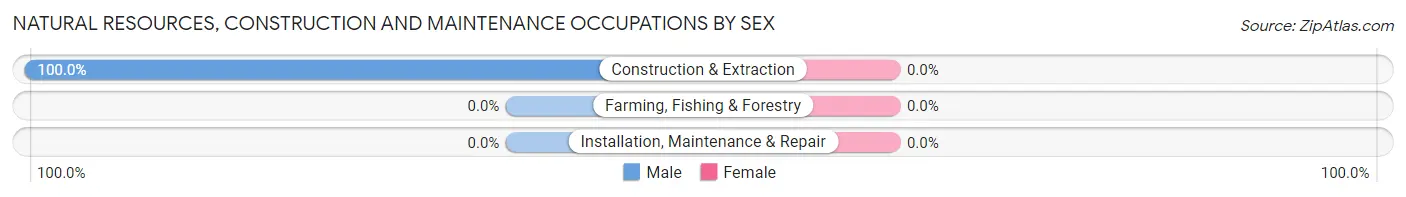
| Occupation | Male | Female |
| Farming, Fishing & Forestry | 0 (0.0%) | 0 (0.0%) |
| Construction & Extraction | 7 (100.0%) | 0 (0.0%) |
| Installation, Maintenance & Repair | 0 (0.0%) | 0 (0.0%) |
| Total (Category) | 7 (100.0%) | 0 (0.0%) |
| Total (Overall) | 114 (59.4%) | 78 (40.6%) |
Production, Transportation and Moving Occupations
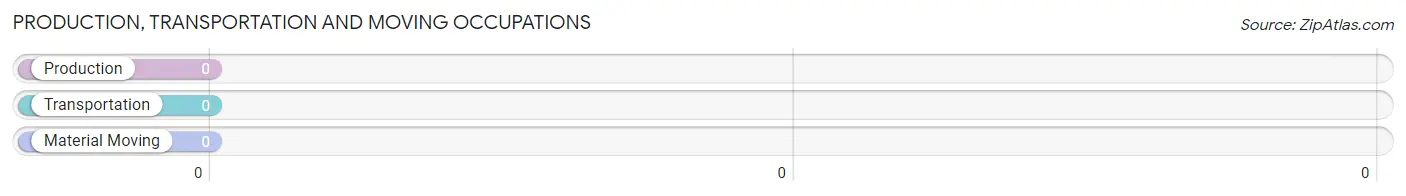
Production, Transportation and Moving Occupations by Sex
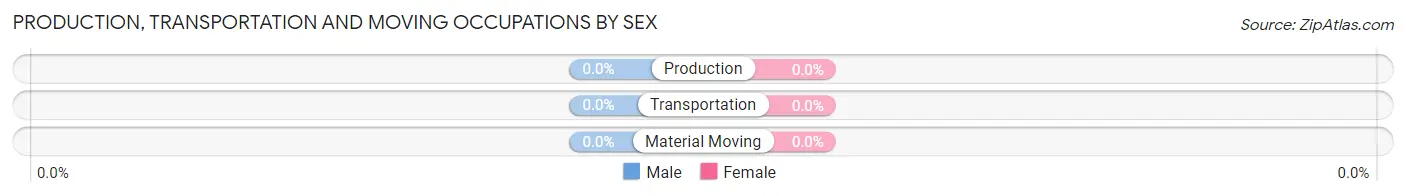
| Occupation | Male | Female |
| Production | 0 (0.0%) | 0 (0.0%) |
| Transportation | 0 (0.0%) | 0 (0.0%) |
| Material Moving | 0 (0.0%) | 0 (0.0%) |
| Total (Category) | 0 (0.0%) | 0 (0.0%) |
| Total (Overall) | 114 (59.4%) | 78 (40.6%) |
Employment Industries by Sex in Topsail Beach
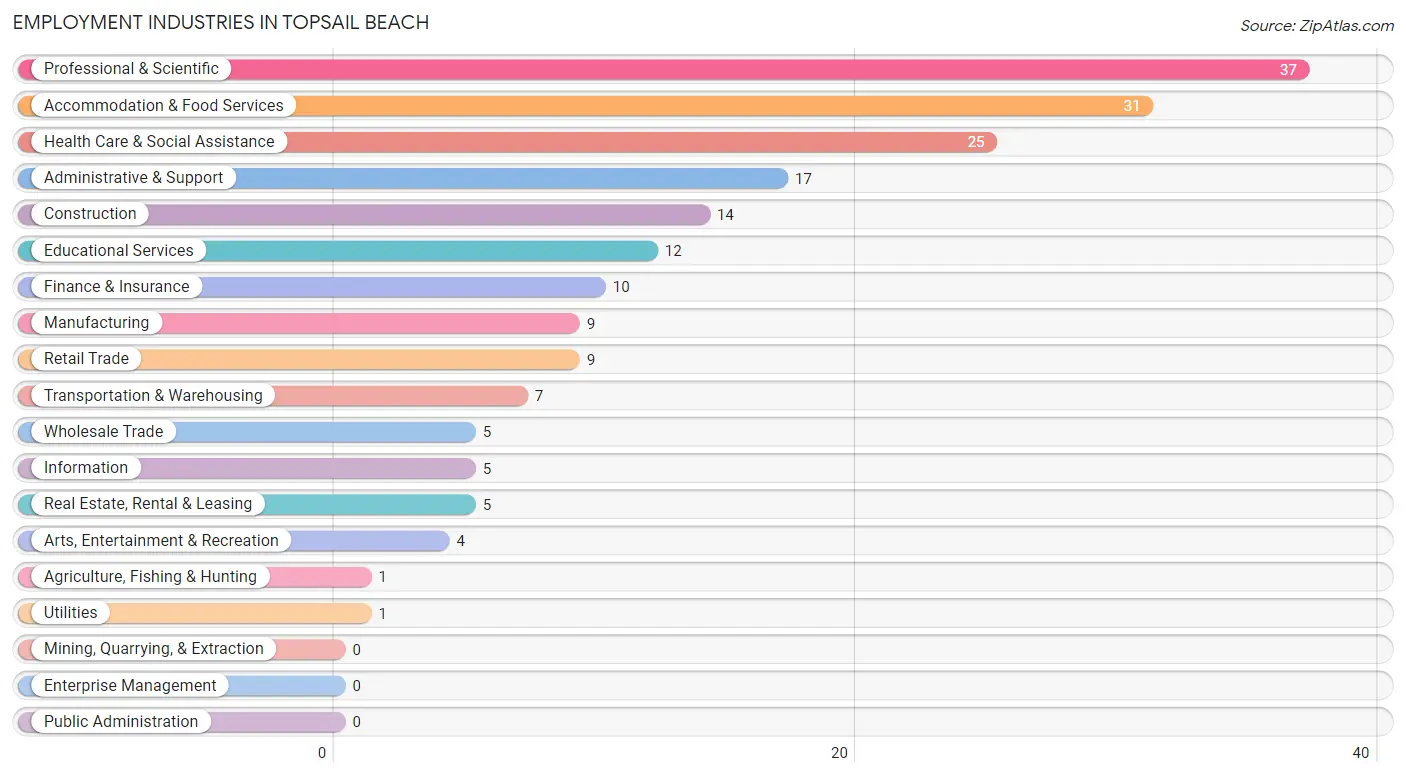
Employment Industries in Topsail Beach
The major employment industries in Topsail Beach include Professional & Scientific (37 | 19.3%), Accommodation & Food Services (31 | 16.2%), Health Care & Social Assistance (25 | 13.0%), Administrative & Support (17 | 8.8%), and Construction (14 | 7.3%).
Employment Industries by Sex in Topsail Beach
The Topsail Beach industries that see more men than women are Agriculture, Fishing & Hunting (100.0%), Wholesale Trade (100.0%), and Information (100.0%), whereas the industries that tend to have a higher number of women are Transportation & Warehousing (100.0%), Utilities (100.0%), and Arts, Entertainment & Recreation (100.0%).
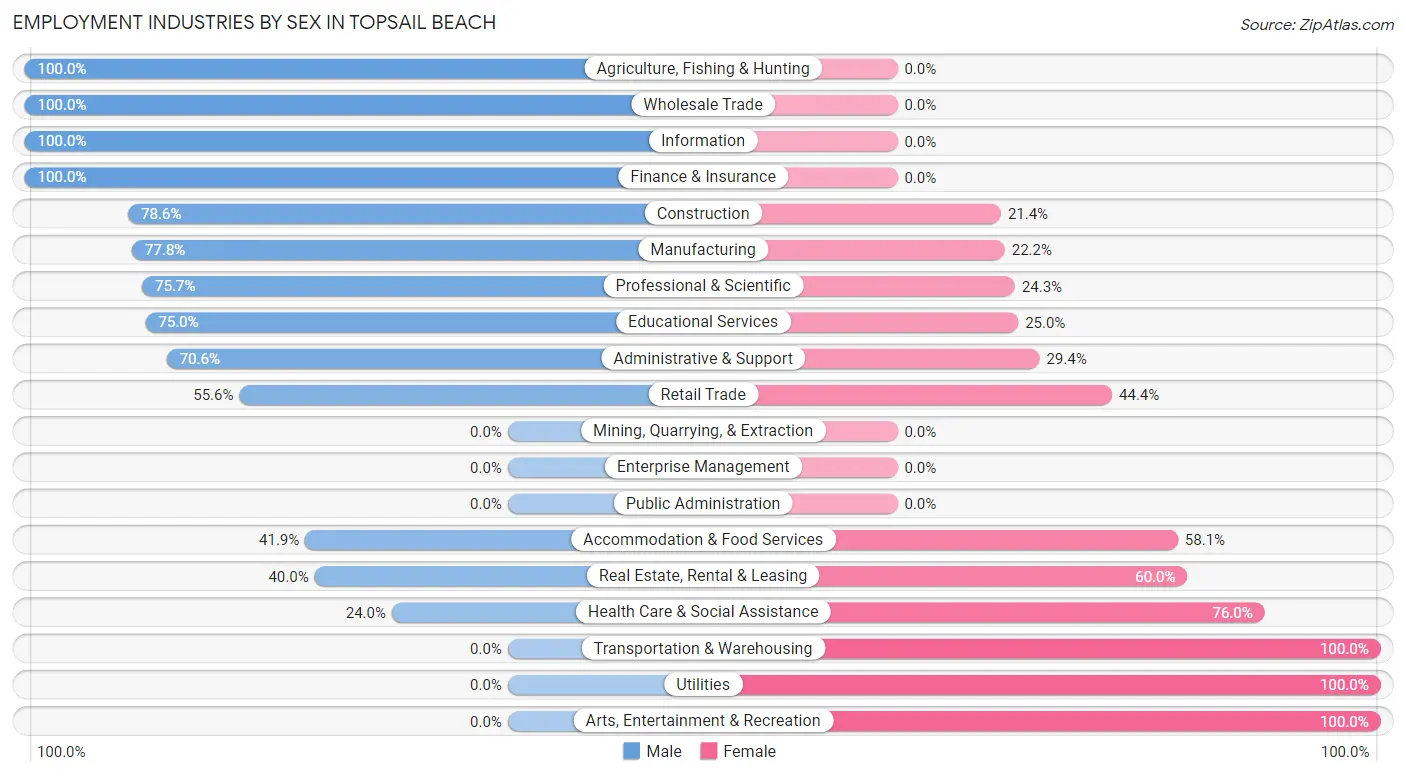
| Industry | Male | Female |
| Agriculture, Fishing & Hunting | 1 (100.0%) | 0 (0.0%) |
| Mining, Quarrying, & Extraction | 0 (0.0%) | 0 (0.0%) |
| Construction | 11 (78.6%) | 3 (21.4%) |
| Manufacturing | 7 (77.8%) | 2 (22.2%) |
| Wholesale Trade | 5 (100.0%) | 0 (0.0%) |
| Retail Trade | 5 (55.6%) | 4 (44.4%) |
| Transportation & Warehousing | 0 (0.0%) | 7 (100.0%) |
| Utilities | 0 (0.0%) | 1 (100.0%) |
| Information | 5 (100.0%) | 0 (0.0%) |
| Finance & Insurance | 10 (100.0%) | 0 (0.0%) |
| Real Estate, Rental & Leasing | 2 (40.0%) | 3 (60.0%) |
| Professional & Scientific | 28 (75.7%) | 9 (24.3%) |
| Enterprise Management | 0 (0.0%) | 0 (0.0%) |
| Administrative & Support | 12 (70.6%) | 5 (29.4%) |
| Educational Services | 9 (75.0%) | 3 (25.0%) |
| Health Care & Social Assistance | 6 (24.0%) | 19 (76.0%) |
| Arts, Entertainment & Recreation | 0 (0.0%) | 4 (100.0%) |
| Accommodation & Food Services | 13 (41.9%) | 18 (58.1%) |
| Public Administration | 0 (0.0%) | 0 (0.0%) |
| Total | 114 (59.4%) | 78 (40.6%) |
Education in Topsail Beach
School Enrollment in Topsail Beach
The most common levels of schooling among the 45 students in Topsail Beach are high school (22 | 48.9%), elementary school (14 | 31.1%), and college / undergraduate (7 | 15.6%).
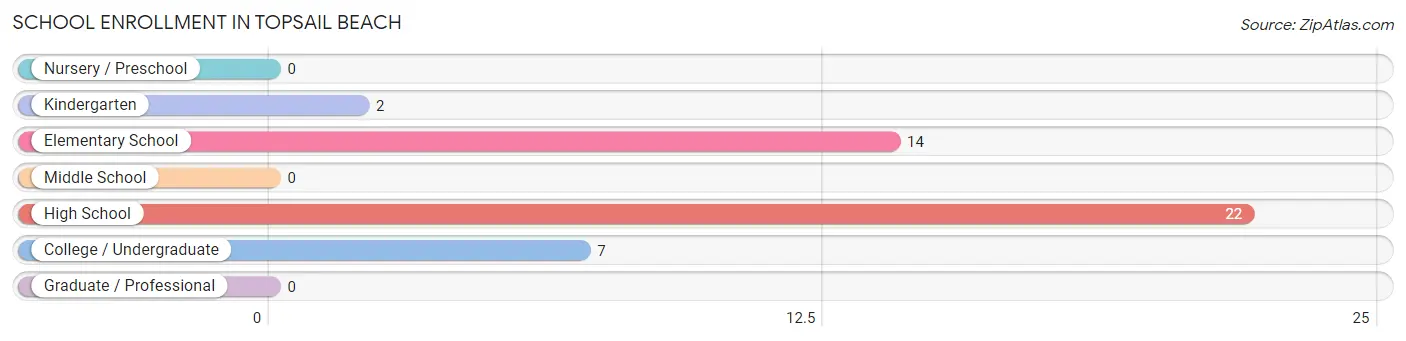
| School Level | # Students | % Students |
| Nursery / Preschool | 0 | 0.0% |
| Kindergarten | 2 | 4.4% |
| Elementary School | 14 | 31.1% |
| Middle School | 0 | 0.0% |
| High School | 22 | 48.9% |
| College / Undergraduate | 7 | 15.6% |
| Graduate / Professional | 0 | 0.0% |
| Total | 45 | 100.0% |
School Enrollment by Age by Funding Source in Topsail Beach
Out of a total of 45 students who are enrolled in schools in Topsail Beach, 16 (35.6%) attend a private institution, while the remaining 29 (64.4%) are enrolled in public schools. The age group of 35 years and over has the highest likelihood of being enrolled in private schools, with 7 (100.0% in the age bracket) enrolled. Conversely, the age group of 5 to 9 year old has the lowest likelihood of being enrolled in a private school, with 16 (100.0% in the age bracket) attending a public institution.
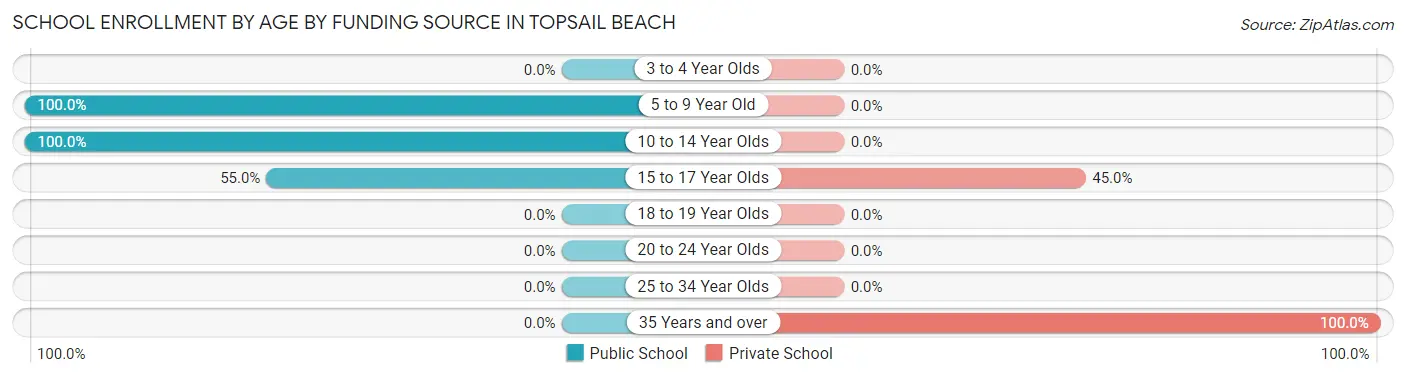
| Age Bracket | Public School | Private School |
| 3 to 4 Year Olds | 0 (0.0%) | 0 (0.0%) |
| 5 to 9 Year Old | 16 (100.0%) | 0 (0.0%) |
| 10 to 14 Year Olds | 2 (100.0%) | 0 (0.0%) |
| 15 to 17 Year Olds | 11 (55.0%) | 9 (45.0%) |
| 18 to 19 Year Olds | 0 (0.0%) | 0 (0.0%) |
| 20 to 24 Year Olds | 0 (0.0%) | 0 (0.0%) |
| 25 to 34 Year Olds | 0 (0.0%) | 0 (0.0%) |
| 35 Years and over | 0 (0.0%) | 7 (100.0%) |
| Total | 29 (64.4%) | 16 (35.6%) |
Educational Attainment by Field of Study in Topsail Beach
Business (42 | 14.4%), education (37 | 12.7%), computers & mathematics (33 | 11.3%), social sciences (31 | 10.6%), and bio, nature & agricultural (24 | 8.3%) are the most common fields of study among 291 individuals in Topsail Beach who have obtained a bachelor's degree or higher.
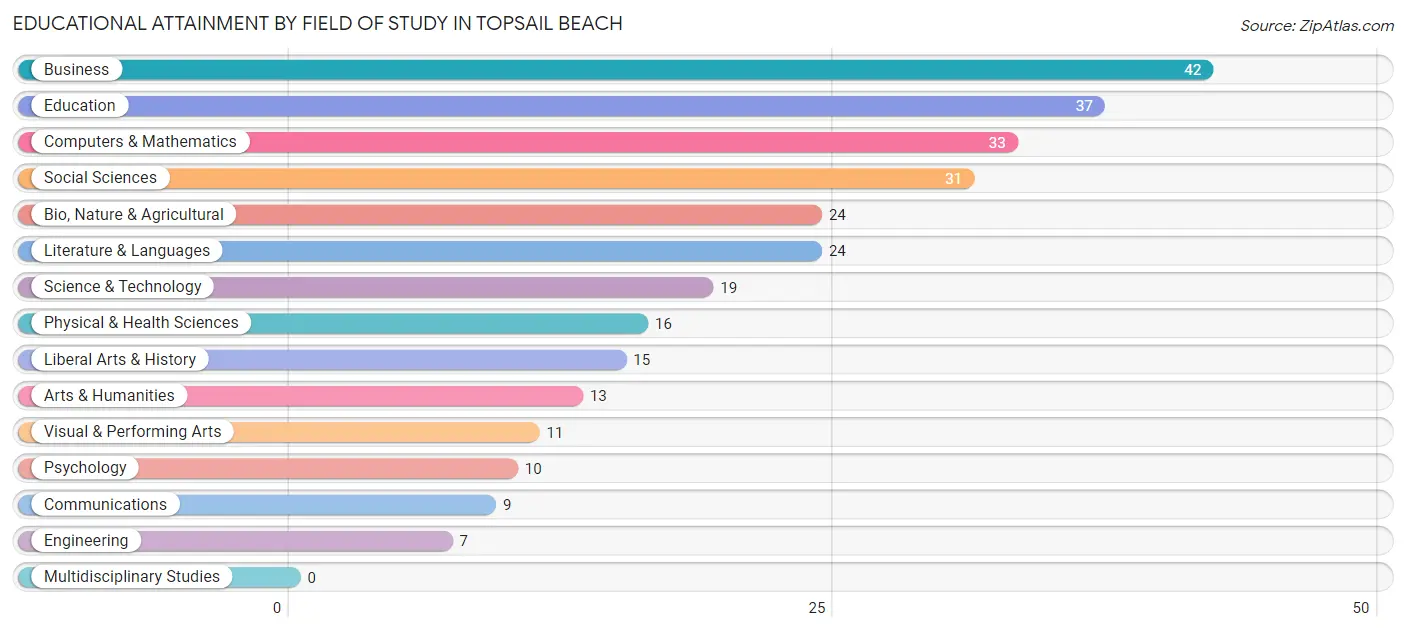
| Field of Study | # Graduates | % Graduates |
| Computers & Mathematics | 33 | 11.3% |
| Bio, Nature & Agricultural | 24 | 8.3% |
| Physical & Health Sciences | 16 | 5.5% |
| Psychology | 10 | 3.4% |
| Social Sciences | 31 | 10.6% |
| Engineering | 7 | 2.4% |
| Multidisciplinary Studies | 0 | 0.0% |
| Science & Technology | 19 | 6.5% |
| Business | 42 | 14.4% |
| Education | 37 | 12.7% |
| Literature & Languages | 24 | 8.3% |
| Liberal Arts & History | 15 | 5.1% |
| Visual & Performing Arts | 11 | 3.8% |
| Communications | 9 | 3.1% |
| Arts & Humanities | 13 | 4.5% |
| Total | 291 | 100.0% |
Transportation & Commute in Topsail Beach
Vehicle Availability by Sex in Topsail Beach
The most prevalent vehicle ownership categories in Topsail Beach are males with 2 vehicles (56, accounting for 49.1%) and females with 2 vehicles (41, making up 72.7%).
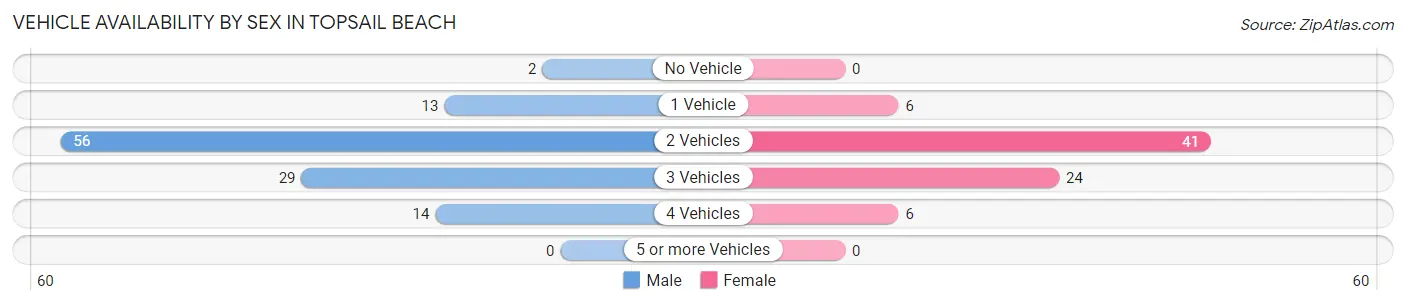
| Vehicles Available | Male | Female |
| No Vehicle | 2 (1.8%) | 0 (0.0%) |
| 1 Vehicle | 13 (11.4%) | 6 (7.8%) |
| 2 Vehicles | 56 (49.1%) | 41 (53.2%) |
| 3 Vehicles | 29 (25.4%) | 24 (31.2%) |
| 4 Vehicles | 14 (12.3%) | 6 (7.8%) |
| 5 or more Vehicles | 0 (0.0%) | 0 (0.0%) |
| Total | 114 (100.0%) | 77 (100.0%) |
Commute Time in Topsail Beach
The most frequently occuring commute durations in Topsail Beach are 15 to 19 minutes (22 commuters, 17.2%), 60 to 89 minutes (21 commuters, 16.4%), and 45 to 59 minutes (19 commuters, 14.8%).
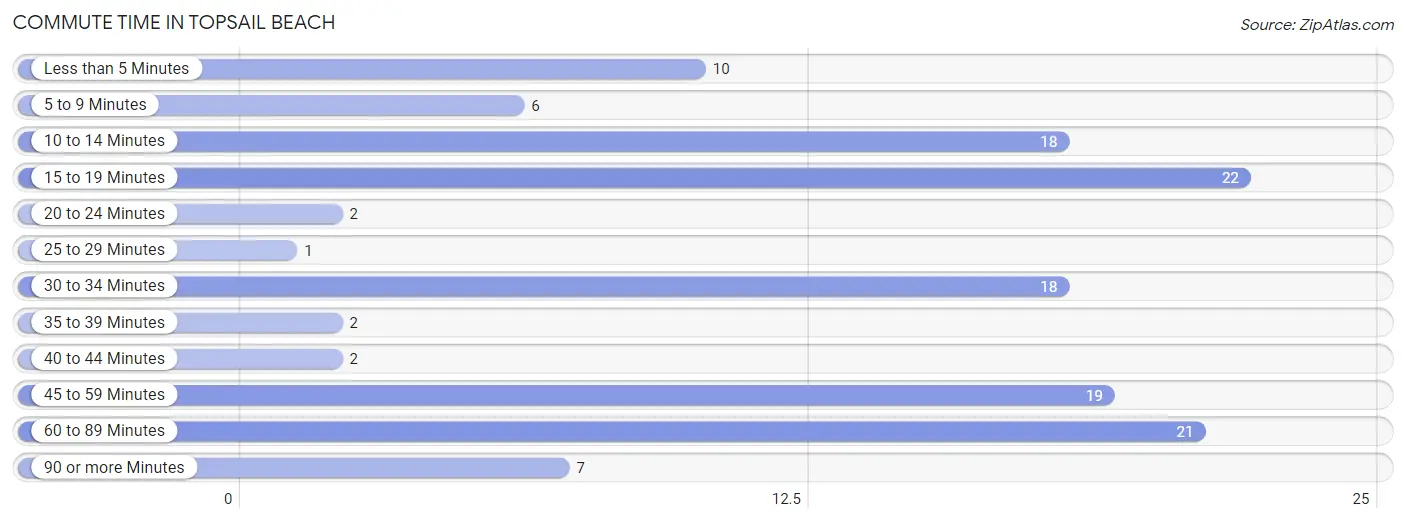
| Commute Time | # Commuters | % Commuters |
| Less than 5 Minutes | 10 | 7.8% |
| 5 to 9 Minutes | 6 | 4.7% |
| 10 to 14 Minutes | 18 | 14.1% |
| 15 to 19 Minutes | 22 | 17.2% |
| 20 to 24 Minutes | 2 | 1.6% |
| 25 to 29 Minutes | 1 | 0.8% |
| 30 to 34 Minutes | 18 | 14.1% |
| 35 to 39 Minutes | 2 | 1.6% |
| 40 to 44 Minutes | 2 | 1.6% |
| 45 to 59 Minutes | 19 | 14.8% |
| 60 to 89 Minutes | 21 | 16.4% |
| 90 or more Minutes | 7 | 5.5% |
Commute Time by Sex in Topsail Beach
The most common commute times in Topsail Beach are 60 to 89 minutes (19 commuters, 23.2%) for males and 15 to 19 minutes (15 commuters, 32.6%) for females.
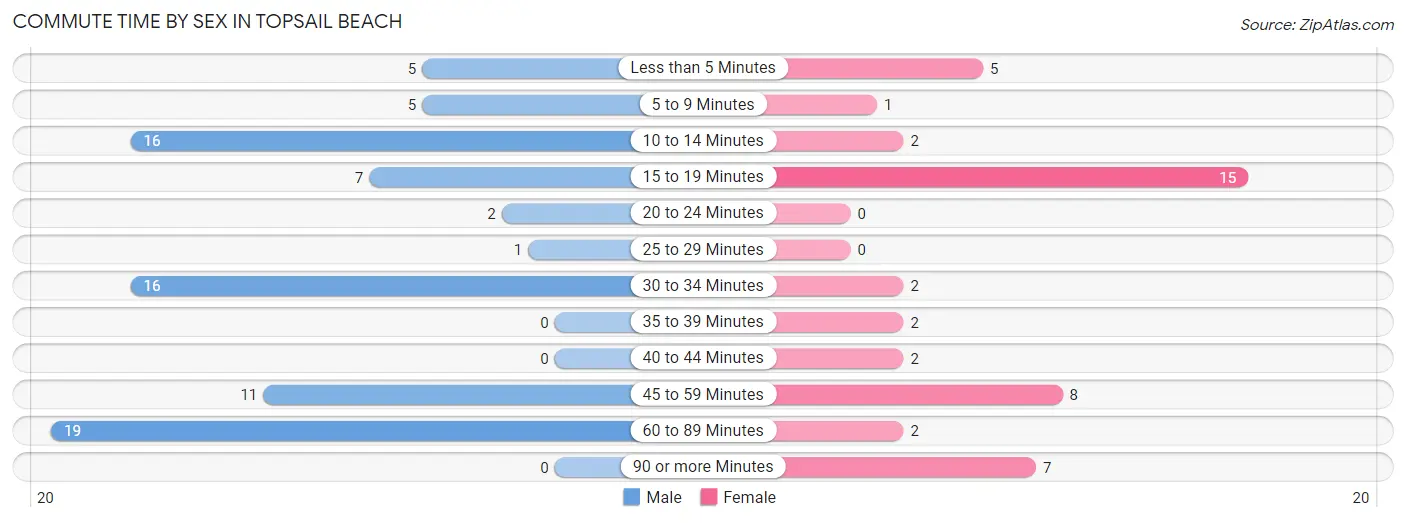
| Commute Time | Male | Female |
| Less than 5 Minutes | 5 (6.1%) | 5 (10.9%) |
| 5 to 9 Minutes | 5 (6.1%) | 1 (2.2%) |
| 10 to 14 Minutes | 16 (19.5%) | 2 (4.3%) |
| 15 to 19 Minutes | 7 (8.5%) | 15 (32.6%) |
| 20 to 24 Minutes | 2 (2.4%) | 0 (0.0%) |
| 25 to 29 Minutes | 1 (1.2%) | 0 (0.0%) |
| 30 to 34 Minutes | 16 (19.5%) | 2 (4.3%) |
| 35 to 39 Minutes | 0 (0.0%) | 2 (4.3%) |
| 40 to 44 Minutes | 0 (0.0%) | 2 (4.3%) |
| 45 to 59 Minutes | 11 (13.4%) | 8 (17.4%) |
| 60 to 89 Minutes | 19 (23.2%) | 2 (4.3%) |
| 90 or more Minutes | 0 (0.0%) | 7 (15.2%) |
Time of Departure to Work by Sex in Topsail Beach
The most frequent times of departure to work in Topsail Beach are 7:00 AM to 7:29 AM (38, 46.3%) for males and 10:00 AM to 10:59 AM (21, 45.7%) for females.
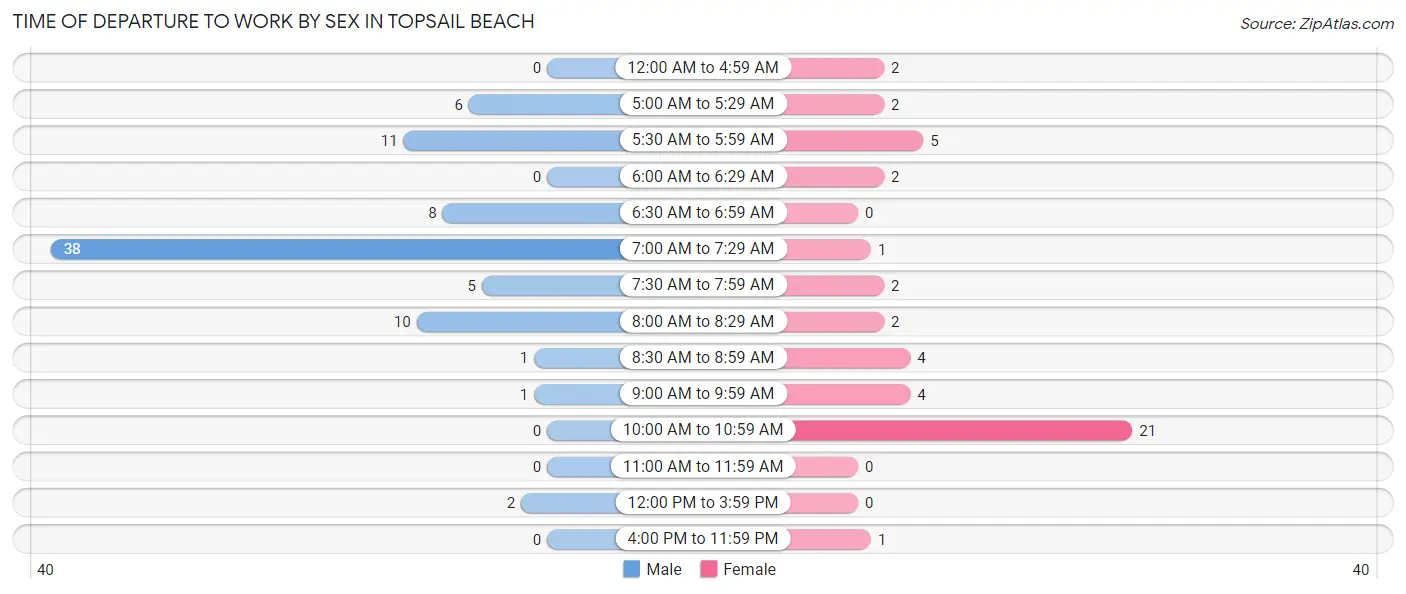
| Time of Departure | Male | Female |
| 12:00 AM to 4:59 AM | 0 (0.0%) | 2 (4.3%) |
| 5:00 AM to 5:29 AM | 6 (7.3%) | 2 (4.3%) |
| 5:30 AM to 5:59 AM | 11 (13.4%) | 5 (10.9%) |
| 6:00 AM to 6:29 AM | 0 (0.0%) | 2 (4.3%) |
| 6:30 AM to 6:59 AM | 8 (9.8%) | 0 (0.0%) |
| 7:00 AM to 7:29 AM | 38 (46.3%) | 1 (2.2%) |
| 7:30 AM to 7:59 AM | 5 (6.1%) | 2 (4.3%) |
| 8:00 AM to 8:29 AM | 10 (12.2%) | 2 (4.3%) |
| 8:30 AM to 8:59 AM | 1 (1.2%) | 4 (8.7%) |
| 9:00 AM to 9:59 AM | 1 (1.2%) | 4 (8.7%) |
| 10:00 AM to 10:59 AM | 0 (0.0%) | 21 (45.7%) |
| 11:00 AM to 11:59 AM | 0 (0.0%) | 0 (0.0%) |
| 12:00 PM to 3:59 PM | 2 (2.4%) | 0 (0.0%) |
| 4:00 PM to 11:59 PM | 0 (0.0%) | 1 (2.2%) |
| Total | 82 (100.0%) | 46 (100.0%) |
Housing Occupancy in Topsail Beach
Occupancy by Ownership in Topsail Beach
Of the total 245 dwellings in Topsail Beach, owner-occupied units account for 234 (95.5%), while renter-occupied units make up 11 (4.5%).
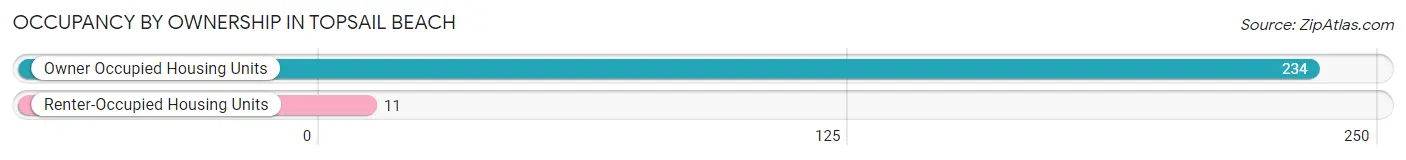
| Occupancy | # Housing Units | % Housing Units |
| Owner Occupied Housing Units | 234 | 95.5% |
| Renter-Occupied Housing Units | 11 | 4.5% |
| Total Occupied Housing Units | 245 | 100.0% |
Occupancy by Household Size in Topsail Beach
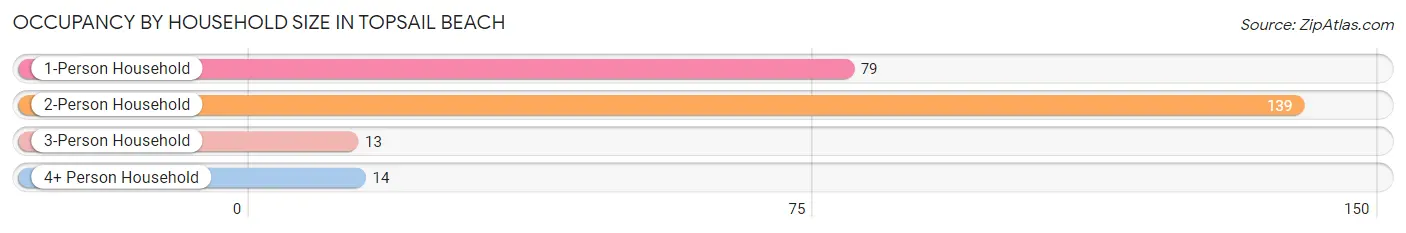
| Household Size | # Housing Units | % Housing Units |
| 1-Person Household | 79 | 32.2% |
| 2-Person Household | 139 | 56.7% |
| 3-Person Household | 13 | 5.3% |
| 4+ Person Household | 14 | 5.7% |
| Total Housing Units | 245 | 100.0% |
Occupancy by Ownership by Household Size in Topsail Beach
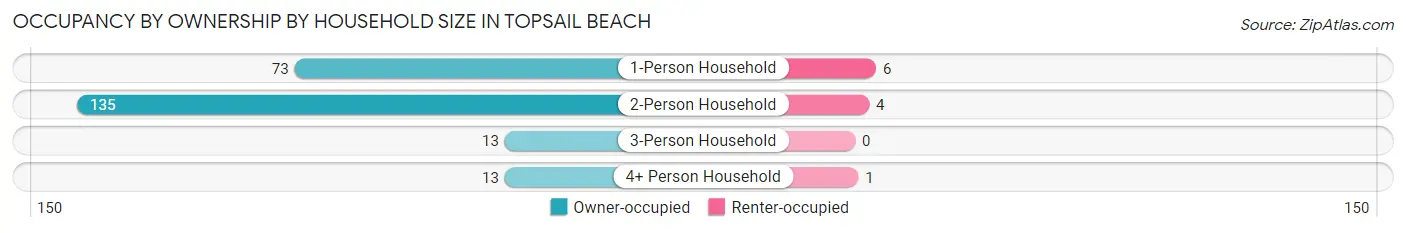
| Household Size | Owner-occupied | Renter-occupied |
| 1-Person Household | 73 (92.4%) | 6 (7.6%) |
| 2-Person Household | 135 (97.1%) | 4 (2.9%) |
| 3-Person Household | 13 (100.0%) | 0 (0.0%) |
| 4+ Person Household | 13 (92.9%) | 1 (7.1%) |
| Total Housing Units | 234 (95.5%) | 11 (4.5%) |
Occupancy by Educational Attainment in Topsail Beach
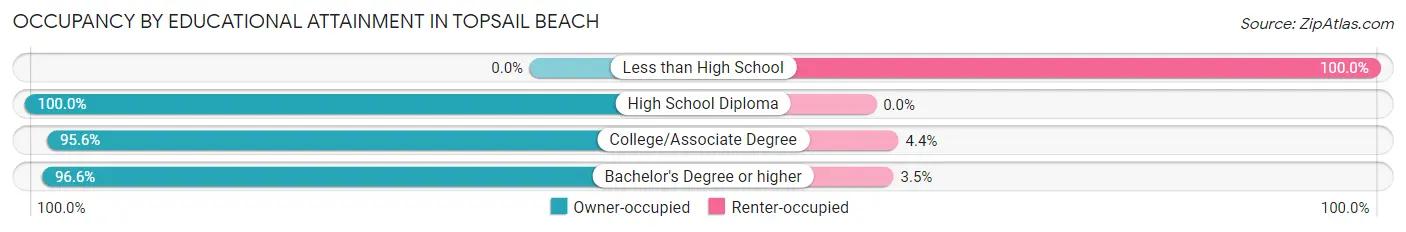
| Household Size | Owner-occupied | Renter-occupied |
| Less than High School | 0 (0.0%) | 2 (100.0%) |
| High School Diploma | 8 (100.0%) | 0 (0.0%) |
| College/Associate Degree | 86 (95.6%) | 4 (4.4%) |
| Bachelor's Degree or higher | 140 (96.6%) | 5 (3.5%) |
Occupancy by Age of Householder in Topsail Beach
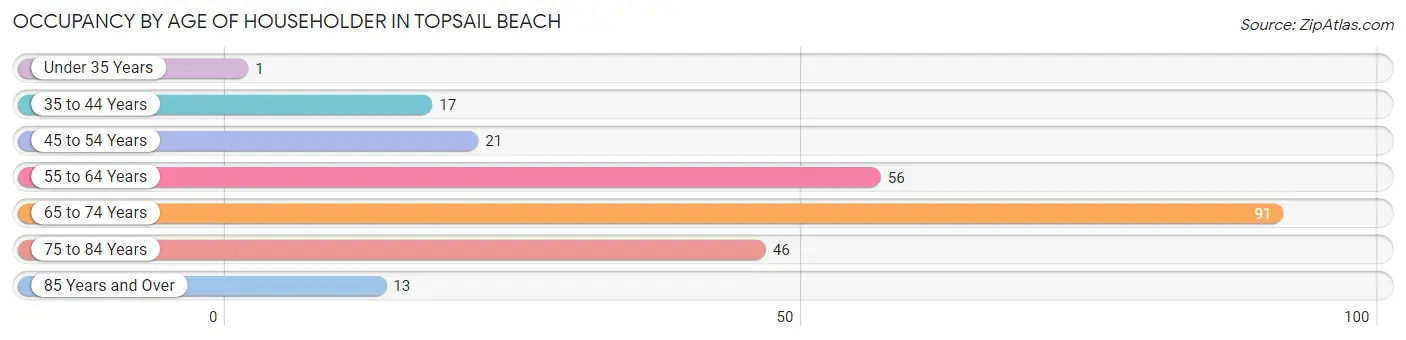
| Age Bracket | # Households | % Households |
| Under 35 Years | 1 | 0.4% |
| 35 to 44 Years | 17 | 6.9% |
| 45 to 54 Years | 21 | 8.6% |
| 55 to 64 Years | 56 | 22.9% |
| 65 to 74 Years | 91 | 37.1% |
| 75 to 84 Years | 46 | 18.8% |
| 85 Years and Over | 13 | 5.3% |
| Total | 245 | 100.0% |
Housing Finances in Topsail Beach
Median Income by Occupancy in Topsail Beach
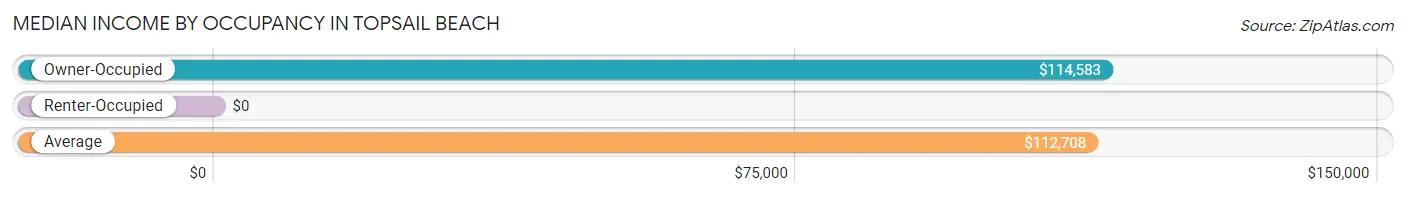
| Occupancy Type | # Households | Median Income |
| Owner-Occupied | 234 (95.5%) | $114,583 |
| Renter-Occupied | 11 (4.5%) | $0 |
| Average | 245 (100.0%) | $112,708 |
Occupancy by Householder Income Bracket in Topsail Beach
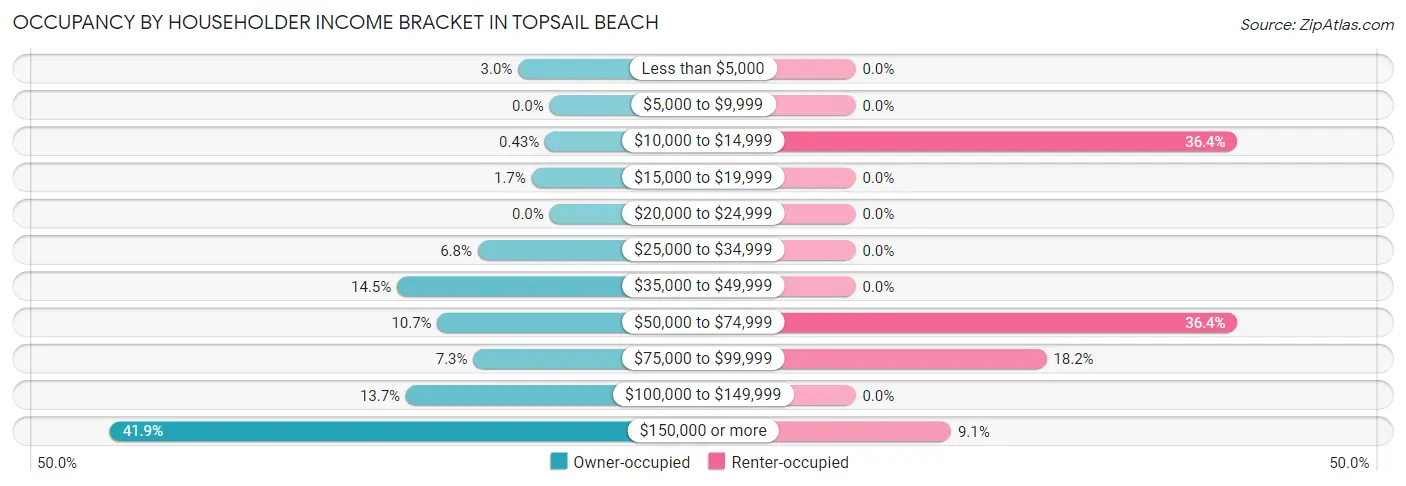
| Income Bracket | Owner-occupied | Renter-occupied |
| Less than $5,000 | 7 (3.0%) | 0 (0.0%) |
| $5,000 to $9,999 | 0 (0.0%) | 0 (0.0%) |
| $10,000 to $14,999 | 1 (0.4%) | 4 (36.4%) |
| $15,000 to $19,999 | 4 (1.7%) | 0 (0.0%) |
| $20,000 to $24,999 | 0 (0.0%) | 0 (0.0%) |
| $25,000 to $34,999 | 16 (6.8%) | 0 (0.0%) |
| $35,000 to $49,999 | 34 (14.5%) | 0 (0.0%) |
| $50,000 to $74,999 | 25 (10.7%) | 4 (36.4%) |
| $75,000 to $99,999 | 17 (7.3%) | 2 (18.2%) |
| $100,000 to $149,999 | 32 (13.7%) | 0 (0.0%) |
| $150,000 or more | 98 (41.9%) | 1 (9.1%) |
| Total | 234 (100.0%) | 11 (100.0%) |
Monthly Housing Cost Tiers in Topsail Beach
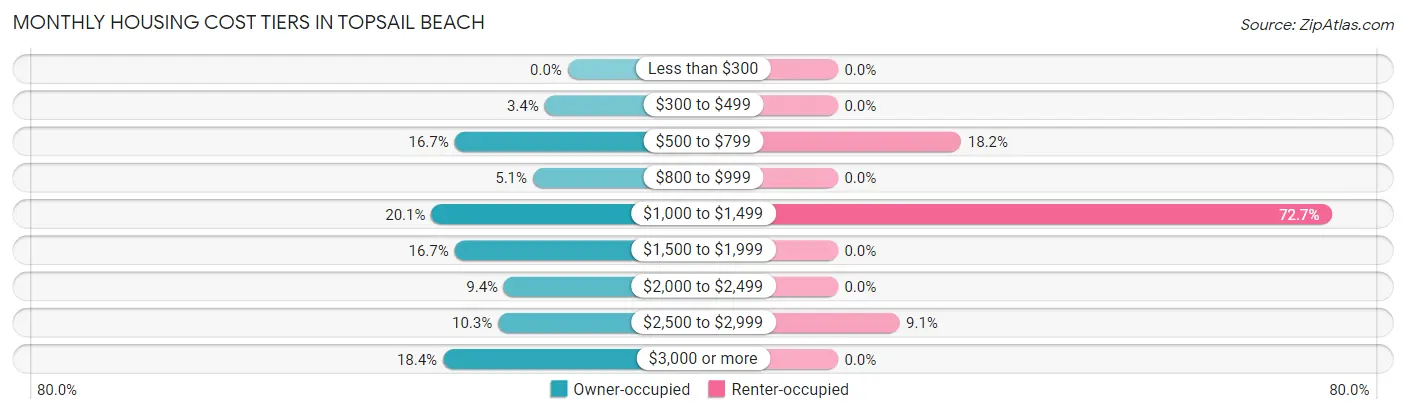
| Monthly Cost | Owner-occupied | Renter-occupied |
| Less than $300 | 0 (0.0%) | 0 (0.0%) |
| $300 to $499 | 8 (3.4%) | 0 (0.0%) |
| $500 to $799 | 39 (16.7%) | 2 (18.2%) |
| $800 to $999 | 12 (5.1%) | 0 (0.0%) |
| $1,000 to $1,499 | 47 (20.1%) | 8 (72.7%) |
| $1,500 to $1,999 | 39 (16.7%) | 0 (0.0%) |
| $2,000 to $2,499 | 22 (9.4%) | 0 (0.0%) |
| $2,500 to $2,999 | 24 (10.3%) | 1 (9.1%) |
| $3,000 or more | 43 (18.4%) | 0 (0.0%) |
| Total | 234 (100.0%) | 11 (100.0%) |
Physical Housing Characteristics in Topsail Beach
Housing Structures in Topsail Beach
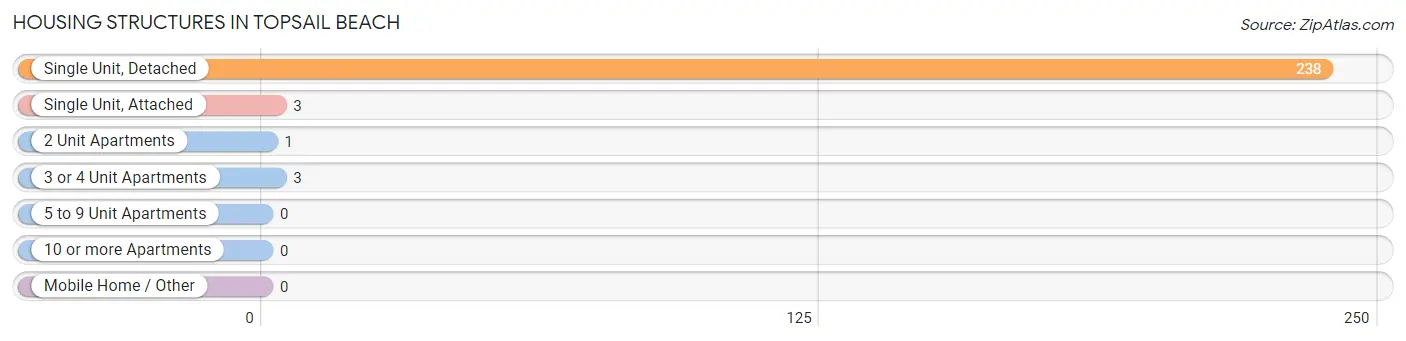
| Structure Type | # Housing Units | % Housing Units |
| Single Unit, Detached | 238 | 97.1% |
| Single Unit, Attached | 3 | 1.2% |
| 2 Unit Apartments | 1 | 0.4% |
| 3 or 4 Unit Apartments | 3 | 1.2% |
| 5 to 9 Unit Apartments | 0 | 0.0% |
| 10 or more Apartments | 0 | 0.0% |
| Mobile Home / Other | 0 | 0.0% |
| Total | 245 | 100.0% |
Housing Structures by Occupancy in Topsail Beach
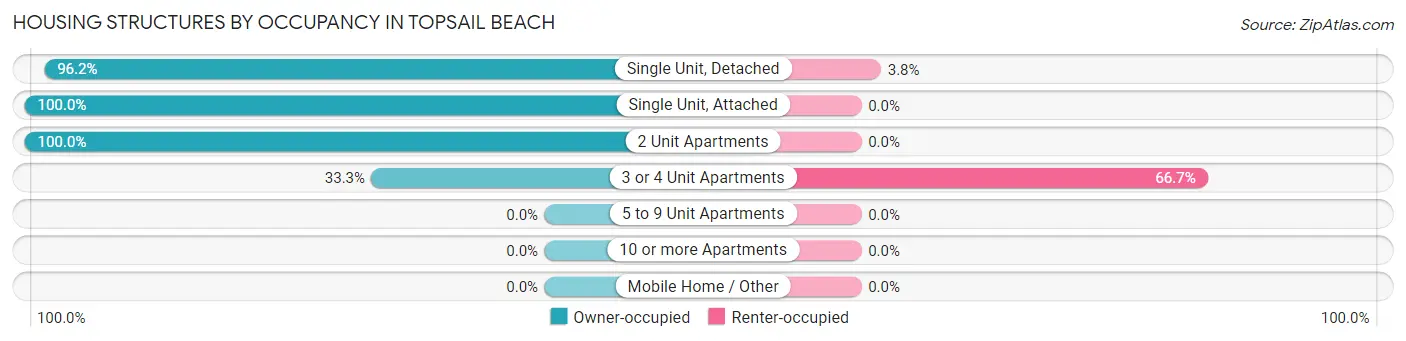
| Structure Type | Owner-occupied | Renter-occupied |
| Single Unit, Detached | 229 (96.2%) | 9 (3.8%) |
| Single Unit, Attached | 3 (100.0%) | 0 (0.0%) |
| 2 Unit Apartments | 1 (100.0%) | 0 (0.0%) |
| 3 or 4 Unit Apartments | 1 (33.3%) | 2 (66.7%) |
| 5 to 9 Unit Apartments | 0 (0.0%) | 0 (0.0%) |
| 10 or more Apartments | 0 (0.0%) | 0 (0.0%) |
| Mobile Home / Other | 0 (0.0%) | 0 (0.0%) |
| Total | 234 (95.5%) | 11 (4.5%) |
Housing Structures by Number of Rooms in Topsail Beach
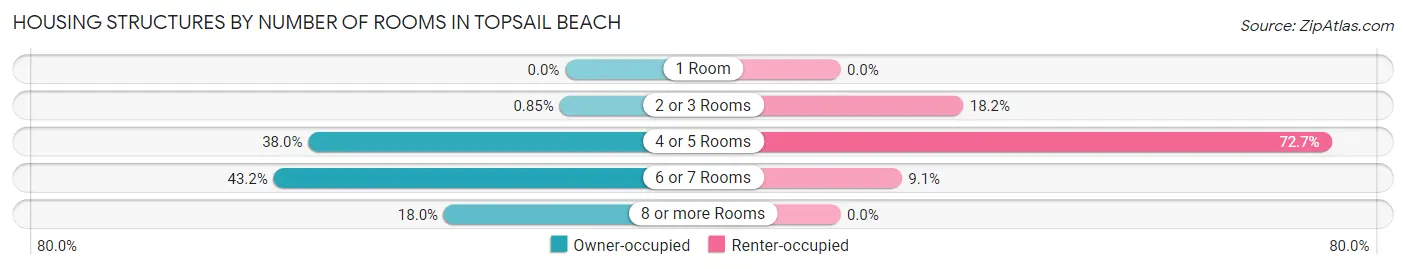
| Number of Rooms | Owner-occupied | Renter-occupied |
| 1 Room | 0 (0.0%) | 0 (0.0%) |
| 2 or 3 Rooms | 2 (0.9%) | 2 (18.2%) |
| 4 or 5 Rooms | 89 (38.0%) | 8 (72.7%) |
| 6 or 7 Rooms | 101 (43.2%) | 1 (9.1%) |
| 8 or more Rooms | 42 (17.9%) | 0 (0.0%) |
| Total | 234 (100.0%) | 11 (100.0%) |
Housing Structure by Heating Type in Topsail Beach
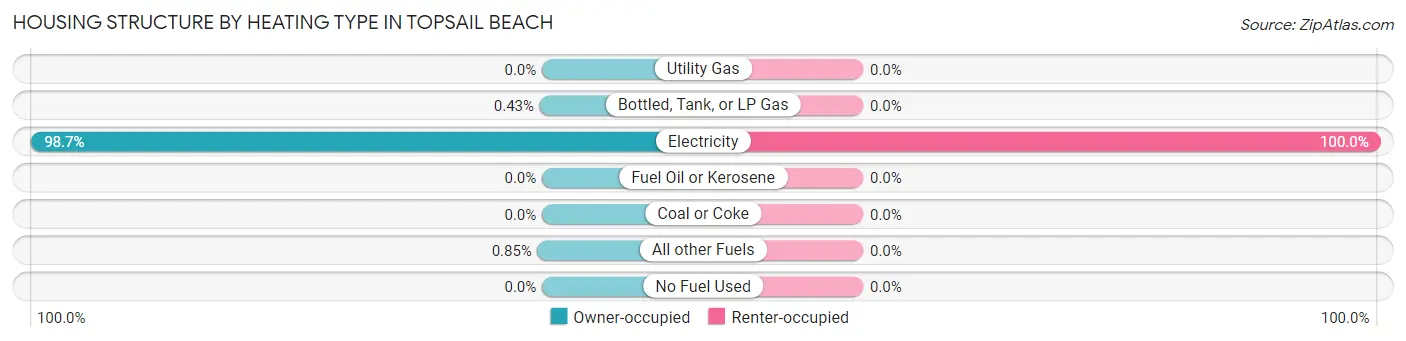
| Heating Type | Owner-occupied | Renter-occupied |
| Utility Gas | 0 (0.0%) | 0 (0.0%) |
| Bottled, Tank, or LP Gas | 1 (0.4%) | 0 (0.0%) |
| Electricity | 231 (98.7%) | 11 (100.0%) |
| Fuel Oil or Kerosene | 0 (0.0%) | 0 (0.0%) |
| Coal or Coke | 0 (0.0%) | 0 (0.0%) |
| All other Fuels | 2 (0.9%) | 0 (0.0%) |
| No Fuel Used | 0 (0.0%) | 0 (0.0%) |
| Total | 234 (100.0%) | 11 (100.0%) |
Household Vehicle Usage in Topsail Beach
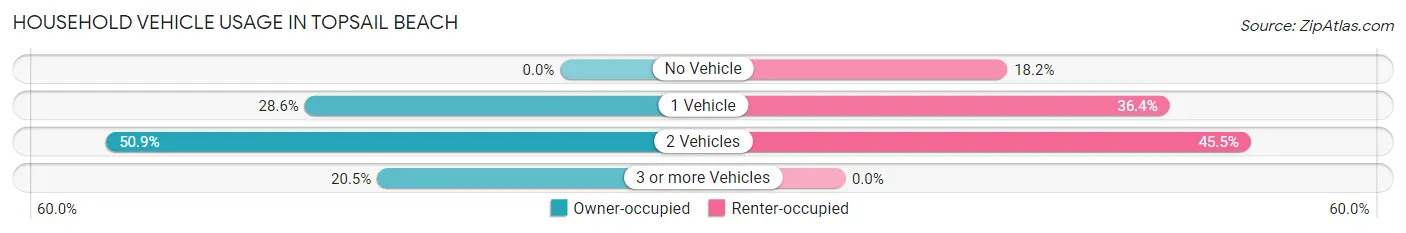
| Vehicles per Household | Owner-occupied | Renter-occupied |
| No Vehicle | 0 (0.0%) | 2 (18.2%) |
| 1 Vehicle | 67 (28.6%) | 4 (36.4%) |
| 2 Vehicles | 119 (50.8%) | 5 (45.5%) |
| 3 or more Vehicles | 48 (20.5%) | 0 (0.0%) |
| Total | 234 (100.0%) | 11 (100.0%) |
Real Estate & Mortgages in Topsail Beach
Real Estate and Mortgage Overview in Topsail Beach
| Characteristic | Without Mortgage | With Mortgage |
| Housing Units | 110 | 124 |
| Median Property Value | $560,000 | $604,700 |
| Median Household Income | $59,545 | $67 |
| Monthly Housing Costs | $967 | $43 |
| Real Estate Taxes | $5,125 | $0 |
Property Value by Mortgage Status in Topsail Beach
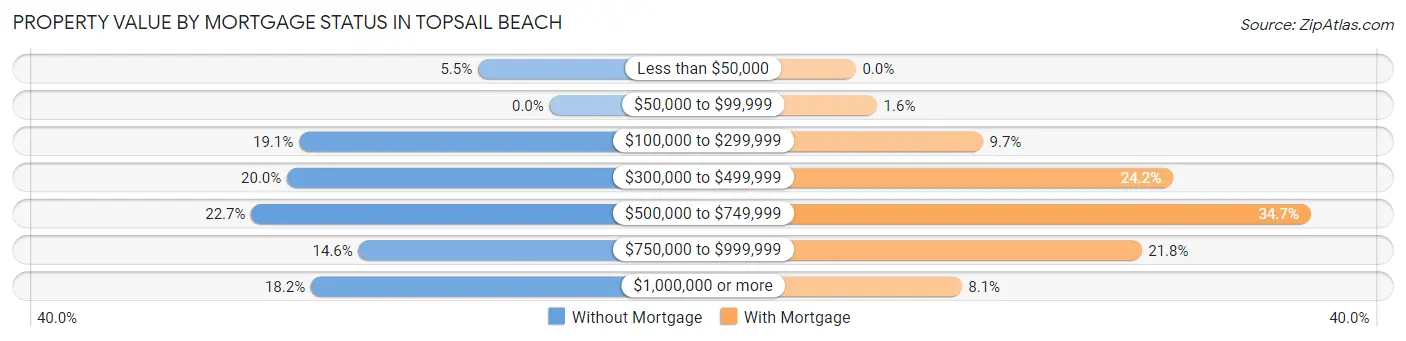
| Property Value | Without Mortgage | With Mortgage |
| Less than $50,000 | 6 (5.4%) | 0 (0.0%) |
| $50,000 to $99,999 | 0 (0.0%) | 2 (1.6%) |
| $100,000 to $299,999 | 21 (19.1%) | 12 (9.7%) |
| $300,000 to $499,999 | 22 (20.0%) | 30 (24.2%) |
| $500,000 to $749,999 | 25 (22.7%) | 43 (34.7%) |
| $750,000 to $999,999 | 16 (14.5%) | 27 (21.8%) |
| $1,000,000 or more | 20 (18.2%) | 10 (8.1%) |
| Total | 110 (100.0%) | 124 (100.0%) |
Household Income by Mortgage Status in Topsail Beach
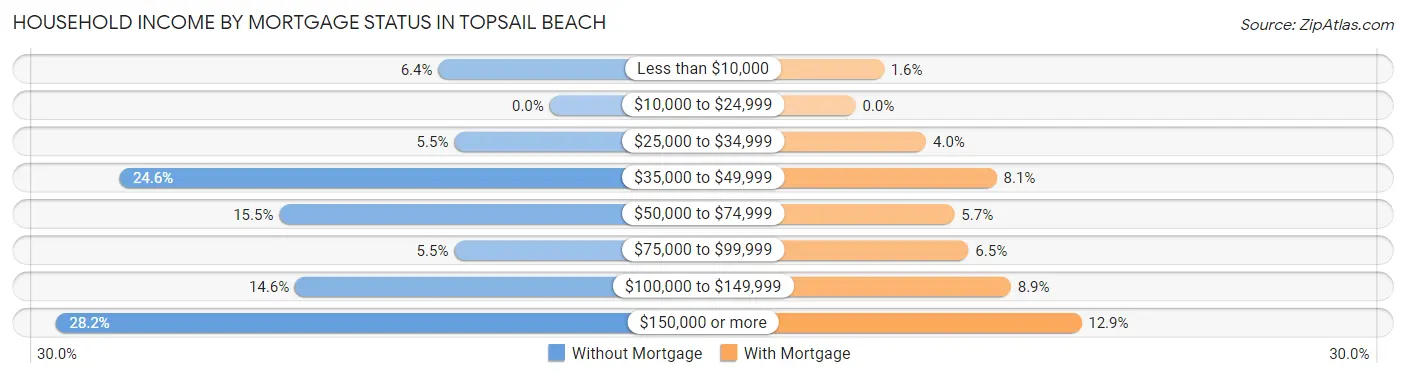
| Household Income | Without Mortgage | With Mortgage |
| Less than $10,000 | 7 (6.4%) | 2 (1.6%) |
| $10,000 to $24,999 | 0 (0.0%) | 0 (0.0%) |
| $25,000 to $34,999 | 6 (5.4%) | 5 (4.0%) |
| $35,000 to $49,999 | 27 (24.5%) | 10 (8.1%) |
| $50,000 to $74,999 | 17 (15.4%) | 7 (5.7%) |
| $75,000 to $99,999 | 6 (5.4%) | 8 (6.5%) |
| $100,000 to $149,999 | 16 (14.5%) | 11 (8.9%) |
| $150,000 or more | 31 (28.2%) | 16 (12.9%) |
| Total | 110 (100.0%) | 124 (100.0%) |
Property Value to Household Income Ratio in Topsail Beach
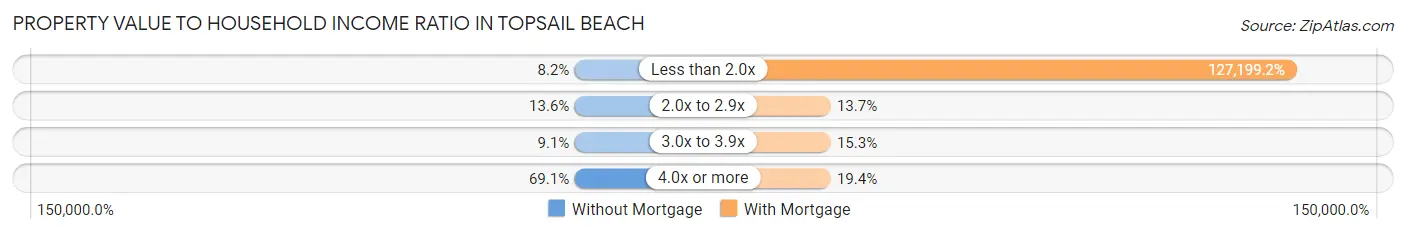
| Value-to-Income Ratio | Without Mortgage | With Mortgage |
| Less than 2.0x | 9 (8.2%) | 157,727 (127,199.2%) |
| 2.0x to 2.9x | 15 (13.6%) | 17 (13.7%) |
| 3.0x to 3.9x | 10 (9.1%) | 19 (15.3%) |
| 4.0x or more | 76 (69.1%) | 24 (19.4%) |
| Total | 110 (100.0%) | 124 (100.0%) |
Real Estate Taxes by Mortgage Status in Topsail Beach
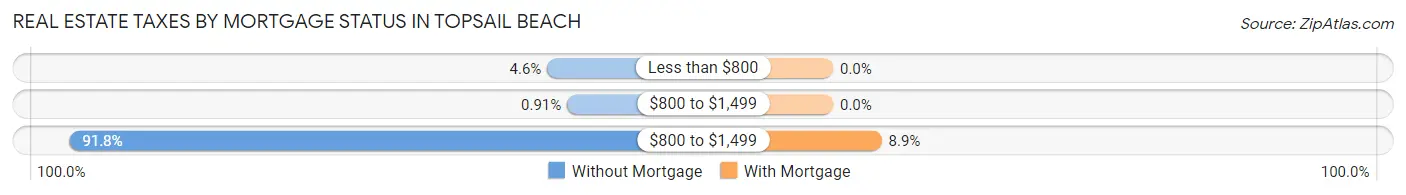
| Property Taxes | Without Mortgage | With Mortgage |
| Less than $800 | 5 (4.5%) | 0 (0.0%) |
| $800 to $1,499 | 1 (0.9%) | 0 (0.0%) |
| $800 to $1,499 | 101 (91.8%) | 11 (8.9%) |
| Total | 110 (100.0%) | 124 (100.0%) |
Health & Disability in Topsail Beach
Health Insurance Coverage by Age in Topsail Beach
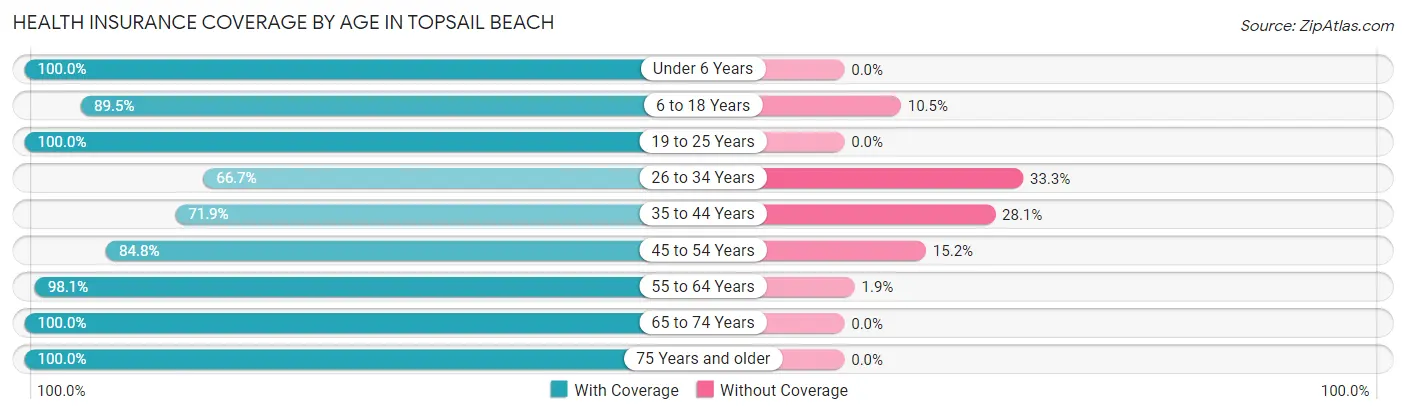
| Age Bracket | With Coverage | Without Coverage |
| Under 6 Years | 1 (100.0%) | 0 (0.0%) |
| 6 to 18 Years | 34 (89.5%) | 4 (10.5%) |
| 19 to 25 Years | 2 (100.0%) | 0 (0.0%) |
| 26 to 34 Years | 12 (66.7%) | 6 (33.3%) |
| 35 to 44 Years | 23 (71.9%) | 9 (28.1%) |
| 45 to 54 Years | 39 (84.8%) | 7 (15.2%) |
| 55 to 64 Years | 102 (98.1%) | 2 (1.9%) |
| 65 to 74 Years | 140 (100.0%) | 0 (0.0%) |
| 75 Years and older | 90 (100.0%) | 0 (0.0%) |
| Total | 443 (94.1%) | 28 (5.9%) |
Health Insurance Coverage by Citizenship Status in Topsail Beach
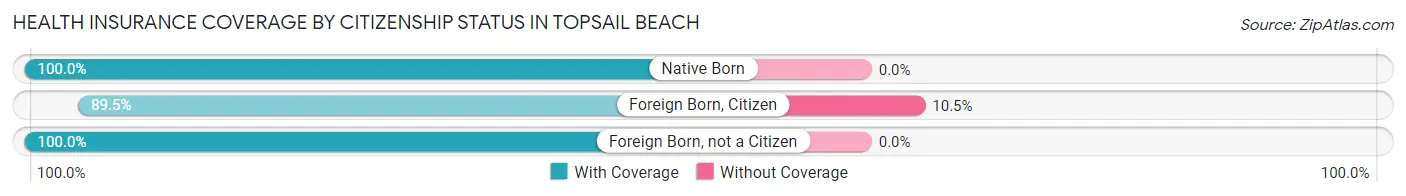
| Citizenship Status | With Coverage | Without Coverage |
| Native Born | 1 (100.0%) | 0 (0.0%) |
| Foreign Born, Citizen | 34 (89.5%) | 4 (10.5%) |
| Foreign Born, not a Citizen | 2 (100.0%) | 0 (0.0%) |
Health Insurance Coverage by Household Income in Topsail Beach
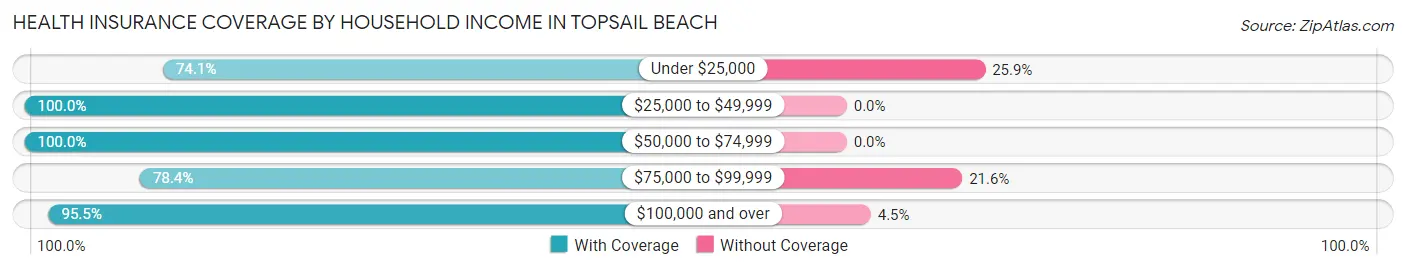
| Household Income | With Coverage | Without Coverage |
| Under $25,000 | 20 (74.1%) | 7 (25.9%) |
| $25,000 to $49,999 | 67 (100.0%) | 0 (0.0%) |
| $50,000 to $74,999 | 51 (100.0%) | 0 (0.0%) |
| $75,000 to $99,999 | 29 (78.4%) | 8 (21.6%) |
| $100,000 and over | 276 (95.5%) | 13 (4.5%) |
Public vs Private Health Insurance Coverage by Age in Topsail Beach
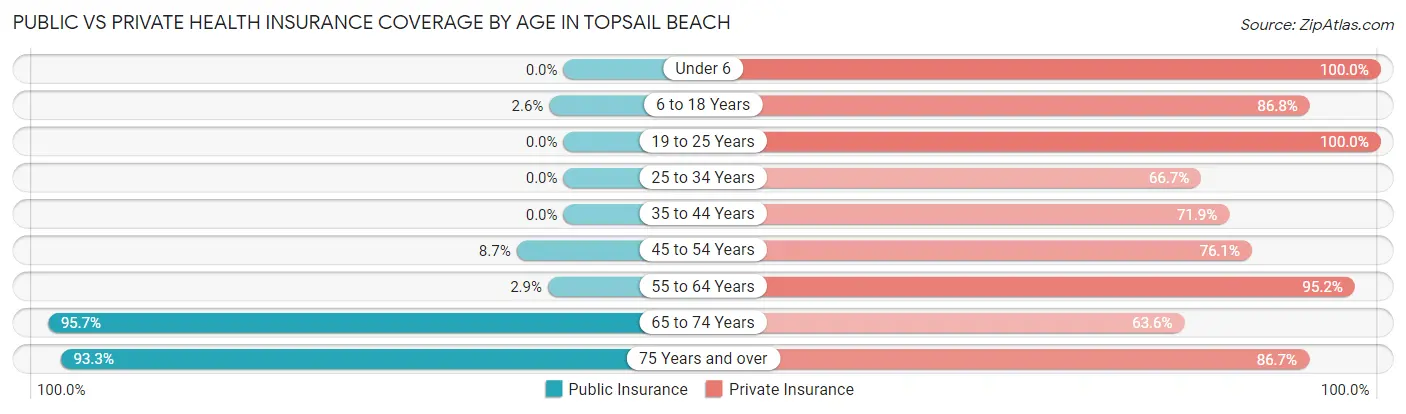
| Age Bracket | Public Insurance | Private Insurance |
| Under 6 | 0 (0.0%) | 1 (100.0%) |
| 6 to 18 Years | 1 (2.6%) | 33 (86.8%) |
| 19 to 25 Years | 0 (0.0%) | 2 (100.0%) |
| 25 to 34 Years | 0 (0.0%) | 12 (66.7%) |
| 35 to 44 Years | 0 (0.0%) | 23 (71.9%) |
| 45 to 54 Years | 4 (8.7%) | 35 (76.1%) |
| 55 to 64 Years | 3 (2.9%) | 99 (95.2%) |
| 65 to 74 Years | 134 (95.7%) | 89 (63.6%) |
| 75 Years and over | 84 (93.3%) | 78 (86.7%) |
| Total | 226 (48.0%) | 372 (79.0%) |
Disability Status by Sex by Age in Topsail Beach
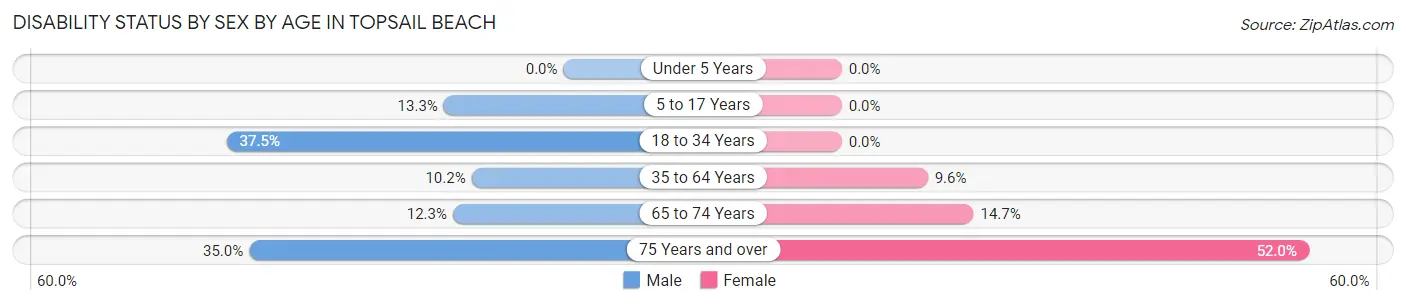
| Age Bracket | Male | Female |
| Under 5 Years | 0 (0.0%) | 0 (0.0%) |
| 5 to 17 Years | 2 (13.3%) | 0 (0.0%) |
| 18 to 34 Years | 6 (37.5%) | 0 (0.0%) |
| 35 to 64 Years | 9 (10.2%) | 9 (9.6%) |
| 65 to 74 Years | 8 (12.3%) | 11 (14.7%) |
| 75 Years and over | 14 (35.0%) | 26 (52.0%) |
Disability Class by Sex by Age in Topsail Beach
Disability Class: Hearing Difficulty
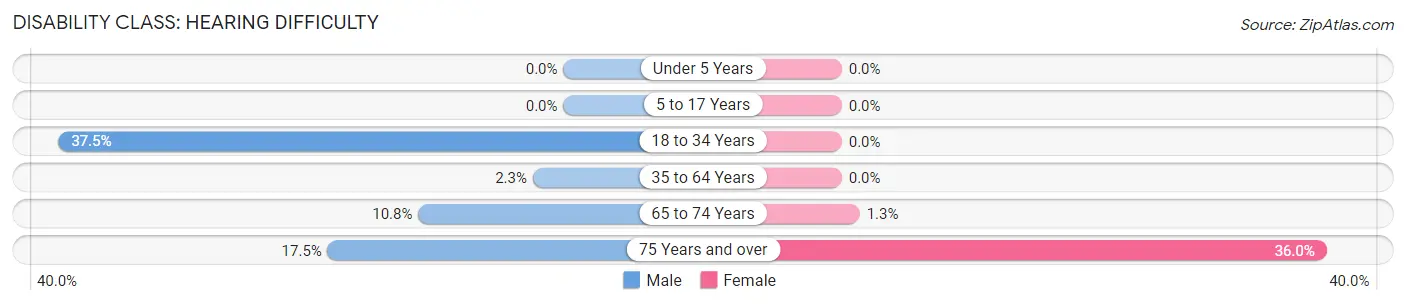
| Age Bracket | Male | Female |
| Under 5 Years | 0 (0.0%) | 0 (0.0%) |
| 5 to 17 Years | 0 (0.0%) | 0 (0.0%) |
| 18 to 34 Years | 6 (37.5%) | 0 (0.0%) |
| 35 to 64 Years | 2 (2.3%) | 0 (0.0%) |
| 65 to 74 Years | 7 (10.8%) | 1 (1.3%) |
| 75 Years and over | 7 (17.5%) | 18 (36.0%) |
Disability Class: Vision Difficulty
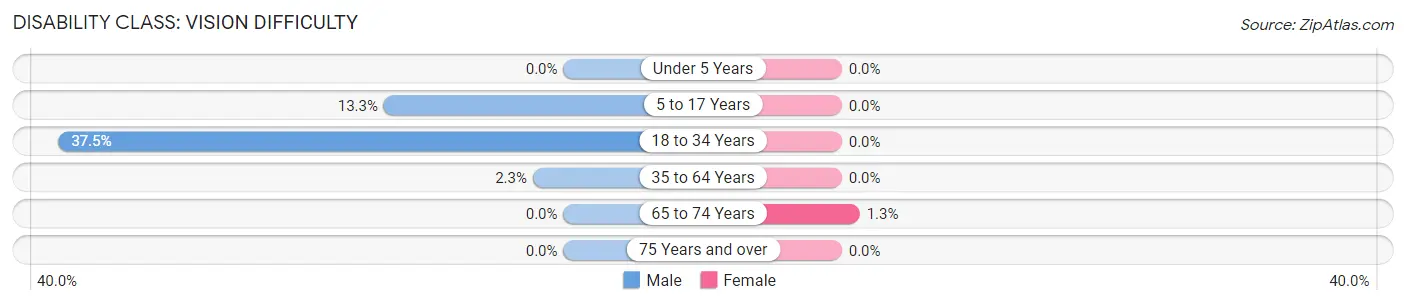
| Age Bracket | Male | Female |
| Under 5 Years | 0 (0.0%) | 0 (0.0%) |
| 5 to 17 Years | 2 (13.3%) | 0 (0.0%) |
| 18 to 34 Years | 6 (37.5%) | 0 (0.0%) |
| 35 to 64 Years | 2 (2.3%) | 0 (0.0%) |
| 65 to 74 Years | 0 (0.0%) | 1 (1.3%) |
| 75 Years and over | 0 (0.0%) | 0 (0.0%) |
Disability Class: Cognitive Difficulty
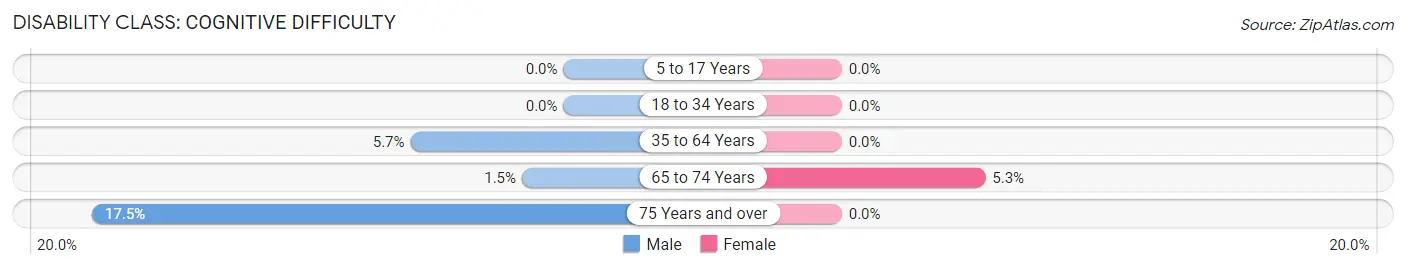
| Age Bracket | Male | Female |
| 5 to 17 Years | 0 (0.0%) | 0 (0.0%) |
| 18 to 34 Years | 0 (0.0%) | 0 (0.0%) |
| 35 to 64 Years | 5 (5.7%) | 0 (0.0%) |
| 65 to 74 Years | 1 (1.5%) | 4 (5.3%) |
| 75 Years and over | 7 (17.5%) | 0 (0.0%) |
Disability Class: Ambulatory Difficulty
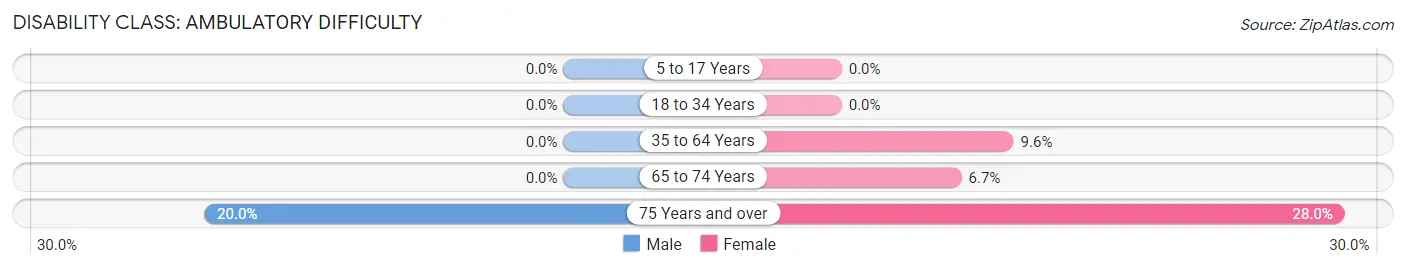
| Age Bracket | Male | Female |
| 5 to 17 Years | 0 (0.0%) | 0 (0.0%) |
| 18 to 34 Years | 0 (0.0%) | 0 (0.0%) |
| 35 to 64 Years | 0 (0.0%) | 9 (9.6%) |
| 65 to 74 Years | 0 (0.0%) | 5 (6.7%) |
| 75 Years and over | 8 (20.0%) | 14 (28.0%) |
Disability Class: Self-Care Difficulty
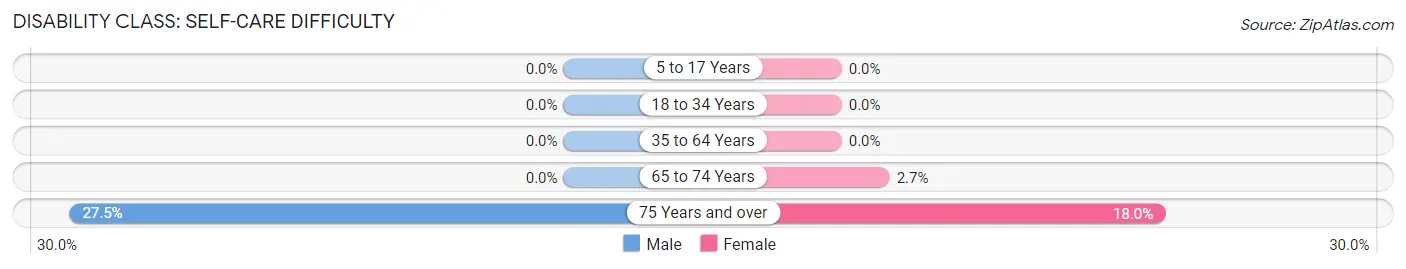
| Age Bracket | Male | Female |
| 5 to 17 Years | 0 (0.0%) | 0 (0.0%) |
| 18 to 34 Years | 0 (0.0%) | 0 (0.0%) |
| 35 to 64 Years | 0 (0.0%) | 0 (0.0%) |
| 65 to 74 Years | 0 (0.0%) | 2 (2.7%) |
| 75 Years and over | 11 (27.5%) | 9 (18.0%) |
Technology Access in Topsail Beach
Computing Device Access in Topsail Beach
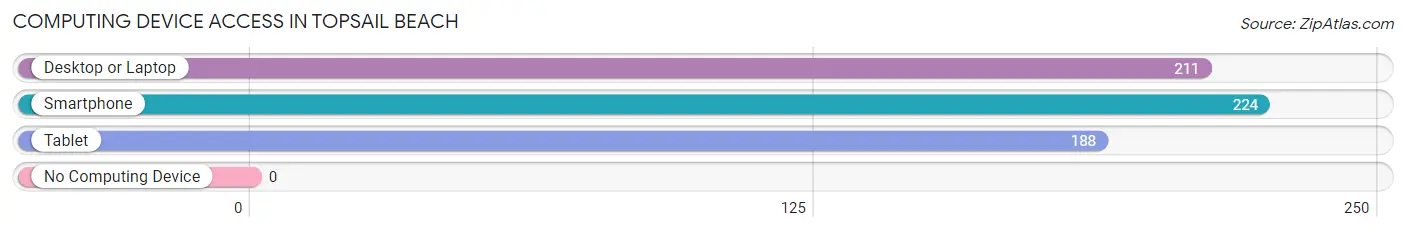
| Device Type | # Households | % Households |
| Desktop or Laptop | 211 | 86.1% |
| Smartphone | 224 | 91.4% |
| Tablet | 188 | 76.7% |
| No Computing Device | 0 | 0.0% |
| Total | 245 | 100.0% |
Internet Access in Topsail Beach
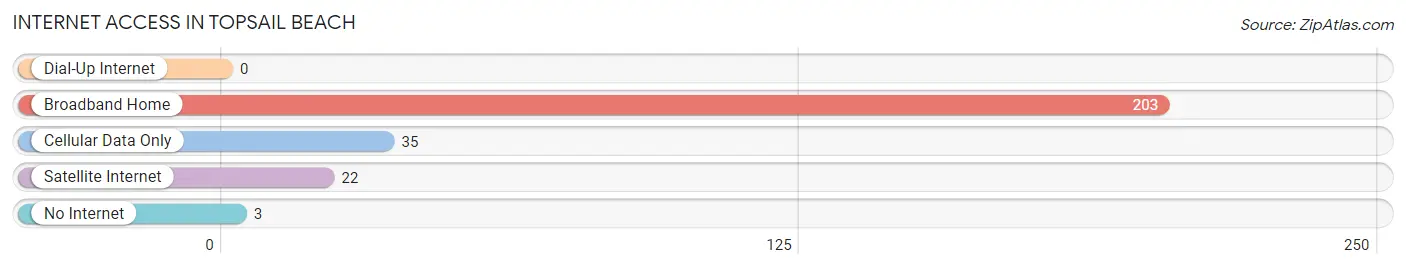
| Internet Type | # Households | % Households |
| Dial-Up Internet | 0 | 0.0% |
| Broadband Home | 203 | 82.9% |
| Cellular Data Only | 35 | 14.3% |
| Satellite Internet | 22 | 9.0% |
| No Internet | 3 | 1.2% |
| Total | 245 | 100.0% |
Topsail Beach Summary
Topsail Beach is a small town located in Pender County, North Carolina, United States. It is situated on the southern end of Topsail Island, a barrier island along the Atlantic Ocean. The town has a population of approximately 500 people and covers an area of 0.7 square miles.
Geography
Topsail Beach is located on the southern end of Topsail Island, a 26-mile long barrier island located along the Atlantic Ocean. The town is bordered by the Atlantic Ocean to the east, the Intracoastal Waterway to the west, and the town of Surf City to the north. The town is situated approximately 30 miles north of Wilmington and 40 miles south of Jacksonville.
The town is characterized by its sandy beaches, dunes, and maritime forests. The town is home to a variety of wildlife, including sea turtles, shorebirds, and dolphins. The town is also home to a variety of plant life, including sea oats, sea grasses, and salt marsh cordgrass.
History
Topsail Beach was first settled in the early 1700s by a group of English settlers. The town was originally known as “Topsail Inlet” and was used as a fishing and trading post. In the late 1800s, the town was renamed “Topsail Beach” and began to attract tourists.
In the early 1900s, the town was home to a number of resorts and hotels. The town was also home to a number of fishing fleets and shrimping boats. In the 1950s, the town began to attract more tourists and began to develop into a popular vacation destination.
In the late 1990s, the town was incorporated and the population began to grow. Today, the town is a popular vacation destination and is home to a variety of restaurants, shops, and attractions.
Economy
The economy of Topsail Beach is largely driven by tourism. The town is home to a variety of restaurants, shops, and attractions. The town is also home to a number of hotels and resorts.
The town is also home to a number of fishing fleets and shrimping boats. The town is also home to a number of marinas and boat docks.
Demographics
As of the 2010 census, the population of Topsail Beach was 500 people. The racial makeup of the town was 97.2% White, 0.8% African American, 0.2% Native American, 0.2% Asian, and 1.4% from other races.
The median household income in Topsail Beach was $50,000, and the median family income was $54,000. The per capita income in the town was $25,000.
Conclusion
Topsail Beach is a small town located in Pender County, North Carolina, United States. It is situated on the southern end of Topsail Island, a barrier island along the Atlantic Ocean. The town has a population of approximately 500 people and covers an area of 0.7 square miles. The town is characterized by its sandy beaches, dunes, and maritime forests. The economy of Topsail Beach is largely driven by tourism. The town is home to a variety of restaurants, shops, and attractions. The racial makeup of the town was 97.2% White, 0.8% African American, 0.2% Native American, 0.2% Asian, and 1.4% from other races. The median household income in Topsail Beach was $50,000, and the median family income was $54,000. The per capita income in the town was $25,000.
Common Questions
What is Per Capita Income in Topsail Beach?
Per Capita income in Topsail Beach is $84,063.
What is the Median Family Income in Topsail Beach?
Median Family Income in Topsail Beach is $159,205.
What is the Median Household income in Topsail Beach?
Median Household Income in Topsail Beach is $112,708.
What is Income or Wage Gap in Topsail Beach?
Income or Wage Gap in Topsail Beach is 41.2%.
Women in Topsail Beach earn 58.8 cents for every dollar earned by a man.
What is Inequality or Gini Index in Topsail Beach?
Inequality or Gini Index in Topsail Beach is 0.50.
What is the Total Population of Topsail Beach?
Total Population of Topsail Beach is 471.
What is the Total Male Population of Topsail Beach?
Total Male Population of Topsail Beach is 225.
What is the Total Female Population of Topsail Beach?
Total Female Population of Topsail Beach is 246.
What is the Ratio of Males per 100 Females in Topsail Beach?
There are 91.46 Males per 100 Females in Topsail Beach.
What is the Ratio of Females per 100 Males in Topsail Beach?
There are 109.33 Females per 100 Males in Topsail Beach.
What is the Median Population Age in Topsail Beach?
Median Population Age in Topsail Beach is 64.6 Years.
What is the Average Family Size in Topsail Beach
Average Family Size in Topsail Beach is 2.4 People.
What is the Average Household Size in Topsail Beach
Average Household Size in Topsail Beach is 1.9 People.
How Large is the Labor Force in Topsail Beach?
There are 197 People in the Labor Forcein in Topsail Beach.
What is the Percentage of People in the Labor Force in Topsail Beach?
43.8% of People are in the Labor Force in Topsail Beach.
What is the Unemployment Rate in Topsail Beach?
Unemployment Rate in Topsail Beach is 2.5%.