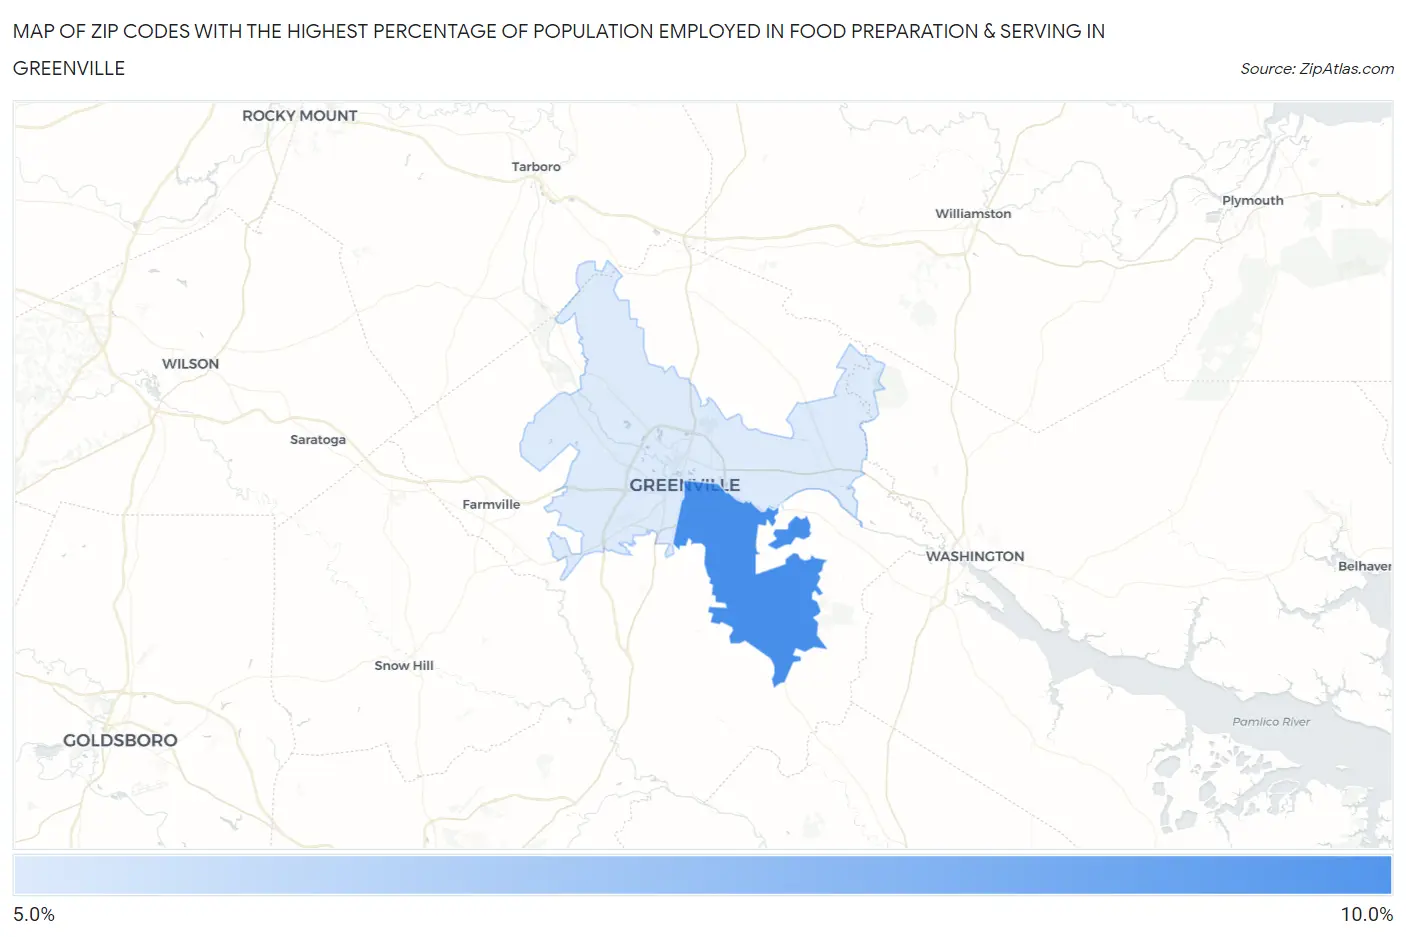
Zip Codes with the Highest Percentage of Population Employed in Food Preparation & Serving in Greenville, NC
RELATED REPORTS & OPTIONS
Food Preparation & Serving
Greenville
Compare Zip Codes
Map of Zip Codes with the Highest Percentage of Population Employed in Food Preparation & Serving in Greenville
5.9%
9.4%
Zip Codes with the Highest Percentage of Population Employed in Food Preparation & Serving in Greenville, NC
| Zip Code | % Employed | vs State | vs National | |
| 1. | 27858 | 9.4% | 5.3%(+4.09)#89 | 5.3%(+4.09)#3,158 |
| 2. | 27834 | 5.9% | 5.3%(+0.575)#259 | 5.3%(+0.579)#9,797 |
1
Common Questions
What are the Top Zip Codes with the Highest Percentage of Population Employed in Food Preparation & Serving in Greenville, NC?
Top Zip Codes with the Highest Percentage of Population Employed in Food Preparation & Serving in Greenville, NC are:
What zip code has the Highest Percentage of Population Employed in Food Preparation & Serving in Greenville, NC?
27858 has the Highest Percentage of Population Employed in Food Preparation & Serving in Greenville, NC with 9.4%.
What is the Percentage of Population Employed in Food Preparation & Serving in Greenville, NC?
Percentage of Population Employed in Food Preparation & Serving in Greenville is 8.8%.
What is the Percentage of Population Employed in Food Preparation & Serving in North Carolina?
Percentage of Population Employed in Food Preparation & Serving in North Carolina is 5.3%.
What is the Percentage of Population Employed in Food Preparation & Serving in the United States?
Percentage of Population Employed in Food Preparation & Serving in the United States is 5.3%.