Cities with the Highest Percentage of Single Fathers in North Carolina
RELATED REPORTS & OPTIONS
Most Single Fathers
North Carolina
Compare Cities
Map of Cities with the Highest Percentage of Single Fathers in North Carolina
0.00%
100.00%
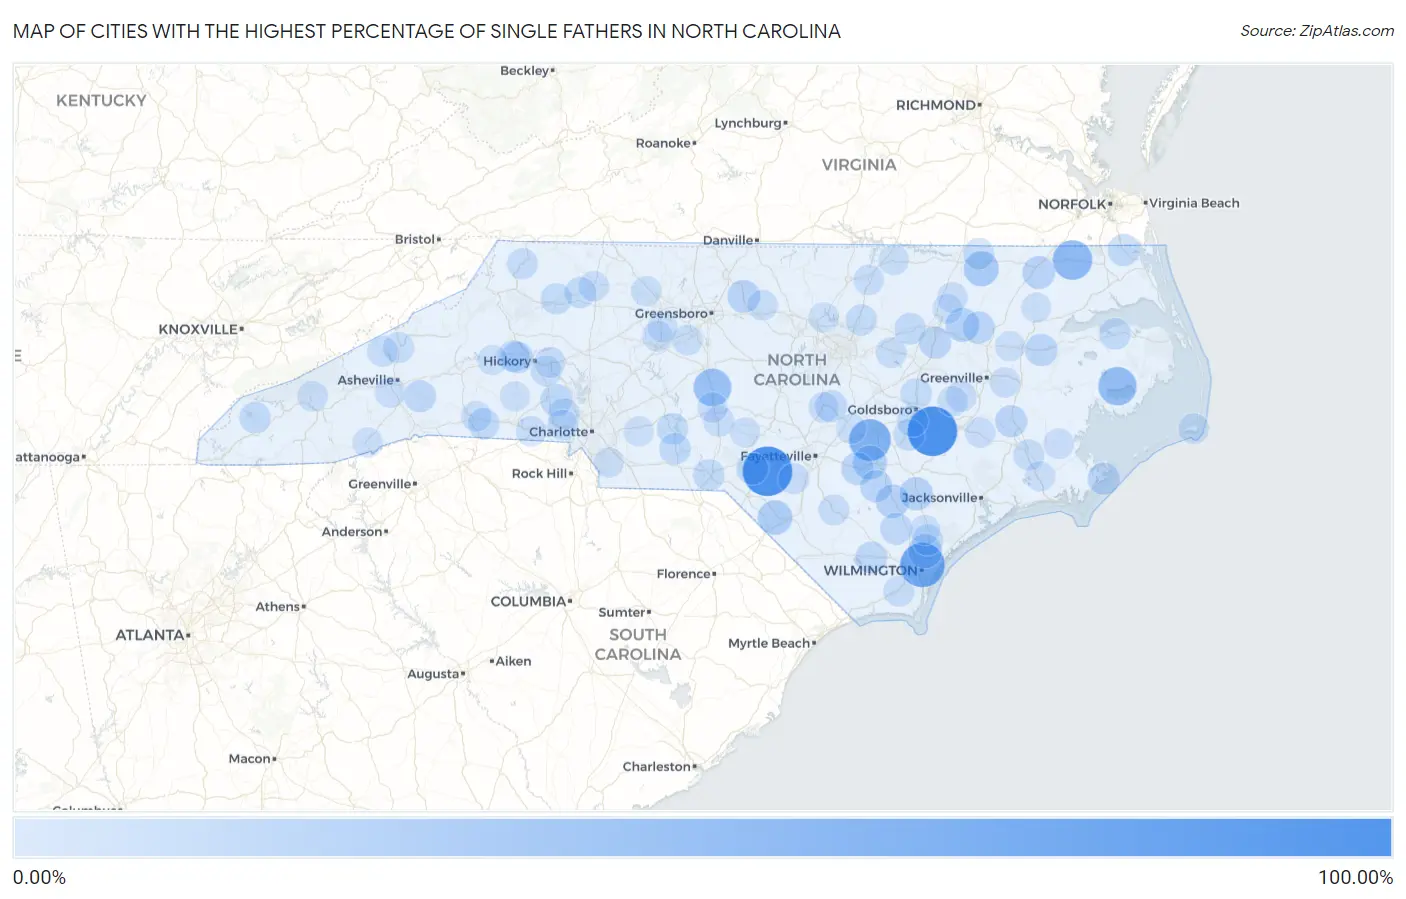
Cities with the Highest Percentage of Single Fathers in North Carolina
| City | % Single Fathers | vs State | vs National | |
| 1. | Bowmore | 100.00% | 3.77% (+96.2)#1 | 4.16% (+95.8)#22 |
| 2. | Seven Springs | 100.00% | 3.77% (+96.2)#2 | 4.16% (+95.8)#39 |
| 3. | Milwaukee | 85.29% | 3.77% (+81.5)#3 | 4.16% (+81.1)#42 |
| 4. | Yadkin College | 85.07% | 3.77% (+81.3)#4 | 4.16% (+80.9)#43 |
| 5. | Hightsville | 76.09% | 3.77% (+72.3)#5 | 4.16% (+71.9)#49 |
| 6. | Vann Crossroads | 62.50% | 3.77% (+58.7)#6 | 4.16% (+58.3)#77 |
| 7. | Bowdens | 57.58% | 3.77% (+53.8)#7 | 4.16% (+53.4)#93 |
| 8. | Sunbury | 52.00% | 3.77% (+48.2)#8 | 4.16% (+47.8)#119 |
| 9. | Fairfield | 46.05% | 3.77% (+42.3)#9 | 4.16% (+41.9)#153 |
| 10. | Seagrove | 42.74% | 3.77% (+39.0)#10 | 4.16% (+38.6)#184 |
| 11. | Jackson | 30.59% | 3.77% (+26.8)#11 | 4.16% (+26.4)#375 |
| 12. | Elrod | 28.77% | 3.77% (+25.0)#12 | 4.16% (+24.6)#419 |
| 13. | Castle Hayne | 25.69% | 3.77% (+21.9)#13 | 4.16% (+21.5)#539 |
| 14. | Bonnetsville | 25.50% | 3.77% (+21.7)#14 | 4.16% (+21.3)#544 |
| 15. | Leggett | 25.00% | 3.77% (+21.2)#15 | 4.16% (+20.8)#574 |
| 16. | Harrells | 23.21% | 3.77% (+19.4)#16 | 4.16% (+19.1)#668 |
| 17. | Teachey | 22.60% | 3.77% (+18.8)#17 | 4.16% (+18.4)#696 |
| 18. | Altamahaw | 20.45% | 3.77% (+16.7)#18 | 4.16% (+16.3)#858 |
| 19. | Cofield | 19.83% | 3.77% (+16.1)#19 | 4.16% (+15.7)#931 |
| 20. | Roseboro | 19.55% | 3.77% (+15.8)#20 | 4.16% (+15.4)#956 |
| 21. | Linville | 18.54% | 3.77% (+14.8)#21 | 4.16% (+14.4)#1,063 |
| 22. | Jamesville | 18.39% | 3.77% (+14.6)#22 | 4.16% (+14.2)#1,082 |
| 23. | Sharpsburg | 18.16% | 3.77% (+14.4)#23 | 4.16% (+14.0)#1,115 |
| 24. | Atlantic | 17.56% | 3.77% (+13.8)#24 | 4.16% (+13.4)#1,170 |
| 25. | Ingold | 17.48% | 3.77% (+13.7)#25 | 4.16% (+13.3)#1,184 |
| 26. | Speed | 17.39% | 3.77% (+13.6)#26 | 4.16% (+13.2)#1,196 |
| 27. | Vanceboro | 16.86% | 3.77% (+13.1)#27 | 4.16% (+12.7)#1,278 |
| 28. | Deercroft | 16.67% | 3.77% (+12.9)#28 | 4.16% (+12.5)#1,293 |
| 29. | Buies Creek | 16.58% | 3.77% (+12.8)#29 | 4.16% (+12.4)#1,334 |
| 30. | Atkinson | 16.50% | 3.77% (+12.7)#30 | 4.16% (+12.3)#1,350 |
| 31. | Iron Station | 16.48% | 3.77% (+12.7)#31 | 4.16% (+12.3)#1,358 |
| 32. | Bolton | 16.42% | 3.77% (+12.6)#32 | 4.16% (+12.3)#1,367 |
| 33. | Gerton | 16.28% | 3.77% (+12.5)#33 | 4.16% (+12.1)#1,392 |
| 34. | Moyock | 16.17% | 3.77% (+12.4)#34 | 4.16% (+12.0)#1,410 |
| 35. | Connelly Springs | 15.57% | 3.77% (+11.8)#35 | 4.16% (+11.4)#1,528 |
| 36. | Emma | 15.21% | 3.77% (+11.4)#36 | 4.16% (+11.1)#1,628 |
| 37. | Momeyer | 14.58% | 3.77% (+10.8)#37 | 4.16% (+10.4)#1,763 |
| 38. | Norwood | 14.49% | 3.77% (+10.7)#38 | 4.16% (+10.3)#1,789 |
| 39. | Ansonville | 14.45% | 3.77% (+10.7)#39 | 4.16% (+10.3)#1,795 |
| 40. | Rutherford College | 14.45% | 3.77% (+10.7)#40 | 4.16% (+10.3)#1,796 |
| 41. | Cordova | 14.17% | 3.77% (+10.4)#41 | 4.16% (+10.0)#1,884 |
| 42. | Caroleen | 14.00% | 3.77% (+10.2)#42 | 4.16% (+9.84)#1,918 |
| 43. | Columbia | 13.97% | 3.77% (+10.2)#43 | 4.16% (+9.81)#1,932 |
| 44. | Robbinsville | 13.71% | 3.77% (+9.94)#44 | 4.16% (+9.55)#2,003 |
| 45. | North Wilkesboro | 13.53% | 3.77% (+9.76)#45 | 4.16% (+9.37)#2,052 |
| 46. | Mount Olive | 13.17% | 3.77% (+9.40)#46 | 4.16% (+9.02)#2,156 |
| 47. | Ronda | 13.11% | 3.77% (+9.34)#47 | 4.16% (+8.96)#2,185 |
| 48. | Pikeville | 12.99% | 3.77% (+9.21)#48 | 4.16% (+8.83)#2,222 |
| 49. | Stanley | 12.89% | 3.77% (+9.12)#49 | 4.16% (+8.73)#2,259 |
| 50. | Rocky Point | 12.83% | 3.77% (+9.06)#50 | 4.16% (+8.67)#2,283 |
| 51. | Seaboard | 12.40% | 3.77% (+8.62)#51 | 4.16% (+8.24)#2,446 |
| 52. | Youngsville | 12.33% | 3.77% (+8.56)#52 | 4.16% (+8.17)#2,468 |
| 53. | Brogden | 12.30% | 3.77% (+8.53)#53 | 4.16% (+8.15)#2,477 |
| 54. | James City | 12.09% | 3.77% (+8.32)#54 | 4.16% (+7.93)#2,554 |
| 55. | Candor | 12.07% | 3.77% (+8.30)#55 | 4.16% (+7.92)#2,557 |
| 56. | Mars Hill | 11.95% | 3.77% (+8.18)#56 | 4.16% (+7.79)#2,612 |
| 57. | Jefferson | 11.81% | 3.77% (+8.04)#57 | 4.16% (+7.65)#2,674 |
| 58. | Marshall | 11.54% | 3.77% (+7.77)#58 | 4.16% (+7.38)#2,773 |
| 59. | Middlesex | 11.27% | 3.77% (+7.50)#59 | 4.16% (+7.11)#2,893 |
| 60. | Dublin | 11.11% | 3.77% (+7.34)#60 | 4.16% (+6.95)#2,976 |
| 61. | Lumber Bridge | 11.11% | 3.77% (+7.34)#61 | 4.16% (+6.95)#2,997 |
| 62. | Newton | 10.91% | 3.77% (+7.14)#62 | 4.16% (+6.75)#3,079 |
| 63. | Bolivia | 10.87% | 3.77% (+7.10)#63 | 4.16% (+6.71)#3,108 |
| 64. | Conover | 10.76% | 3.77% (+6.99)#64 | 4.16% (+6.60)#3,159 |
| 65. | Maury | 10.64% | 3.77% (+6.87)#65 | 4.16% (+6.48)#3,230 |
| 66. | Welcome | 10.50% | 3.77% (+6.73)#66 | 4.16% (+6.35)#3,332 |
| 67. | Green Level | 10.31% | 3.77% (+6.54)#67 | 4.16% (+6.16)#3,425 |
| 68. | Trinity | 10.19% | 3.77% (+6.42)#68 | 4.16% (+6.03)#3,504 |
| 69. | Elkin | 10.12% | 3.77% (+6.35)#69 | 4.16% (+5.96)#3,547 |
| 70. | Buxton | 10.11% | 3.77% (+6.33)#70 | 4.16% (+5.95)#3,556 |
| 71. | Forest City | 10.07% | 3.77% (+6.30)#71 | 4.16% (+5.91)#3,581 |
| 72. | Stonewall | 10.00% | 3.77% (+6.23)#72 | 4.16% (+5.84)#3,627 |
| 73. | Kings Mountain | 9.97% | 3.77% (+6.20)#73 | 4.16% (+5.81)#3,650 |
| 74. | Lowell | 9.94% | 3.77% (+6.17)#74 | 4.16% (+5.79)#3,663 |
| 75. | Lillington | 9.94% | 3.77% (+6.17)#75 | 4.16% (+5.78)#3,665 |
| 76. | Grimesland | 9.89% | 3.77% (+6.12)#76 | 4.16% (+5.73)#3,707 |
| 77. | Cherokee | 9.77% | 3.77% (+6.00)#77 | 4.16% (+5.62)#3,782 |
| 78. | South Henderson | 9.54% | 3.77% (+5.77)#78 | 4.16% (+5.39)#3,952 |
| 79. | Tobaccoville | 9.51% | 3.77% (+5.74)#79 | 4.16% (+5.35)#3,989 |
| 80. | Enfield | 9.46% | 3.77% (+5.69)#80 | 4.16% (+5.30)#4,022 |
| 81. | Star | 9.44% | 3.77% (+5.67)#81 | 4.16% (+5.29)#4,035 |
| 82. | Norlina | 9.40% | 3.77% (+5.62)#82 | 4.16% (+5.24)#4,072 |
| 83. | Snow Hill | 9.18% | 3.77% (+5.41)#83 | 4.16% (+5.03)#4,216 |
| 84. | Dover | 9.17% | 3.77% (+5.39)#84 | 4.16% (+5.01)#4,237 |
| 85. | Bent Creek | 9.12% | 3.77% (+5.35)#85 | 4.16% (+4.96)#4,265 |
| 86. | Whitakers | 8.94% | 3.77% (+5.17)#86 | 4.16% (+4.79)#4,428 |
| 87. | Dudley | 8.84% | 3.77% (+5.07)#87 | 4.16% (+4.68)#4,512 |
| 88. | Morganton | 8.81% | 3.77% (+5.03)#88 | 4.16% (+4.65)#4,542 |
| 89. | Gorman | 8.79% | 3.77% (+5.01)#89 | 4.16% (+4.63)#4,553 |
| 90. | Stanfield | 8.70% | 3.77% (+4.92)#90 | 4.16% (+4.54)#4,602 |
| 91. | Everetts | 8.70% | 3.77% (+4.92)#91 | 4.16% (+4.54)#4,611 |
| 92. | Taylortown | 8.68% | 3.77% (+4.90)#92 | 4.16% (+4.52)#4,636 |
| 93. | Havelock | 8.58% | 3.77% (+4.80)#93 | 4.16% (+4.42)#4,725 |
| 94. | Wesley Chapel | 8.56% | 3.77% (+4.79)#94 | 4.16% (+4.41)#4,746 |
| 95. | Midway | 8.50% | 3.77% (+4.73)#95 | 4.16% (+4.34)#4,803 |
| 96. | Plain View | 8.49% | 3.77% (+4.72)#96 | 4.16% (+4.33)#4,811 |
| 97. | Rosman | 8.46% | 3.77% (+4.69)#97 | 4.16% (+4.30)#4,837 |
| 98. | St Helena | 8.40% | 3.77% (+4.62)#98 | 4.16% (+4.24)#4,899 |
| 99. | Belwood | 8.33% | 3.77% (+4.56)#99 | 4.16% (+4.18)#4,953 |
| 100. | Askewville | 8.33% | 3.77% (+4.56)#100 | 4.16% (+4.18)#4,975 |
Common Questions
What are the Top 10 Cities with the Highest Percentage of Single Fathers in North Carolina?
Top 10 Cities with the Highest Percentage of Single Fathers in North Carolina are:
#1
100.00%
#2
100.00%
#3
76.09%
#4
62.50%
#5
52.00%
#6
46.05%
#7
42.74%
#8
30.59%
#9
28.77%
#10
25.69%
What city has the Highest Percentage of Single Fathers in North Carolina?
Bowmore has the Highest Percentage of Single Fathers in North Carolina with 100.00%.
What is the Percentage of Single Fathers in the State of North Carolina?
Percentage of Single Fathers in North Carolina is 3.77%.
What is the Percentage of Single Fathers in the United States?
Percentage of Single Fathers in the United States is 4.16%.