Bear Grass, NC Map & Demographics
Bear Grass Map
Bear Grass Overview
$23,929
PER CAPITA INCOME
$93,333
AVG FAMILY INCOME
$54,821
AVG HOUSEHOLD INCOME
25.3%
WAGE / INCOME GAP [ % ]
74.7¢/ $1
WAGE / INCOME GAP [ $ ]
0.30
INEQUALITY / GINI INDEX
129
TOTAL POPULATION
73
MALE POPULATION
56
FEMALE POPULATION
130.36
MALES / 100 FEMALES
76.71
FEMALES / 100 MALES
39.2
MEDIAN AGE
3.4
AVG FAMILY SIZE
2.9
AVG HOUSEHOLD SIZE
50
LABOR FORCE [ PEOPLE ]
50.0%
PERCENT IN LABOR FORCE
Bear Grass Area Codes
Income in Bear Grass
Income Overview in Bear Grass
Per Capita Income in Bear Grass is $23,929, while median incomes of families and households are $93,333 and $54,821 respectively.
| Characteristic | Number | Measure |
| Per Capita Income | 129 | $23,929 |
| Median Family Income | 22 | $93,333 |
| Mean Family Income | 22 | $88,905 |
| Median Household Income | 45 | $54,821 |
| Mean Household Income | 45 | $67,480 |
| Income Deficit | 22 | $0 |
| Wage / Income Gap (%) | 129 | 25.32% |
| Wage / Income Gap ($) | 129 | 74.68¢ per $1 |
| Gini / Inequality Index | 129 | 0.30 |
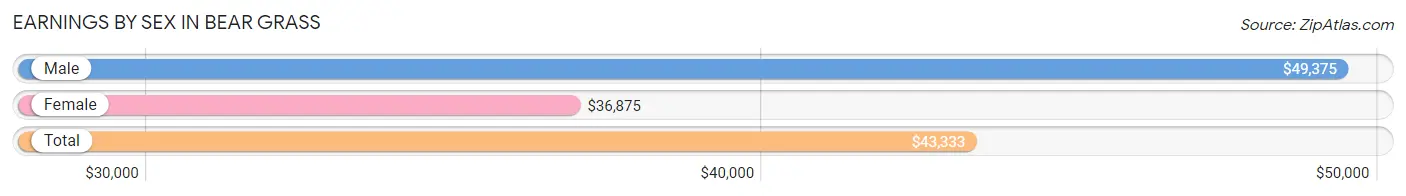
Earnings by Sex in Bear Grass
Average Earnings in Bear Grass are $43,333, $49,375 for men and $36,875 for women, a difference of 25.3%.
| Sex | Number | Average Earnings |
| Male | 27 (54.0%) | $49,375 |
| Female | 23 (46.0%) | $36,875 |
| Total | 50 (100.0%) | $43,333 |
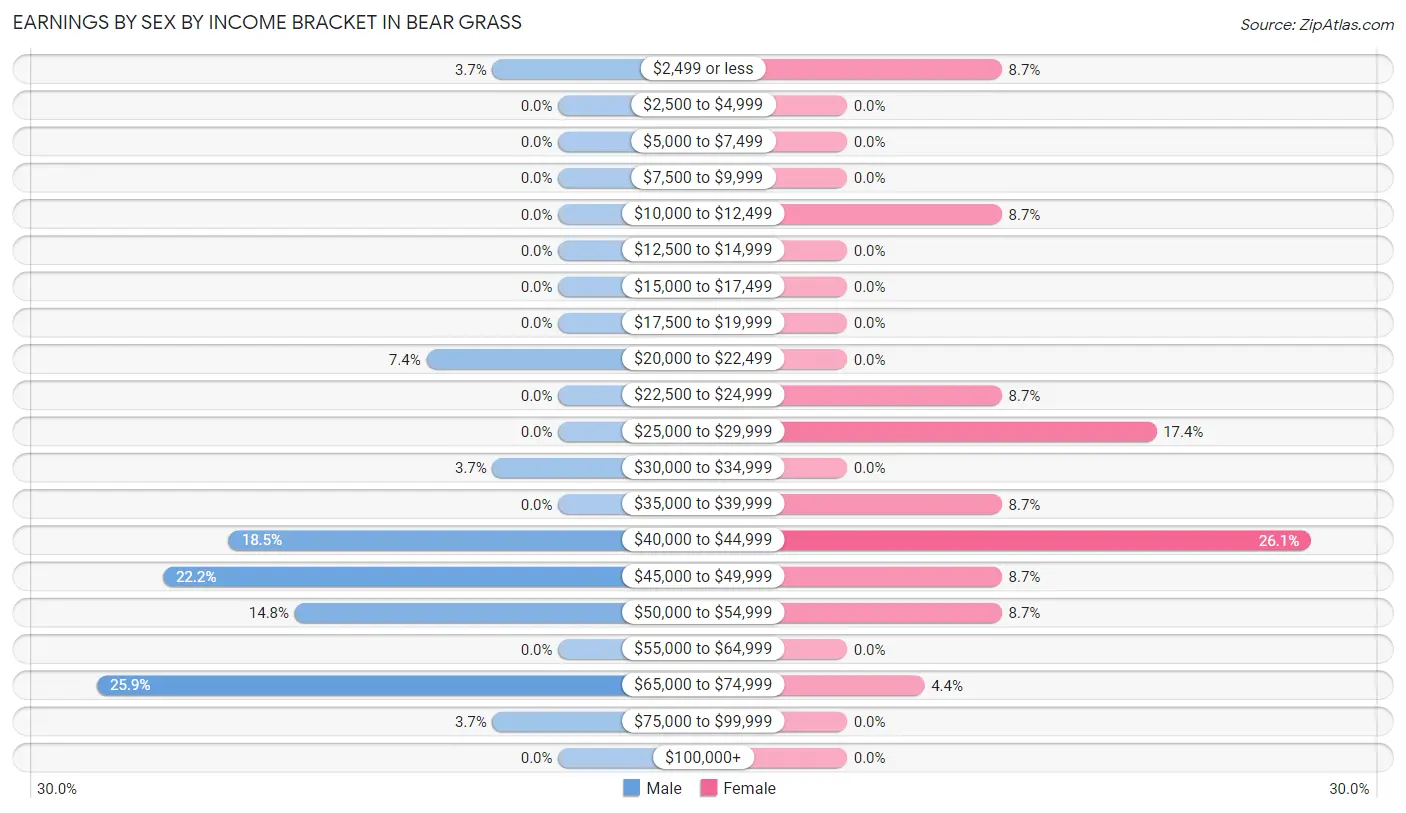
Earnings by Sex by Income Bracket in Bear Grass
The most common earnings brackets in Bear Grass are $65,000 to $74,999 for men (7 | 25.9%) and $40,000 to $44,999 for women (6 | 26.1%).
| Income | Male | Female |
| $2,499 or less | 1 (3.7%) | 2 (8.7%) |
| $2,500 to $4,999 | 0 (0.0%) | 0 (0.0%) |
| $5,000 to $7,499 | 0 (0.0%) | 0 (0.0%) |
| $7,500 to $9,999 | 0 (0.0%) | 0 (0.0%) |
| $10,000 to $12,499 | 0 (0.0%) | 2 (8.7%) |
| $12,500 to $14,999 | 0 (0.0%) | 0 (0.0%) |
| $15,000 to $17,499 | 0 (0.0%) | 0 (0.0%) |
| $17,500 to $19,999 | 0 (0.0%) | 0 (0.0%) |
| $20,000 to $22,499 | 2 (7.4%) | 0 (0.0%) |
| $22,500 to $24,999 | 0 (0.0%) | 2 (8.7%) |
| $25,000 to $29,999 | 0 (0.0%) | 4 (17.4%) |
| $30,000 to $34,999 | 1 (3.7%) | 0 (0.0%) |
| $35,000 to $39,999 | 0 (0.0%) | 2 (8.7%) |
| $40,000 to $44,999 | 5 (18.5%) | 6 (26.1%) |
| $45,000 to $49,999 | 6 (22.2%) | 2 (8.7%) |
| $50,000 to $54,999 | 4 (14.8%) | 2 (8.7%) |
| $55,000 to $64,999 | 0 (0.0%) | 0 (0.0%) |
| $65,000 to $74,999 | 7 (25.9%) | 1 (4.3%) |
| $75,000 to $99,999 | 1 (3.7%) | 0 (0.0%) |
| $100,000+ | 0 (0.0%) | 0 (0.0%) |
| Total | 27 (100.0%) | 23 (100.0%) |
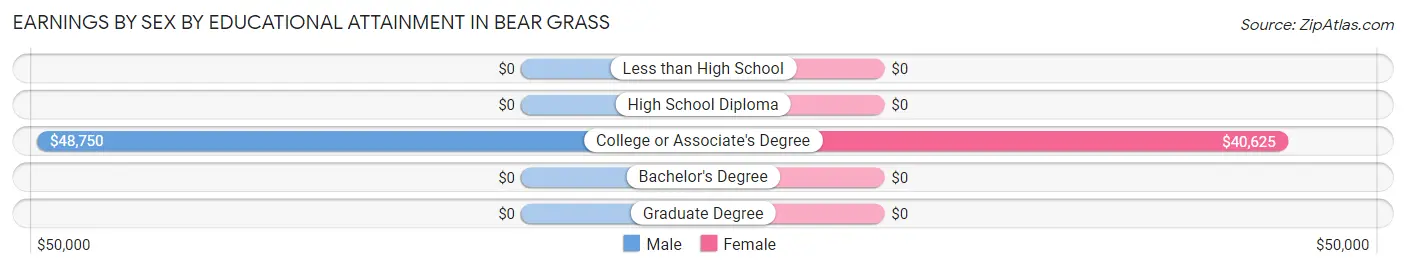
Earnings by Sex by Educational Attainment in Bear Grass
Average earnings in Bear Grass are $50,313 for men and $40,208 for women, a difference of 20.1%. Men with an educational attainment of college or associate's degree enjoy the highest average annual earnings of $48,750, while those with college or associate's degree education earn the least with $48,750. Women with an educational attainment of college or associate's degree earn the most with the average annual earnings of $40,625, while those with college or associate's degree education have the smallest earnings of $40,625.
| Educational Attainment | Male Income | Female Income |
| Less than High School | - | - |
| High School Diploma | - | - |
| College or Associate's Degree | $48,750 | $40,625 |
| Bachelor's Degree | - | - |
| Graduate Degree | - | - |
| Total | $50,313 | $40,208 |
Family Income in Bear Grass
Family Income Brackets in Bear Grass
According to the Bear Grass family income data, there are 7 families falling into the $50,000 to $74,999 income range, which is the most common income bracket and makes up 31.8% of all families.
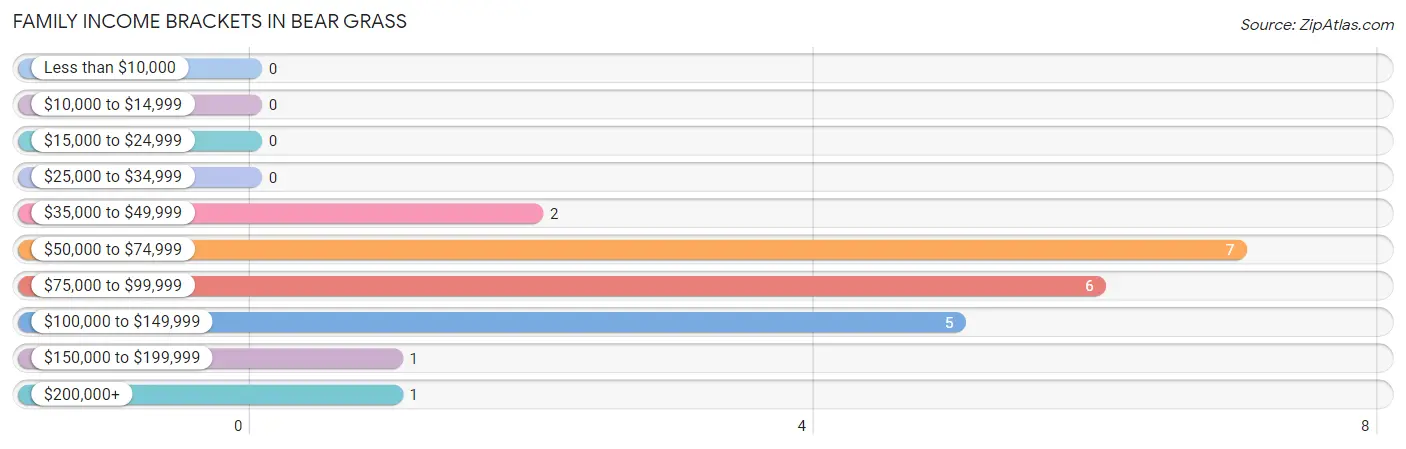
| Income Bracket | # Families | % Families |
| Less than $10,000 | 0 | 0.0% |
| $10,000 to $14,999 | 0 | 0.0% |
| $15,000 to $24,999 | 0 | 0.0% |
| $25,000 to $34,999 | 0 | 0.0% |
| $35,000 to $49,999 | 2 | 9.1% |
| $50,000 to $74,999 | 7 | 31.8% |
| $75,000 to $99,999 | 6 | 27.3% |
| $100,000 to $149,999 | 5 | 22.7% |
| $150,000 to $199,999 | 1 | 4.5% |
| $200,000+ | 1 | 4.5% |
Family Income by Famaliy Size in Bear Grass
2-person families (11 | 50.0%) account for the highest median family income in Bear Grass with $102,813 per family, while 2-person families (11 | 50.0%) have the highest median income of $51,406 per family member.
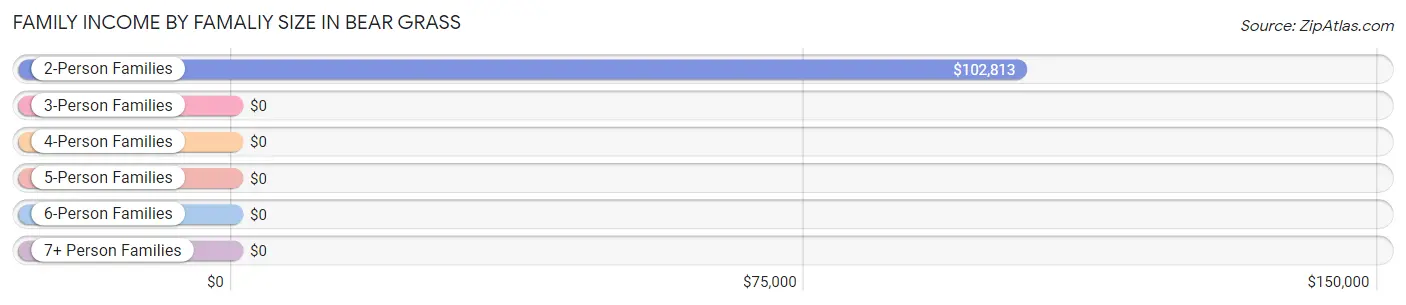
| Income Bracket | # Families | Median Income |
| 2-Person Families | 11 (50.0%) | $102,813 |
| 3-Person Families | 6 (27.3%) | $0 |
| 4-Person Families | 2 (9.1%) | $0 |
| 5-Person Families | 3 (13.6%) | $0 |
| 6-Person Families | 0 (0.0%) | $0 |
| 7+ Person Families | 0 (0.0%) | $0 |
| Total | 22 (100.0%) | $93,333 |
Family Income by Number of Earners in Bear Grass
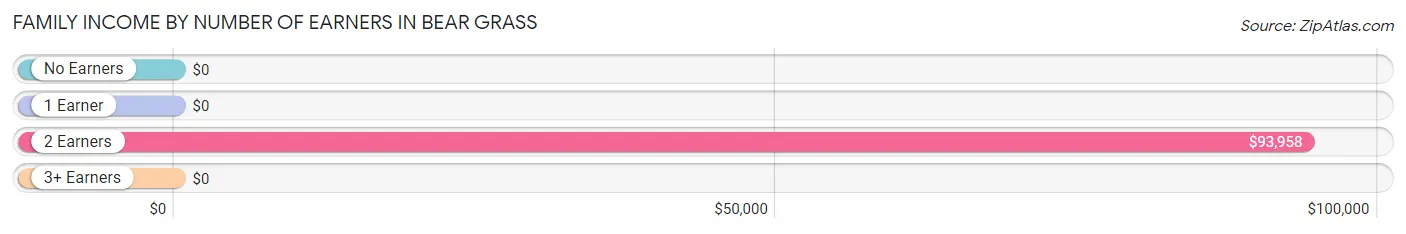
| Number of Earners | # Families | Median Income |
| No Earners | 2 (9.1%) | $0 |
| 1 Earner | 7 (31.8%) | $0 |
| 2 Earners | 13 (59.1%) | $93,958 |
| 3+ Earners | 0 (0.0%) | $0 |
| Total | 22 (100.0%) | $93,333 |
Household Income in Bear Grass
Household Income Brackets in Bear Grass
With 11 households falling in the category, the $50,000 to $74,999 income range is the most frequent in Bear Grass, accounting for 24.4% of all households.
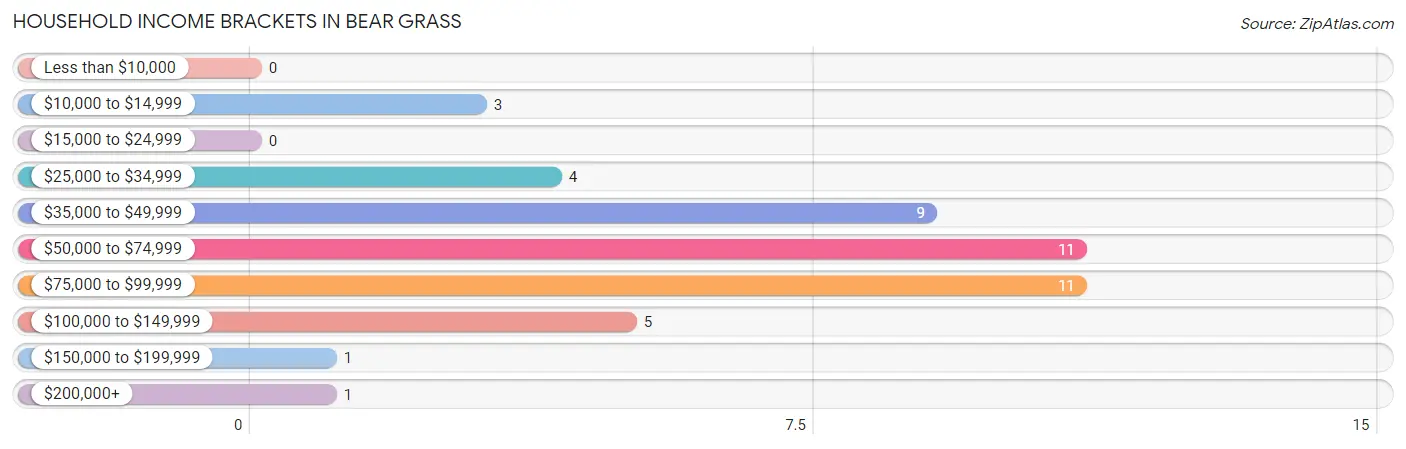
| Income Bracket | # Households | % Households |
| Less than $10,000 | 0 | 0.0% |
| $10,000 to $14,999 | 3 | 6.7% |
| $15,000 to $24,999 | 0 | 0.0% |
| $25,000 to $34,999 | 4 | 8.9% |
| $35,000 to $49,999 | 9 | 20.0% |
| $50,000 to $74,999 | 11 | 24.4% |
| $75,000 to $99,999 | 11 | 24.4% |
| $100,000 to $149,999 | 5 | 11.1% |
| $150,000 to $199,999 | 1 | 2.2% |
| $200,000+ | 1 | 2.2% |
Household Income by Householder Age in Bear Grass
The median household income in Bear Grass is $54,821, with the highest median household income of $85,000 found in the 25 to 44 years age bracket for the primary householder. A total of 20 households (44.4%) fall into this category. Meanwhile, the 15 to 24 years age bracket for the primary householder has the lowest median household income of $0, with 2 households (4.4%) in this group.

| Income Bracket | # Households | Median Income |
| 15 to 24 Years | 2 (4.4%) | $0 |
| 25 to 44 Years | 20 (44.4%) | $85,000 |
| 45 to 64 Years | 12 (26.7%) | $0 |
| 65+ Years | 11 (24.4%) | $0 |
| Total | 45 (100.0%) | $54,821 |
Poverty in Bear Grass
Income Below Poverty by Sex and Age in Bear Grass
With 41.1% poverty level for males and 3.6% for females among the residents of Bear Grass, 35 to 44 year old males and 55 to 64 year old females are the most vulnerable to poverty, with 15 males (93.8%) and 2 females (66.7%) in their respective age groups living below the poverty level.
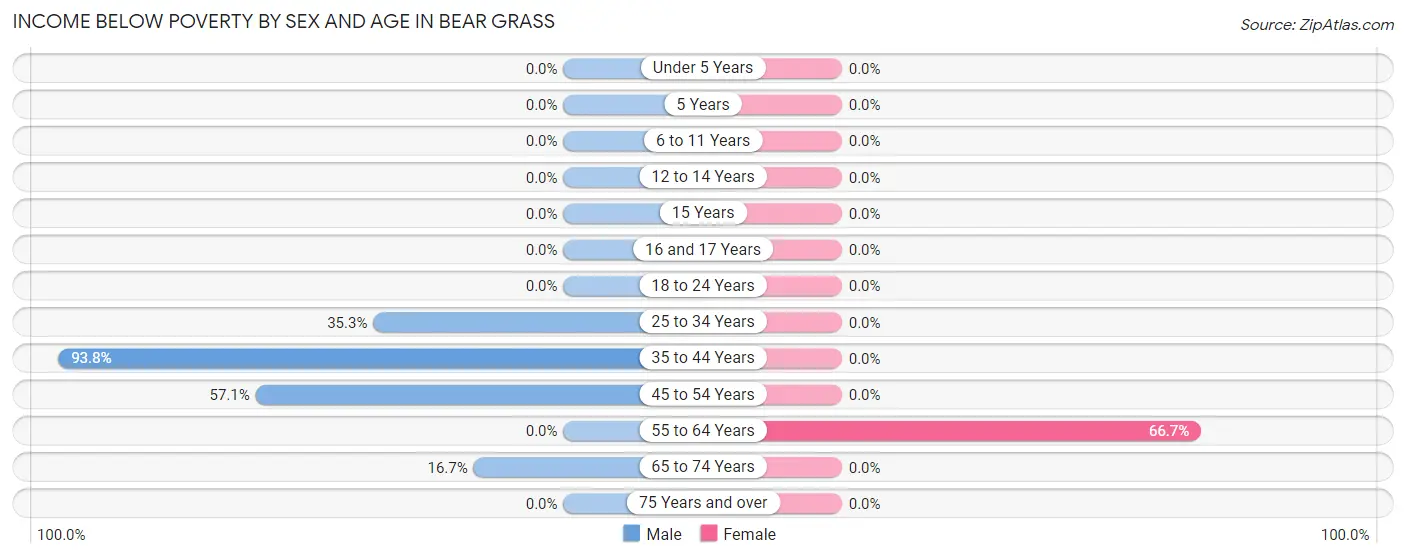
| Age Bracket | Male | Female |
| Under 5 Years | 0 (0.0%) | 0 (0.0%) |
| 5 Years | 0 (0.0%) | 0 (0.0%) |
| 6 to 11 Years | 0 (0.0%) | 0 (0.0%) |
| 12 to 14 Years | 0 (0.0%) | 0 (0.0%) |
| 15 Years | 0 (0.0%) | 0 (0.0%) |
| 16 and 17 Years | 0 (0.0%) | 0 (0.0%) |
| 18 to 24 Years | 0 (0.0%) | 0 (0.0%) |
| 25 to 34 Years | 6 (35.3%) | 0 (0.0%) |
| 35 to 44 Years | 15 (93.8%) | 0 (0.0%) |
| 45 to 54 Years | 8 (57.1%) | 0 (0.0%) |
| 55 to 64 Years | 0 (0.0%) | 2 (66.7%) |
| 65 to 74 Years | 1 (16.7%) | 0 (0.0%) |
| 75 Years and over | 0 (0.0%) | 0 (0.0%) |
| Total | 30 (41.1%) | 2 (3.6%) |
Income Above Poverty by Sex and Age in Bear Grass
According to the poverty statistics in Bear Grass, males aged under 5 years and females aged under 5 years are the age groups that are most secure financially, with 100.0% of males and 100.0% of females in these age groups living above the poverty line.
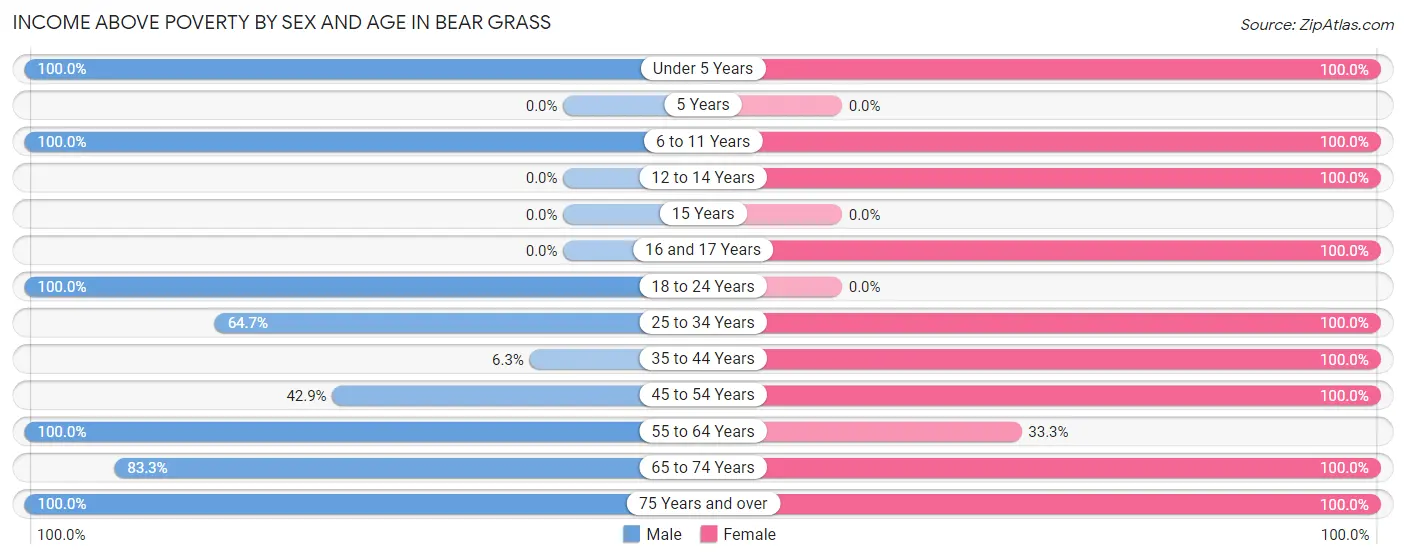
| Age Bracket | Male | Female |
| Under 5 Years | 8 (100.0%) | 16 (100.0%) |
| 5 Years | 0 (0.0%) | 0 (0.0%) |
| 6 to 11 Years | 1 (100.0%) | 2 (100.0%) |
| 12 to 14 Years | 0 (0.0%) | 2 (100.0%) |
| 15 Years | 0 (0.0%) | 0 (0.0%) |
| 16 and 17 Years | 0 (0.0%) | 2 (100.0%) |
| 18 to 24 Years | 4 (100.0%) | 0 (0.0%) |
| 25 to 34 Years | 11 (64.7%) | 9 (100.0%) |
| 35 to 44 Years | 1 (6.2%) | 10 (100.0%) |
| 45 to 54 Years | 6 (42.9%) | 6 (100.0%) |
| 55 to 64 Years | 4 (100.0%) | 1 (33.3%) |
| 65 to 74 Years | 5 (83.3%) | 3 (100.0%) |
| 75 Years and over | 3 (100.0%) | 3 (100.0%) |
| Total | 43 (58.9%) | 54 (96.4%) |
Income Below Poverty Among Married-Couple Families in Bear Grass
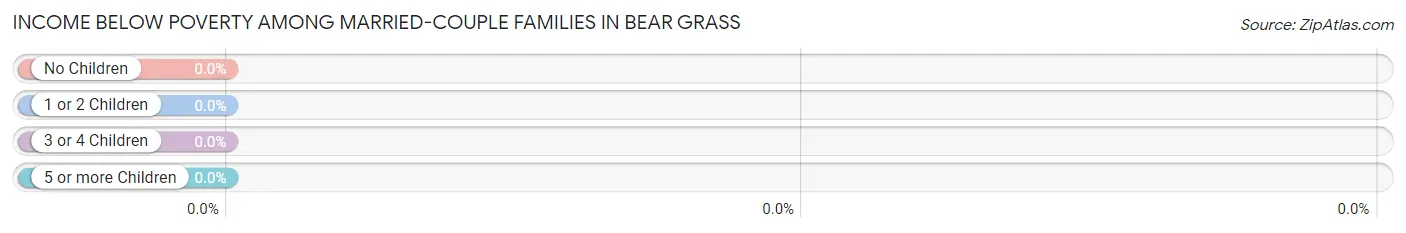
| Children | Above Poverty | Below Poverty |
| No Children | 9 (100.0%) | 0 (0.0%) |
| 1 or 2 Children | 8 (100.0%) | 0 (0.0%) |
| 3 or 4 Children | 3 (100.0%) | 0 (0.0%) |
| 5 or more Children | 0 (0.0%) | 0 (0.0%) |
| Total | 20 (100.0%) | 0 (0.0%) |
Income Below Poverty Among Single-Parent Households in Bear Grass
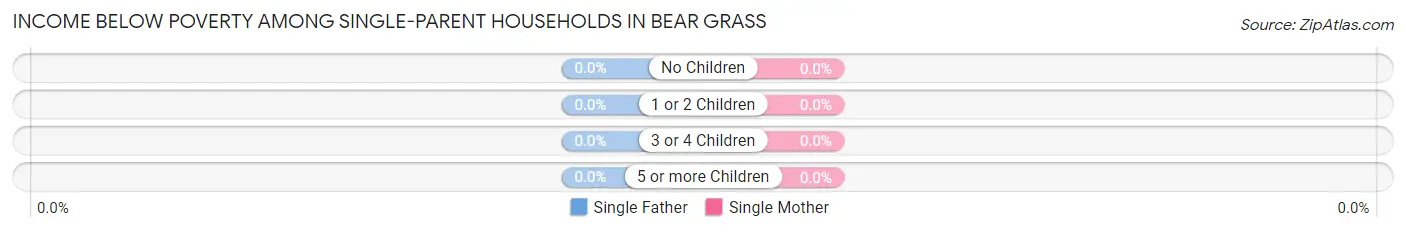
| Children | Single Father | Single Mother |
| No Children | 0 (0.0%) | 0 (0.0%) |
| 1 or 2 Children | 0 (0.0%) | 0 (0.0%) |
| 3 or 4 Children | 0 (0.0%) | 0 (0.0%) |
| 5 or more Children | 0 (0.0%) | 0 (0.0%) |
| Total | 0 (0.0%) | 0 (0.0%) |
Income Below Poverty Among Married-Couple vs Single-Parent Households in Bear Grass
| Children | Married-Couple Families | Single-Parent Households |
| No Children | 0 (0.0%) | 0 (0.0%) |
| 1 or 2 Children | 0 (0.0%) | 0 (0.0%) |
| 3 or 4 Children | 0 (0.0%) | 0 (0.0%) |
| 5 or more Children | 0 (0.0%) | 0 (0.0%) |
| Total | 0 (0.0%) | 0 (0.0%) |
Race in Bear Grass
The most populous races in Bear Grass are White / Caucasian (114 | 88.4%), Hispanic or Latino (15 | 11.6%), and Two or more Races (15 | 11.6%).
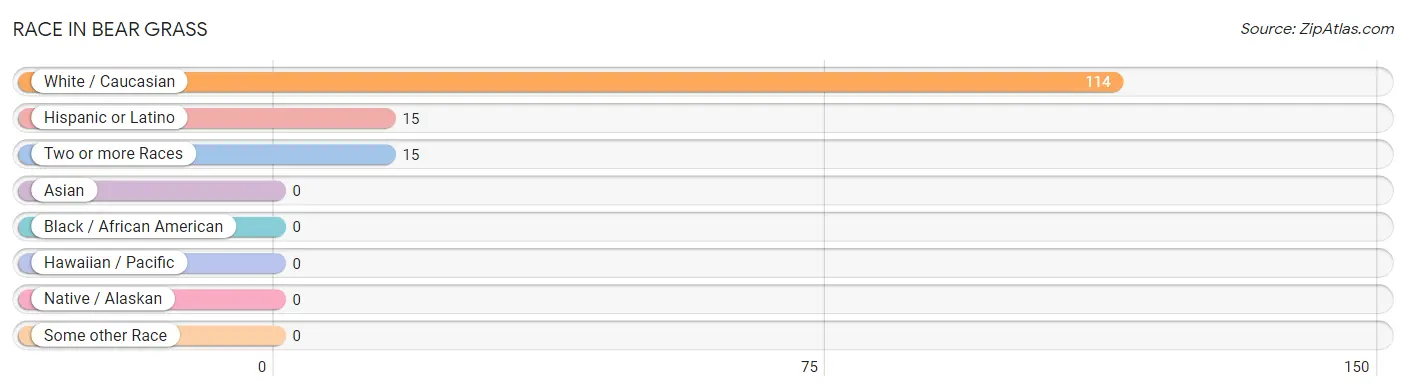
| Race | # Population | % Population |
| Asian | 0 | 0.0% |
| Black / African American | 0 | 0.0% |
| Hawaiian / Pacific | 0 | 0.0% |
| Hispanic or Latino | 15 | 11.6% |
| Native / Alaskan | 0 | 0.0% |
| White / Caucasian | 114 | 88.4% |
| Two or more Races | 15 | 11.6% |
| Some other Race | 0 | 0.0% |
| Total | 129 | 100.0% |
Ancestry in Bear Grass
The most populous ancestries reported in Bear Grass are American (32 | 24.8%), English (18 | 14.0%), Cherokee (15 | 11.6%), Puerto Rican (15 | 11.6%), and British (8 | 6.2%), together accounting for 68.2% of all Bear Grass residents.
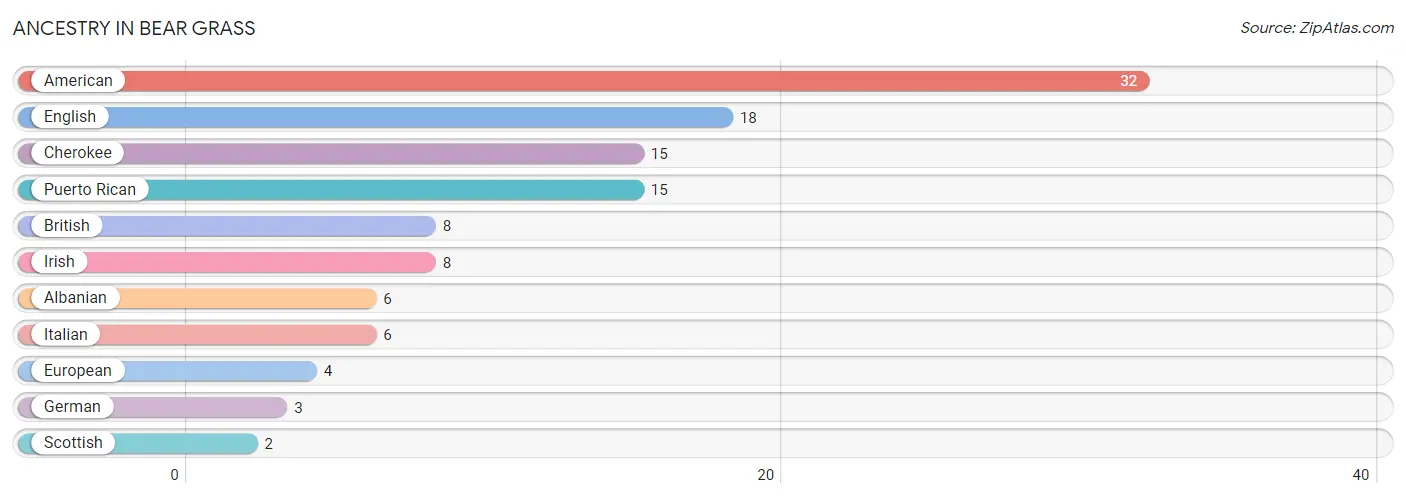
| Ancestry | # Population | % Population |
| Albanian | 6 | 4.6% |
| American | 32 | 24.8% |
| British | 8 | 6.2% |
| Cherokee | 15 | 11.6% |
| English | 18 | 14.0% |
| European | 4 | 3.1% |
| German | 3 | 2.3% |
| Irish | 8 | 6.2% |
| Italian | 6 | 4.6% |
| Puerto Rican | 15 | 11.6% |
| Scottish | 2 | 1.5% | View All 11 Rows |
Immigrants in Bear Grass

| Immigration Origin | # Population | % Population | View All 0 Rows |
Sex and Age in Bear Grass
Sex and Age in Bear Grass
The most populous age groups in Bear Grass are 35 to 39 Years (15 | 20.5%) for men and Under 5 Years (16 | 28.6%) for women.
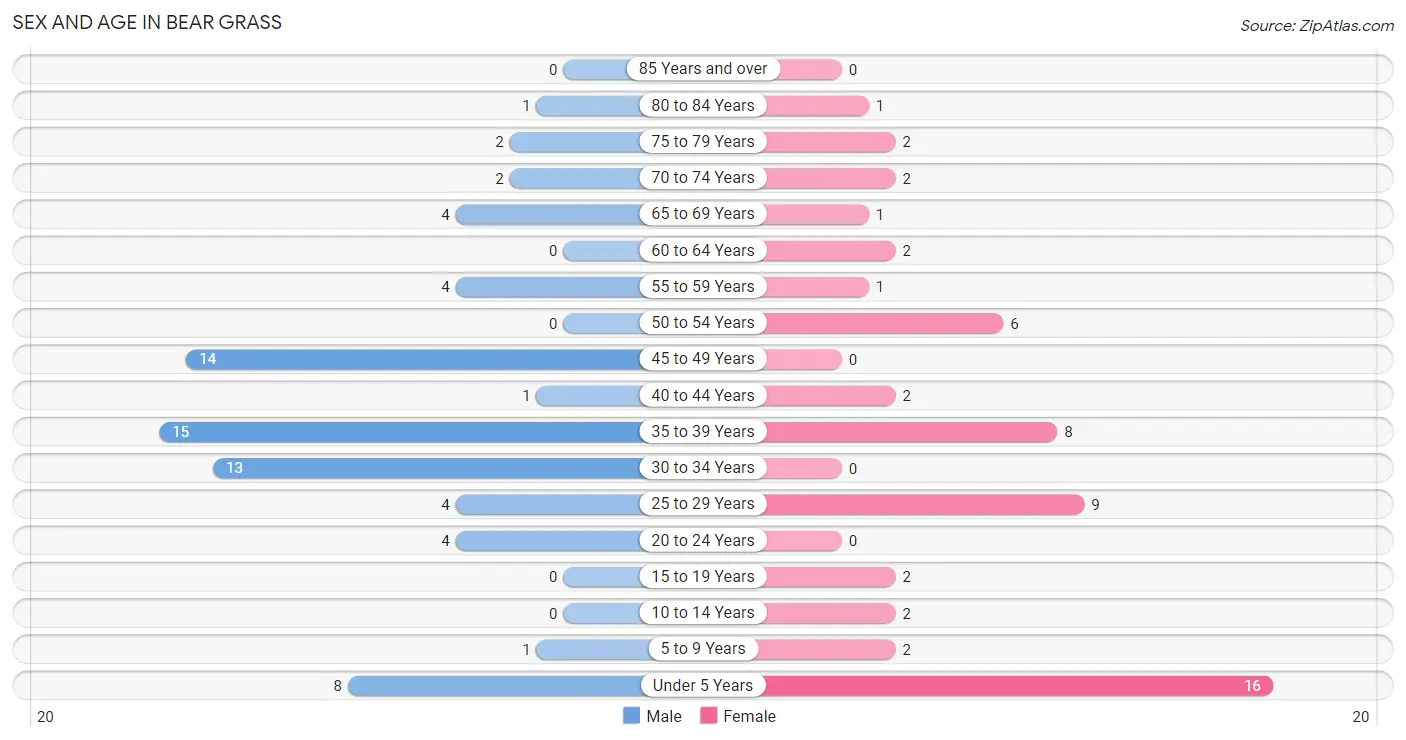
| Age Bracket | Male | Female |
| Under 5 Years | 8 (11.0%) | 16 (28.6%) |
| 5 to 9 Years | 1 (1.4%) | 2 (3.6%) |
| 10 to 14 Years | 0 (0.0%) | 2 (3.6%) |
| 15 to 19 Years | 0 (0.0%) | 2 (3.6%) |
| 20 to 24 Years | 4 (5.5%) | 0 (0.0%) |
| 25 to 29 Years | 4 (5.5%) | 9 (16.1%) |
| 30 to 34 Years | 13 (17.8%) | 0 (0.0%) |
| 35 to 39 Years | 15 (20.5%) | 8 (14.3%) |
| 40 to 44 Years | 1 (1.4%) | 2 (3.6%) |
| 45 to 49 Years | 14 (19.2%) | 0 (0.0%) |
| 50 to 54 Years | 0 (0.0%) | 6 (10.7%) |
| 55 to 59 Years | 4 (5.5%) | 1 (1.8%) |
| 60 to 64 Years | 0 (0.0%) | 2 (3.6%) |
| 65 to 69 Years | 4 (5.5%) | 1 (1.8%) |
| 70 to 74 Years | 2 (2.7%) | 2 (3.6%) |
| 75 to 79 Years | 2 (2.7%) | 2 (3.6%) |
| 80 to 84 Years | 1 (1.4%) | 1 (1.8%) |
| 85 Years and over | 0 (0.0%) | 0 (0.0%) |
| Total | 73 (100.0%) | 56 (100.0%) |
Families and Households in Bear Grass
Median Family Size in Bear Grass
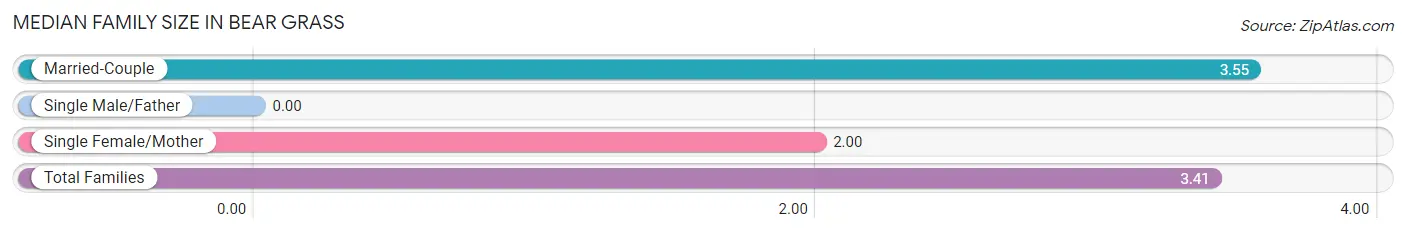
| Family Type | # Families | Family Size |
| Married-Couple | 20 (90.9%) | 3.55 |
| Single Male/Father | 0 (0.0%) | - |
| Single Female/Mother | 2 (9.1%) | 2.00 |
| Total Families | 22 (100.0%) | 3.41 |
Median Household Size in Bear Grass
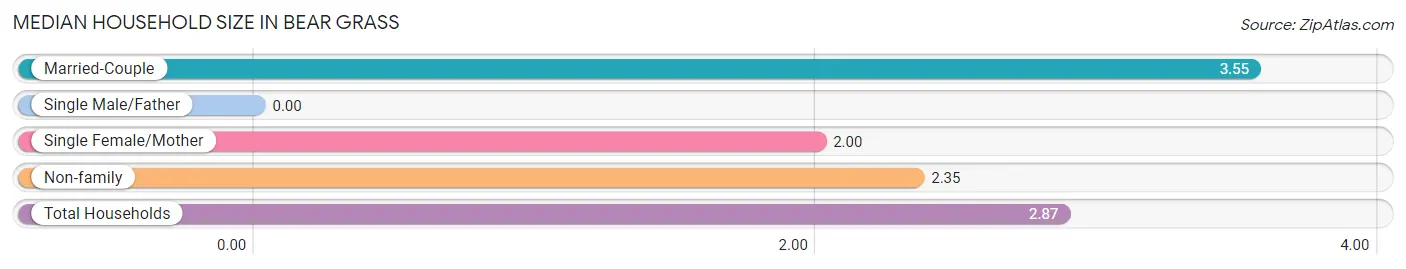
| Household Type | # Households | Household Size |
| Married-Couple | 20 (44.4%) | 3.55 |
| Single Male/Father | 0 (0.0%) | - |
| Single Female/Mother | 2 (4.4%) | 2.00 |
| Non-family | 23 (51.1%) | 2.35 |
| Total Households | 45 (100.0%) | 2.87 |
Household Size by Marriage Status in Bear Grass
Out of a total of 45 households in Bear Grass, 22 (48.9%) are family households, while 23 (51.1%) are nonfamily households. The most numerous type of family households are 2-person households, comprising 11, and the most common type of nonfamily households are 1-person households, comprising 17.
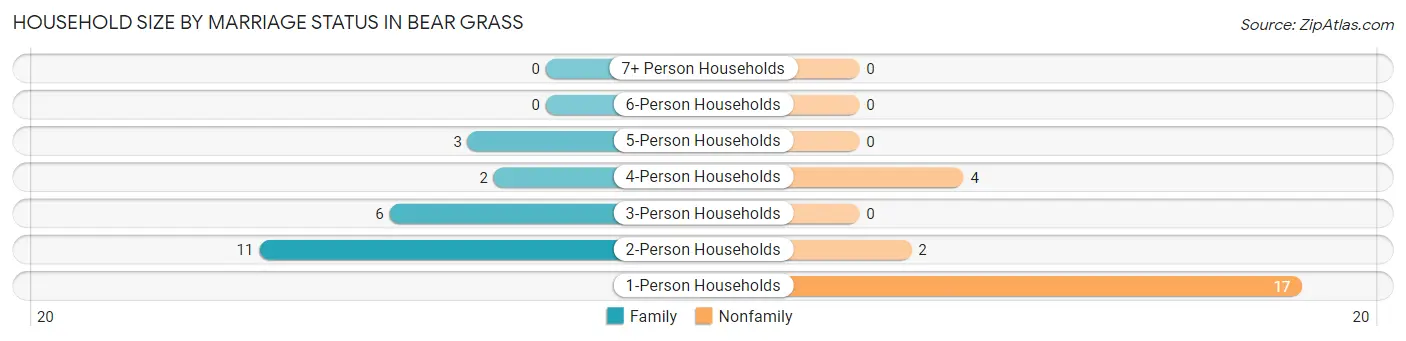
| Household Size | Family Households | Nonfamily Households |
| 1-Person Households | - | 17 (37.8%) |
| 2-Person Households | 11 (24.4%) | 2 (4.4%) |
| 3-Person Households | 6 (13.3%) | 0 (0.0%) |
| 4-Person Households | 2 (4.4%) | 4 (8.9%) |
| 5-Person Households | 3 (6.7%) | 0 (0.0%) |
| 6-Person Households | 0 (0.0%) | 0 (0.0%) |
| 7+ Person Households | 0 (0.0%) | 0 (0.0%) |
| Total | 22 (48.9%) | 23 (51.1%) |
Female Fertility in Bear Grass
Fertility by Age in Bear Grass
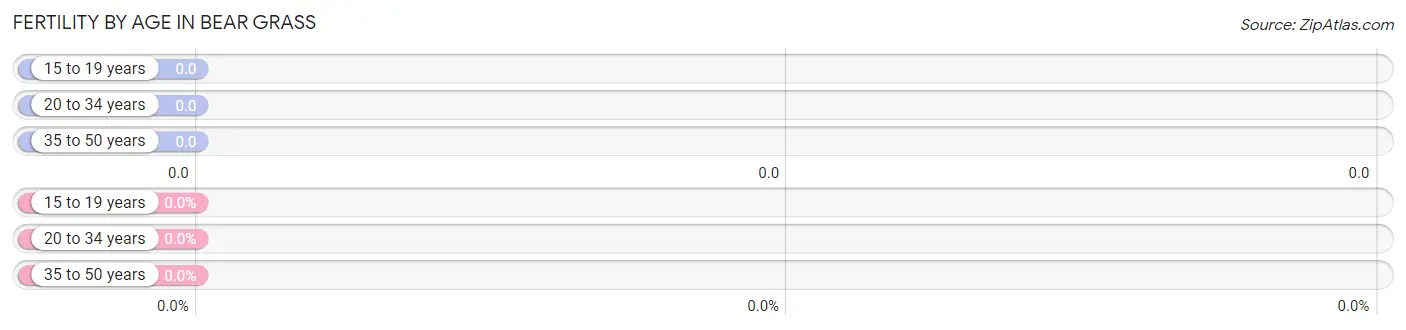
| Age Bracket | Women with Births | Births / 1,000 Women |
| 15 to 19 years | 0 (0.0%) | 0.0 |
| 20 to 34 years | 0 (0.0%) | 0.0 |
| 35 to 50 years | 0 (0.0%) | 0.0 |
| Total | 0 (0.0%) | 0.0 |
Fertility by Age by Marriage Status in Bear Grass
| Age Bracket | Married | Unmarried |
| 15 to 19 years | 0 (0.0%) | 0 (0.0%) |
| 20 to 34 years | 0 (0.0%) | 0 (0.0%) |
| 35 to 50 years | 0 (0.0%) | 0 (0.0%) |
| Total | 0 (0.0%) | 0 (0.0%) |
Fertility by Education in Bear Grass
| Educational Attainment | Women with Births | Births / 1,000 Women |
| Less than High School | 0 (0.0%) | 0.0 |
| High School Diploma | 0 (0.0%) | 0.0 |
| College or Associate's Degree | 0 (0.0%) | 0.0 |
| Bachelor's Degree | 0 (0.0%) | 0.0 |
| Graduate Degree | 0 (0.0%) | 0.0 |
| Total | 0 (0.0%) | 0.0 |
Fertility by Education by Marriage Status in Bear Grass
| Educational Attainment | Married | Unmarried |
| Less than High School | 0 (0.0%) | 0 (0.0%) |
| High School Diploma | 0 (0.0%) | 0 (0.0%) |
| College or Associate's Degree | 0 (0.0%) | 0 (0.0%) |
| Bachelor's Degree | 0 (0.0%) | 0 (0.0%) |
| Graduate Degree | 0 (0.0%) | 0 (0.0%) |
| Total | 0 (0.0%) | 0 (0.0%) |
Employment Characteristics in Bear Grass
Employment by Class of Employer in Bear Grass
Among the 50 employed individuals in Bear Grass, private company employees (37 | 74.0%), state government employees (6 | 12.0%), and local government employees (4 | 8.0%) make up the most common classes of employment.
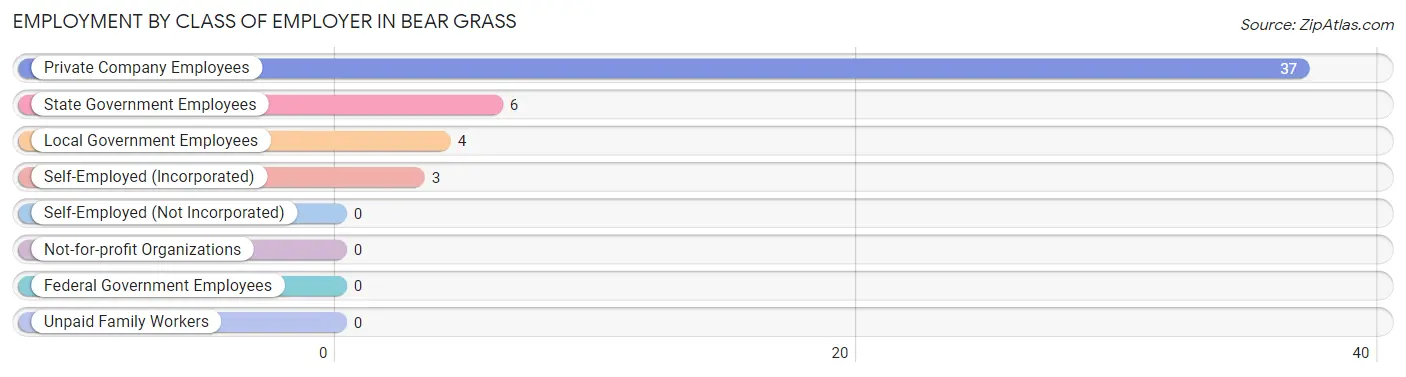
| Employer Class | # Employees | % Employees |
| Private Company Employees | 37 | 74.0% |
| Self-Employed (Incorporated) | 3 | 6.0% |
| Self-Employed (Not Incorporated) | 0 | 0.0% |
| Not-for-profit Organizations | 0 | 0.0% |
| Local Government Employees | 4 | 8.0% |
| State Government Employees | 6 | 12.0% |
| Federal Government Employees | 0 | 0.0% |
| Unpaid Family Workers | 0 | 0.0% |
| Total | 50 | 100.0% |
Employment Status by Age in Bear Grass
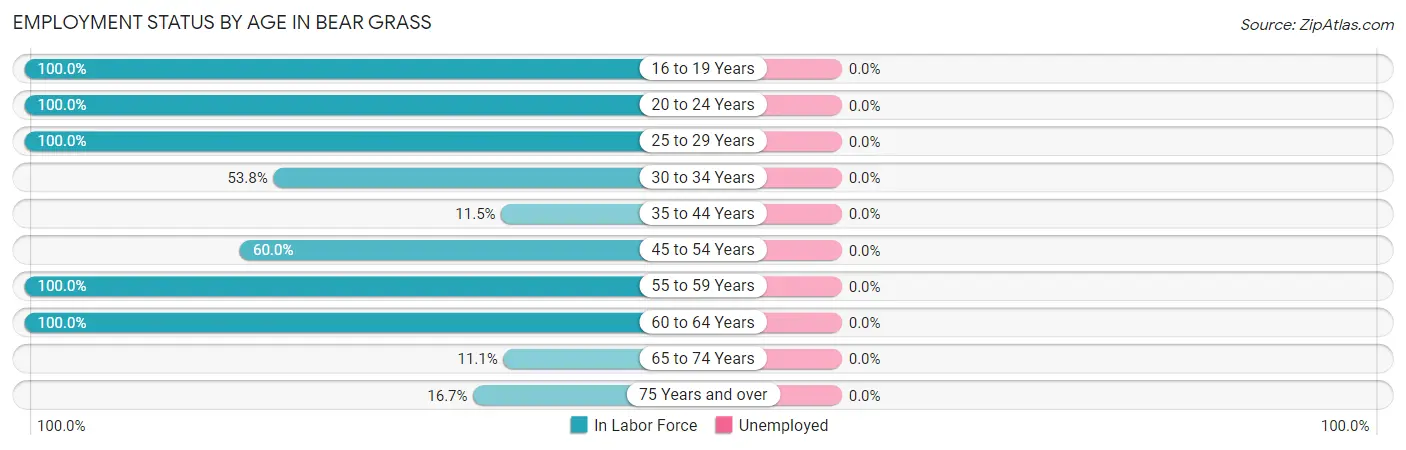
| Age Bracket | In Labor Force | Unemployed |
| 16 to 19 Years | 2 (100.0%) | 0 (0.0%) |
| 20 to 24 Years | 4 (100.0%) | 0 (0.0%) |
| 25 to 29 Years | 13 (100.0%) | 0 (0.0%) |
| 30 to 34 Years | 7 (53.8%) | 0 (0.0%) |
| 35 to 44 Years | 3 (11.5%) | 0 (0.0%) |
| 45 to 54 Years | 12 (60.0%) | 0 (0.0%) |
| 55 to 59 Years | 5 (100.0%) | 0 (0.0%) |
| 60 to 64 Years | 2 (100.0%) | 0 (0.0%) |
| 65 to 74 Years | 1 (11.1%) | 0 (0.0%) |
| 75 Years and over | 1 (16.7%) | 0 (0.0%) |
| Total | 50 (50.0%) | 0 (0.0%) |
Employment Status by Educational Attainment in Bear Grass
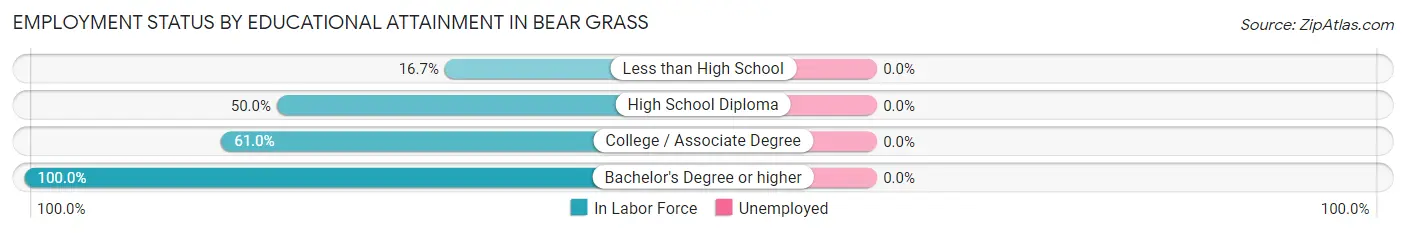
| Educational Attainment | In Labor Force | Unemployed |
| Less than High School | 3 (16.7%) | 0 (0.0%) |
| High School Diploma | 6 (50.0%) | 0 (0.0%) |
| College / Associate Degree | 25 (61.0%) | 0 (0.0%) |
| Bachelor's Degree or higher | 8 (100.0%) | 0 (0.0%) |
| Total | 42 (53.2%) | 0 (0.0%) |
Employment Occupations by Sex in Bear Grass
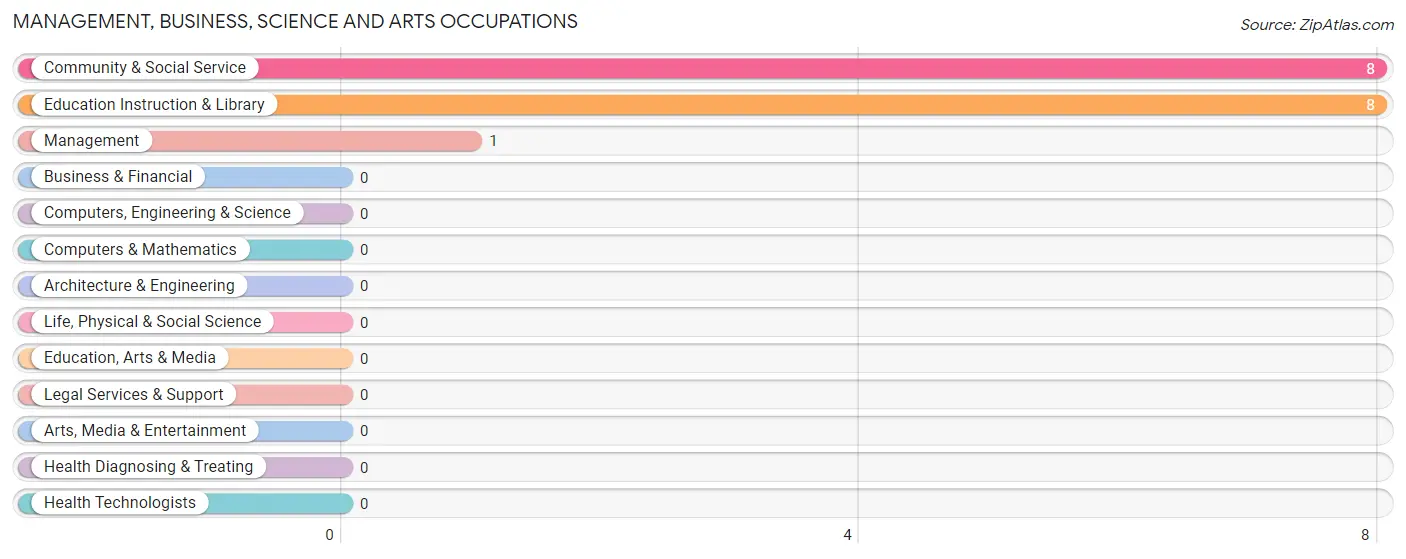
Management, Business, Science and Arts Occupations
The most common Management, Business, Science and Arts occupations in Bear Grass are Community & Social Service (8 | 16.0%), Education Instruction & Library (8 | 16.0%), and Management (1 | 2.0%).
Management, Business, Science and Arts Occupations by Sex
Within the Management, Business, Science and Arts occupations in Bear Grass, the most male-oriented occupations are Management (100.0%), Community & Social Service (50.0%), and Education Instruction & Library (50.0%), while the most female-oriented occupations are Community & Social Service (50.0%), and Education Instruction & Library (50.0%).
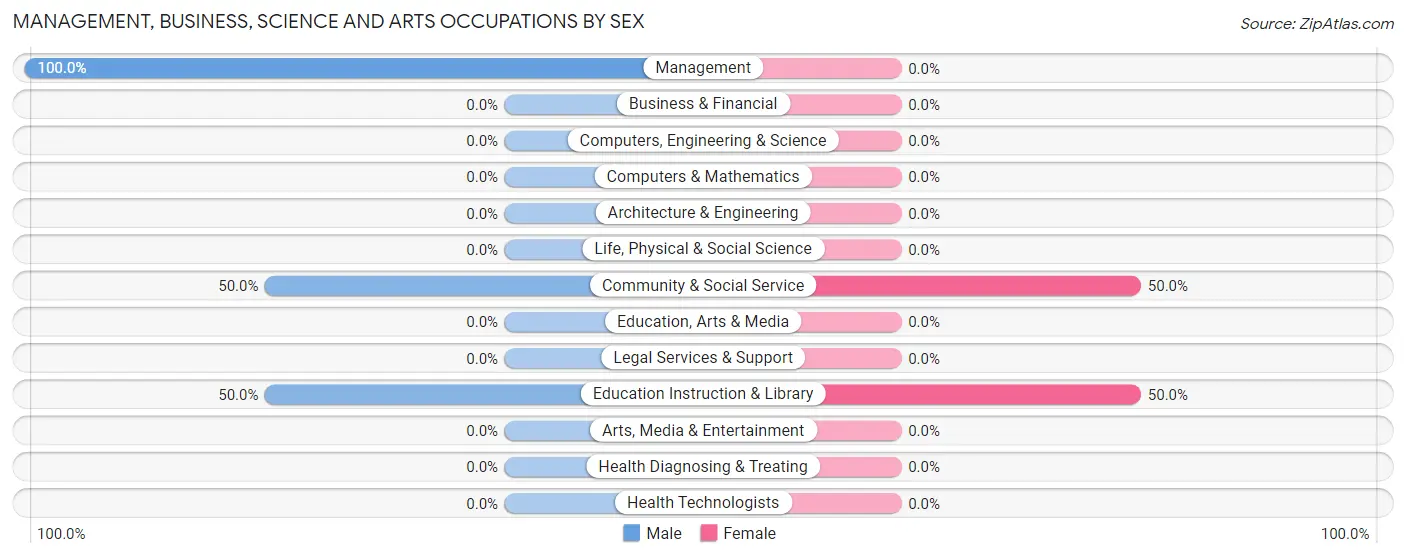
| Occupation | Male | Female |
| Management | 1 (100.0%) | 0 (0.0%) |
| Business & Financial | 0 (0.0%) | 0 (0.0%) |
| Computers, Engineering & Science | 0 (0.0%) | 0 (0.0%) |
| Computers & Mathematics | 0 (0.0%) | 0 (0.0%) |
| Architecture & Engineering | 0 (0.0%) | 0 (0.0%) |
| Life, Physical & Social Science | 0 (0.0%) | 0 (0.0%) |
| Community & Social Service | 4 (50.0%) | 4 (50.0%) |
| Education, Arts & Media | 0 (0.0%) | 0 (0.0%) |
| Legal Services & Support | 0 (0.0%) | 0 (0.0%) |
| Education Instruction & Library | 4 (50.0%) | 4 (50.0%) |
| Arts, Media & Entertainment | 0 (0.0%) | 0 (0.0%) |
| Health Diagnosing & Treating | 0 (0.0%) | 0 (0.0%) |
| Health Technologists | 0 (0.0%) | 0 (0.0%) |
| Total (Category) | 5 (55.6%) | 4 (44.4%) |
| Total (Overall) | 27 (54.0%) | 23 (46.0%) |
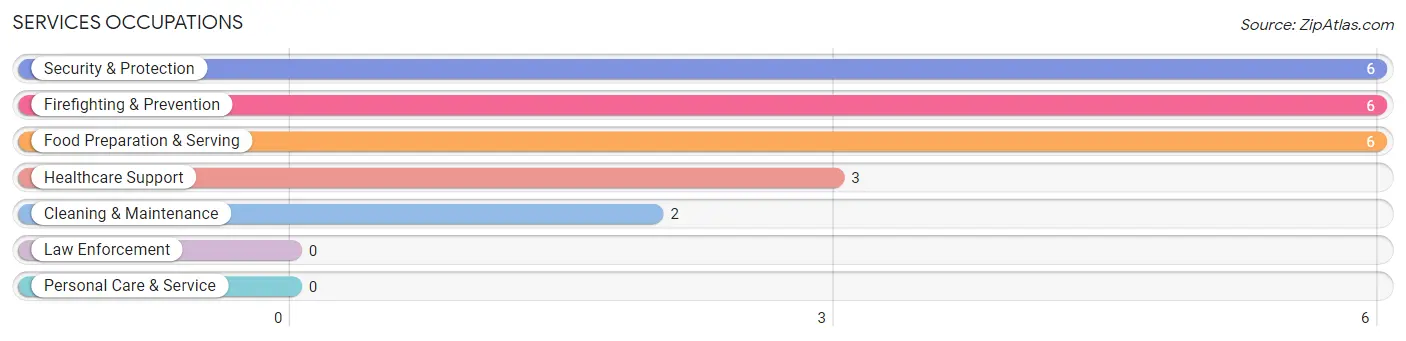
Services Occupations
The most common Services occupations in Bear Grass are Security & Protection (6 | 12.0%), Firefighting & Prevention (6 | 12.0%), Food Preparation & Serving (6 | 12.0%), Healthcare Support (3 | 6.0%), and Cleaning & Maintenance (2 | 4.0%).
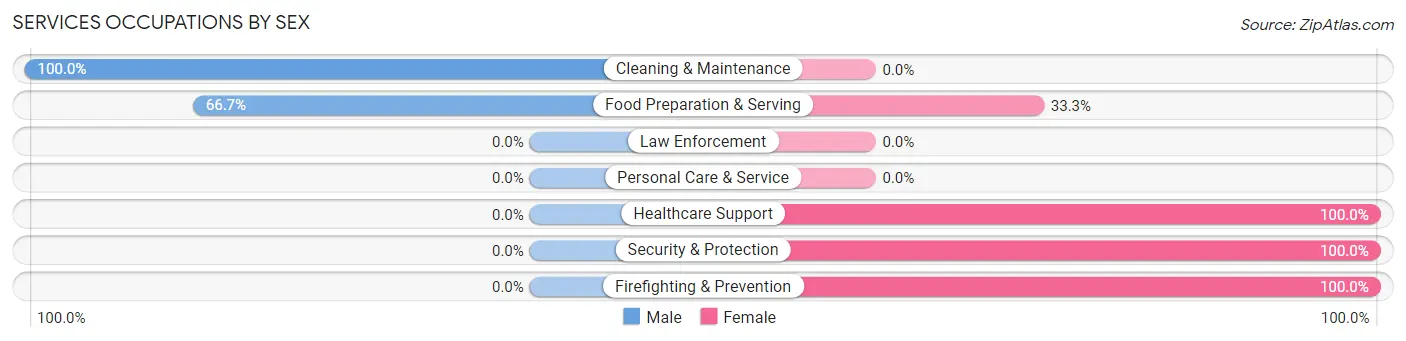
Services Occupations by Sex
Within the Services occupations in Bear Grass, the most male-oriented occupations are Cleaning & Maintenance (100.0%), and Food Preparation & Serving (66.7%), while the most female-oriented occupations are Healthcare Support (100.0%), Security & Protection (100.0%), and Firefighting & Prevention (100.0%).
| Occupation | Male | Female |
| Healthcare Support | 0 (0.0%) | 3 (100.0%) |
| Security & Protection | 0 (0.0%) | 6 (100.0%) |
| Firefighting & Prevention | 0 (0.0%) | 6 (100.0%) |
| Law Enforcement | 0 (0.0%) | 0 (0.0%) |
| Food Preparation & Serving | 4 (66.7%) | 2 (33.3%) |
| Cleaning & Maintenance | 2 (100.0%) | 0 (0.0%) |
| Personal Care & Service | 0 (0.0%) | 0 (0.0%) |
| Total (Category) | 6 (35.3%) | 11 (64.7%) |
| Total (Overall) | 27 (54.0%) | 23 (46.0%) |
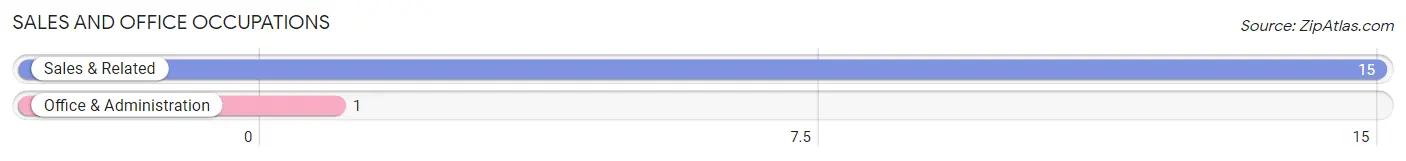
Sales and Office Occupations
The most common Sales and Office occupations in Bear Grass are Sales & Related (15 | 30.0%), and Office & Administration (1 | 2.0%).
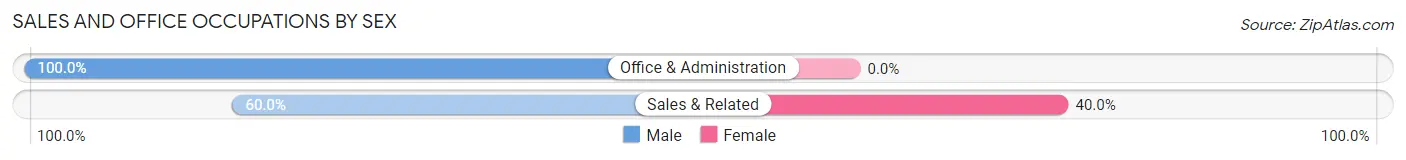
Sales and Office Occupations by Sex
| Occupation | Male | Female |
| Sales & Related | 9 (60.0%) | 6 (40.0%) |
| Office & Administration | 1 (100.0%) | 0 (0.0%) |
| Total (Category) | 10 (62.5%) | 6 (37.5%) |
| Total (Overall) | 27 (54.0%) | 23 (46.0%) |
Natural Resources, Construction and Maintenance Occupations
The most common Natural Resources, Construction and Maintenance occupations in Bear Grass are , and Installation, Maintenance & Repair (2 | 4.0%).
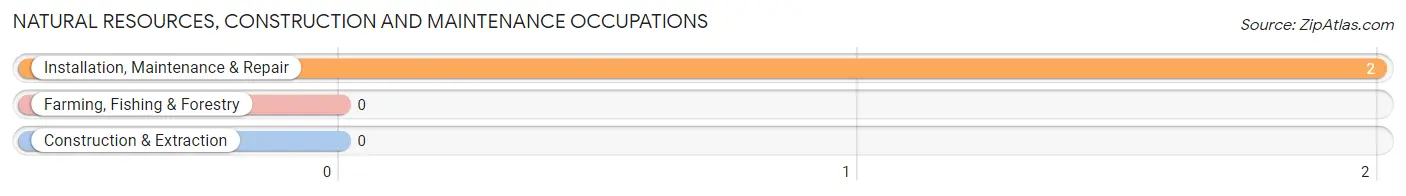
Natural Resources, Construction and Maintenance Occupations by Sex
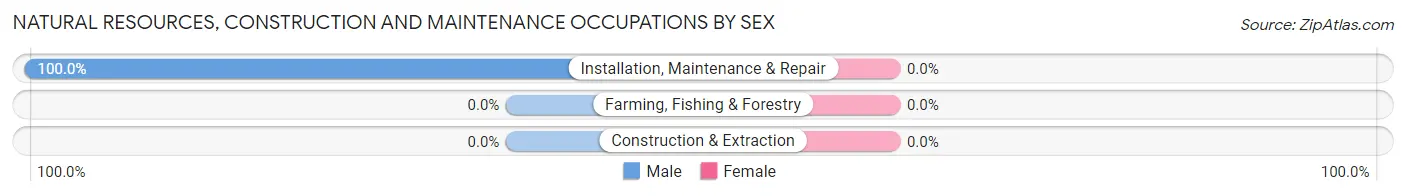
| Occupation | Male | Female |
| Farming, Fishing & Forestry | 0 (0.0%) | 0 (0.0%) |
| Construction & Extraction | 0 (0.0%) | 0 (0.0%) |
| Installation, Maintenance & Repair | 2 (100.0%) | 0 (0.0%) |
| Total (Category) | 2 (100.0%) | 0 (0.0%) |
| Total (Overall) | 27 (54.0%) | 23 (46.0%) |
Production, Transportation and Moving Occupations
The most common Production, Transportation and Moving occupations in Bear Grass are , and Production (6 | 12.0%).
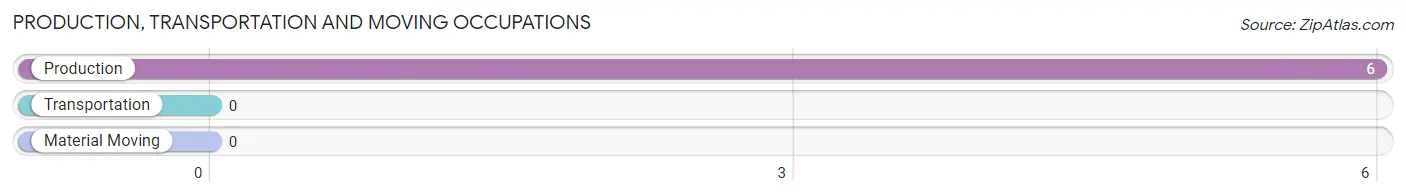
Production, Transportation and Moving Occupations by Sex
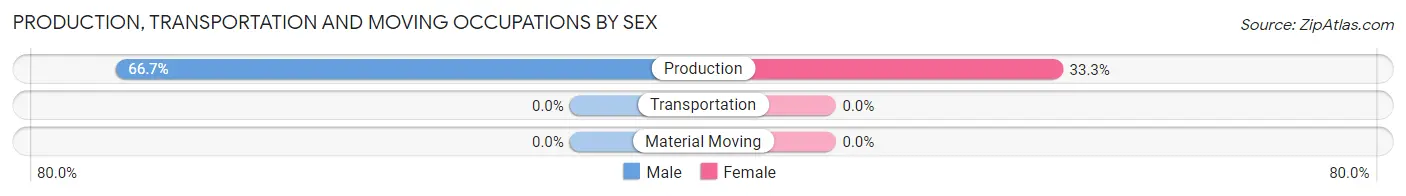
| Occupation | Male | Female |
| Production | 4 (66.7%) | 2 (33.3%) |
| Transportation | 0 (0.0%) | 0 (0.0%) |
| Material Moving | 0 (0.0%) | 0 (0.0%) |
| Total (Category) | 4 (66.7%) | 2 (33.3%) |
| Total (Overall) | 27 (54.0%) | 23 (46.0%) |
Employment Industries by Sex in Bear Grass
Employment Industries in Bear Grass
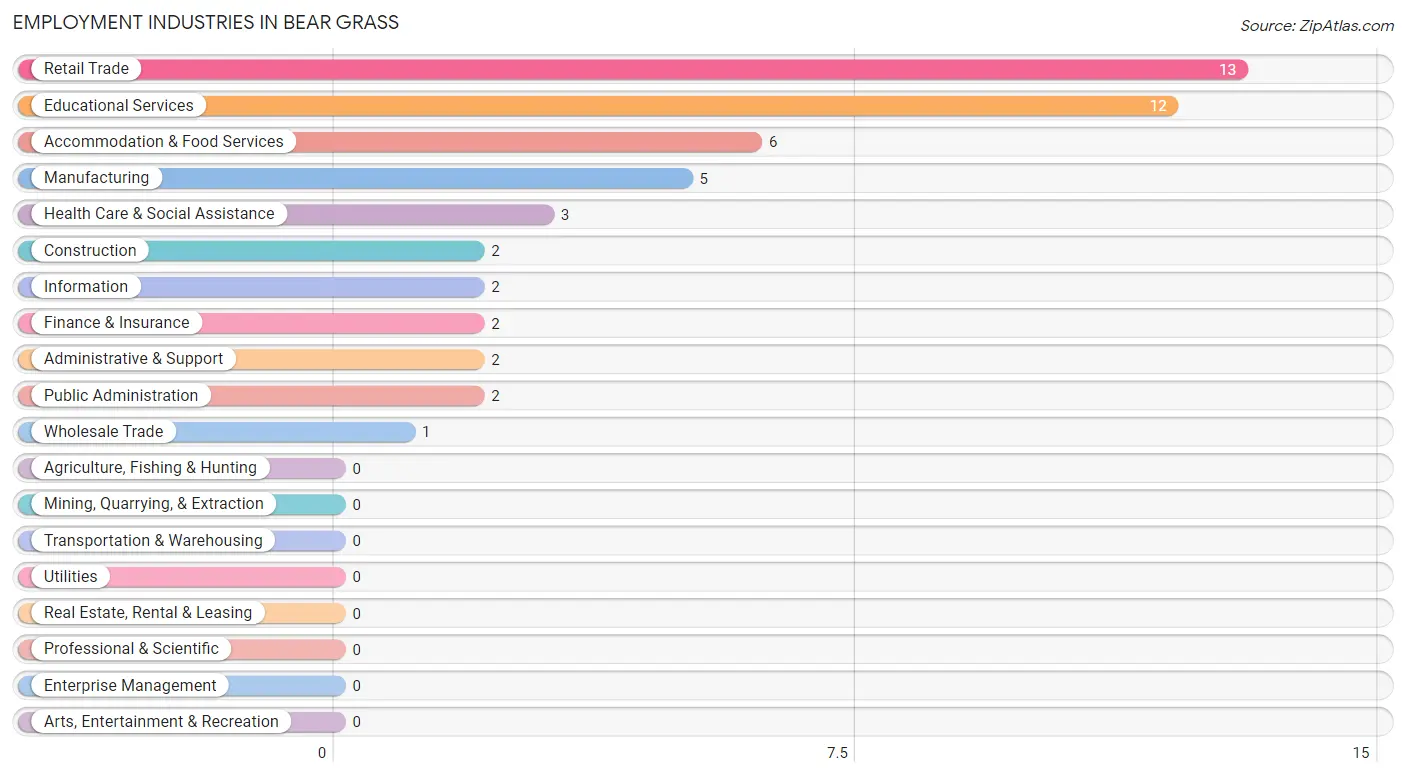
The major employment industries in Bear Grass include Retail Trade (13 | 26.0%), Educational Services (12 | 24.0%), Accommodation & Food Services (6 | 12.0%), Manufacturing (5 | 10.0%), and Health Care & Social Assistance (3 | 6.0%).
Employment Industries by Sex in Bear Grass
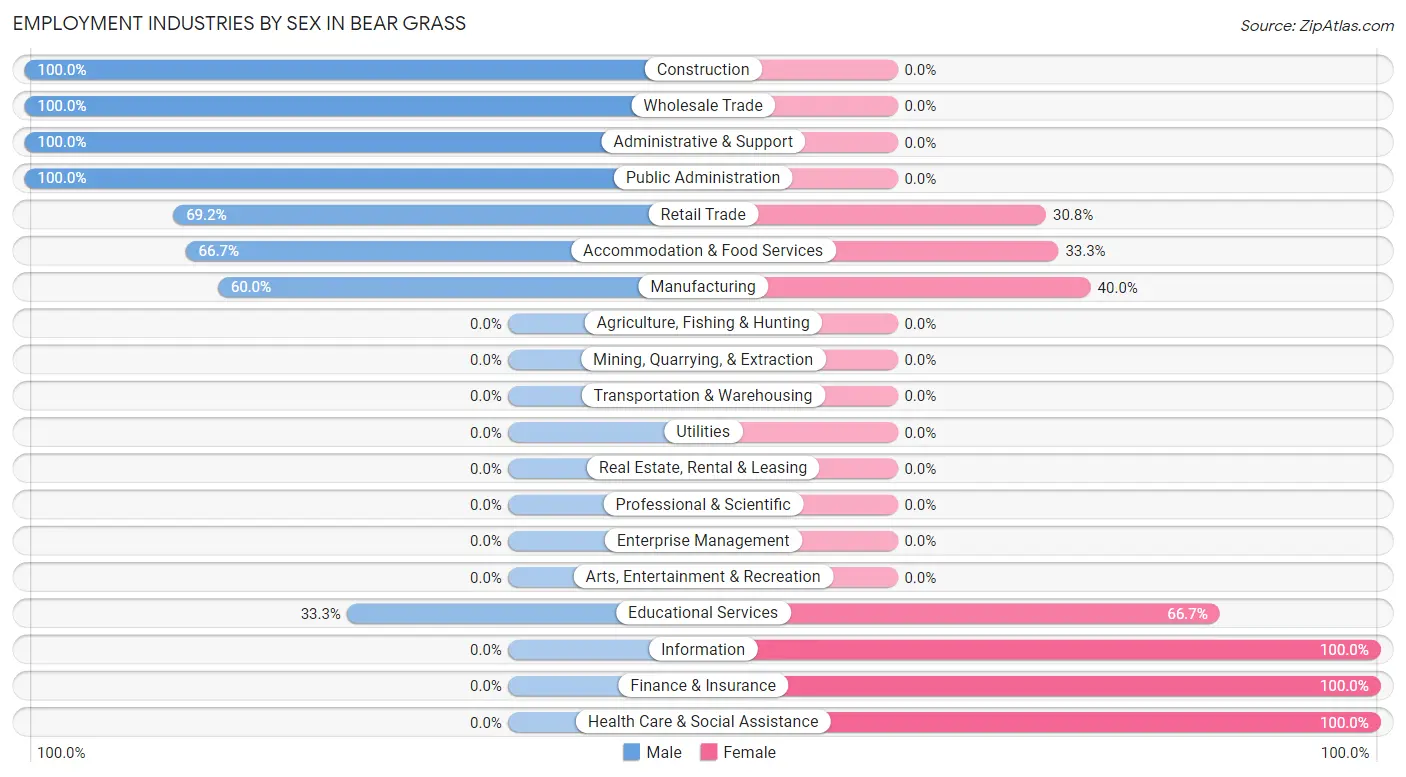
The Bear Grass industries that see more men than women are Construction (100.0%), Wholesale Trade (100.0%), and Administrative & Support (100.0%), whereas the industries that tend to have a higher number of women are Information (100.0%), Finance & Insurance (100.0%), and Health Care & Social Assistance (100.0%).
| Industry | Male | Female |
| Agriculture, Fishing & Hunting | 0 (0.0%) | 0 (0.0%) |
| Mining, Quarrying, & Extraction | 0 (0.0%) | 0 (0.0%) |
| Construction | 2 (100.0%) | 0 (0.0%) |
| Manufacturing | 3 (60.0%) | 2 (40.0%) |
| Wholesale Trade | 1 (100.0%) | 0 (0.0%) |
| Retail Trade | 9 (69.2%) | 4 (30.8%) |
| Transportation & Warehousing | 0 (0.0%) | 0 (0.0%) |
| Utilities | 0 (0.0%) | 0 (0.0%) |
| Information | 0 (0.0%) | 2 (100.0%) |
| Finance & Insurance | 0 (0.0%) | 2 (100.0%) |
| Real Estate, Rental & Leasing | 0 (0.0%) | 0 (0.0%) |
| Professional & Scientific | 0 (0.0%) | 0 (0.0%) |
| Enterprise Management | 0 (0.0%) | 0 (0.0%) |
| Administrative & Support | 2 (100.0%) | 0 (0.0%) |
| Educational Services | 4 (33.3%) | 8 (66.7%) |
| Health Care & Social Assistance | 0 (0.0%) | 3 (100.0%) |
| Arts, Entertainment & Recreation | 0 (0.0%) | 0 (0.0%) |
| Accommodation & Food Services | 4 (66.7%) | 2 (33.3%) |
| Public Administration | 2 (100.0%) | 0 (0.0%) |
| Total | 27 (54.0%) | 23 (46.0%) |
Education in Bear Grass
School Enrollment in Bear Grass
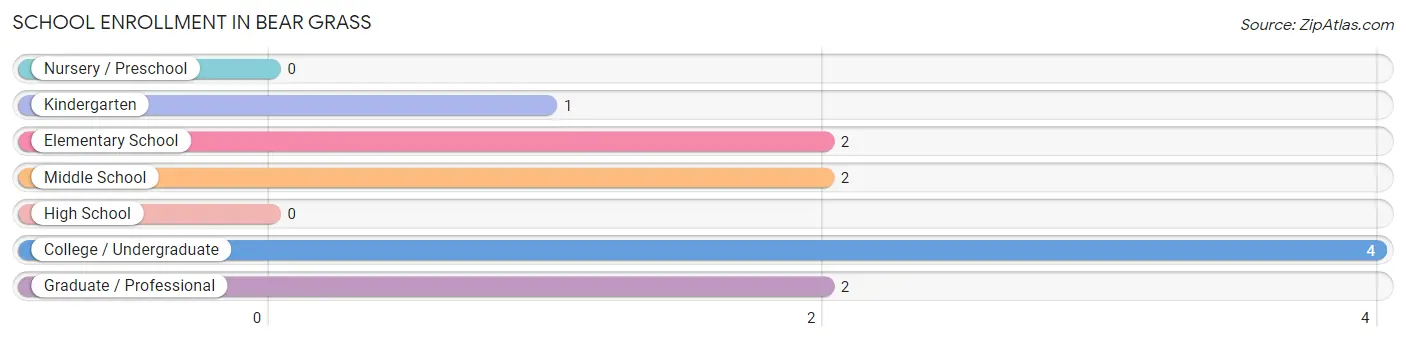
The most common levels of schooling among the 11 students in Bear Grass are college / undergraduate (4 | 36.4%), elementary school (2 | 18.2%), and middle school (2 | 18.2%).
| School Level | # Students | % Students |
| Nursery / Preschool | 0 | 0.0% |
| Kindergarten | 1 | 9.1% |
| Elementary School | 2 | 18.2% |
| Middle School | 2 | 18.2% |
| High School | 0 | 0.0% |
| College / Undergraduate | 4 | 36.4% |
| Graduate / Professional | 2 | 18.2% |
| Total | 11 | 100.0% |
School Enrollment by Age by Funding Source in Bear Grass
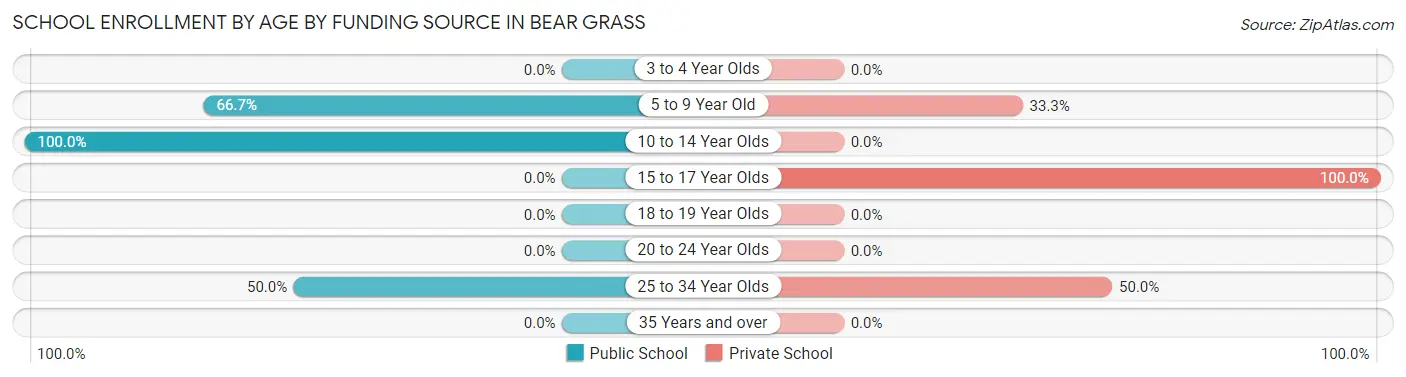
Out of a total of 11 students who are enrolled in schools in Bear Grass, 5 (45.5%) attend a private institution, while the remaining 6 (54.5%) are enrolled in public schools. The age group of 15 to 17 year olds has the highest likelihood of being enrolled in private schools, with 2 (100.0% in the age bracket) enrolled. Conversely, the age group of 10 to 14 year olds has the lowest likelihood of being enrolled in a private school, with 2 (100.0% in the age bracket) attending a public institution.
| Age Bracket | Public School | Private School |
| 3 to 4 Year Olds | 0 (0.0%) | 0 (0.0%) |
| 5 to 9 Year Old | 2 (66.7%) | 1 (33.3%) |
| 10 to 14 Year Olds | 2 (100.0%) | 0 (0.0%) |
| 15 to 17 Year Olds | 0 (0.0%) | 2 (100.0%) |
| 18 to 19 Year Olds | 0 (0.0%) | 0 (0.0%) |
| 20 to 24 Year Olds | 0 (0.0%) | 0 (0.0%) |
| 25 to 34 Year Olds | 2 (50.0%) | 2 (50.0%) |
| 35 Years and over | 0 (0.0%) | 0 (0.0%) |
| Total | 6 (54.5%) | 5 (45.5%) |
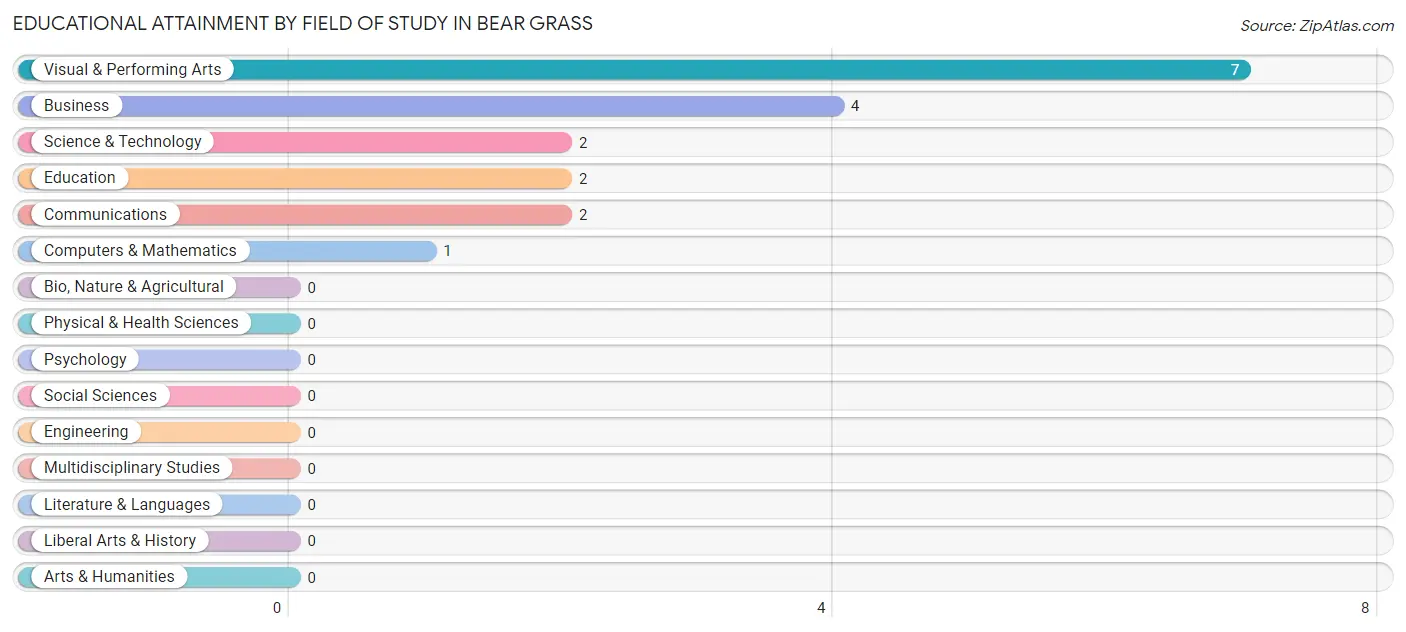
Educational Attainment by Field of Study in Bear Grass
Visual & performing arts (7 | 38.9%), business (4 | 22.2%), science & technology (2 | 11.1%), education (2 | 11.1%), and communications (2 | 11.1%) are the most common fields of study among 18 individuals in Bear Grass who have obtained a bachelor's degree or higher.
| Field of Study | # Graduates | % Graduates |
| Computers & Mathematics | 1 | 5.6% |
| Bio, Nature & Agricultural | 0 | 0.0% |
| Physical & Health Sciences | 0 | 0.0% |
| Psychology | 0 | 0.0% |
| Social Sciences | 0 | 0.0% |
| Engineering | 0 | 0.0% |
| Multidisciplinary Studies | 0 | 0.0% |
| Science & Technology | 2 | 11.1% |
| Business | 4 | 22.2% |
| Education | 2 | 11.1% |
| Literature & Languages | 0 | 0.0% |
| Liberal Arts & History | 0 | 0.0% |
| Visual & Performing Arts | 7 | 38.9% |
| Communications | 2 | 11.1% |
| Arts & Humanities | 0 | 0.0% |
| Total | 18 | 100.0% |
Transportation & Commute in Bear Grass
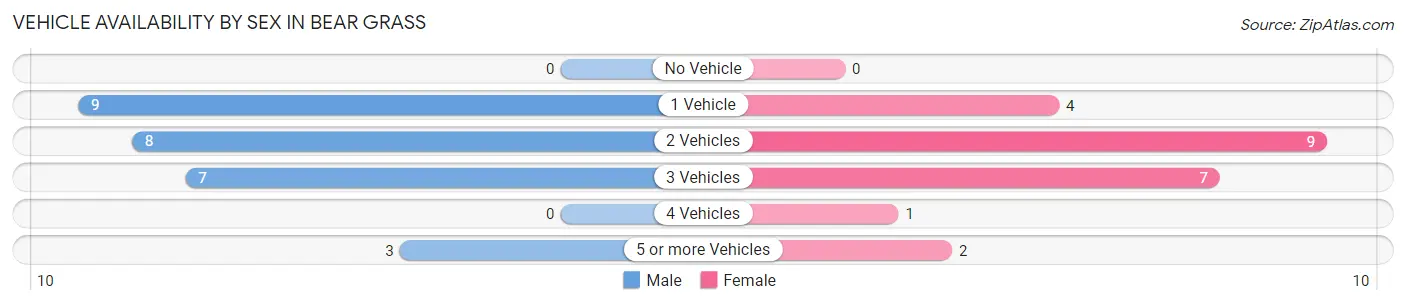
Vehicle Availability by Sex in Bear Grass
The most prevalent vehicle ownership categories in Bear Grass are males with 1 vehicle (9, accounting for 33.3%) and females with 1 vehicle (4, making up 39.1%).
| Vehicles Available | Male | Female |
| No Vehicle | 0 (0.0%) | 0 (0.0%) |
| 1 Vehicle | 9 (33.3%) | 4 (17.4%) |
| 2 Vehicles | 8 (29.6%) | 9 (39.1%) |
| 3 Vehicles | 7 (25.9%) | 7 (30.4%) |
| 4 Vehicles | 0 (0.0%) | 1 (4.3%) |
| 5 or more Vehicles | 3 (11.1%) | 2 (8.7%) |
| Total | 27 (100.0%) | 23 (100.0%) |
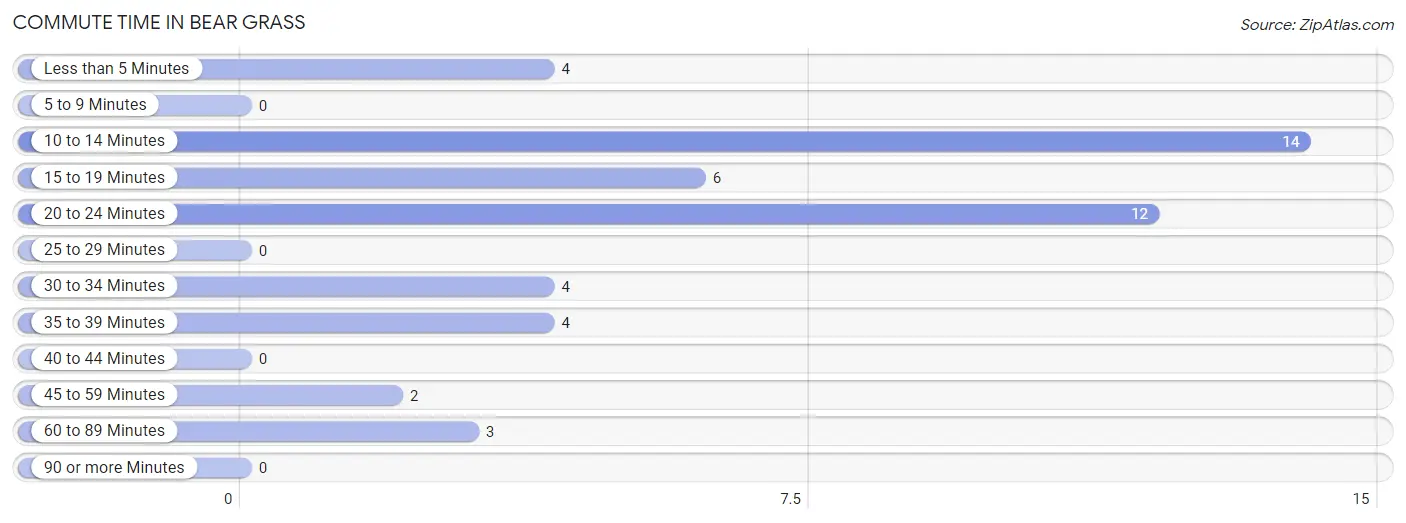
Commute Time in Bear Grass
The most frequently occuring commute durations in Bear Grass are 10 to 14 minutes (14 commuters, 28.6%), 20 to 24 minutes (12 commuters, 24.5%), and 15 to 19 minutes (6 commuters, 12.2%).
| Commute Time | # Commuters | % Commuters |
| Less than 5 Minutes | 4 | 8.2% |
| 5 to 9 Minutes | 0 | 0.0% |
| 10 to 14 Minutes | 14 | 28.6% |
| 15 to 19 Minutes | 6 | 12.2% |
| 20 to 24 Minutes | 12 | 24.5% |
| 25 to 29 Minutes | 0 | 0.0% |
| 30 to 34 Minutes | 4 | 8.2% |
| 35 to 39 Minutes | 4 | 8.2% |
| 40 to 44 Minutes | 0 | 0.0% |
| 45 to 59 Minutes | 2 | 4.1% |
| 60 to 89 Minutes | 3 | 6.1% |
| 90 or more Minutes | 0 | 0.0% |
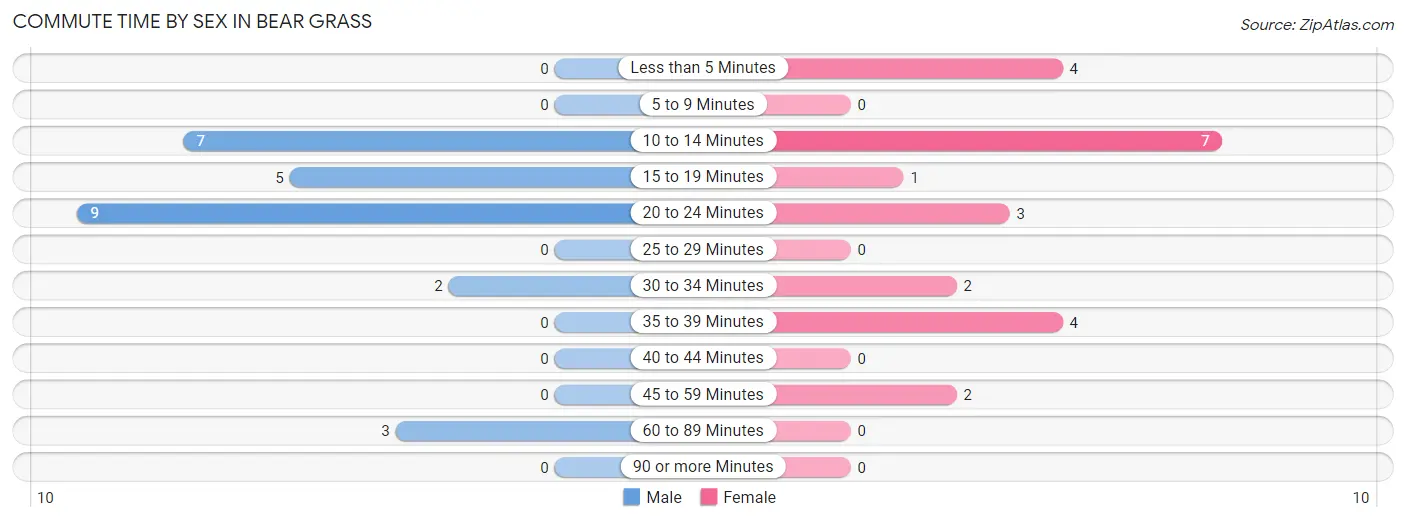
Commute Time by Sex in Bear Grass
The most common commute times in Bear Grass are 20 to 24 minutes (9 commuters, 34.6%) for males and 10 to 14 minutes (7 commuters, 30.4%) for females.
| Commute Time | Male | Female |
| Less than 5 Minutes | 0 (0.0%) | 4 (17.4%) |
| 5 to 9 Minutes | 0 (0.0%) | 0 (0.0%) |
| 10 to 14 Minutes | 7 (26.9%) | 7 (30.4%) |
| 15 to 19 Minutes | 5 (19.2%) | 1 (4.3%) |
| 20 to 24 Minutes | 9 (34.6%) | 3 (13.0%) |
| 25 to 29 Minutes | 0 (0.0%) | 0 (0.0%) |
| 30 to 34 Minutes | 2 (7.7%) | 2 (8.7%) |
| 35 to 39 Minutes | 0 (0.0%) | 4 (17.4%) |
| 40 to 44 Minutes | 0 (0.0%) | 0 (0.0%) |
| 45 to 59 Minutes | 0 (0.0%) | 2 (8.7%) |
| 60 to 89 Minutes | 3 (11.5%) | 0 (0.0%) |
| 90 or more Minutes | 0 (0.0%) | 0 (0.0%) |
Time of Departure to Work by Sex in Bear Grass
The most frequent times of departure to work in Bear Grass are 7:30 AM to 7:59 AM (9, 34.6%) for males and 7:00 AM to 7:29 AM (6, 26.1%) for females.
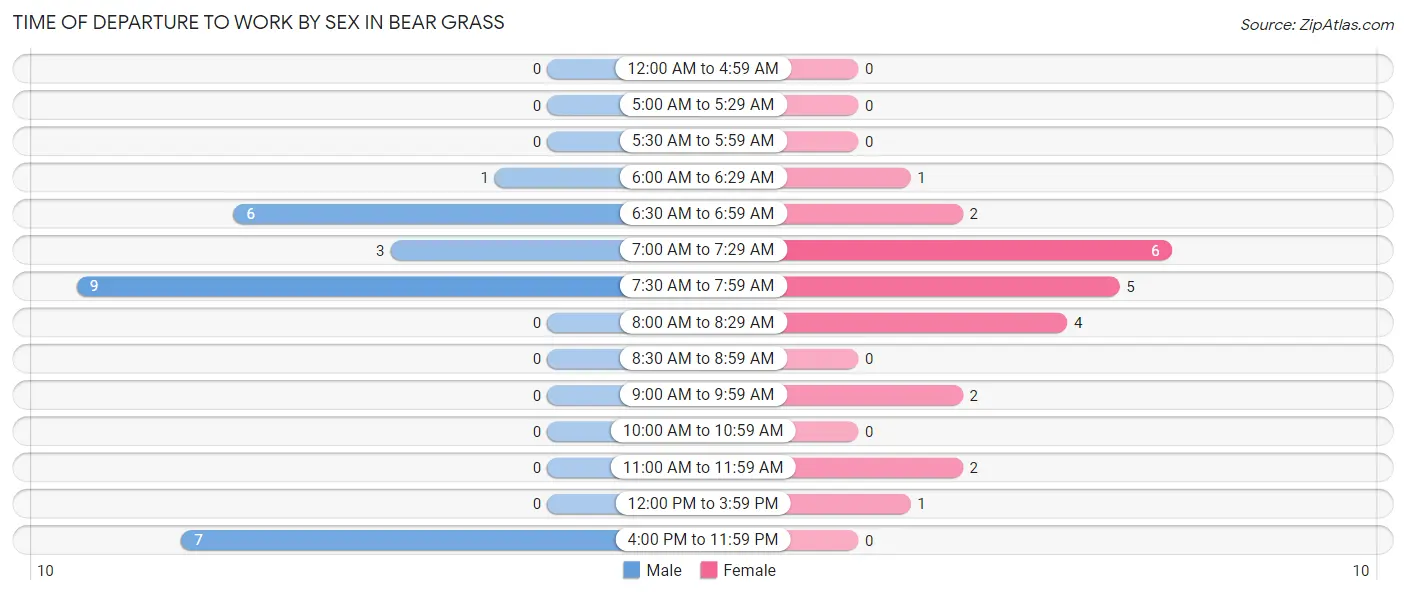
| Time of Departure | Male | Female |
| 12:00 AM to 4:59 AM | 0 (0.0%) | 0 (0.0%) |
| 5:00 AM to 5:29 AM | 0 (0.0%) | 0 (0.0%) |
| 5:30 AM to 5:59 AM | 0 (0.0%) | 0 (0.0%) |
| 6:00 AM to 6:29 AM | 1 (3.8%) | 1 (4.3%) |
| 6:30 AM to 6:59 AM | 6 (23.1%) | 2 (8.7%) |
| 7:00 AM to 7:29 AM | 3 (11.5%) | 6 (26.1%) |
| 7:30 AM to 7:59 AM | 9 (34.6%) | 5 (21.7%) |
| 8:00 AM to 8:29 AM | 0 (0.0%) | 4 (17.4%) |
| 8:30 AM to 8:59 AM | 0 (0.0%) | 0 (0.0%) |
| 9:00 AM to 9:59 AM | 0 (0.0%) | 2 (8.7%) |
| 10:00 AM to 10:59 AM | 0 (0.0%) | 0 (0.0%) |
| 11:00 AM to 11:59 AM | 0 (0.0%) | 2 (8.7%) |
| 12:00 PM to 3:59 PM | 0 (0.0%) | 1 (4.3%) |
| 4:00 PM to 11:59 PM | 7 (26.9%) | 0 (0.0%) |
| Total | 26 (100.0%) | 23 (100.0%) |
Housing Occupancy in Bear Grass
Occupancy by Ownership in Bear Grass
Of the total 45 dwellings in Bear Grass, owner-occupied units account for 33 (73.3%), while renter-occupied units make up 12 (26.7%).
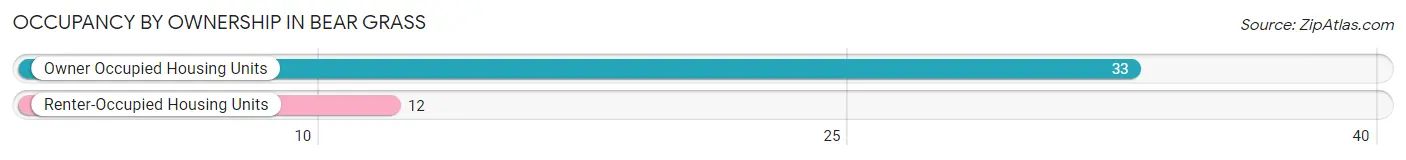
| Occupancy | # Housing Units | % Housing Units |
| Owner Occupied Housing Units | 33 | 73.3% |
| Renter-Occupied Housing Units | 12 | 26.7% |
| Total Occupied Housing Units | 45 | 100.0% |
Occupancy by Household Size in Bear Grass
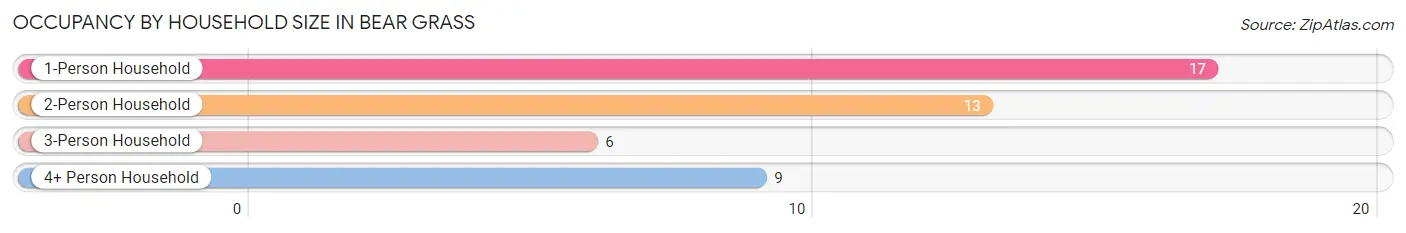
| Household Size | # Housing Units | % Housing Units |
| 1-Person Household | 17 | 37.8% |
| 2-Person Household | 13 | 28.9% |
| 3-Person Household | 6 | 13.3% |
| 4+ Person Household | 9 | 20.0% |
| Total Housing Units | 45 | 100.0% |
Occupancy by Ownership by Household Size in Bear Grass
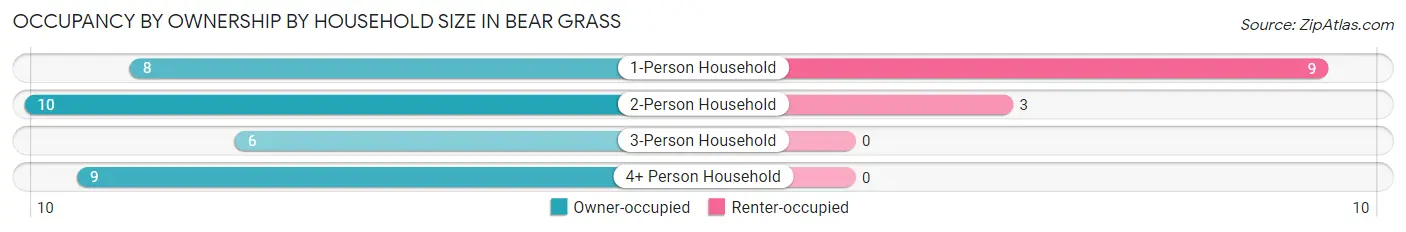
| Household Size | Owner-occupied | Renter-occupied |
| 1-Person Household | 8 (47.1%) | 9 (52.9%) |
| 2-Person Household | 10 (76.9%) | 3 (23.1%) |
| 3-Person Household | 6 (100.0%) | 0 (0.0%) |
| 4+ Person Household | 9 (100.0%) | 0 (0.0%) |
| Total Housing Units | 33 (73.3%) | 12 (26.7%) |
Occupancy by Educational Attainment in Bear Grass
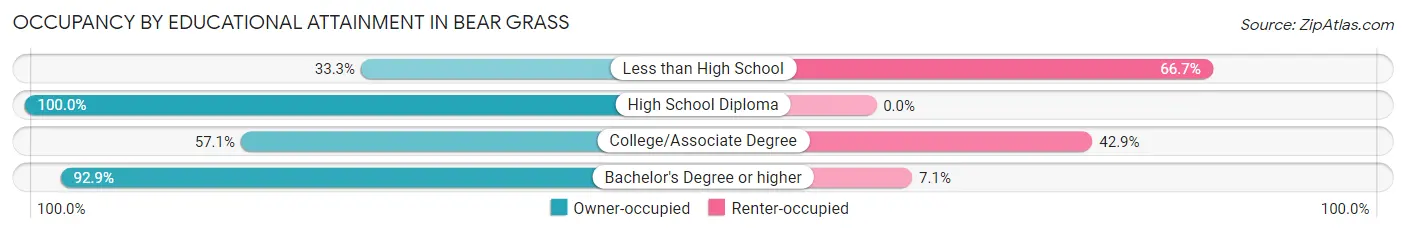
| Household Size | Owner-occupied | Renter-occupied |
| Less than High School | 1 (33.3%) | 2 (66.7%) |
| High School Diploma | 7 (100.0%) | 0 (0.0%) |
| College/Associate Degree | 12 (57.1%) | 9 (42.9%) |
| Bachelor's Degree or higher | 13 (92.9%) | 1 (7.1%) |
Occupancy by Age of Householder in Bear Grass
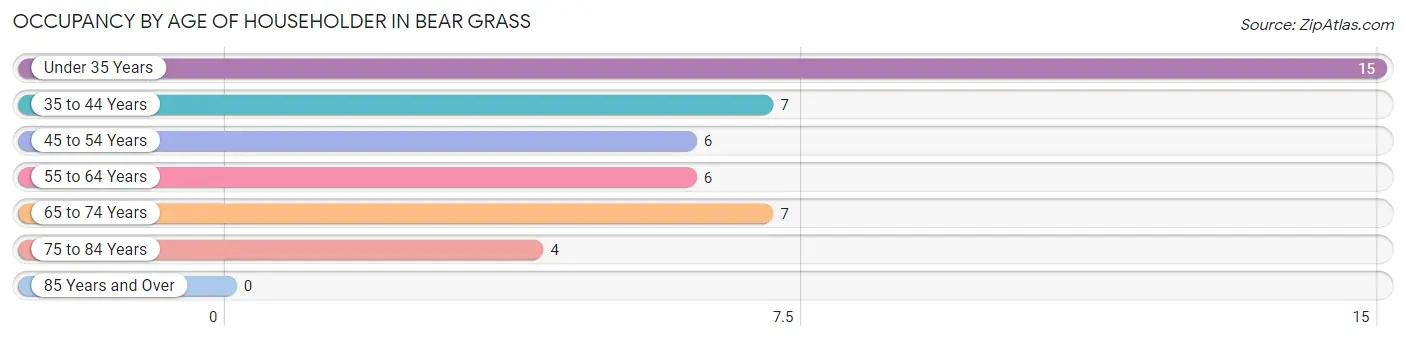
| Age Bracket | # Households | % Households |
| Under 35 Years | 15 | 33.3% |
| 35 to 44 Years | 7 | 15.6% |
| 45 to 54 Years | 6 | 13.3% |
| 55 to 64 Years | 6 | 13.3% |
| 65 to 74 Years | 7 | 15.6% |
| 75 to 84 Years | 4 | 8.9% |
| 85 Years and Over | 0 | 0.0% |
| Total | 45 | 100.0% |
Housing Finances in Bear Grass
Median Income by Occupancy in Bear Grass
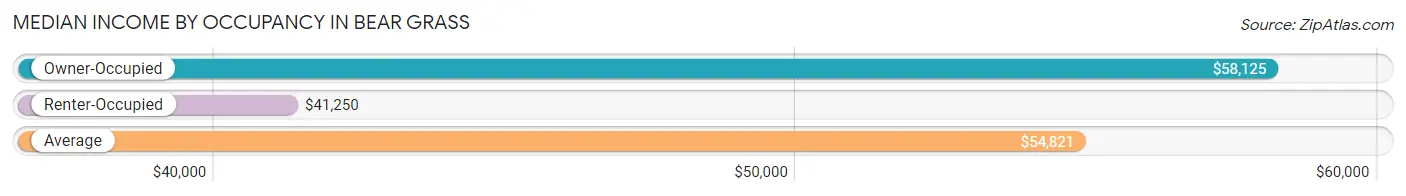
| Occupancy Type | # Households | Median Income |
| Owner-Occupied | 33 (73.3%) | $58,125 |
| Renter-Occupied | 12 (26.7%) | $41,250 |
| Average | 45 (100.0%) | $54,821 |
Occupancy by Householder Income Bracket in Bear Grass
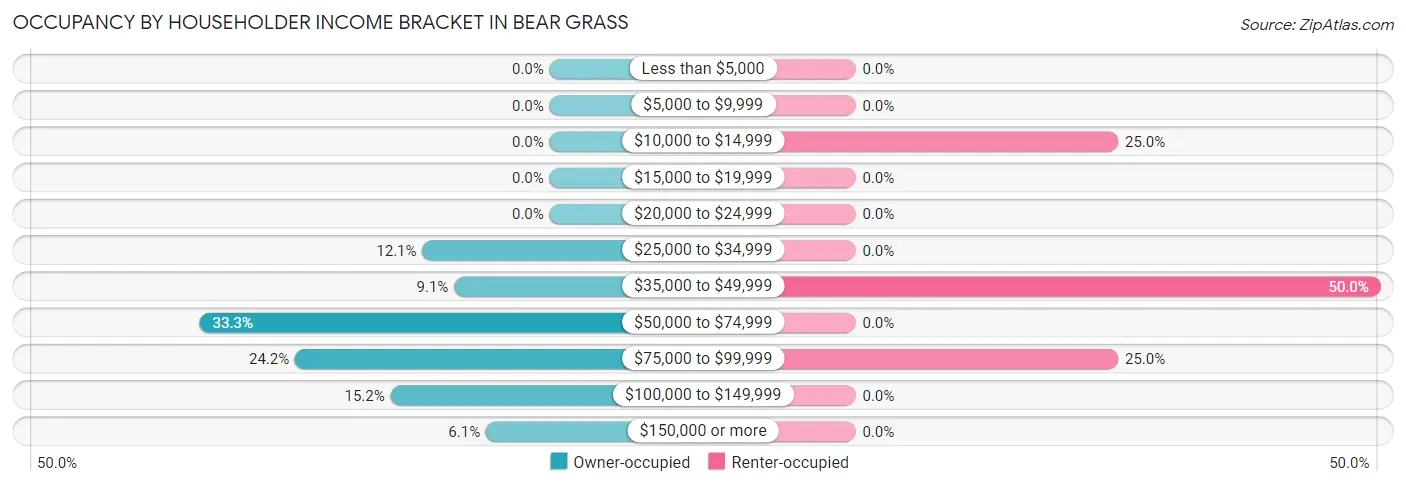
| Income Bracket | Owner-occupied | Renter-occupied |
| Less than $5,000 | 0 (0.0%) | 0 (0.0%) |
| $5,000 to $9,999 | 0 (0.0%) | 0 (0.0%) |
| $10,000 to $14,999 | 0 (0.0%) | 3 (25.0%) |
| $15,000 to $19,999 | 0 (0.0%) | 0 (0.0%) |
| $20,000 to $24,999 | 0 (0.0%) | 0 (0.0%) |
| $25,000 to $34,999 | 4 (12.1%) | 0 (0.0%) |
| $35,000 to $49,999 | 3 (9.1%) | 6 (50.0%) |
| $50,000 to $74,999 | 11 (33.3%) | 0 (0.0%) |
| $75,000 to $99,999 | 8 (24.2%) | 3 (25.0%) |
| $100,000 to $149,999 | 5 (15.1%) | 0 (0.0%) |
| $150,000 or more | 2 (6.1%) | 0 (0.0%) |
| Total | 33 (100.0%) | 12 (100.0%) |
Monthly Housing Cost Tiers in Bear Grass
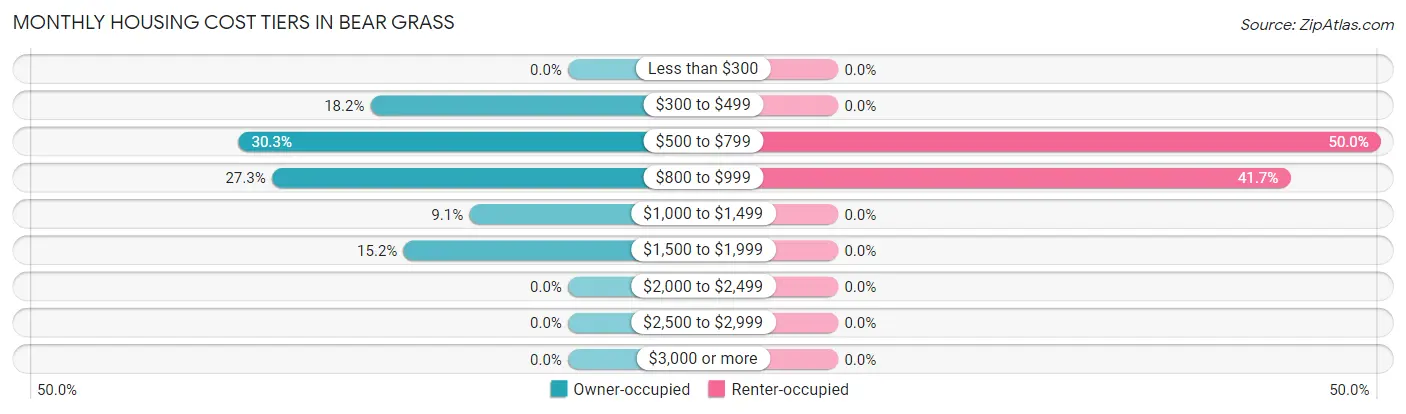
| Monthly Cost | Owner-occupied | Renter-occupied |
| Less than $300 | 0 (0.0%) | 0 (0.0%) |
| $300 to $499 | 6 (18.2%) | 0 (0.0%) |
| $500 to $799 | 10 (30.3%) | 6 (50.0%) |
| $800 to $999 | 9 (27.3%) | 5 (41.7%) |
| $1,000 to $1,499 | 3 (9.1%) | 0 (0.0%) |
| $1,500 to $1,999 | 5 (15.1%) | 0 (0.0%) |
| $2,000 to $2,499 | 0 (0.0%) | 0 (0.0%) |
| $2,500 to $2,999 | 0 (0.0%) | 0 (0.0%) |
| $3,000 or more | 0 (0.0%) | 0 (0.0%) |
| Total | 33 (100.0%) | 12 (100.0%) |
Physical Housing Characteristics in Bear Grass
Housing Structures in Bear Grass
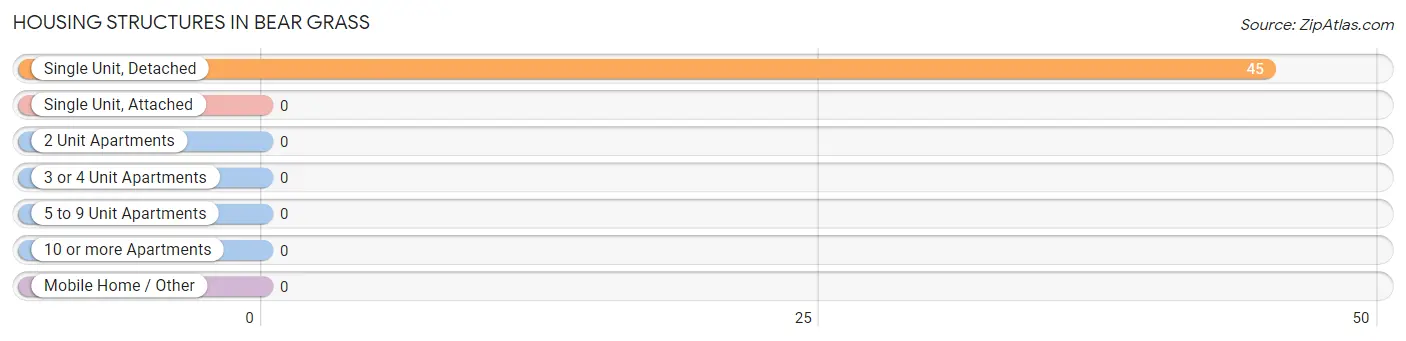
| Structure Type | # Housing Units | % Housing Units |
| Single Unit, Detached | 45 | 100.0% |
| Single Unit, Attached | 0 | 0.0% |
| 2 Unit Apartments | 0 | 0.0% |
| 3 or 4 Unit Apartments | 0 | 0.0% |
| 5 to 9 Unit Apartments | 0 | 0.0% |
| 10 or more Apartments | 0 | 0.0% |
| Mobile Home / Other | 0 | 0.0% |
| Total | 45 | 100.0% |
Housing Structures by Occupancy in Bear Grass
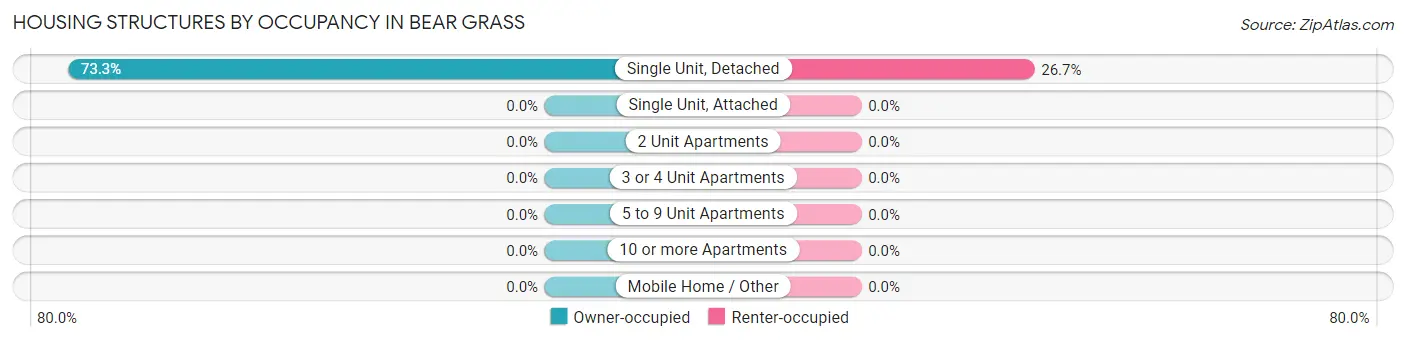
| Structure Type | Owner-occupied | Renter-occupied |
| Single Unit, Detached | 33 (73.3%) | 12 (26.7%) |
| Single Unit, Attached | 0 (0.0%) | 0 (0.0%) |
| 2 Unit Apartments | 0 (0.0%) | 0 (0.0%) |
| 3 or 4 Unit Apartments | 0 (0.0%) | 0 (0.0%) |
| 5 to 9 Unit Apartments | 0 (0.0%) | 0 (0.0%) |
| 10 or more Apartments | 0 (0.0%) | 0 (0.0%) |
| Mobile Home / Other | 0 (0.0%) | 0 (0.0%) |
| Total | 33 (73.3%) | 12 (26.7%) |
Housing Structures by Number of Rooms in Bear Grass
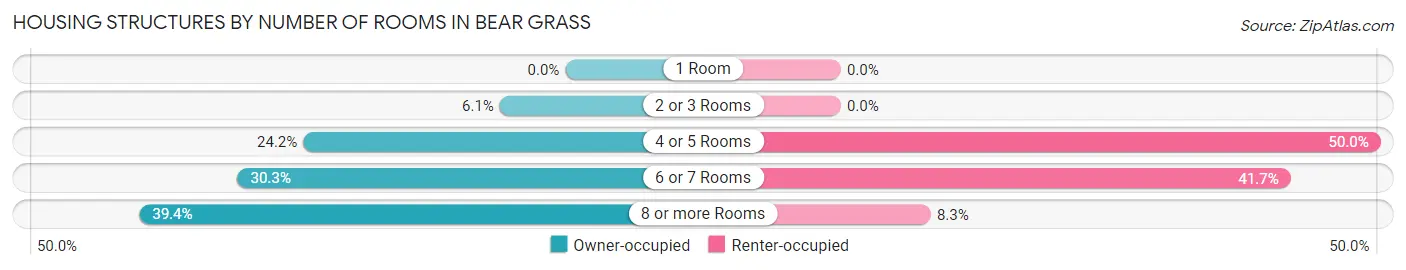
| Number of Rooms | Owner-occupied | Renter-occupied |
| 1 Room | 0 (0.0%) | 0 (0.0%) |
| 2 or 3 Rooms | 2 (6.1%) | 0 (0.0%) |
| 4 or 5 Rooms | 8 (24.2%) | 6 (50.0%) |
| 6 or 7 Rooms | 10 (30.3%) | 5 (41.7%) |
| 8 or more Rooms | 13 (39.4%) | 1 (8.3%) |
| Total | 33 (100.0%) | 12 (100.0%) |
Housing Structure by Heating Type in Bear Grass
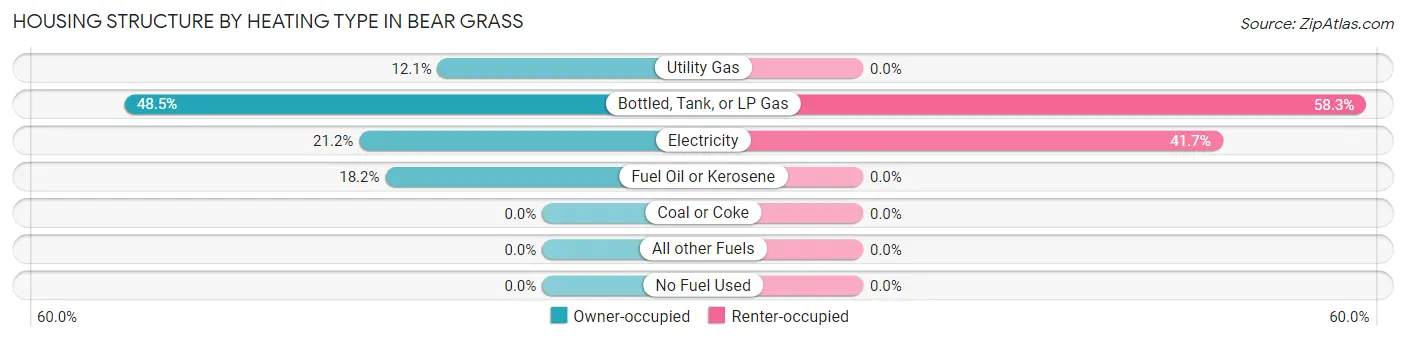
| Heating Type | Owner-occupied | Renter-occupied |
| Utility Gas | 4 (12.1%) | 0 (0.0%) |
| Bottled, Tank, or LP Gas | 16 (48.5%) | 7 (58.3%) |
| Electricity | 7 (21.2%) | 5 (41.7%) |
| Fuel Oil or Kerosene | 6 (18.2%) | 0 (0.0%) |
| Coal or Coke | 0 (0.0%) | 0 (0.0%) |
| All other Fuels | 0 (0.0%) | 0 (0.0%) |
| No Fuel Used | 0 (0.0%) | 0 (0.0%) |
| Total | 33 (100.0%) | 12 (100.0%) |
Household Vehicle Usage in Bear Grass
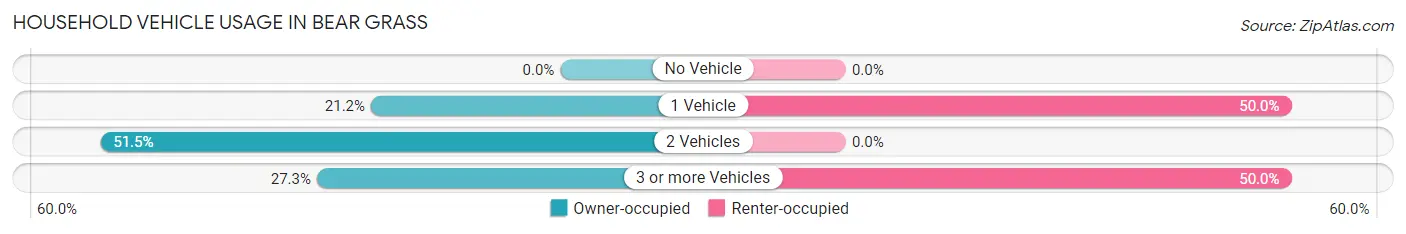
| Vehicles per Household | Owner-occupied | Renter-occupied |
| No Vehicle | 0 (0.0%) | 0 (0.0%) |
| 1 Vehicle | 7 (21.2%) | 6 (50.0%) |
| 2 Vehicles | 17 (51.5%) | 0 (0.0%) |
| 3 or more Vehicles | 9 (27.3%) | 6 (50.0%) |
| Total | 33 (100.0%) | 12 (100.0%) |
Real Estate & Mortgages in Bear Grass
Real Estate and Mortgage Overview in Bear Grass
| Characteristic | Without Mortgage | With Mortgage |
| Housing Units | 12 | 21 |
| Median Property Value | - | - |
| Median Household Income | $76,250 | $0 |
| Monthly Housing Costs | $600 | $0 |
| Real Estate Taxes | $1,750 | $0 |
Property Value by Mortgage Status in Bear Grass
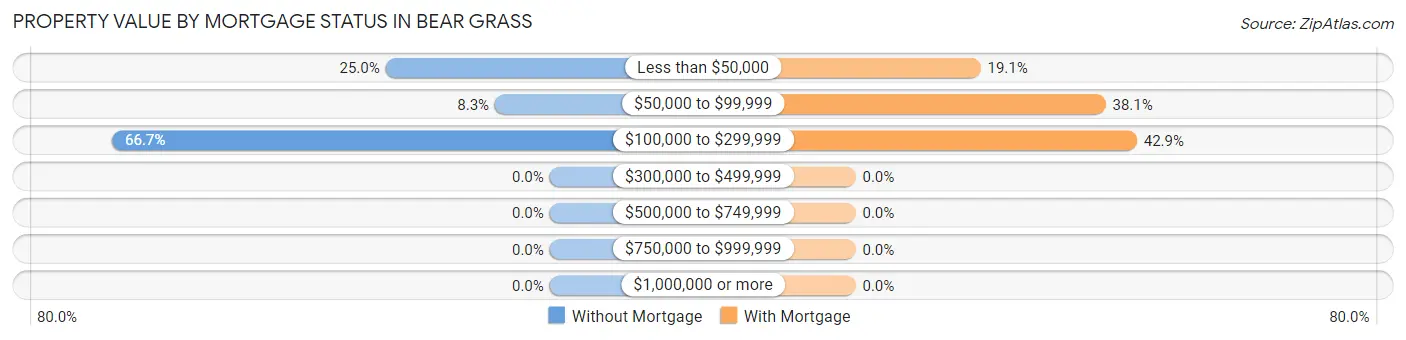
| Property Value | Without Mortgage | With Mortgage |
| Less than $50,000 | 3 (25.0%) | 4 (19.1%) |
| $50,000 to $99,999 | 1 (8.3%) | 8 (38.1%) |
| $100,000 to $299,999 | 8 (66.7%) | 9 (42.9%) |
| $300,000 to $499,999 | 0 (0.0%) | 0 (0.0%) |
| $500,000 to $749,999 | 0 (0.0%) | 0 (0.0%) |
| $750,000 to $999,999 | 0 (0.0%) | 0 (0.0%) |
| $1,000,000 or more | 0 (0.0%) | 0 (0.0%) |
| Total | 12 (100.0%) | 21 (100.0%) |
Household Income by Mortgage Status in Bear Grass
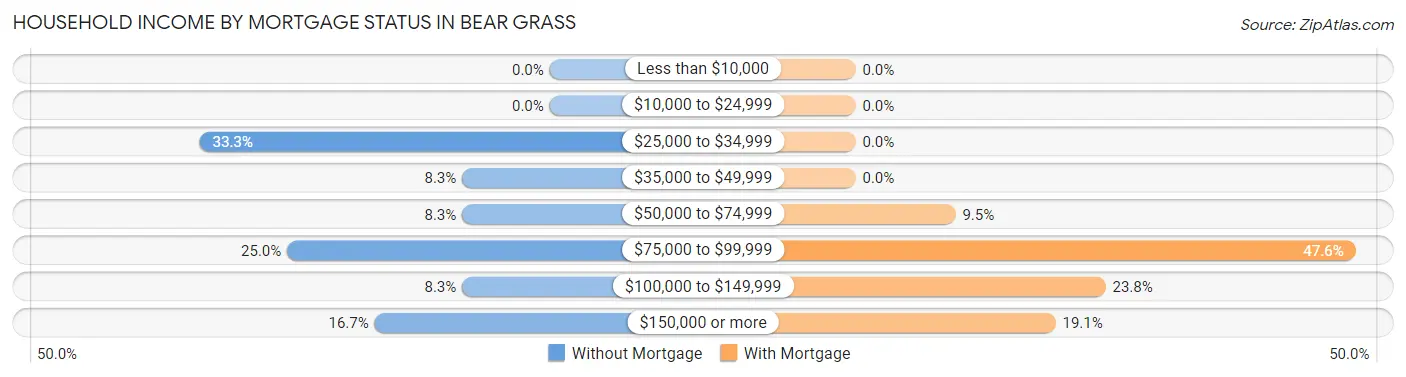
| Household Income | Without Mortgage | With Mortgage |
| Less than $10,000 | 0 (0.0%) | 0 (0.0%) |
| $10,000 to $24,999 | 0 (0.0%) | 0 (0.0%) |
| $25,000 to $34,999 | 4 (33.3%) | 0 (0.0%) |
| $35,000 to $49,999 | 1 (8.3%) | 0 (0.0%) |
| $50,000 to $74,999 | 1 (8.3%) | 2 (9.5%) |
| $75,000 to $99,999 | 3 (25.0%) | 10 (47.6%) |
| $100,000 to $149,999 | 1 (8.3%) | 5 (23.8%) |
| $150,000 or more | 2 (16.7%) | 4 (19.1%) |
| Total | 12 (100.0%) | 21 (100.0%) |
Property Value to Household Income Ratio in Bear Grass
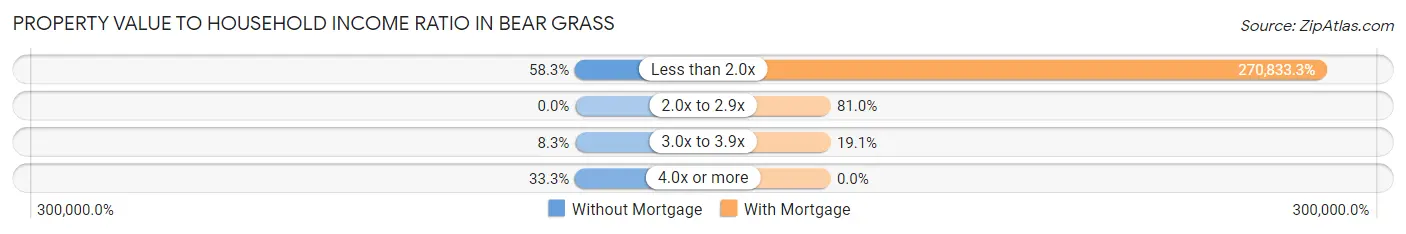
| Value-to-Income Ratio | Without Mortgage | With Mortgage |
| Less than 2.0x | 7 (58.3%) | 56,875 (270,833.3%) |
| 2.0x to 2.9x | 0 (0.0%) | 17 (80.9%) |
| 3.0x to 3.9x | 1 (8.3%) | 4 (19.1%) |
| 4.0x or more | 4 (33.3%) | 0 (0.0%) |
| Total | 12 (100.0%) | 21 (100.0%) |
Real Estate Taxes by Mortgage Status in Bear Grass
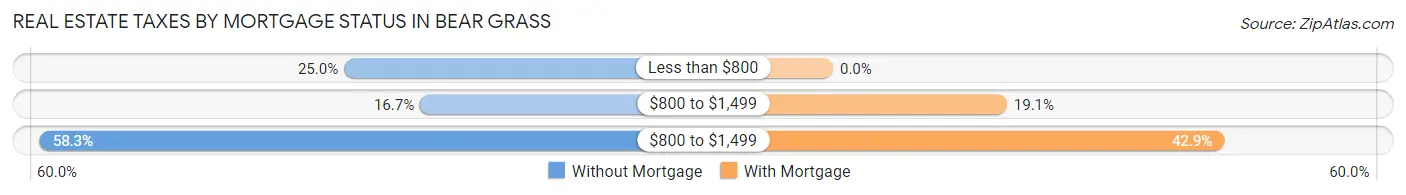
| Property Taxes | Without Mortgage | With Mortgage |
| Less than $800 | 3 (25.0%) | 0 (0.0%) |
| $800 to $1,499 | 2 (16.7%) | 4 (19.1%) |
| $800 to $1,499 | 7 (58.3%) | 9 (42.9%) |
| Total | 12 (100.0%) | 21 (100.0%) |
Health & Disability in Bear Grass
Health Insurance Coverage by Age in Bear Grass
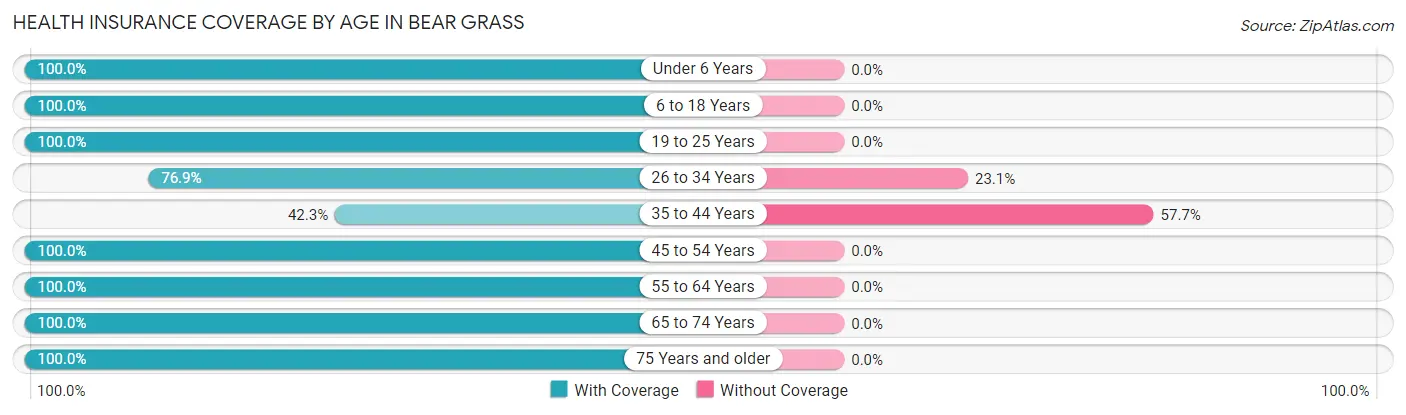
| Age Bracket | With Coverage | Without Coverage |
| Under 6 Years | 24 (100.0%) | 0 (0.0%) |
| 6 to 18 Years | 7 (100.0%) | 0 (0.0%) |
| 19 to 25 Years | 4 (100.0%) | 0 (0.0%) |
| 26 to 34 Years | 20 (76.9%) | 6 (23.1%) |
| 35 to 44 Years | 11 (42.3%) | 15 (57.7%) |
| 45 to 54 Years | 20 (100.0%) | 0 (0.0%) |
| 55 to 64 Years | 7 (100.0%) | 0 (0.0%) |
| 65 to 74 Years | 9 (100.0%) | 0 (0.0%) |
| 75 Years and older | 6 (100.0%) | 0 (0.0%) |
| Total | 108 (83.7%) | 21 (16.3%) |
Health Insurance Coverage by Citizenship Status in Bear Grass
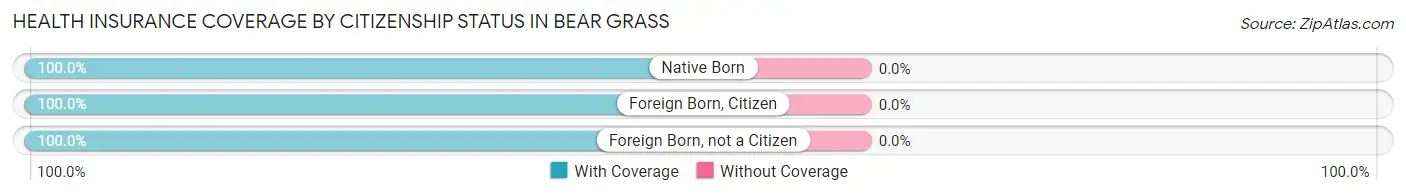
| Citizenship Status | With Coverage | Without Coverage |
| Native Born | 24 (100.0%) | 0 (0.0%) |
| Foreign Born, Citizen | 7 (100.0%) | 0 (0.0%) |
| Foreign Born, not a Citizen | 4 (100.0%) | 0 (0.0%) |
Health Insurance Coverage by Household Income in Bear Grass
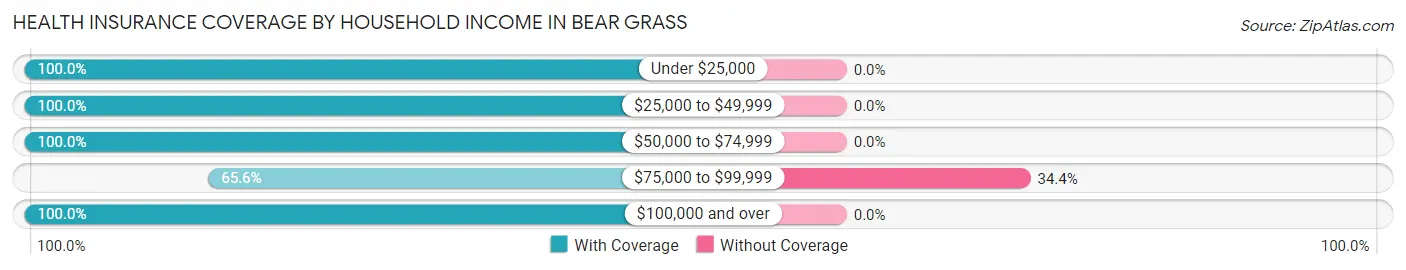
| Household Income | With Coverage | Without Coverage |
| Under $25,000 | 3 (100.0%) | 0 (0.0%) |
| $25,000 to $49,999 | 15 (100.0%) | 0 (0.0%) |
| $50,000 to $74,999 | 33 (100.0%) | 0 (0.0%) |
| $75,000 to $99,999 | 40 (65.6%) | 21 (34.4%) |
| $100,000 and over | 17 (100.0%) | 0 (0.0%) |
Public vs Private Health Insurance Coverage by Age in Bear Grass
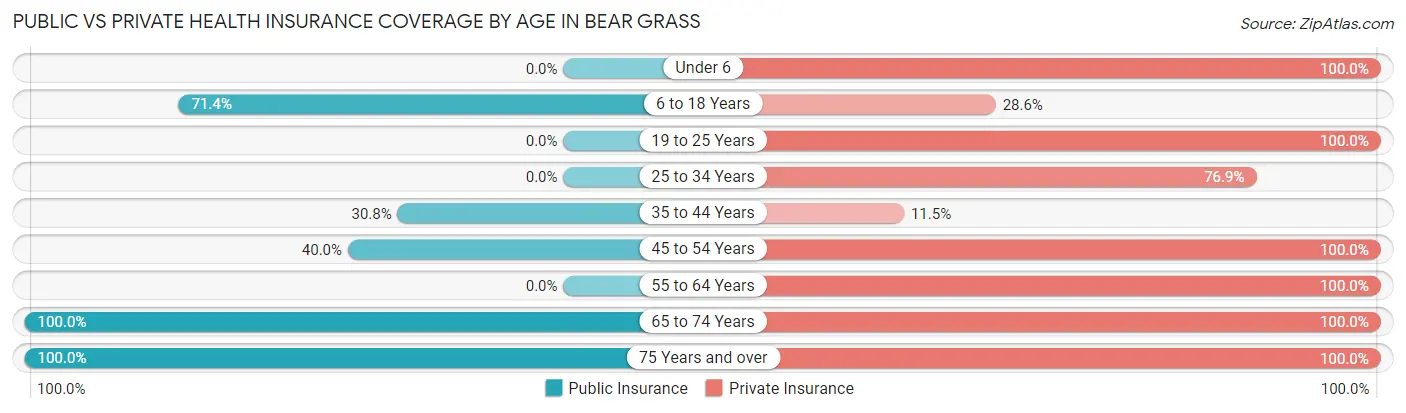
| Age Bracket | Public Insurance | Private Insurance |
| Under 6 | 0 (0.0%) | 24 (100.0%) |
| 6 to 18 Years | 5 (71.4%) | 2 (28.6%) |
| 19 to 25 Years | 0 (0.0%) | 4 (100.0%) |
| 25 to 34 Years | 0 (0.0%) | 20 (76.9%) |
| 35 to 44 Years | 8 (30.8%) | 3 (11.5%) |
| 45 to 54 Years | 8 (40.0%) | 20 (100.0%) |
| 55 to 64 Years | 0 (0.0%) | 7 (100.0%) |
| 65 to 74 Years | 9 (100.0%) | 9 (100.0%) |
| 75 Years and over | 6 (100.0%) | 6 (100.0%) |
| Total | 36 (27.9%) | 95 (73.6%) |
Disability Status by Sex by Age in Bear Grass
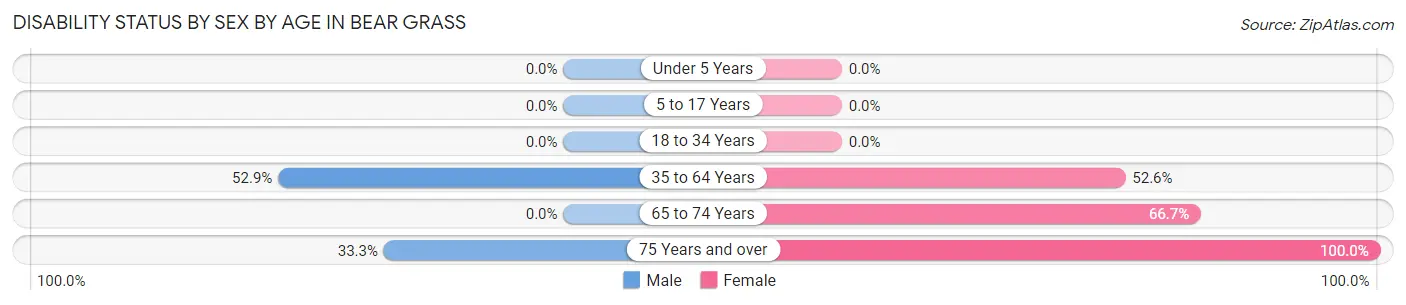
| Age Bracket | Male | Female |
| Under 5 Years | 0 (0.0%) | 0 (0.0%) |
| 5 to 17 Years | 0 (0.0%) | 0 (0.0%) |
| 18 to 34 Years | 0 (0.0%) | 0 (0.0%) |
| 35 to 64 Years | 18 (52.9%) | 10 (52.6%) |
| 65 to 74 Years | 0 (0.0%) | 2 (66.7%) |
| 75 Years and over | 1 (33.3%) | 3 (100.0%) |
Disability Class by Sex by Age in Bear Grass
Disability Class: Hearing Difficulty
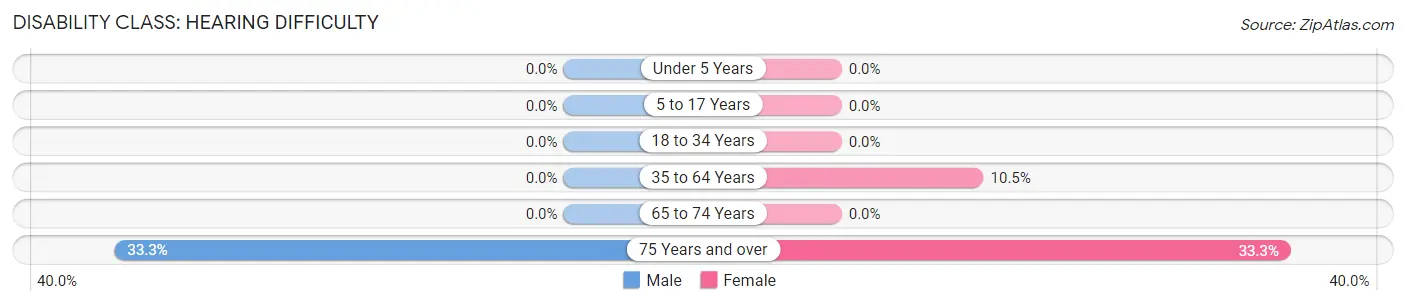
| Age Bracket | Male | Female |
| Under 5 Years | 0 (0.0%) | 0 (0.0%) |
| 5 to 17 Years | 0 (0.0%) | 0 (0.0%) |
| 18 to 34 Years | 0 (0.0%) | 0 (0.0%) |
| 35 to 64 Years | 0 (0.0%) | 2 (10.5%) |
| 65 to 74 Years | 0 (0.0%) | 0 (0.0%) |
| 75 Years and over | 1 (33.3%) | 1 (33.3%) |
Disability Class: Vision Difficulty
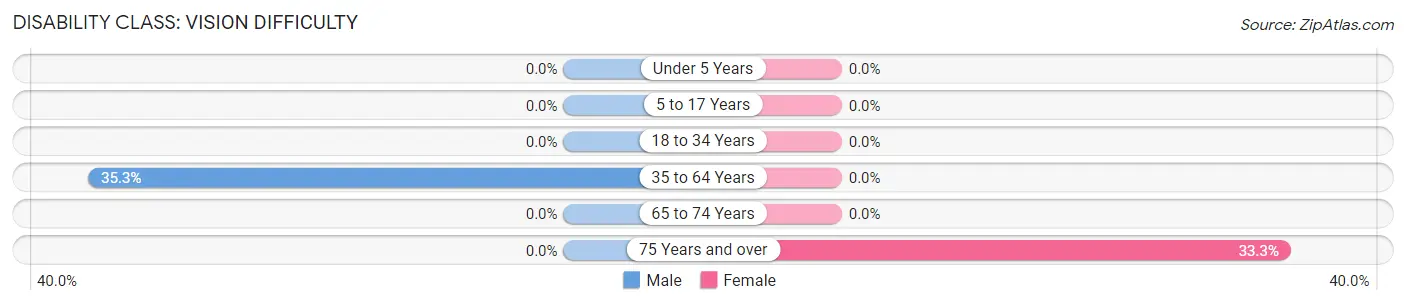
| Age Bracket | Male | Female |
| Under 5 Years | 0 (0.0%) | 0 (0.0%) |
| 5 to 17 Years | 0 (0.0%) | 0 (0.0%) |
| 18 to 34 Years | 0 (0.0%) | 0 (0.0%) |
| 35 to 64 Years | 12 (35.3%) | 0 (0.0%) |
| 65 to 74 Years | 0 (0.0%) | 0 (0.0%) |
| 75 Years and over | 0 (0.0%) | 1 (33.3%) |
Disability Class: Cognitive Difficulty
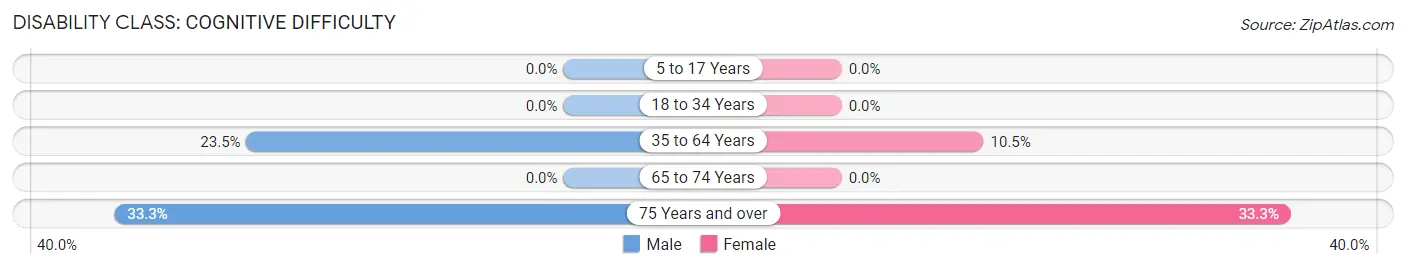
| Age Bracket | Male | Female |
| 5 to 17 Years | 0 (0.0%) | 0 (0.0%) |
| 18 to 34 Years | 0 (0.0%) | 0 (0.0%) |
| 35 to 64 Years | 8 (23.5%) | 2 (10.5%) |
| 65 to 74 Years | 0 (0.0%) | 0 (0.0%) |
| 75 Years and over | 1 (33.3%) | 1 (33.3%) |
Disability Class: Ambulatory Difficulty
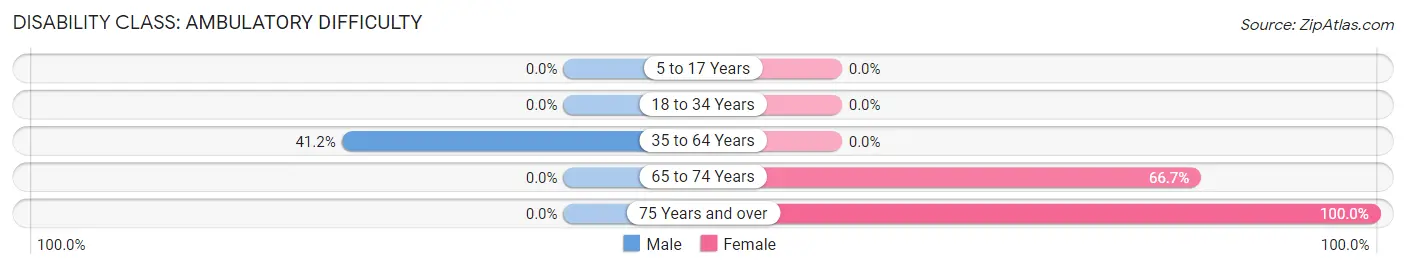
| Age Bracket | Male | Female |
| 5 to 17 Years | 0 (0.0%) | 0 (0.0%) |
| 18 to 34 Years | 0 (0.0%) | 0 (0.0%) |
| 35 to 64 Years | 14 (41.2%) | 0 (0.0%) |
| 65 to 74 Years | 0 (0.0%) | 2 (66.7%) |
| 75 Years and over | 0 (0.0%) | 3 (100.0%) |
Disability Class: Self-Care Difficulty
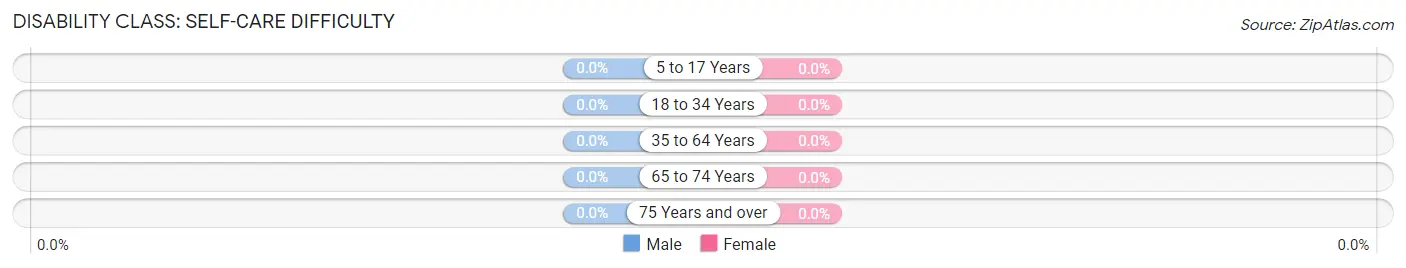
| Age Bracket | Male | Female |
| 5 to 17 Years | 0 (0.0%) | 0 (0.0%) |
| 18 to 34 Years | 0 (0.0%) | 0 (0.0%) |
| 35 to 64 Years | 0 (0.0%) | 0 (0.0%) |
| 65 to 74 Years | 0 (0.0%) | 0 (0.0%) |
| 75 Years and over | 0 (0.0%) | 0 (0.0%) |
Technology Access in Bear Grass
Computing Device Access in Bear Grass
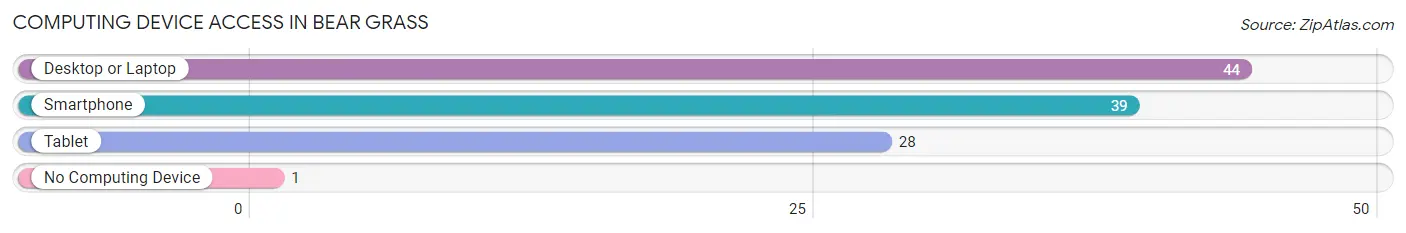
| Device Type | # Households | % Households |
| Desktop or Laptop | 44 | 97.8% |
| Smartphone | 39 | 86.7% |
| Tablet | 28 | 62.2% |
| No Computing Device | 1 | 2.2% |
| Total | 45 | 100.0% |
Internet Access in Bear Grass
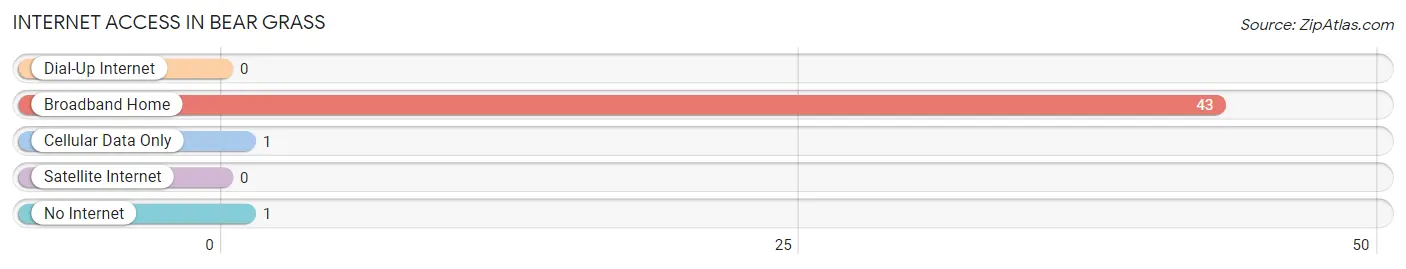
| Internet Type | # Households | % Households |
| Dial-Up Internet | 0 | 0.0% |
| Broadband Home | 43 | 95.6% |
| Cellular Data Only | 1 | 2.2% |
| Satellite Internet | 0 | 0.0% |
| No Internet | 1 | 2.2% |
| Total | 45 | 100.0% |
Bear Grass Summary
History
Bear Grass is a small unincorporated community located in Martin County, North Carolina. It is situated along the Roanoke River, approximately 10 miles south of Williamston. The town was first settled in the late 1700s by a group of settlers from Scotland, who named the town after the native bear grass plant that grew in the area. The town was officially incorporated in 1887.
The town was originally a farming community, with the main crops being corn, cotton, and tobacco. In the early 1900s, the town began to grow as a commercial center, with the opening of a general store, a post office, and a sawmill. The town also had a cotton gin, a grist mill, and a blacksmith shop.
In the late 1940s, the town began to decline as the local economy shifted away from agriculture and towards manufacturing. The sawmill and grist mill closed, and the cotton gin and blacksmith shop were abandoned. The town’s population decreased as people moved away in search of better economic opportunities.
In the late 1970s, the town began to experience a resurgence as a tourist destination. The Roanoke River was designated as a National Wild and Scenic River, and the town began to attract visitors who wanted to take advantage of the river’s recreational opportunities. The town also began to attract retirees who wanted to enjoy the peaceful atmosphere of the small town.
Geography
Bear Grass is located in Martin County, North Carolina, approximately 10 miles south of Williamston. The town is situated along the Roanoke River, which is a National Wild and Scenic River. The town is surrounded by forests and wetlands, and is home to a variety of wildlife, including deer, wild turkeys, and black bears.
The town is located in the Coastal Plain region of North Carolina, and has a humid subtropical climate. The average temperature in the summer is around 80 degrees Fahrenheit, and the average temperature in the winter is around 50 degrees Fahrenheit. The town receives an average of 48 inches of rain per year.
Economy
The economy of Bear Grass is largely based on tourism. The town is a popular destination for visitors who want to take advantage of the recreational opportunities offered by the Roanoke River. The town also attracts retirees who want to enjoy the peaceful atmosphere of the small town.
In addition to tourism, the town also has a small manufacturing sector. The town is home to a few small businesses, including a furniture factory and a woodworking shop. The town also has a few retail stores, including a grocery store and a hardware store.
Demographics
As of the 2010 census, the population of Bear Grass was 545. The town is predominantly white, with 92.3% of the population identifying as white. The town also has a small African American population, with 4.7% of the population identifying as African American. The town also has a small Hispanic population, with 1.8% of the population identifying as Hispanic or Latino.
The median household income in Bear Grass is $35,000, and the median home value is $90,000. The town has a poverty rate of 17.3%, which is higher than the national average. The town also has a high unemployment rate, with 8.3% of the population unemployed.
Common Questions
What is Per Capita Income in Bear Grass?
Per Capita income in Bear Grass is $23,929.
What is the Median Family Income in Bear Grass?
Median Family Income in Bear Grass is $93,333.
What is the Median Household income in Bear Grass?
Median Household Income in Bear Grass is $54,821.
What is Income or Wage Gap in Bear Grass?
Income or Wage Gap in Bear Grass is 25.3%.
Women in Bear Grass earn 74.7 cents for every dollar earned by a man.
What is Inequality or Gini Index in Bear Grass?
Inequality or Gini Index in Bear Grass is 0.30.
What is the Total Population of Bear Grass?
Total Population of Bear Grass is 129.
What is the Total Male Population of Bear Grass?
Total Male Population of Bear Grass is 73.
What is the Total Female Population of Bear Grass?
Total Female Population of Bear Grass is 56.
What is the Ratio of Males per 100 Females in Bear Grass?
There are 130.36 Males per 100 Females in Bear Grass.
What is the Ratio of Females per 100 Males in Bear Grass?
There are 76.71 Females per 100 Males in Bear Grass.
What is the Median Population Age in Bear Grass?
Median Population Age in Bear Grass is 39.2 Years.
What is the Average Family Size in Bear Grass
Average Family Size in Bear Grass is 3.4 People.
What is the Average Household Size in Bear Grass
Average Household Size in Bear Grass is 2.9 People.
How Large is the Labor Force in Bear Grass?
There are 50 People in the Labor Forcein in Bear Grass.
What is the Percentage of People in the Labor Force in Bear Grass?
50.0% of People are in the Labor Force in Bear Grass.