Love Valley, NC Map & Demographics
Love Valley Map
Love Valley Overview
$20,092
PER CAPITA INCOME
$20,938
AVG HOUSEHOLD INCOME
0.42
INEQUALITY / GINI INDEX
130
TOTAL POPULATION
53
MALE POPULATION
77
FEMALE POPULATION
68.83
MALES / 100 FEMALES
145.28
FEMALES / 100 MALES
55.4
MEDIAN AGE
2.3
AVG FAMILY SIZE
1.6
AVG HOUSEHOLD SIZE
56
LABOR FORCE [ PEOPLE ]
47.1%
PERCENT IN LABOR FORCE
23.2%
UNEMPLOYMENT RATE
Income in Love Valley
Income Overview in Love Valley
| Characteristic | Number | Measure |
| Per Capita Income | 130 | $20,092 |
| Median Family Income | 35 | $0 |
| Mean Family Income | 35 | $42,240 |
| Median Household Income | 79 | $20,938 |
| Mean Household Income | 79 | $35,024 |
| Income Deficit | 35 | $0 |
| Wage / Income Gap (%) | 130 | 0.00% |
| Wage / Income Gap ($) | 130 | 100.00¢ per $1 |
| Gini / Inequality Index | 130 | 0.42 |
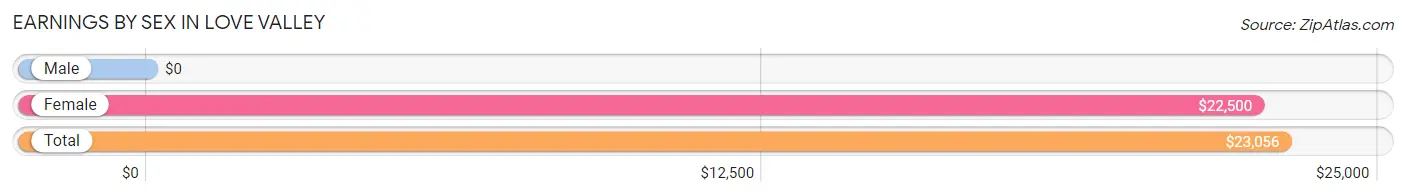
Earnings by Sex in Love Valley
| Sex | Number | Average Earnings |
| Male | 12 (21.4%) | $0 |
| Female | 44 (78.6%) | $22,500 |
| Total | 56 (100.0%) | $23,056 |
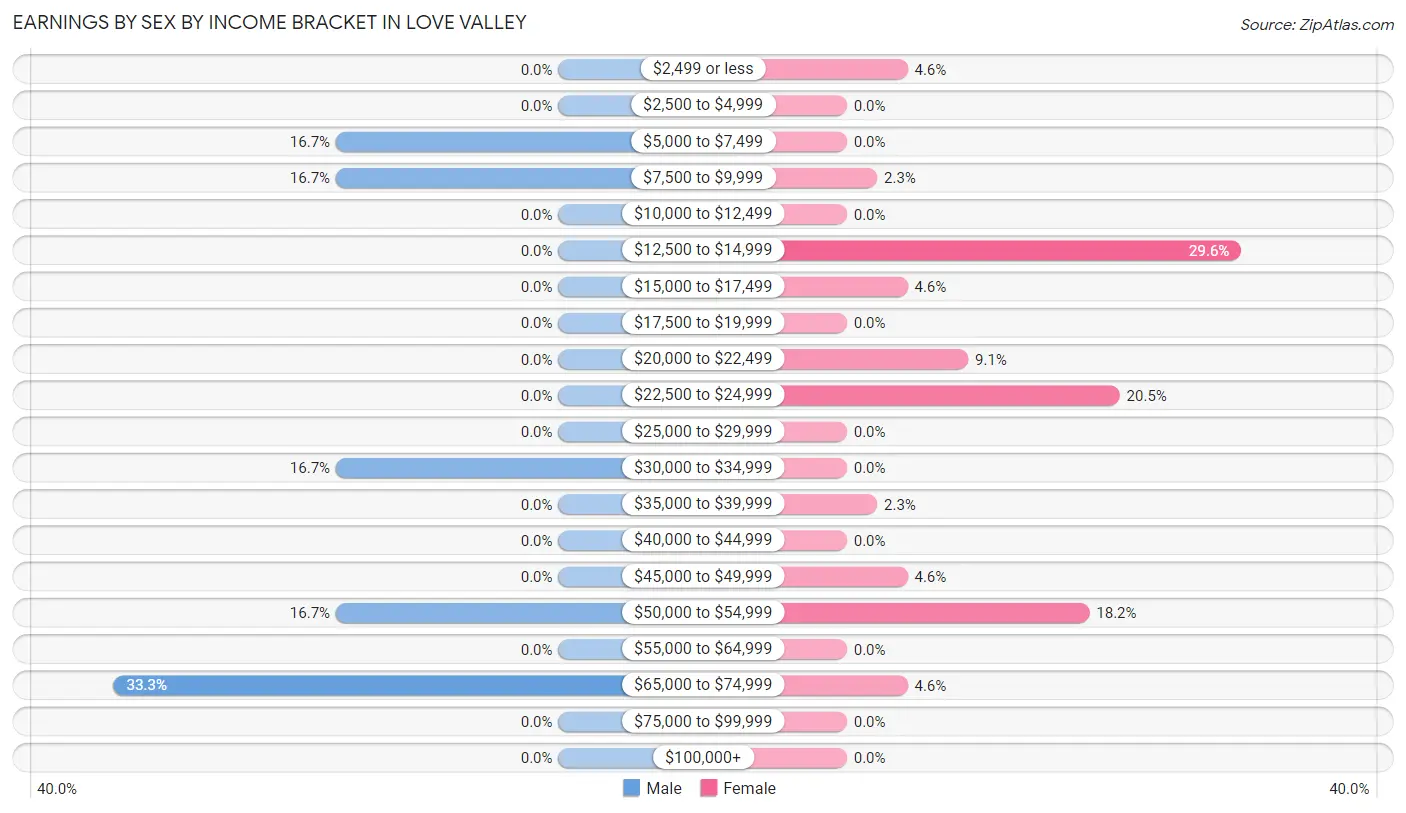
Earnings by Sex by Income Bracket in Love Valley
The most common earnings brackets in Love Valley are $65,000 to $74,999 for men (4 | 33.3%) and $12,500 to $14,999 for women (13 | 29.5%).
| Income | Male | Female |
| $2,499 or less | 0 (0.0%) | 2 (4.5%) |
| $2,500 to $4,999 | 0 (0.0%) | 0 (0.0%) |
| $5,000 to $7,499 | 2 (16.7%) | 0 (0.0%) |
| $7,500 to $9,999 | 2 (16.7%) | 1 (2.3%) |
| $10,000 to $12,499 | 0 (0.0%) | 0 (0.0%) |
| $12,500 to $14,999 | 0 (0.0%) | 13 (29.5%) |
| $15,000 to $17,499 | 0 (0.0%) | 2 (4.5%) |
| $17,500 to $19,999 | 0 (0.0%) | 0 (0.0%) |
| $20,000 to $22,499 | 0 (0.0%) | 4 (9.1%) |
| $22,500 to $24,999 | 0 (0.0%) | 9 (20.4%) |
| $25,000 to $29,999 | 0 (0.0%) | 0 (0.0%) |
| $30,000 to $34,999 | 2 (16.7%) | 0 (0.0%) |
| $35,000 to $39,999 | 0 (0.0%) | 1 (2.3%) |
| $40,000 to $44,999 | 0 (0.0%) | 0 (0.0%) |
| $45,000 to $49,999 | 0 (0.0%) | 2 (4.5%) |
| $50,000 to $54,999 | 2 (16.7%) | 8 (18.2%) |
| $55,000 to $64,999 | 0 (0.0%) | 0 (0.0%) |
| $65,000 to $74,999 | 4 (33.3%) | 2 (4.5%) |
| $75,000 to $99,999 | 0 (0.0%) | 0 (0.0%) |
| $100,000+ | 0 (0.0%) | 0 (0.0%) |
| Total | 12 (100.0%) | 44 (100.0%) |
Earnings by Sex by Educational Attainment in Love Valley
| Educational Attainment | Male Income | Female Income |
| Less than High School | - | - |
| High School Diploma | - | - |
| College or Associate's Degree | - | - |
| Bachelor's Degree | - | - |
| Graduate Degree | - | - |
| Total | - | - |
Family Income in Love Valley
Family Income Brackets in Love Valley
According to the Love Valley family income data, there are 19 families falling into the $15,000 to $24,999 income range, which is the most common income bracket and makes up 54.3% of all families.
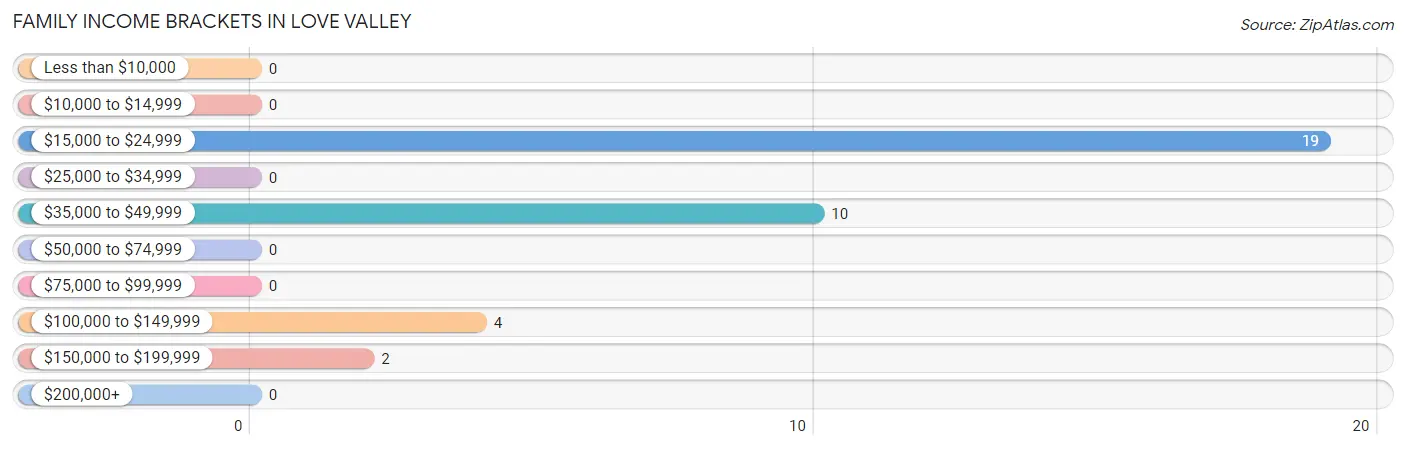
| Income Bracket | # Families | % Families |
| Less than $10,000 | 0 | 0.0% |
| $10,000 to $14,999 | 0 | 0.0% |
| $15,000 to $24,999 | 19 | 54.3% |
| $25,000 to $34,999 | 0 | 0.0% |
| $35,000 to $49,999 | 10 | 28.6% |
| $50,000 to $74,999 | 0 | 0.0% |
| $75,000 to $99,999 | 0 | 0.0% |
| $100,000 to $149,999 | 4 | 11.4% |
| $150,000 to $199,999 | 2 | 5.7% |
| $200,000+ | 0 | 0.0% |
Family Income by Famaliy Size in Love Valley
3-person families (7 | 20.0%) account for the highest median family income in Love Valley with $121,563 per family, while 3-person families (7 | 20.0%) have the highest median income of $40,521 per family member.
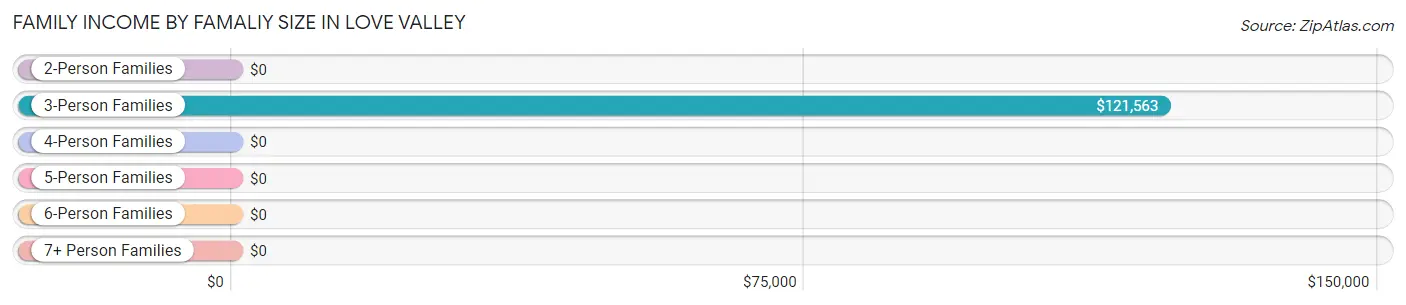
| Income Bracket | # Families | Median Income |
| 2-Person Families | 24 (68.6%) | $0 |
| 3-Person Families | 7 (20.0%) | $121,563 |
| 4-Person Families | 4 (11.4%) | $0 |
| 5-Person Families | 0 (0.0%) | $0 |
| 6-Person Families | 0 (0.0%) | $0 |
| 7+ Person Families | 0 (0.0%) | $0 |
| Total | 35 (100.0%) | $0 |
Family Income by Number of Earners in Love Valley
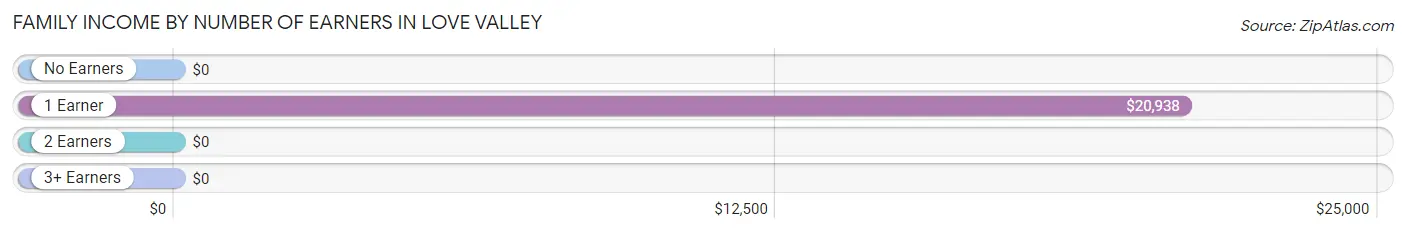
| Number of Earners | # Families | Median Income |
| No Earners | 13 (37.1%) | $0 |
| 1 Earner | 7 (20.0%) | $20,938 |
| 2 Earners | 11 (31.4%) | $0 |
| 3+ Earners | 4 (11.4%) | $0 |
| Total | 35 (100.0%) | $0 |
Household Income in Love Valley
Household Income Brackets in Love Valley
With 40 households falling in the category, the $15,000 to $24,999 income range is the most frequent in Love Valley, accounting for 50.6% of all households.
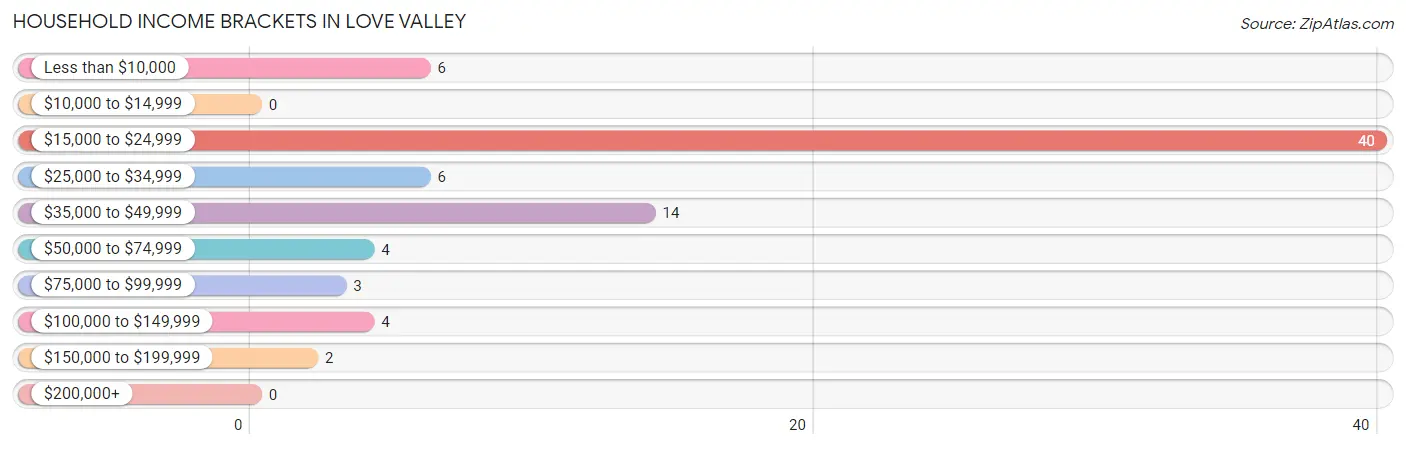
| Income Bracket | # Households | % Households |
| Less than $10,000 | 6 | 7.6% |
| $10,000 to $14,999 | 0 | 0.0% |
| $15,000 to $24,999 | 40 | 50.6% |
| $25,000 to $34,999 | 6 | 7.6% |
| $35,000 to $49,999 | 14 | 17.7% |
| $50,000 to $74,999 | 4 | 5.1% |
| $75,000 to $99,999 | 3 | 3.8% |
| $100,000 to $149,999 | 4 | 5.1% |
| $150,000 to $199,999 | 2 | 2.5% |
| $200,000+ | 0 | 0.0% |
Household Income by Householder Age in Love Valley
The median household income in Love Valley is $20,938, with the highest median household income of $18,875 found in the 65+ years age bracket for the primary householder. A total of 21 households (26.6%) fall into this category.
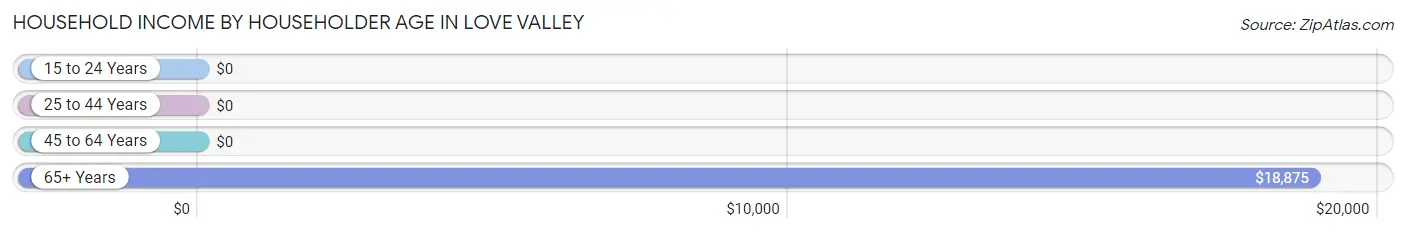
| Income Bracket | # Households | Median Income |
| 15 to 24 Years | 0 (0.0%) | $0 |
| 25 to 44 Years | 13 (16.5%) | $0 |
| 45 to 64 Years | 45 (57.0%) | $0 |
| 65+ Years | 21 (26.6%) | $18,875 |
| Total | 79 (100.0%) | $20,938 |
Poverty in Love Valley
Income Below Poverty by Sex and Age in Love Valley
With 50.9% poverty level for males and 28.6% for females among the residents of Love Valley, under 5 year old males and 45 to 54 year old females are the most vulnerable to poverty, with 5 males (100.0%) and 2 females (100.0%) in their respective age groups living below the poverty level.
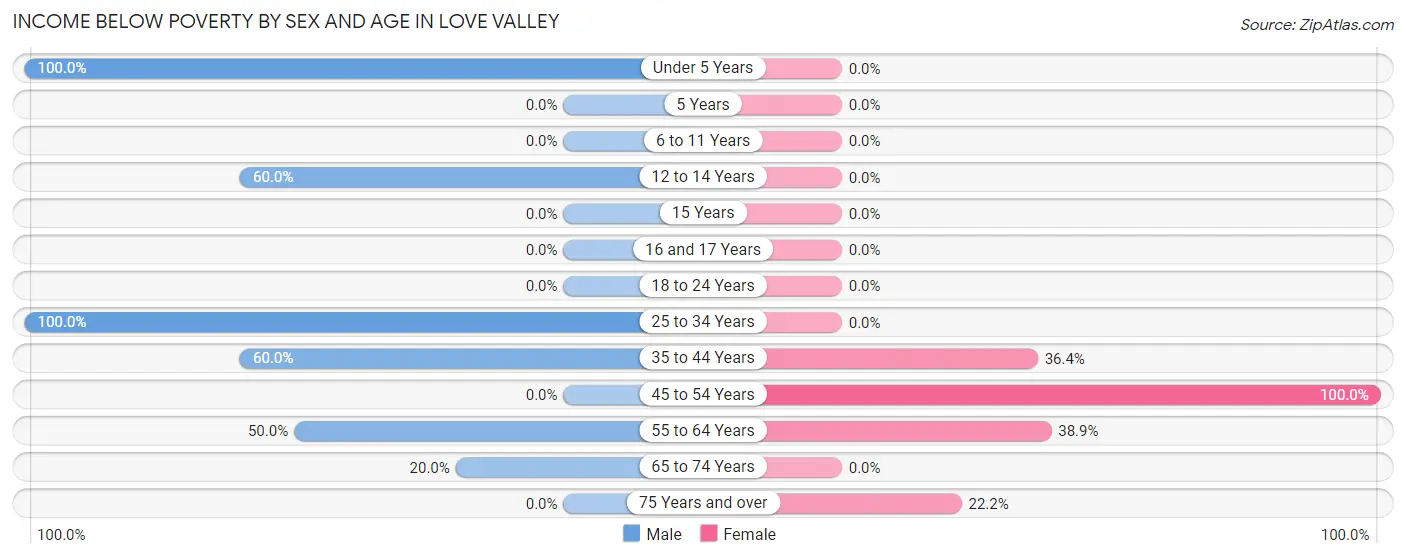
| Age Bracket | Male | Female |
| Under 5 Years | 5 (100.0%) | 0 (0.0%) |
| 5 Years | 0 (0.0%) | 0 (0.0%) |
| 6 to 11 Years | 0 (0.0%) | 0 (0.0%) |
| 12 to 14 Years | 3 (60.0%) | 0 (0.0%) |
| 15 Years | 0 (0.0%) | 0 (0.0%) |
| 16 and 17 Years | 0 (0.0%) | 0 (0.0%) |
| 18 to 24 Years | 0 (0.0%) | 0 (0.0%) |
| 25 to 34 Years | 11 (100.0%) | 0 (0.0%) |
| 35 to 44 Years | 3 (60.0%) | 4 (36.4%) |
| 45 to 54 Years | 0 (0.0%) | 2 (100.0%) |
| 55 to 64 Years | 4 (50.0%) | 14 (38.9%) |
| 65 to 74 Years | 1 (20.0%) | 0 (0.0%) |
| 75 Years and over | 0 (0.0%) | 2 (22.2%) |
| Total | 27 (50.9%) | 22 (28.6%) |
Income Above Poverty by Sex and Age in Love Valley
According to the poverty statistics in Love Valley, males aged 45 to 54 years and females aged 6 to 11 years are the age groups that are most secure financially, with 100.0% of males and 100.0% of females in these age groups living above the poverty line.
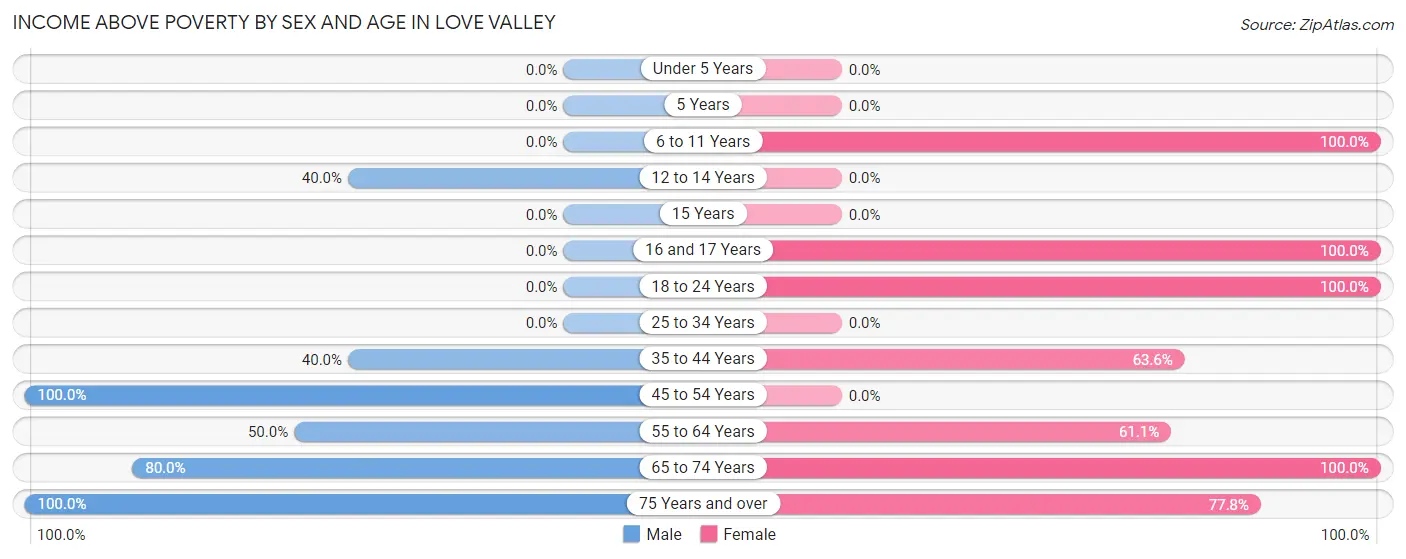
| Age Bracket | Male | Female |
| Under 5 Years | 0 (0.0%) | 0 (0.0%) |
| 5 Years | 0 (0.0%) | 0 (0.0%) |
| 6 to 11 Years | 0 (0.0%) | 1 (100.0%) |
| 12 to 14 Years | 2 (40.0%) | 0 (0.0%) |
| 15 Years | 0 (0.0%) | 0 (0.0%) |
| 16 and 17 Years | 0 (0.0%) | 4 (100.0%) |
| 18 to 24 Years | 0 (0.0%) | 13 (100.0%) |
| 25 to 34 Years | 0 (0.0%) | 0 (0.0%) |
| 35 to 44 Years | 2 (40.0%) | 7 (63.6%) |
| 45 to 54 Years | 4 (100.0%) | 0 (0.0%) |
| 55 to 64 Years | 4 (50.0%) | 22 (61.1%) |
| 65 to 74 Years | 4 (80.0%) | 1 (100.0%) |
| 75 Years and over | 10 (100.0%) | 7 (77.8%) |
| Total | 26 (49.1%) | 55 (71.4%) |
Income Below Poverty Among Married-Couple Families in Love Valley
The poverty statistics for married-couple families in Love Valley show that 50.0% or 6 of the total 12 families live below the poverty line. Families with no children have the highest poverty rate of 100.0%, comprising of 6 families. On the other hand, families with 1 or 2 children have the lowest poverty rate of 0.0%, which includes 0 families.
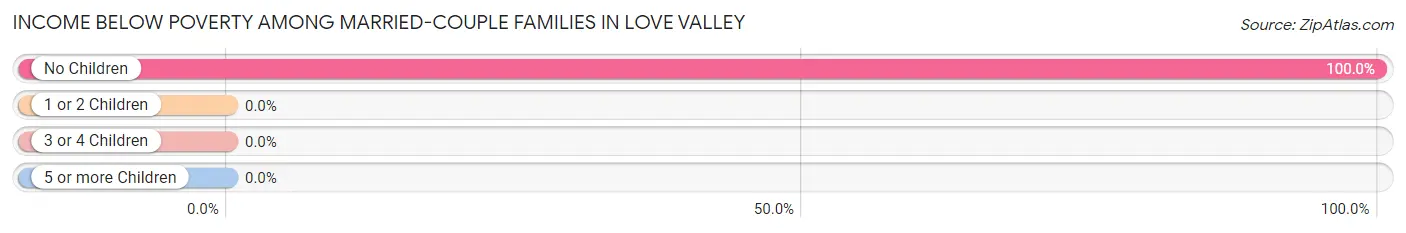
| Children | Above Poverty | Below Poverty |
| No Children | 0 (0.0%) | 6 (100.0%) |
| 1 or 2 Children | 6 (100.0%) | 0 (0.0%) |
| 3 or 4 Children | 0 (0.0%) | 0 (0.0%) |
| 5 or more Children | 0 (0.0%) | 0 (0.0%) |
| Total | 6 (50.0%) | 6 (50.0%) |
Income Below Poverty Among Single-Parent Households in Love Valley
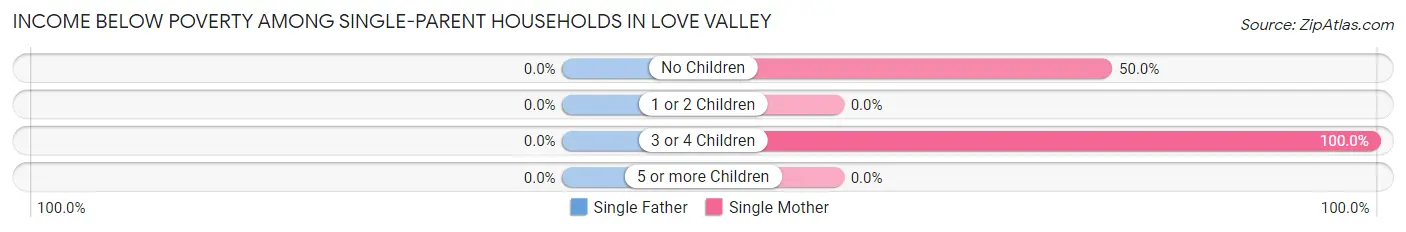
| Children | Single Father | Single Mother |
| No Children | 0 (0.0%) | 9 (50.0%) |
| 1 or 2 Children | 0 (0.0%) | 0 (0.0%) |
| 3 or 4 Children | 0 (0.0%) | 4 (100.0%) |
| 5 or more Children | 0 (0.0%) | 0 (0.0%) |
| Total | 0 (0.0%) | 13 (56.5%) |
Income Below Poverty Among Married-Couple vs Single-Parent Households in Love Valley
The poverty data for Love Valley shows that 6 of the married-couple family households (50.0%) and 13 of the single-parent households (56.5%) are living below the poverty level. Within the married-couple family households, those with no children have the highest poverty rate, with 6 households (100.0%) falling below the poverty line. Among the single-parent households, those with 3 or 4 children have the highest poverty rate, with 4 household (100.0%) living below poverty.
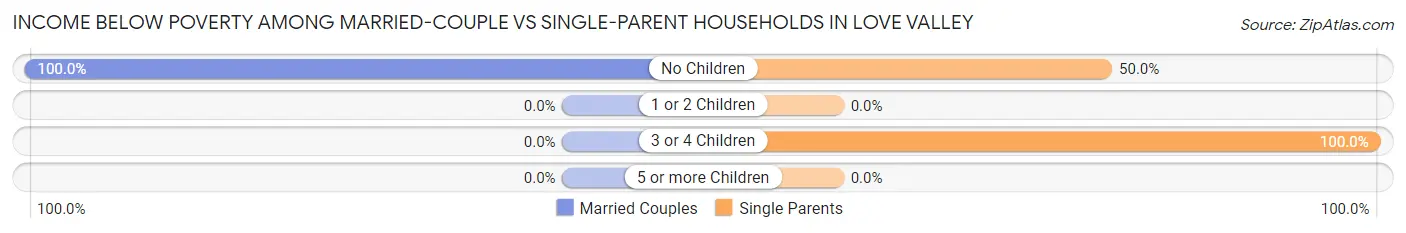
| Children | Married-Couple Families | Single-Parent Households |
| No Children | 6 (100.0%) | 9 (50.0%) |
| 1 or 2 Children | 0 (0.0%) | 0 (0.0%) |
| 3 or 4 Children | 0 (0.0%) | 4 (100.0%) |
| 5 or more Children | 0 (0.0%) | 0 (0.0%) |
| Total | 6 (50.0%) | 13 (56.5%) |
Race in Love Valley
The most populous races in Love Valley are White / Caucasian (125 | 96.2%), and Two or more Races (5 | 3.8%).
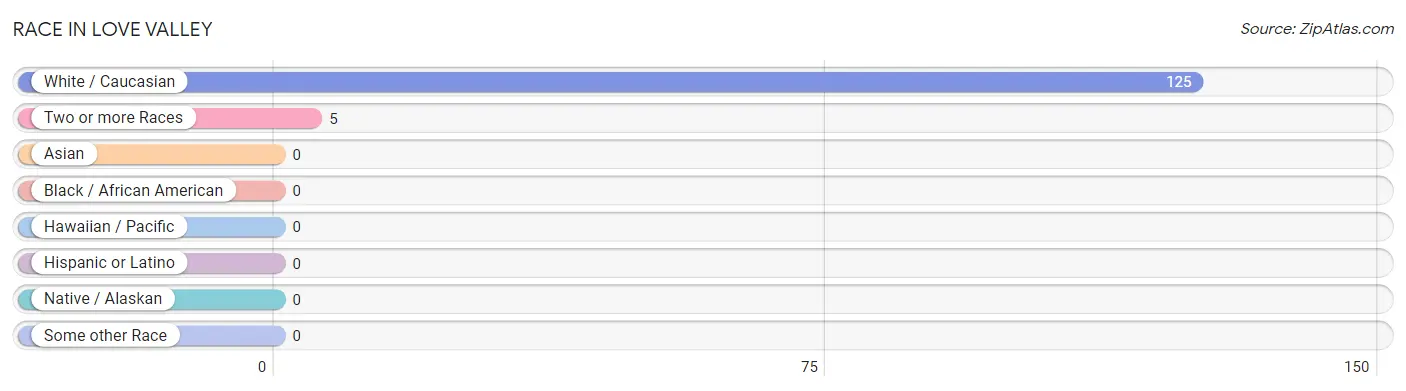
| Race | # Population | % Population |
| Asian | 0 | 0.0% |
| Black / African American | 0 | 0.0% |
| Hawaiian / Pacific | 0 | 0.0% |
| Hispanic or Latino | 0 | 0.0% |
| Native / Alaskan | 0 | 0.0% |
| White / Caucasian | 125 | 96.2% |
| Two or more Races | 5 | 3.8% |
| Some other Race | 0 | 0.0% |
| Total | 130 | 100.0% |
Ancestry in Love Valley
The most populous ancestries reported in Love Valley are Ukrainian (20 | 15.4%), Scottish (12 | 9.2%), Scotch-Irish (9 | 6.9%), Irish (8 | 6.1%), and German (7 | 5.4%), together accounting for 43.1% of all Love Valley residents.
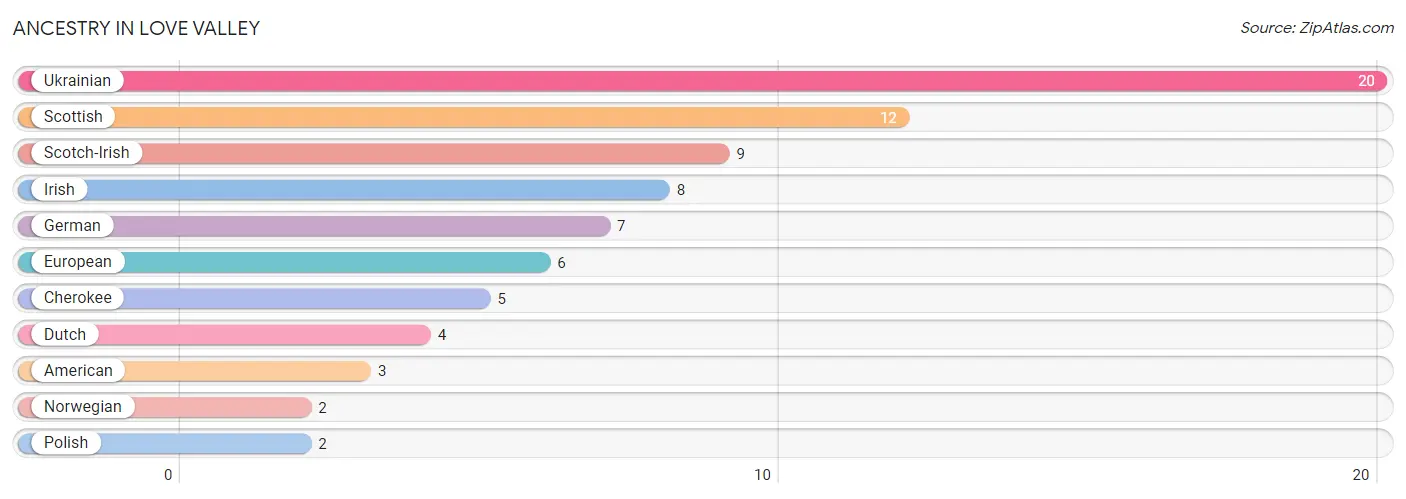
| Ancestry | # Population | % Population |
| American | 3 | 2.3% |
| Cherokee | 5 | 3.8% |
| Dutch | 4 | 3.1% |
| European | 6 | 4.6% |
| German | 7 | 5.4% |
| Irish | 8 | 6.1% |
| Norwegian | 2 | 1.5% |
| Polish | 2 | 1.5% |
| Scotch-Irish | 9 | 6.9% |
| Scottish | 12 | 9.2% |
| Ukrainian | 20 | 15.4% | View All 11 Rows |
Immigrants in Love Valley

| Immigration Origin | # Population | % Population | View All 0 Rows |
Sex and Age in Love Valley
Sex and Age in Love Valley
The most populous age groups in Love Valley are 30 to 34 Years (11 | 20.7%) for men and 55 to 59 Years (20 | 26.0%) for women.
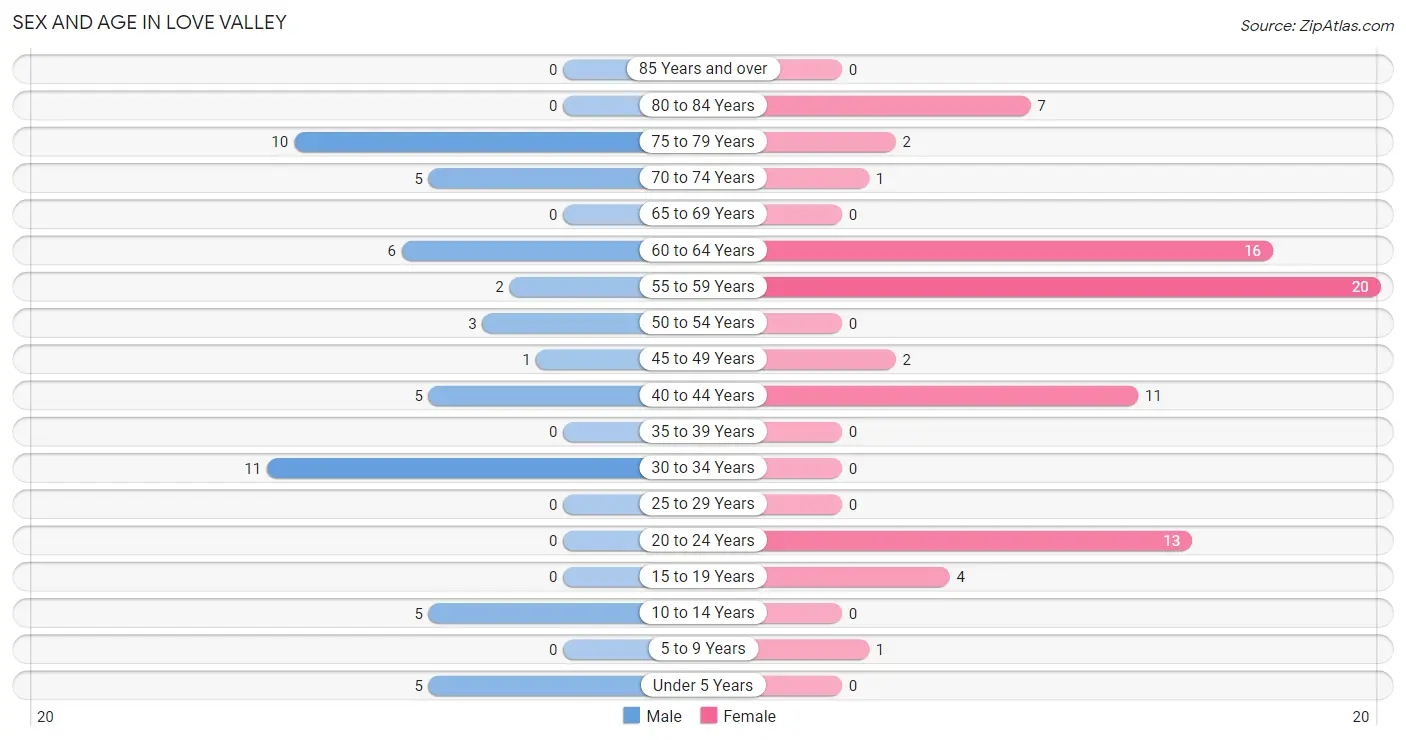
| Age Bracket | Male | Female |
| Under 5 Years | 5 (9.4%) | 0 (0.0%) |
| 5 to 9 Years | 0 (0.0%) | 1 (1.3%) |
| 10 to 14 Years | 5 (9.4%) | 0 (0.0%) |
| 15 to 19 Years | 0 (0.0%) | 4 (5.2%) |
| 20 to 24 Years | 0 (0.0%) | 13 (16.9%) |
| 25 to 29 Years | 0 (0.0%) | 0 (0.0%) |
| 30 to 34 Years | 11 (20.7%) | 0 (0.0%) |
| 35 to 39 Years | 0 (0.0%) | 0 (0.0%) |
| 40 to 44 Years | 5 (9.4%) | 11 (14.3%) |
| 45 to 49 Years | 1 (1.9%) | 2 (2.6%) |
| 50 to 54 Years | 3 (5.7%) | 0 (0.0%) |
| 55 to 59 Years | 2 (3.8%) | 20 (26.0%) |
| 60 to 64 Years | 6 (11.3%) | 16 (20.8%) |
| 65 to 69 Years | 0 (0.0%) | 0 (0.0%) |
| 70 to 74 Years | 5 (9.4%) | 1 (1.3%) |
| 75 to 79 Years | 10 (18.9%) | 2 (2.6%) |
| 80 to 84 Years | 0 (0.0%) | 7 (9.1%) |
| 85 Years and over | 0 (0.0%) | 0 (0.0%) |
| Total | 53 (100.0%) | 77 (100.0%) |
Families and Households in Love Valley
Median Family Size in Love Valley
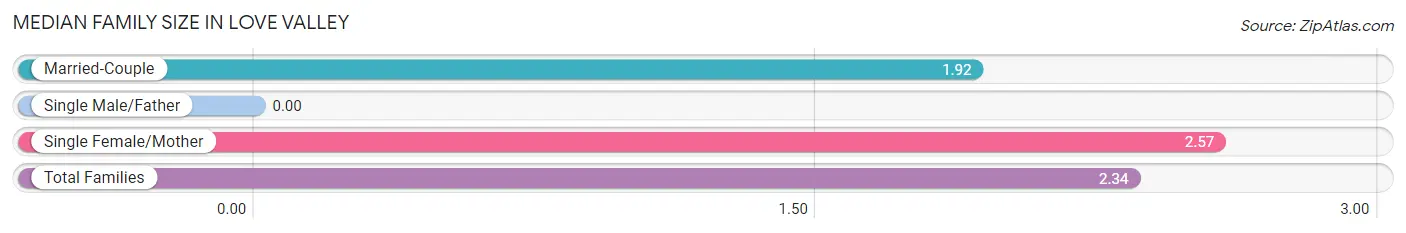
| Family Type | # Families | Family Size |
| Married-Couple | 12 (34.3%) | 1.92 |
| Single Male/Father | 0 (0.0%) | - |
| Single Female/Mother | 23 (65.7%) | 2.57 |
| Total Families | 35 (100.0%) | 2.34 |
Median Household Size in Love Valley
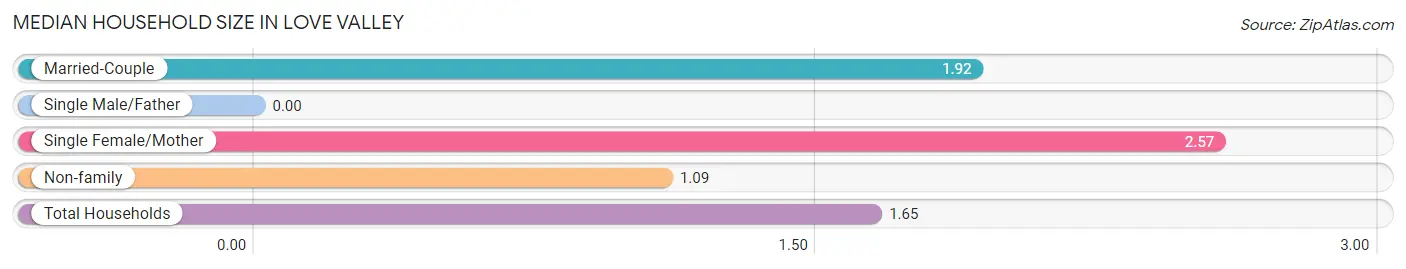
| Household Type | # Households | Household Size |
| Married-Couple | 12 (15.2%) | 1.92 |
| Single Male/Father | 0 (0.0%) | - |
| Single Female/Mother | 23 (29.1%) | 2.57 |
| Non-family | 44 (55.7%) | 1.09 |
| Total Households | 79 (100.0%) | 1.65 |
Household Size by Marriage Status in Love Valley
Out of a total of 79 households in Love Valley, 35 (44.3%) are family households, while 44 (55.7%) are nonfamily households. The most numerous type of family households are 2-person households, comprising 24, and the most common type of nonfamily households are 1-person households, comprising 40.
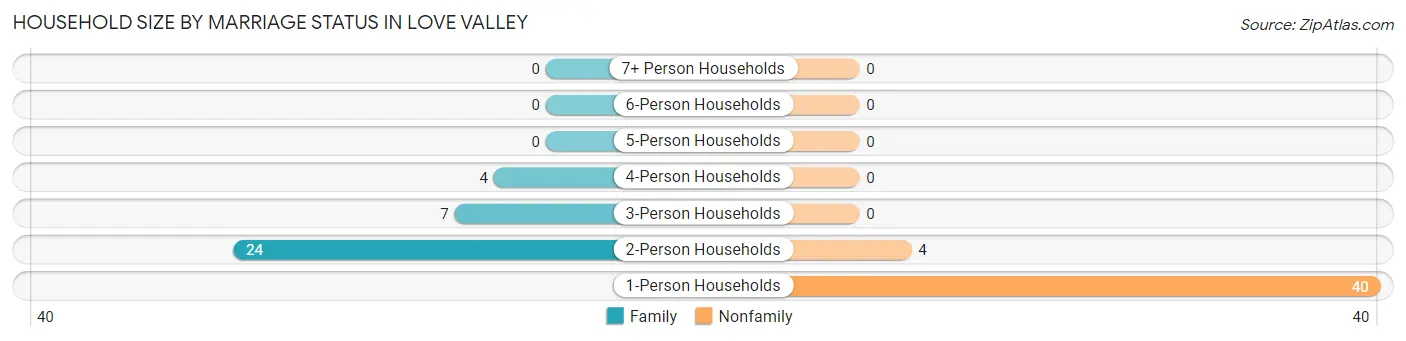
| Household Size | Family Households | Nonfamily Households |
| 1-Person Households | - | 40 (50.6%) |
| 2-Person Households | 24 (30.4%) | 4 (5.1%) |
| 3-Person Households | 7 (8.9%) | 0 (0.0%) |
| 4-Person Households | 4 (5.1%) | 0 (0.0%) |
| 5-Person Households | 0 (0.0%) | 0 (0.0%) |
| 6-Person Households | 0 (0.0%) | 0 (0.0%) |
| 7+ Person Households | 0 (0.0%) | 0 (0.0%) |
| Total | 35 (44.3%) | 44 (55.7%) |
Female Fertility in Love Valley
Fertility by Age in Love Valley
| Age Bracket | Women with Births | Births / 1,000 Women |
| 15 to 19 years | 0 (0.0%) | 0.0 |
| 20 to 34 years | 0 (0.0%) | 0.0 |
| 35 to 50 years | 0 (0.0%) | 0.0 |
| Total | 0 (0.0%) | 0.0 |
Fertility by Age by Marriage Status in Love Valley
| Age Bracket | Married | Unmarried |
| 15 to 19 years | 0 (0.0%) | 0 (0.0%) |
| 20 to 34 years | 0 (0.0%) | 0 (0.0%) |
| 35 to 50 years | 0 (0.0%) | 0 (0.0%) |
| Total | 0 (0.0%) | 0 (0.0%) |
Fertility by Education in Love Valley
| Educational Attainment | Women with Births | Births / 1,000 Women |
| Less than High School | 0 (0.0%) | 0.0 |
| High School Diploma | 0 (0.0%) | 0.0 |
| College or Associate's Degree | 0 (0.0%) | 0.0 |
| Bachelor's Degree | 0 (0.0%) | 0.0 |
| Graduate Degree | 0 (0.0%) | 0.0 |
| Total | 0 (0.0%) | 0.0 |
Fertility by Education by Marriage Status in Love Valley
| Educational Attainment | Married | Unmarried |
| Less than High School | 0 (0.0%) | 0 (0.0%) |
| High School Diploma | 0 (0.0%) | 0 (0.0%) |
| College or Associate's Degree | 0 (0.0%) | 0 (0.0%) |
| Bachelor's Degree | 0 (0.0%) | 0 (0.0%) |
| Graduate Degree | 0 (0.0%) | 0 (0.0%) |
| Total | 0 (0.0%) | 0 (0.0%) |
Employment Characteristics in Love Valley
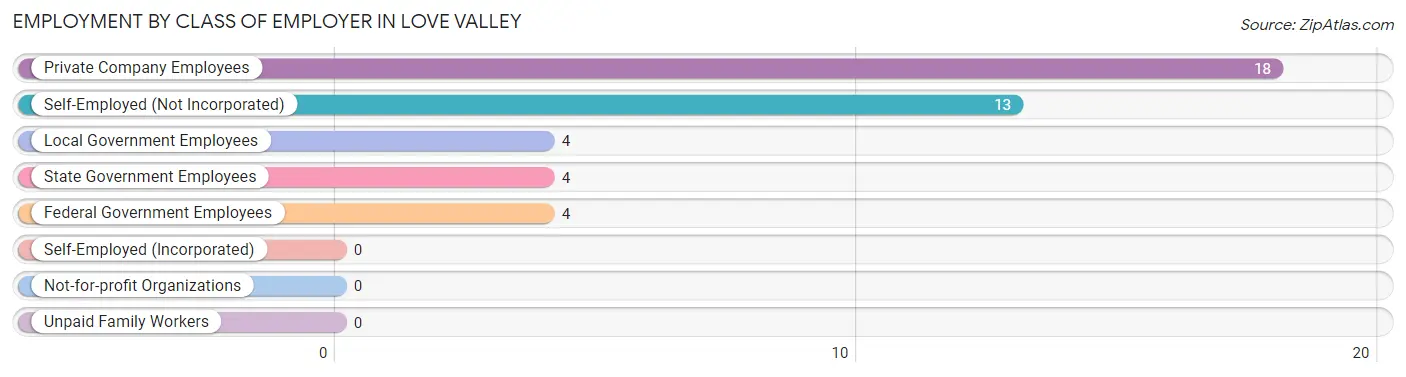
Employment by Class of Employer in Love Valley
Among the 43 employed individuals in Love Valley, private company employees (18 | 41.9%), self-employed (not incorporated) (13 | 30.2%), and local government employees (4 | 9.3%) make up the most common classes of employment.
| Employer Class | # Employees | % Employees |
| Private Company Employees | 18 | 41.9% |
| Self-Employed (Incorporated) | 0 | 0.0% |
| Self-Employed (Not Incorporated) | 13 | 30.2% |
| Not-for-profit Organizations | 0 | 0.0% |
| Local Government Employees | 4 | 9.3% |
| State Government Employees | 4 | 9.3% |
| Federal Government Employees | 4 | 9.3% |
| Unpaid Family Workers | 0 | 0.0% |
| Total | 43 | 100.0% |
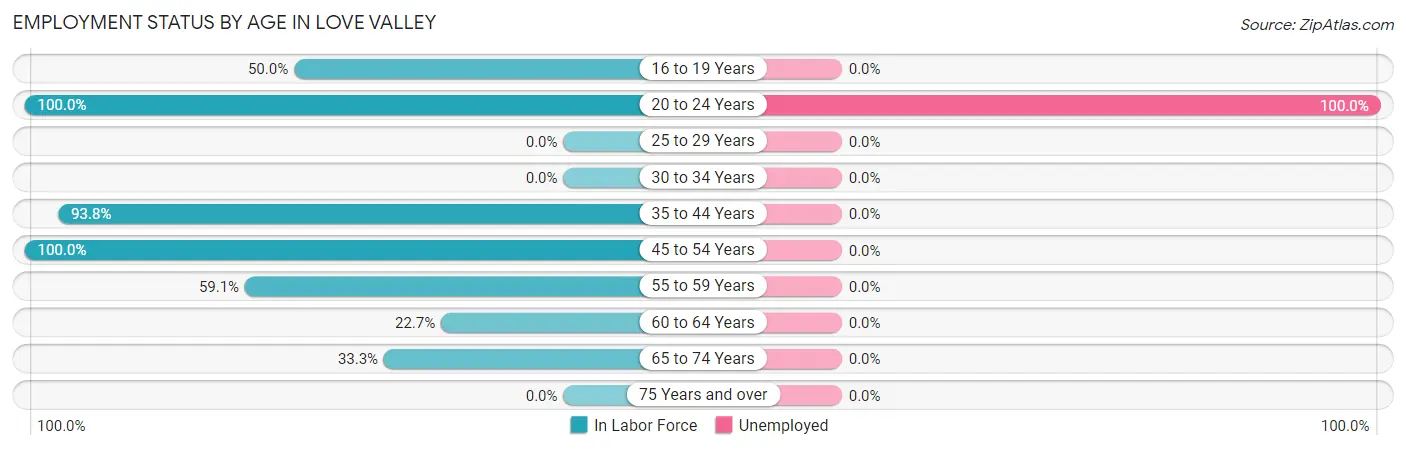
Employment Status by Age in Love Valley
According to the labor force statistics for Love Valley, out of the total population over 16 years of age (119), 47.1% or 56 individuals are in the labor force, with 23.2% or 13 of them unemployed. The age group with the highest labor force participation rate is 20 to 24 years, with 100.0% or 13 individuals in the labor force. Within the labor force, the 20 to 24 years age range has the highest percentage of unemployed individuals, with 100.0% or 13 of them being unemployed.
| Age Bracket | In Labor Force | Unemployed |
| 16 to 19 Years | 2 (50.0%) | 0 (0.0%) |
| 20 to 24 Years | 13 (100.0%) | 13 (100.0%) |
| 25 to 29 Years | 0 (0.0%) | 0 (0.0%) |
| 30 to 34 Years | 0 (0.0%) | 0 (0.0%) |
| 35 to 44 Years | 15 (93.8%) | 0 (0.0%) |
| 45 to 54 Years | 6 (100.0%) | 0 (0.0%) |
| 55 to 59 Years | 13 (59.1%) | 0 (0.0%) |
| 60 to 64 Years | 5 (22.7%) | 0 (0.0%) |
| 65 to 74 Years | 2 (33.3%) | 0 (0.0%) |
| 75 Years and over | 0 (0.0%) | 0 (0.0%) |
| Total | 56 (47.1%) | 13 (23.2%) |
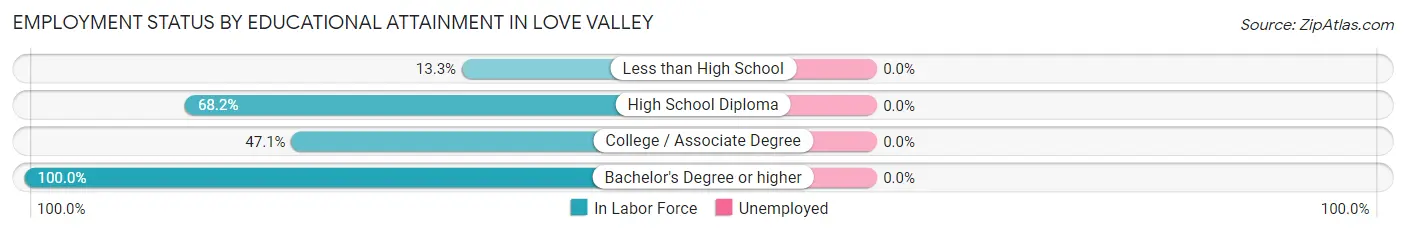
Employment Status by Educational Attainment in Love Valley
| Educational Attainment | In Labor Force | Unemployed |
| Less than High School | 2 (13.3%) | 0 (0.0%) |
| High School Diploma | 15 (68.2%) | 0 (0.0%) |
| College / Associate Degree | 16 (47.1%) | 0 (0.0%) |
| Bachelor's Degree or higher | 6 (100.0%) | 0 (0.0%) |
| Total | 39 (50.6%) | 0 (0.0%) |
Employment Occupations by Sex in Love Valley
Management, Business, Science and Arts Occupations
The most common Management, Business, Science and Arts occupations in Love Valley are Management (5 | 11.6%), Community & Social Service (4 | 9.3%), Education, Arts & Media (4 | 9.3%), Computers, Engineering & Science (2 | 4.6%), and Computers & Mathematics (2 | 4.6%).
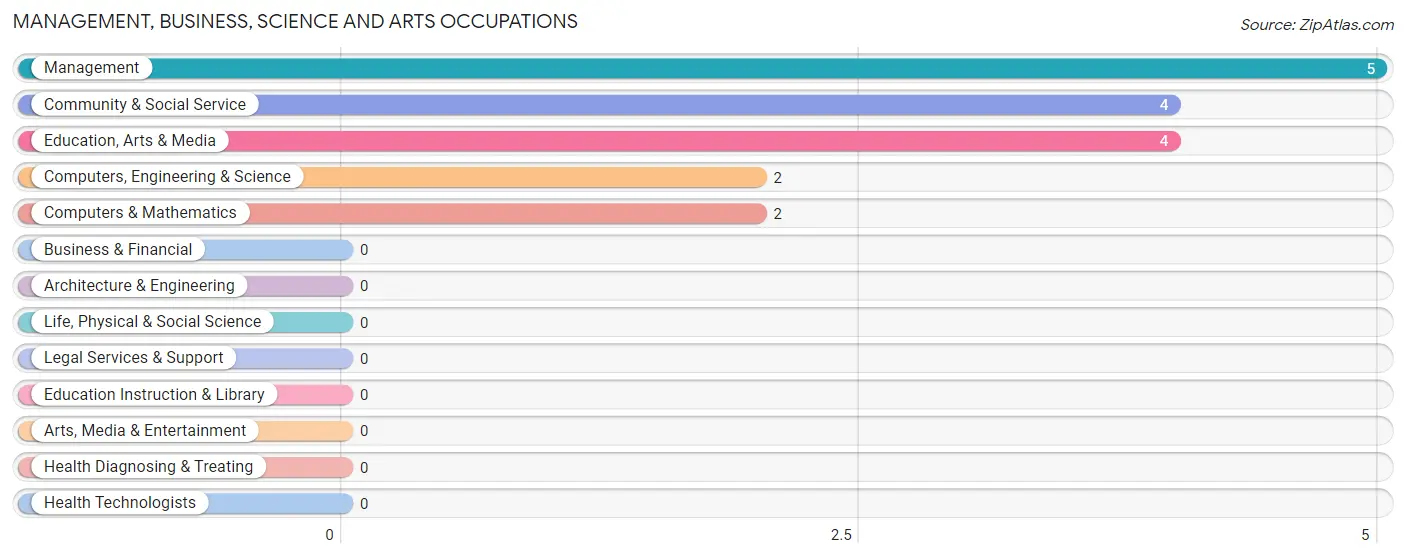
Management, Business, Science and Arts Occupations by Sex
Within the Management, Business, Science and Arts occupations in Love Valley, the most male-oriented occupations are Computers, Engineering & Science (100.0%), and Computers & Mathematics (100.0%), while the most female-oriented occupations are Management (100.0%), Community & Social Service (100.0%), and Education, Arts & Media (100.0%).
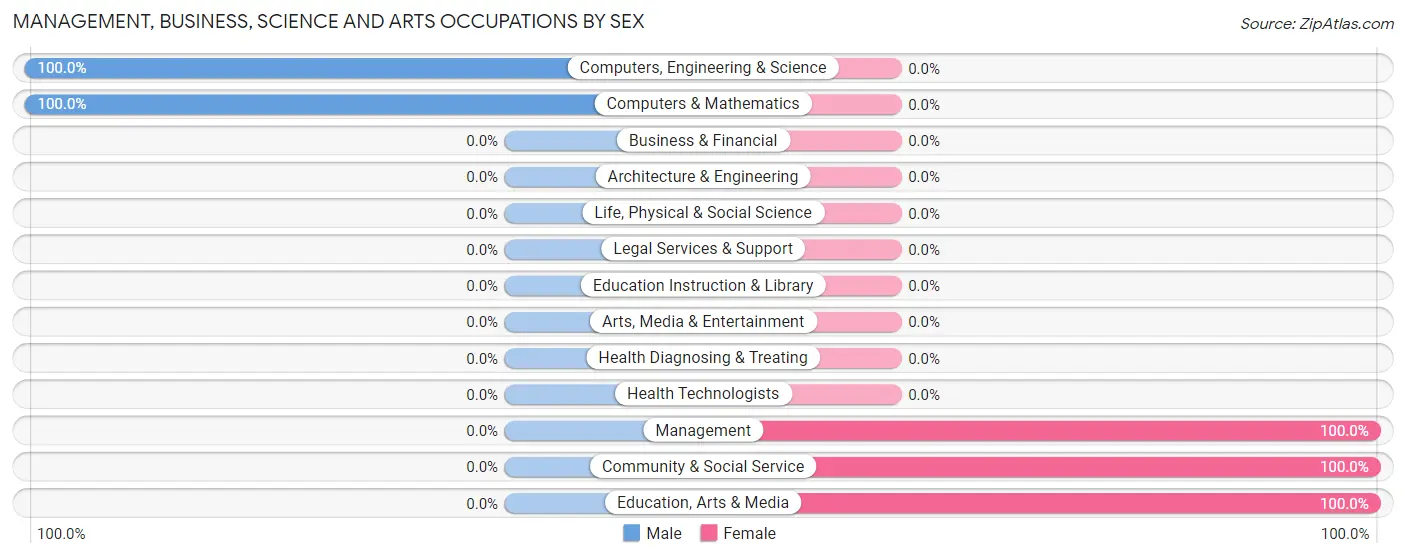
| Occupation | Male | Female |
| Management | 0 (0.0%) | 5 (100.0%) |
| Business & Financial | 0 (0.0%) | 0 (0.0%) |
| Computers, Engineering & Science | 2 (100.0%) | 0 (0.0%) |
| Computers & Mathematics | 2 (100.0%) | 0 (0.0%) |
| Architecture & Engineering | 0 (0.0%) | 0 (0.0%) |
| Life, Physical & Social Science | 0 (0.0%) | 0 (0.0%) |
| Community & Social Service | 0 (0.0%) | 4 (100.0%) |
| Education, Arts & Media | 0 (0.0%) | 4 (100.0%) |
| Legal Services & Support | 0 (0.0%) | 0 (0.0%) |
| Education Instruction & Library | 0 (0.0%) | 0 (0.0%) |
| Arts, Media & Entertainment | 0 (0.0%) | 0 (0.0%) |
| Health Diagnosing & Treating | 0 (0.0%) | 0 (0.0%) |
| Health Technologists | 0 (0.0%) | 0 (0.0%) |
| Total (Category) | 2 (18.2%) | 9 (81.8%) |
| Total (Overall) | 12 (27.9%) | 31 (72.1%) |
Services Occupations
The most common Services occupations in Love Valley are , and Food Preparation & Serving (11 | 25.6%).
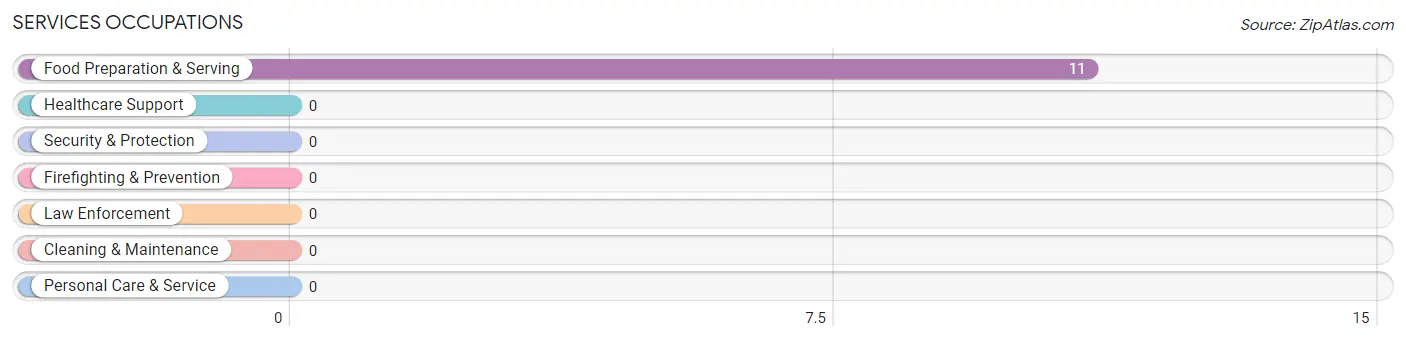
Services Occupations by Sex
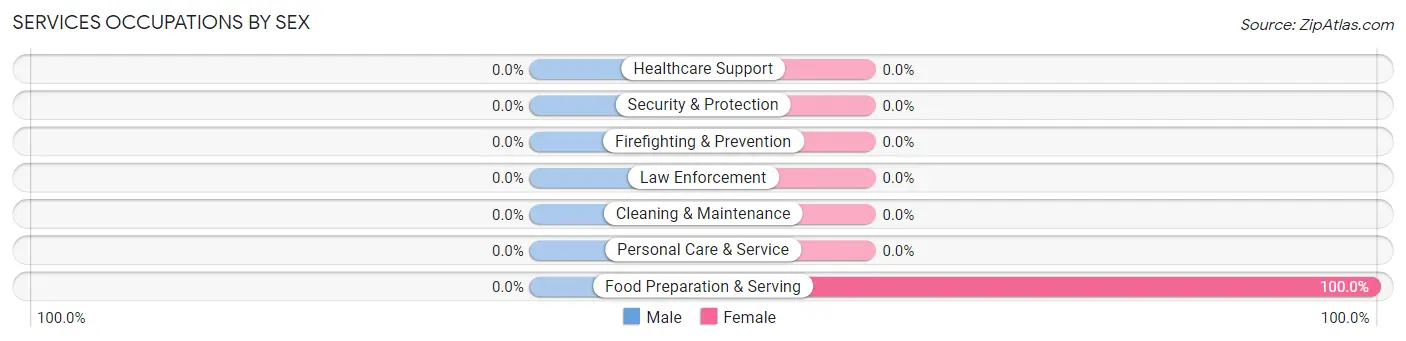
| Occupation | Male | Female |
| Healthcare Support | 0 (0.0%) | 0 (0.0%) |
| Security & Protection | 0 (0.0%) | 0 (0.0%) |
| Firefighting & Prevention | 0 (0.0%) | 0 (0.0%) |
| Law Enforcement | 0 (0.0%) | 0 (0.0%) |
| Food Preparation & Serving | 0 (0.0%) | 11 (100.0%) |
| Cleaning & Maintenance | 0 (0.0%) | 0 (0.0%) |
| Personal Care & Service | 0 (0.0%) | 0 (0.0%) |
| Total (Category) | 0 (0.0%) | 11 (100.0%) |
| Total (Overall) | 12 (27.9%) | 31 (72.1%) |
Sales and Office Occupations
The most common Sales and Office occupations in Love Valley are Office & Administration (9 | 20.9%), and Sales & Related (2 | 4.6%).
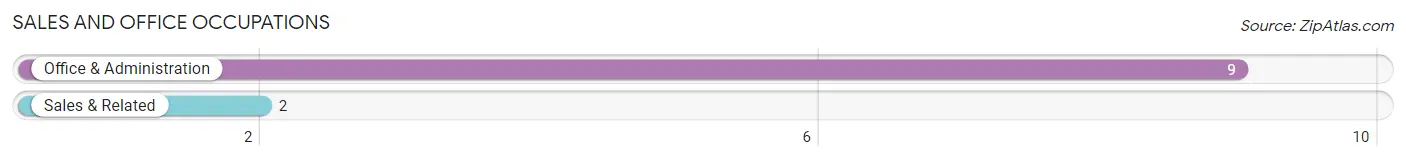
Sales and Office Occupations by Sex
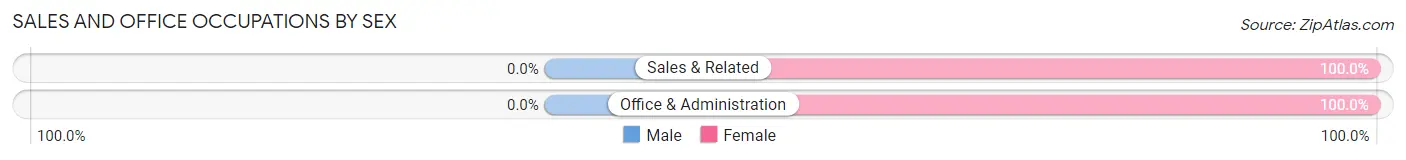
| Occupation | Male | Female |
| Sales & Related | 0 (0.0%) | 2 (100.0%) |
| Office & Administration | 0 (0.0%) | 9 (100.0%) |
| Total (Category) | 0 (0.0%) | 11 (100.0%) |
| Total (Overall) | 12 (27.9%) | 31 (72.1%) |
Natural Resources, Construction and Maintenance Occupations
The most common Natural Resources, Construction and Maintenance occupations in Love Valley are , and Construction & Extraction (1 | 2.3%).
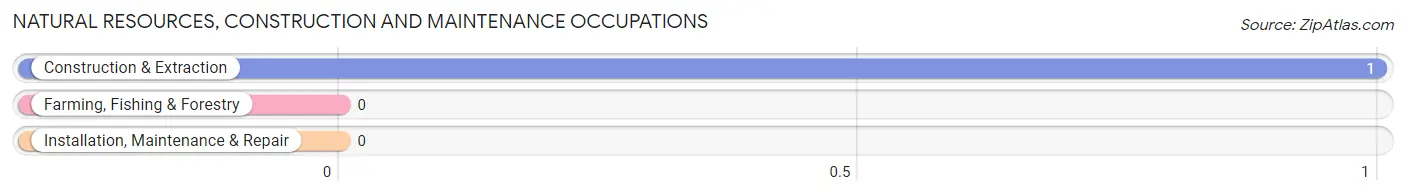
Natural Resources, Construction and Maintenance Occupations by Sex
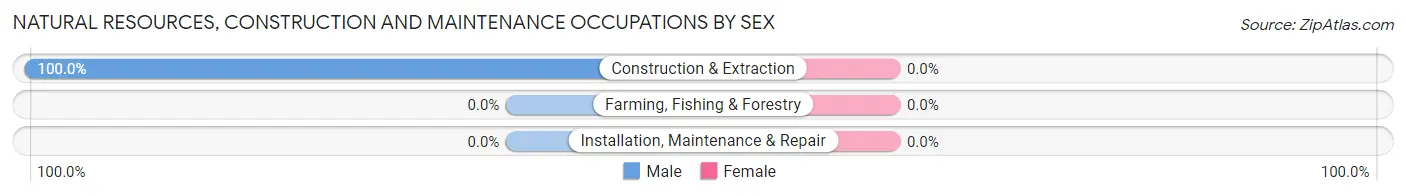
| Occupation | Male | Female |
| Farming, Fishing & Forestry | 0 (0.0%) | 0 (0.0%) |
| Construction & Extraction | 1 (100.0%) | 0 (0.0%) |
| Installation, Maintenance & Repair | 0 (0.0%) | 0 (0.0%) |
| Total (Category) | 1 (100.0%) | 0 (0.0%) |
| Total (Overall) | 12 (27.9%) | 31 (72.1%) |
Production, Transportation and Moving Occupations
The most common Production, Transportation and Moving occupations in Love Valley are Transportation (5 | 11.6%), Production (2 | 4.6%), and Material Moving (2 | 4.6%).
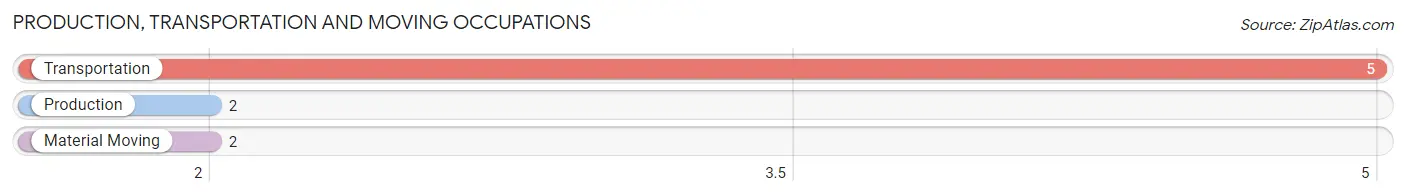
Production, Transportation and Moving Occupations by Sex
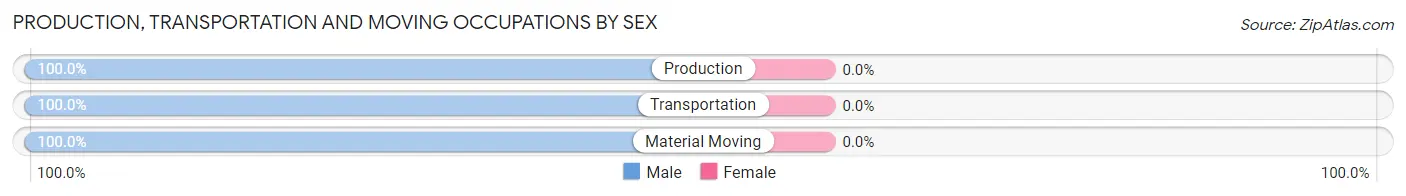
| Occupation | Male | Female |
| Production | 2 (100.0%) | 0 (0.0%) |
| Transportation | 5 (100.0%) | 0 (0.0%) |
| Material Moving | 2 (100.0%) | 0 (0.0%) |
| Total (Category) | 9 (100.0%) | 0 (0.0%) |
| Total (Overall) | 12 (27.9%) | 31 (72.1%) |
Employment Industries by Sex in Love Valley
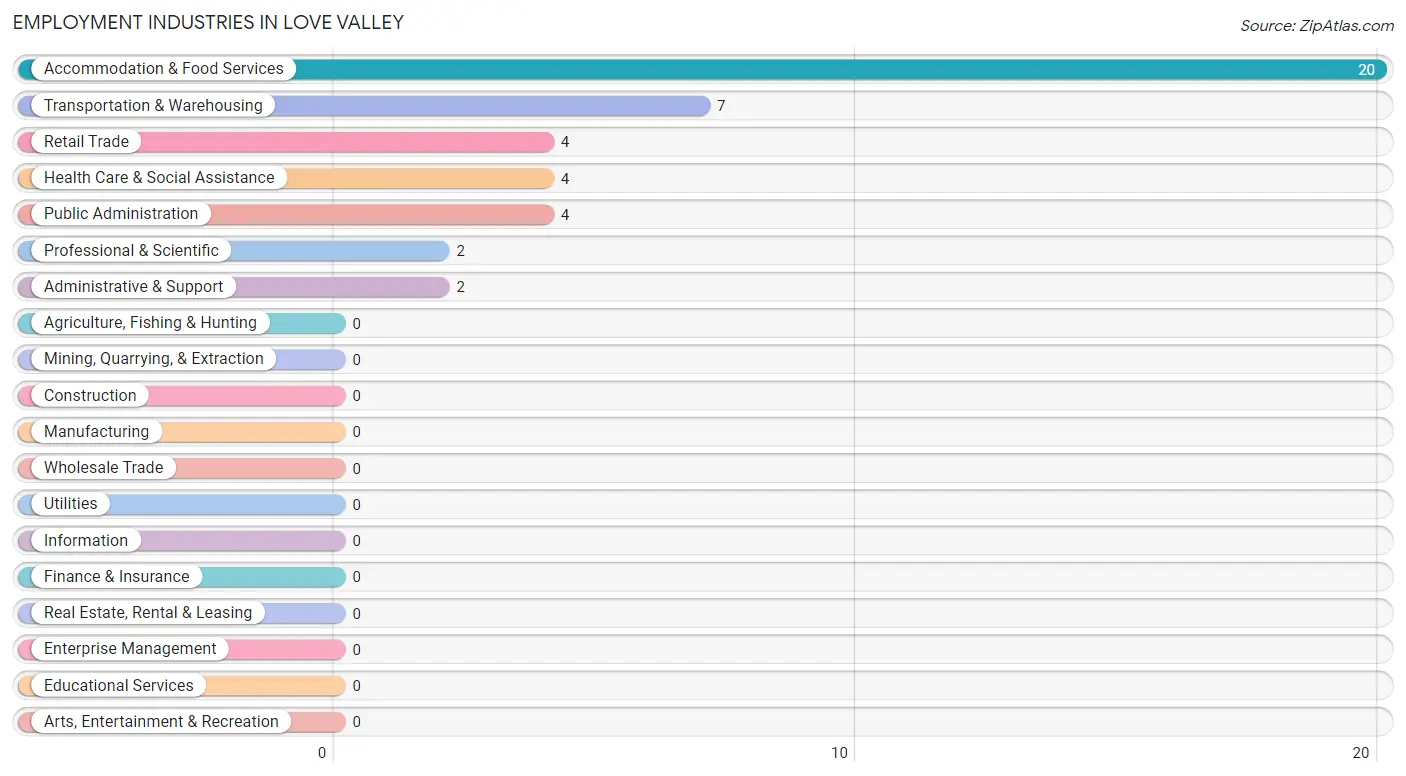
Employment Industries in Love Valley
The major employment industries in Love Valley include Accommodation & Food Services (20 | 46.5%), Transportation & Warehousing (7 | 16.3%), Retail Trade (4 | 9.3%), Health Care & Social Assistance (4 | 9.3%), and Public Administration (4 | 9.3%).
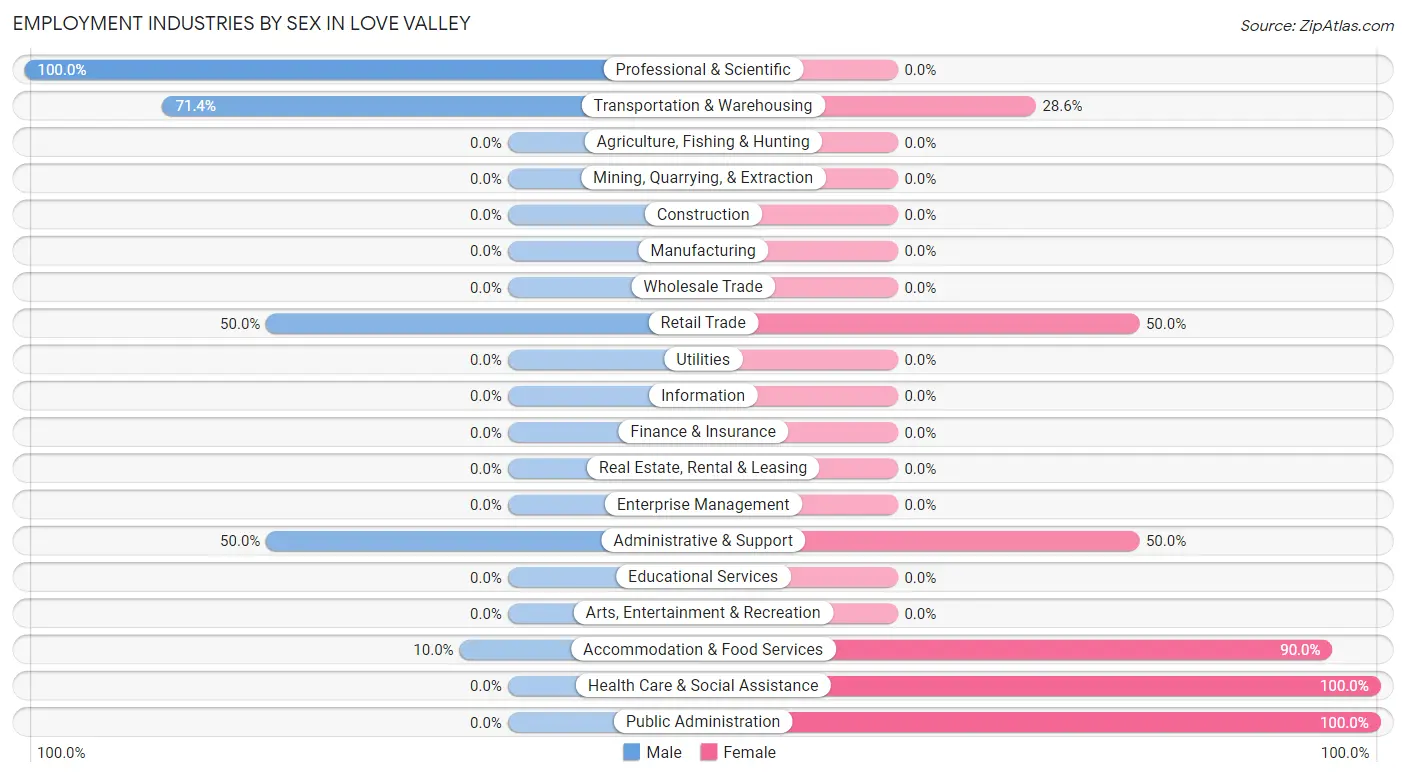
Employment Industries by Sex in Love Valley
The Love Valley industries that see more men than women are Professional & Scientific (100.0%), Transportation & Warehousing (71.4%), and Retail Trade (50.0%), whereas the industries that tend to have a higher number of women are Health Care & Social Assistance (100.0%), Public Administration (100.0%), and Accommodation & Food Services (90.0%).
| Industry | Male | Female |
| Agriculture, Fishing & Hunting | 0 (0.0%) | 0 (0.0%) |
| Mining, Quarrying, & Extraction | 0 (0.0%) | 0 (0.0%) |
| Construction | 0 (0.0%) | 0 (0.0%) |
| Manufacturing | 0 (0.0%) | 0 (0.0%) |
| Wholesale Trade | 0 (0.0%) | 0 (0.0%) |
| Retail Trade | 2 (50.0%) | 2 (50.0%) |
| Transportation & Warehousing | 5 (71.4%) | 2 (28.6%) |
| Utilities | 0 (0.0%) | 0 (0.0%) |
| Information | 0 (0.0%) | 0 (0.0%) |
| Finance & Insurance | 0 (0.0%) | 0 (0.0%) |
| Real Estate, Rental & Leasing | 0 (0.0%) | 0 (0.0%) |
| Professional & Scientific | 2 (100.0%) | 0 (0.0%) |
| Enterprise Management | 0 (0.0%) | 0 (0.0%) |
| Administrative & Support | 1 (50.0%) | 1 (50.0%) |
| Educational Services | 0 (0.0%) | 0 (0.0%) |
| Health Care & Social Assistance | 0 (0.0%) | 4 (100.0%) |
| Arts, Entertainment & Recreation | 0 (0.0%) | 0 (0.0%) |
| Accommodation & Food Services | 2 (10.0%) | 18 (90.0%) |
| Public Administration | 0 (0.0%) | 4 (100.0%) |
| Total | 12 (27.9%) | 31 (72.1%) |
Education in Love Valley
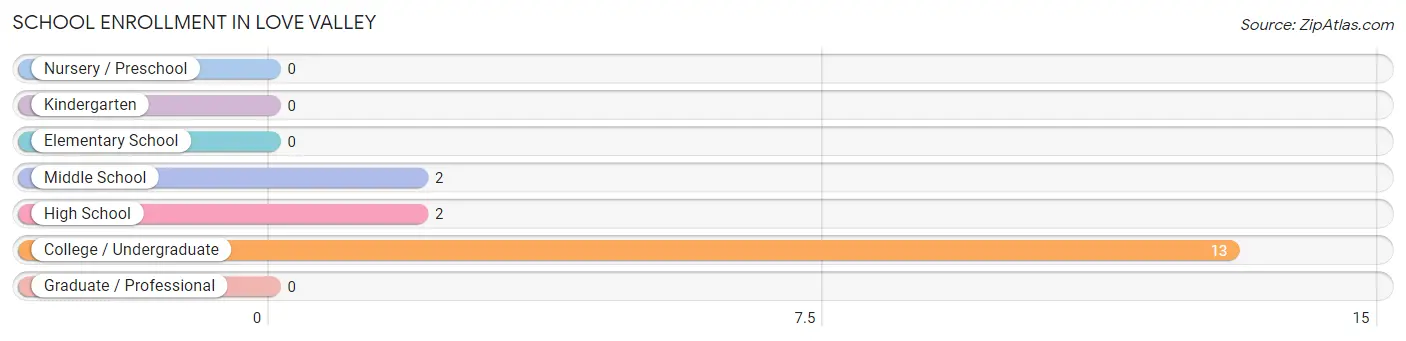
School Enrollment in Love Valley
The most common levels of schooling among the 17 students in Love Valley are college / undergraduate (13 | 76.5%), middle school (2 | 11.8%), and high school (2 | 11.8%).
| School Level | # Students | % Students |
| Nursery / Preschool | 0 | 0.0% |
| Kindergarten | 0 | 0.0% |
| Elementary School | 0 | 0.0% |
| Middle School | 2 | 11.8% |
| High School | 2 | 11.8% |
| College / Undergraduate | 13 | 76.5% |
| Graduate / Professional | 0 | 0.0% |
| Total | 17 | 100.0% |
School Enrollment by Age by Funding Source in Love Valley
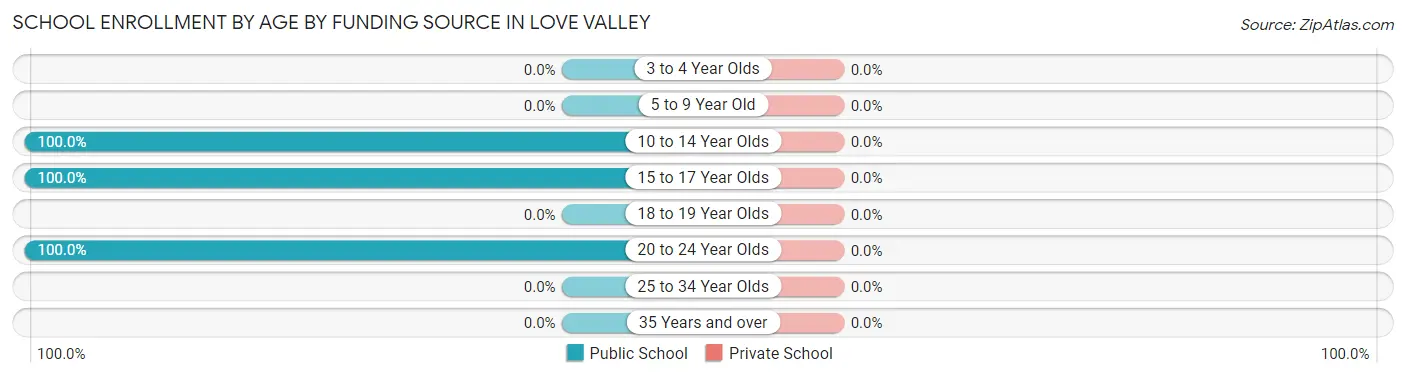
| Age Bracket | Public School | Private School |
| 3 to 4 Year Olds | 0 (0.0%) | 0 (0.0%) |
| 5 to 9 Year Old | 0 (0.0%) | 0 (0.0%) |
| 10 to 14 Year Olds | 2 (100.0%) | 0 (0.0%) |
| 15 to 17 Year Olds | 2 (100.0%) | 0 (0.0%) |
| 18 to 19 Year Olds | 0 (0.0%) | 0 (0.0%) |
| 20 to 24 Year Olds | 13 (100.0%) | 0 (0.0%) |
| 25 to 34 Year Olds | 0 (0.0%) | 0 (0.0%) |
| 35 Years and over | 0 (0.0%) | 0 (0.0%) |
| Total | 17 (100.0%) | 0 (0.0%) |
Educational Attainment by Field of Study in Love Valley
Arts & humanities (4 | 66.7%), and literature & languages (2 | 33.3%) are the most common fields of study among 6 individuals in Love Valley who have obtained a bachelor's degree or higher.
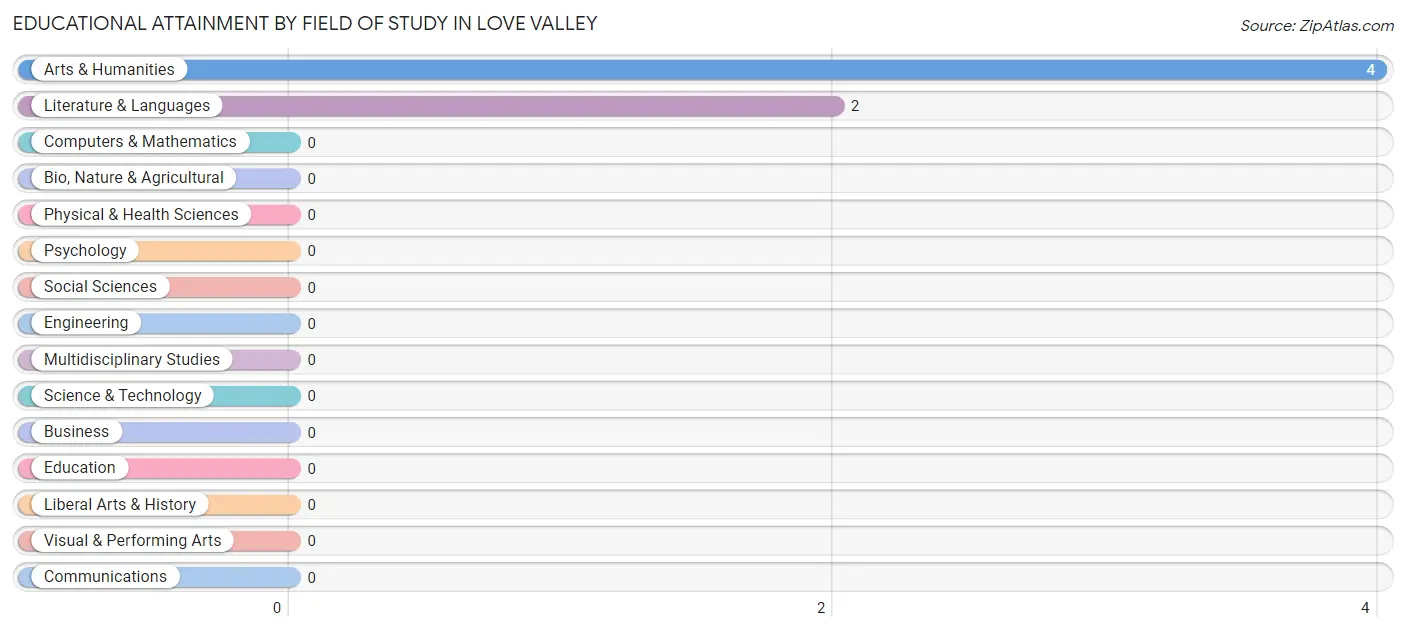
| Field of Study | # Graduates | % Graduates |
| Computers & Mathematics | 0 | 0.0% |
| Bio, Nature & Agricultural | 0 | 0.0% |
| Physical & Health Sciences | 0 | 0.0% |
| Psychology | 0 | 0.0% |
| Social Sciences | 0 | 0.0% |
| Engineering | 0 | 0.0% |
| Multidisciplinary Studies | 0 | 0.0% |
| Science & Technology | 0 | 0.0% |
| Business | 0 | 0.0% |
| Education | 0 | 0.0% |
| Literature & Languages | 2 | 33.3% |
| Liberal Arts & History | 0 | 0.0% |
| Visual & Performing Arts | 0 | 0.0% |
| Communications | 0 | 0.0% |
| Arts & Humanities | 4 | 66.7% |
| Total | 6 | 100.0% |
Transportation & Commute in Love Valley
Vehicle Availability by Sex in Love Valley
The most prevalent vehicle ownership categories in Love Valley are males with 1 vehicle (6, accounting for 50.0%) and females with 1 vehicle (8, making up 19.4%).
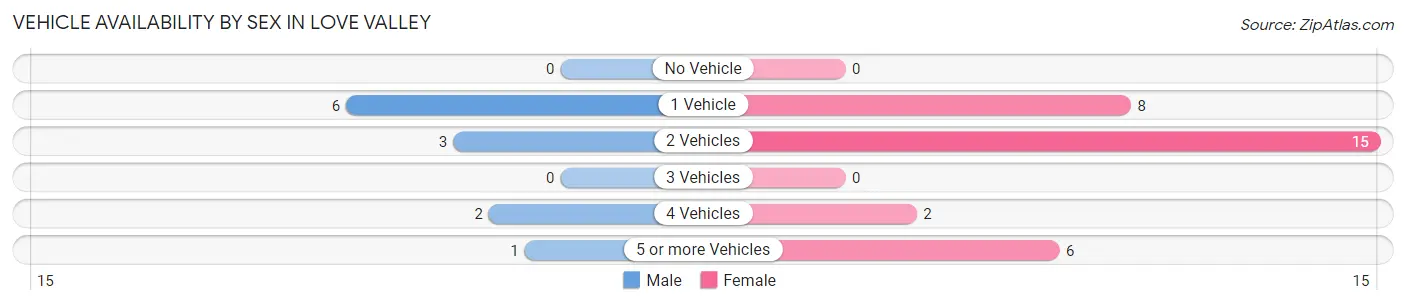
| Vehicles Available | Male | Female |
| No Vehicle | 0 (0.0%) | 0 (0.0%) |
| 1 Vehicle | 6 (50.0%) | 8 (25.8%) |
| 2 Vehicles | 3 (25.0%) | 15 (48.4%) |
| 3 Vehicles | 0 (0.0%) | 0 (0.0%) |
| 4 Vehicles | 2 (16.7%) | 2 (6.5%) |
| 5 or more Vehicles | 1 (8.3%) | 6 (19.4%) |
| Total | 12 (100.0%) | 31 (100.0%) |
Commute Time in Love Valley
The most frequently occuring commute durations in Love Valley are 25 to 29 minutes (11 commuters, 25.6%), 30 to 34 minutes (9 commuters, 20.9%), and 20 to 24 minutes (7 commuters, 16.3%).
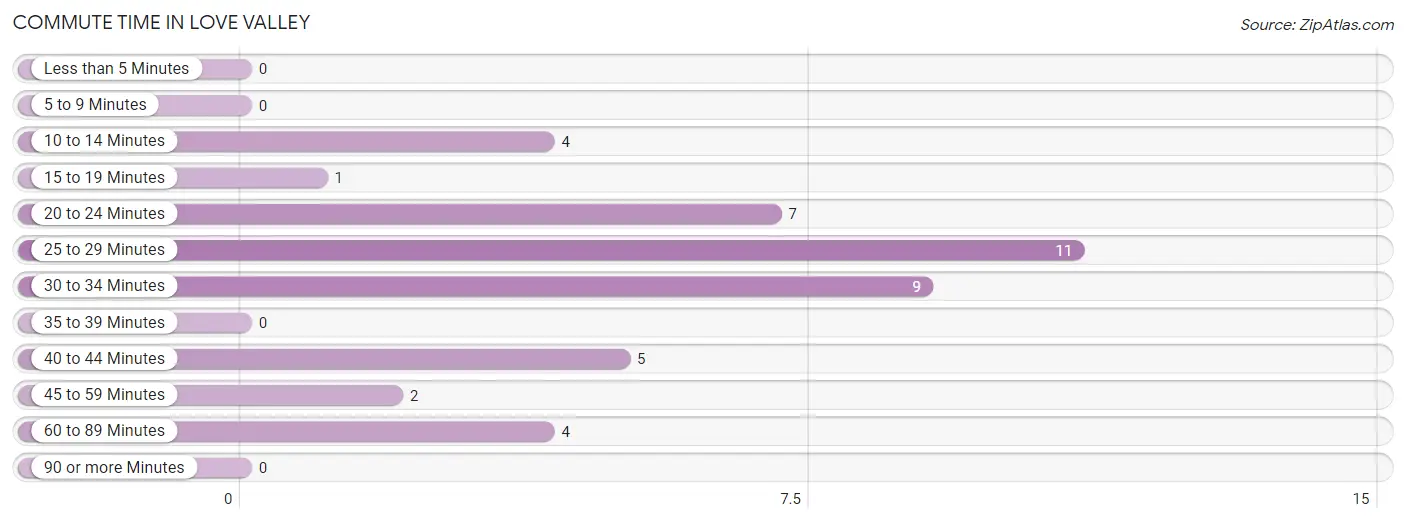
| Commute Time | # Commuters | % Commuters |
| Less than 5 Minutes | 0 | 0.0% |
| 5 to 9 Minutes | 0 | 0.0% |
| 10 to 14 Minutes | 4 | 9.3% |
| 15 to 19 Minutes | 1 | 2.3% |
| 20 to 24 Minutes | 7 | 16.3% |
| 25 to 29 Minutes | 11 | 25.6% |
| 30 to 34 Minutes | 9 | 20.9% |
| 35 to 39 Minutes | 0 | 0.0% |
| 40 to 44 Minutes | 5 | 11.6% |
| 45 to 59 Minutes | 2 | 4.6% |
| 60 to 89 Minutes | 4 | 9.3% |
| 90 or more Minutes | 0 | 0.0% |
Commute Time by Sex in Love Valley
The most common commute times in Love Valley are 10 to 14 minutes (4 commuters, 33.3%) for males and 25 to 29 minutes (11 commuters, 35.5%) for females.
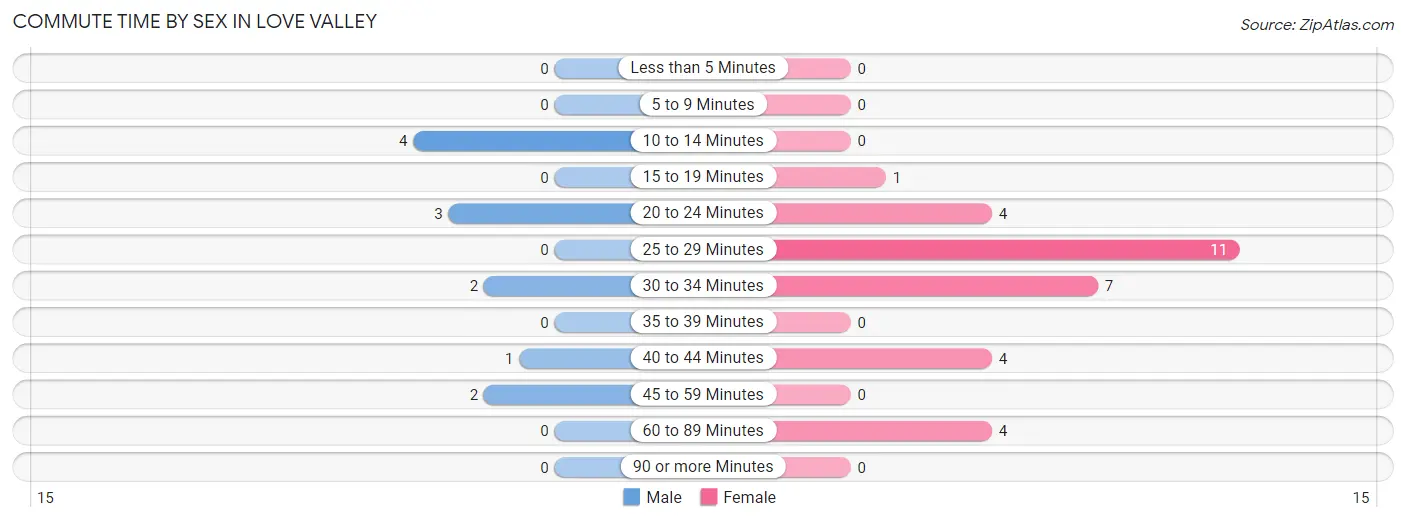
| Commute Time | Male | Female |
| Less than 5 Minutes | 0 (0.0%) | 0 (0.0%) |
| 5 to 9 Minutes | 0 (0.0%) | 0 (0.0%) |
| 10 to 14 Minutes | 4 (33.3%) | 0 (0.0%) |
| 15 to 19 Minutes | 0 (0.0%) | 1 (3.2%) |
| 20 to 24 Minutes | 3 (25.0%) | 4 (12.9%) |
| 25 to 29 Minutes | 0 (0.0%) | 11 (35.5%) |
| 30 to 34 Minutes | 2 (16.7%) | 7 (22.6%) |
| 35 to 39 Minutes | 0 (0.0%) | 0 (0.0%) |
| 40 to 44 Minutes | 1 (8.3%) | 4 (12.9%) |
| 45 to 59 Minutes | 2 (16.7%) | 0 (0.0%) |
| 60 to 89 Minutes | 0 (0.0%) | 4 (12.9%) |
| 90 or more Minutes | 0 (0.0%) | 0 (0.0%) |
Time of Departure to Work by Sex in Love Valley
The most frequent times of departure to work in Love Valley are 12:00 AM to 4:59 AM (9, 75.0%) for males and 5:00 AM to 5:29 AM (9, 29.0%) for females.
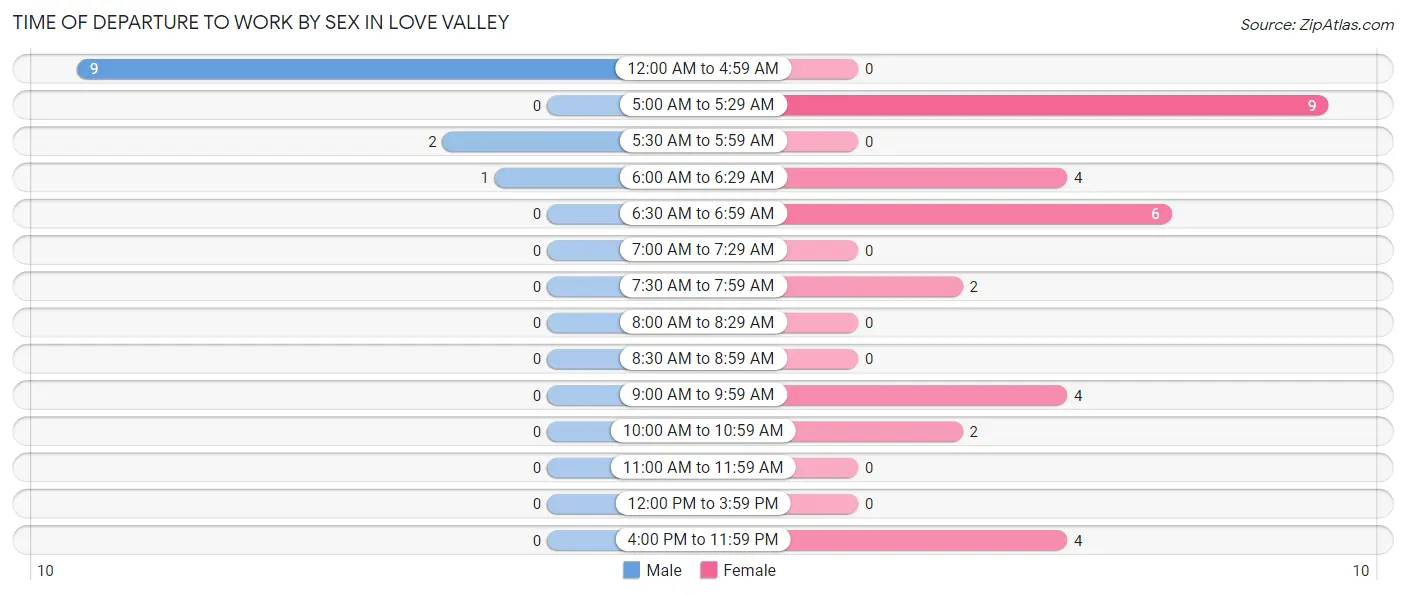
| Time of Departure | Male | Female |
| 12:00 AM to 4:59 AM | 9 (75.0%) | 0 (0.0%) |
| 5:00 AM to 5:29 AM | 0 (0.0%) | 9 (29.0%) |
| 5:30 AM to 5:59 AM | 2 (16.7%) | 0 (0.0%) |
| 6:00 AM to 6:29 AM | 1 (8.3%) | 4 (12.9%) |
| 6:30 AM to 6:59 AM | 0 (0.0%) | 6 (19.4%) |
| 7:00 AM to 7:29 AM | 0 (0.0%) | 0 (0.0%) |
| 7:30 AM to 7:59 AM | 0 (0.0%) | 2 (6.5%) |
| 8:00 AM to 8:29 AM | 0 (0.0%) | 0 (0.0%) |
| 8:30 AM to 8:59 AM | 0 (0.0%) | 0 (0.0%) |
| 9:00 AM to 9:59 AM | 0 (0.0%) | 4 (12.9%) |
| 10:00 AM to 10:59 AM | 0 (0.0%) | 2 (6.5%) |
| 11:00 AM to 11:59 AM | 0 (0.0%) | 0 (0.0%) |
| 12:00 PM to 3:59 PM | 0 (0.0%) | 0 (0.0%) |
| 4:00 PM to 11:59 PM | 0 (0.0%) | 4 (12.9%) |
| Total | 12 (100.0%) | 31 (100.0%) |
Housing Occupancy in Love Valley
Occupancy by Ownership in Love Valley
Of the total 79 dwellings in Love Valley, owner-occupied units account for 49 (62.0%), while renter-occupied units make up 30 (38.0%).
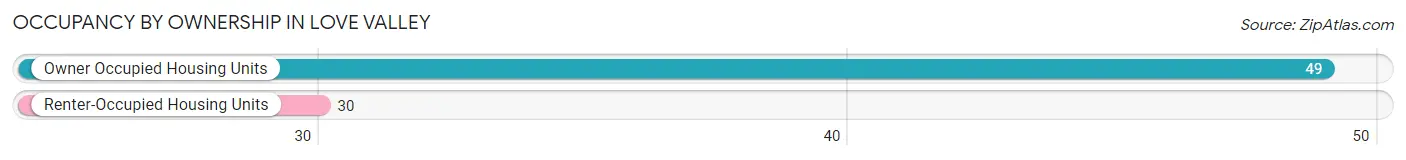
| Occupancy | # Housing Units | % Housing Units |
| Owner Occupied Housing Units | 49 | 62.0% |
| Renter-Occupied Housing Units | 30 | 38.0% |
| Total Occupied Housing Units | 79 | 100.0% |
Occupancy by Household Size in Love Valley
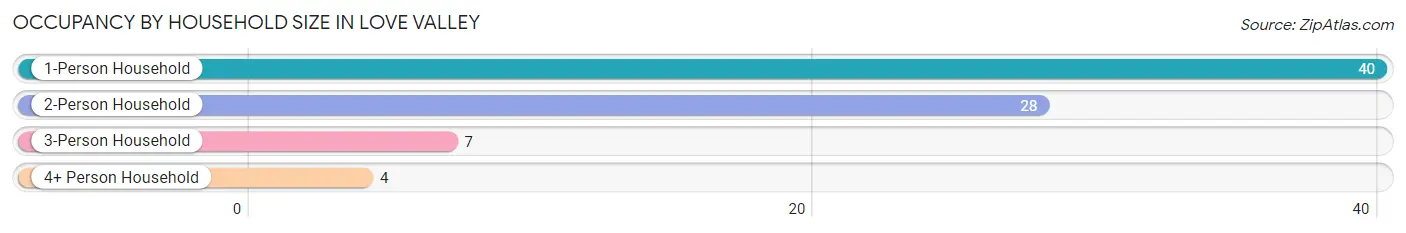
| Household Size | # Housing Units | % Housing Units |
| 1-Person Household | 40 | 50.6% |
| 2-Person Household | 28 | 35.4% |
| 3-Person Household | 7 | 8.9% |
| 4+ Person Household | 4 | 5.1% |
| Total Housing Units | 79 | 100.0% |
Occupancy by Ownership by Household Size in Love Valley
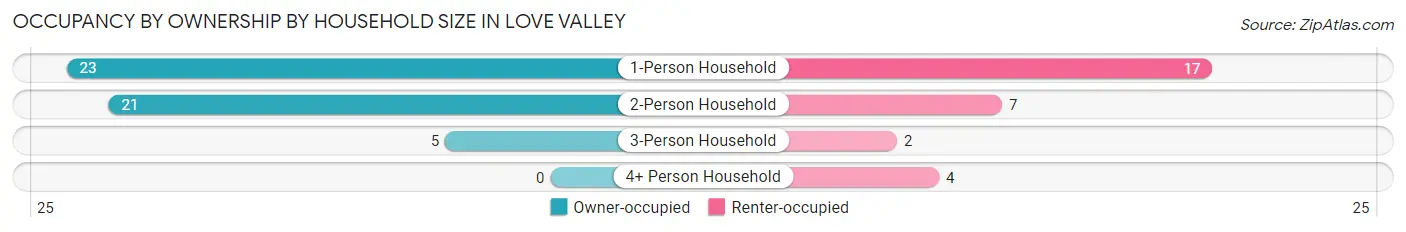
| Household Size | Owner-occupied | Renter-occupied |
| 1-Person Household | 23 (57.5%) | 17 (42.5%) |
| 2-Person Household | 21 (75.0%) | 7 (25.0%) |
| 3-Person Household | 5 (71.4%) | 2 (28.6%) |
| 4+ Person Household | 0 (0.0%) | 4 (100.0%) |
| Total Housing Units | 49 (62.0%) | 30 (38.0%) |
Occupancy by Educational Attainment in Love Valley
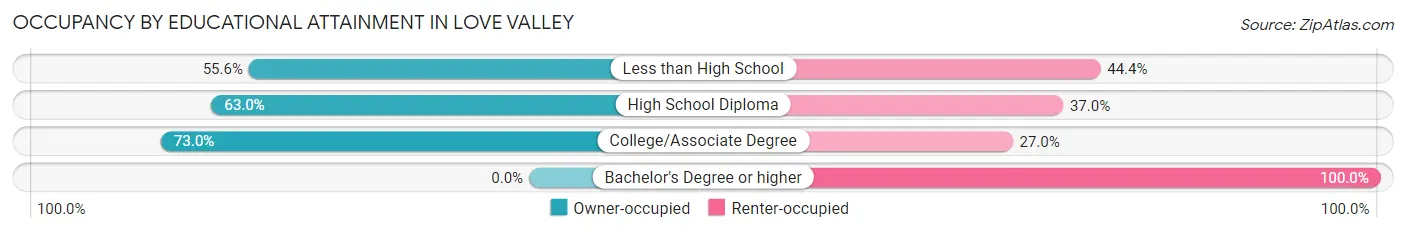
| Household Size | Owner-occupied | Renter-occupied |
| Less than High School | 5 (55.6%) | 4 (44.4%) |
| High School Diploma | 17 (63.0%) | 10 (37.0%) |
| College/Associate Degree | 27 (73.0%) | 10 (27.0%) |
| Bachelor's Degree or higher | 0 (0.0%) | 6 (100.0%) |
Occupancy by Age of Householder in Love Valley
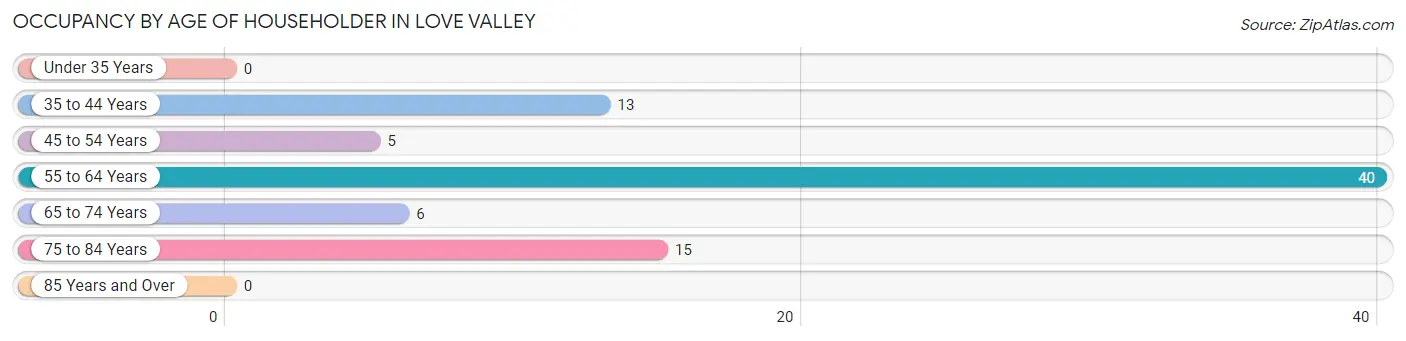
| Age Bracket | # Households | % Households |
| Under 35 Years | 0 | 0.0% |
| 35 to 44 Years | 13 | 16.5% |
| 45 to 54 Years | 5 | 6.3% |
| 55 to 64 Years | 40 | 50.6% |
| 65 to 74 Years | 6 | 7.6% |
| 75 to 84 Years | 15 | 19.0% |
| 85 Years and Over | 0 | 0.0% |
| Total | 79 | 100.0% |
Housing Finances in Love Valley
Median Income by Occupancy in Love Valley
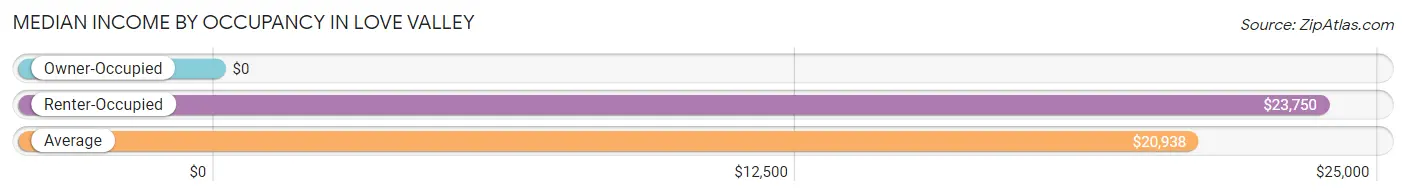
| Occupancy Type | # Households | Median Income |
| Owner-Occupied | 49 (62.0%) | $0 |
| Renter-Occupied | 30 (38.0%) | $23,750 |
| Average | 79 (100.0%) | $20,938 |
Occupancy by Householder Income Bracket in Love Valley
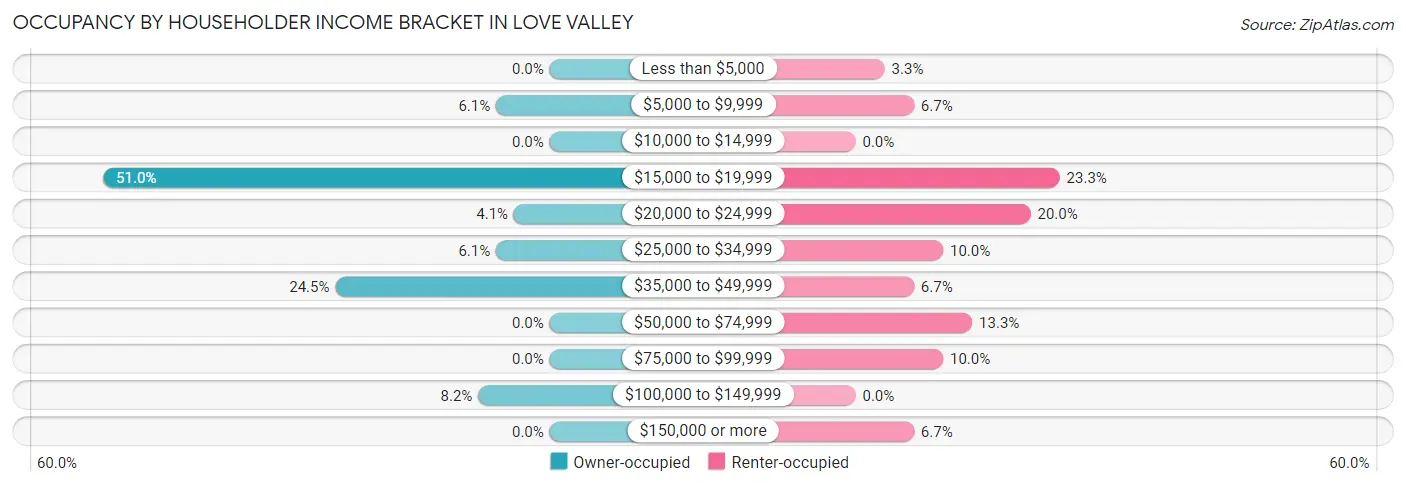
| Income Bracket | Owner-occupied | Renter-occupied |
| Less than $5,000 | 0 (0.0%) | 1 (3.3%) |
| $5,000 to $9,999 | 3 (6.1%) | 2 (6.7%) |
| $10,000 to $14,999 | 0 (0.0%) | 0 (0.0%) |
| $15,000 to $19,999 | 25 (51.0%) | 7 (23.3%) |
| $20,000 to $24,999 | 2 (4.1%) | 6 (20.0%) |
| $25,000 to $34,999 | 3 (6.1%) | 3 (10.0%) |
| $35,000 to $49,999 | 12 (24.5%) | 2 (6.7%) |
| $50,000 to $74,999 | 0 (0.0%) | 4 (13.3%) |
| $75,000 to $99,999 | 0 (0.0%) | 3 (10.0%) |
| $100,000 to $149,999 | 4 (8.2%) | 0 (0.0%) |
| $150,000 or more | 0 (0.0%) | 2 (6.7%) |
| Total | 49 (100.0%) | 30 (100.0%) |
Monthly Housing Cost Tiers in Love Valley
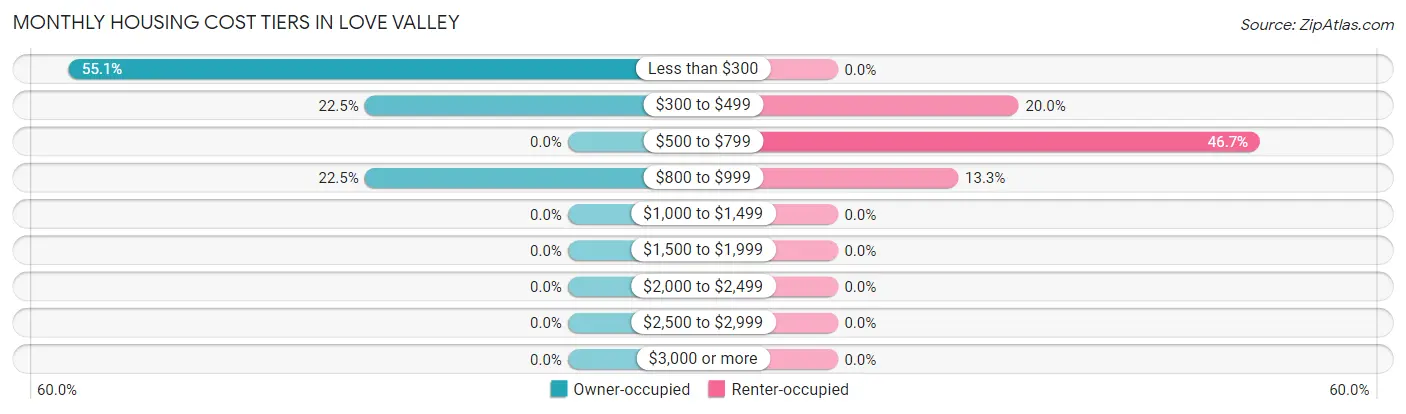
| Monthly Cost | Owner-occupied | Renter-occupied |
| Less than $300 | 27 (55.1%) | 0 (0.0%) |
| $300 to $499 | 11 (22.5%) | 6 (20.0%) |
| $500 to $799 | 0 (0.0%) | 14 (46.7%) |
| $800 to $999 | 11 (22.5%) | 4 (13.3%) |
| $1,000 to $1,499 | 0 (0.0%) | 0 (0.0%) |
| $1,500 to $1,999 | 0 (0.0%) | 0 (0.0%) |
| $2,000 to $2,499 | 0 (0.0%) | 0 (0.0%) |
| $2,500 to $2,999 | 0 (0.0%) | 0 (0.0%) |
| $3,000 or more | 0 (0.0%) | 0 (0.0%) |
| Total | 49 (100.0%) | 30 (100.0%) |
Physical Housing Characteristics in Love Valley
Housing Structures in Love Valley
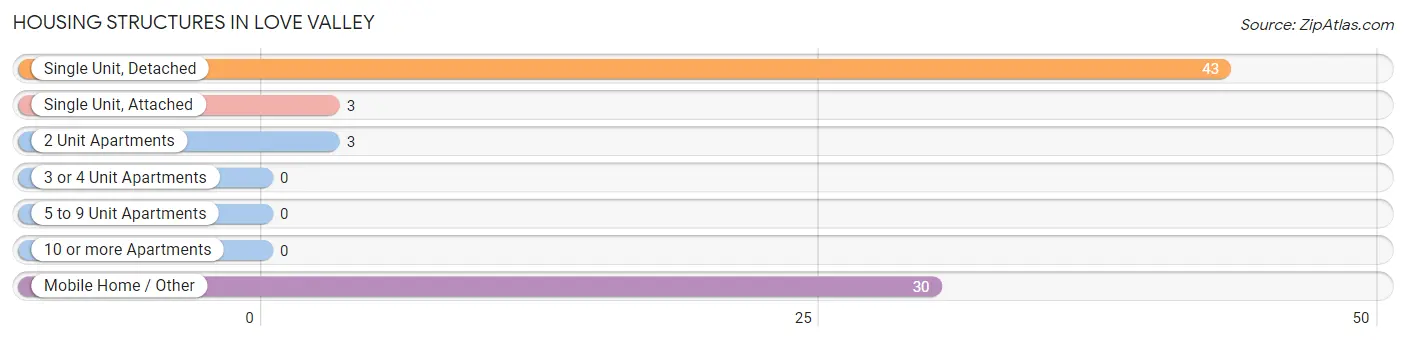
| Structure Type | # Housing Units | % Housing Units |
| Single Unit, Detached | 43 | 54.4% |
| Single Unit, Attached | 3 | 3.8% |
| 2 Unit Apartments | 3 | 3.8% |
| 3 or 4 Unit Apartments | 0 | 0.0% |
| 5 to 9 Unit Apartments | 0 | 0.0% |
| 10 or more Apartments | 0 | 0.0% |
| Mobile Home / Other | 30 | 38.0% |
| Total | 79 | 100.0% |
Housing Structures by Occupancy in Love Valley
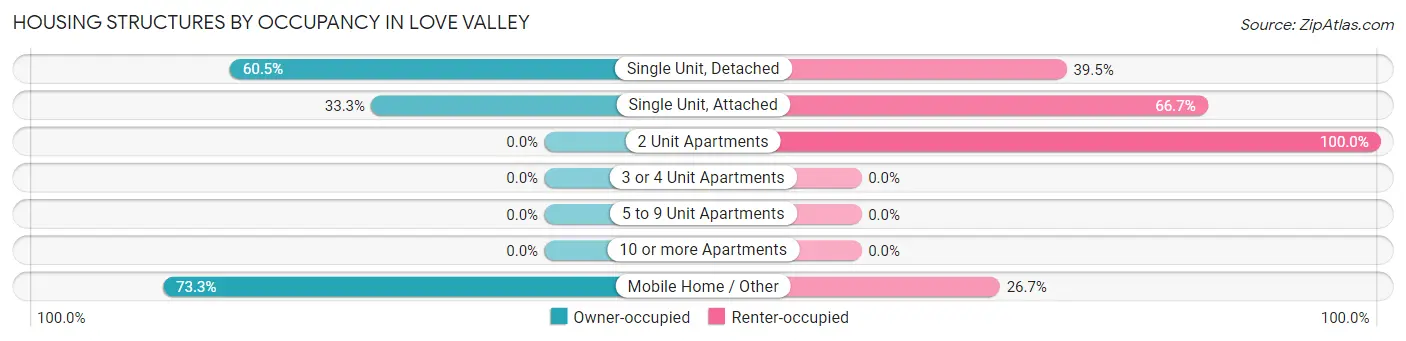
| Structure Type | Owner-occupied | Renter-occupied |
| Single Unit, Detached | 26 (60.5%) | 17 (39.5%) |
| Single Unit, Attached | 1 (33.3%) | 2 (66.7%) |
| 2 Unit Apartments | 0 (0.0%) | 3 (100.0%) |
| 3 or 4 Unit Apartments | 0 (0.0%) | 0 (0.0%) |
| 5 to 9 Unit Apartments | 0 (0.0%) | 0 (0.0%) |
| 10 or more Apartments | 0 (0.0%) | 0 (0.0%) |
| Mobile Home / Other | 22 (73.3%) | 8 (26.7%) |
| Total | 49 (62.0%) | 30 (38.0%) |
Housing Structures by Number of Rooms in Love Valley
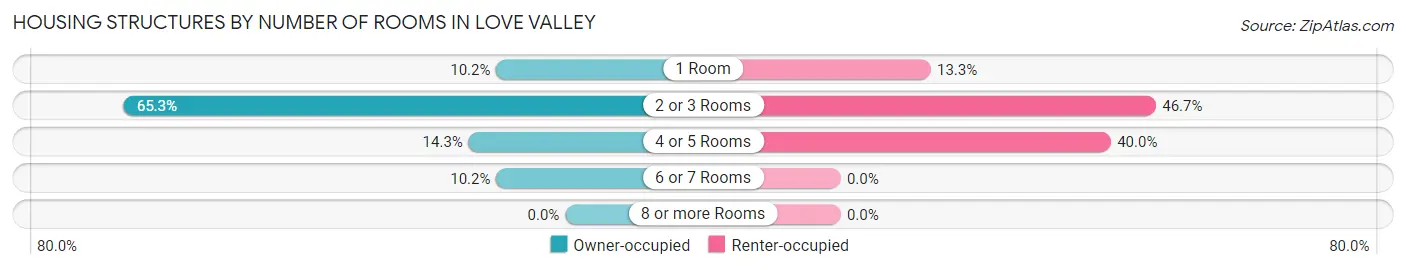
| Number of Rooms | Owner-occupied | Renter-occupied |
| 1 Room | 5 (10.2%) | 4 (13.3%) |
| 2 or 3 Rooms | 32 (65.3%) | 14 (46.7%) |
| 4 or 5 Rooms | 7 (14.3%) | 12 (40.0%) |
| 6 or 7 Rooms | 5 (10.2%) | 0 (0.0%) |
| 8 or more Rooms | 0 (0.0%) | 0 (0.0%) |
| Total | 49 (100.0%) | 30 (100.0%) |
Housing Structure by Heating Type in Love Valley
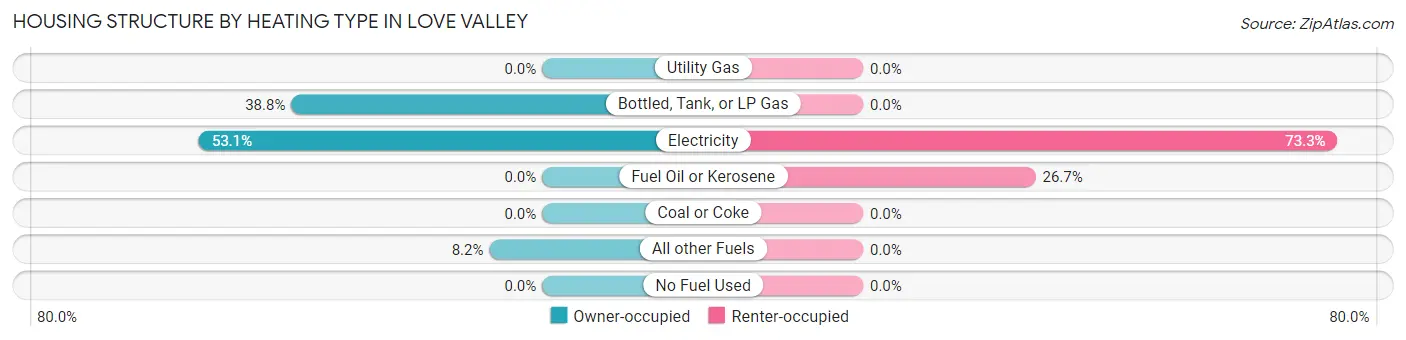
| Heating Type | Owner-occupied | Renter-occupied |
| Utility Gas | 0 (0.0%) | 0 (0.0%) |
| Bottled, Tank, or LP Gas | 19 (38.8%) | 0 (0.0%) |
| Electricity | 26 (53.1%) | 22 (73.3%) |
| Fuel Oil or Kerosene | 0 (0.0%) | 8 (26.7%) |
| Coal or Coke | 0 (0.0%) | 0 (0.0%) |
| All other Fuels | 4 (8.2%) | 0 (0.0%) |
| No Fuel Used | 0 (0.0%) | 0 (0.0%) |
| Total | 49 (100.0%) | 30 (100.0%) |
Household Vehicle Usage in Love Valley
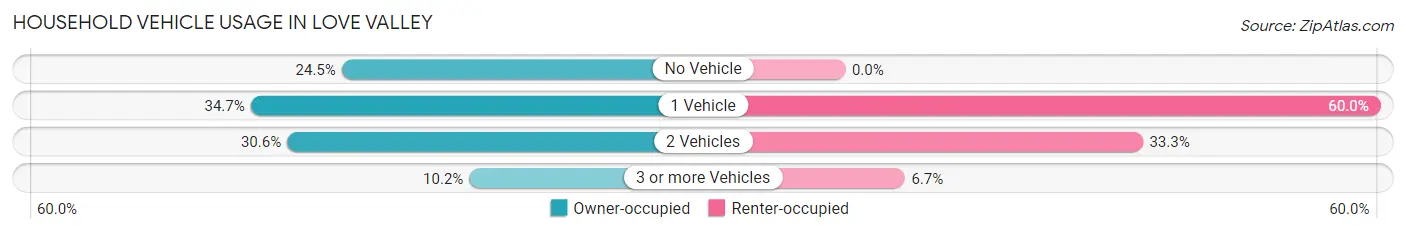
| Vehicles per Household | Owner-occupied | Renter-occupied |
| No Vehicle | 12 (24.5%) | 0 (0.0%) |
| 1 Vehicle | 17 (34.7%) | 18 (60.0%) |
| 2 Vehicles | 15 (30.6%) | 10 (33.3%) |
| 3 or more Vehicles | 5 (10.2%) | 2 (6.7%) |
| Total | 49 (100.0%) | 30 (100.0%) |
Real Estate & Mortgages in Love Valley
Real Estate and Mortgage Overview in Love Valley
| Characteristic | Without Mortgage | With Mortgage |
| Housing Units | 38 | 11 |
| Median Property Value | $65,000 | $0 |
| Median Household Income | $18,214 | $0 |
| Monthly Housing Costs | $238 | $0 |
| Real Estate Taxes | $329 | $3 |
Property Value by Mortgage Status in Love Valley
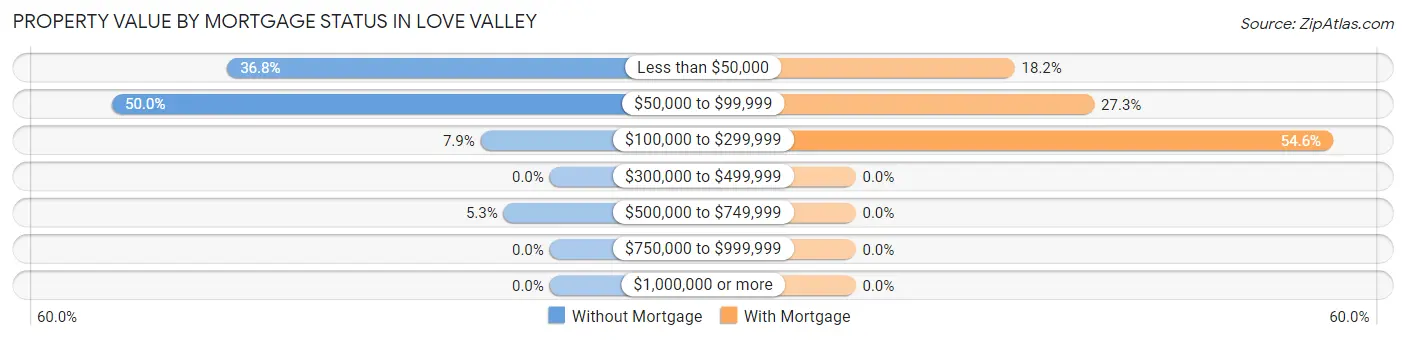
| Property Value | Without Mortgage | With Mortgage |
| Less than $50,000 | 14 (36.8%) | 2 (18.2%) |
| $50,000 to $99,999 | 19 (50.0%) | 3 (27.3%) |
| $100,000 to $299,999 | 3 (7.9%) | 6 (54.5%) |
| $300,000 to $499,999 | 0 (0.0%) | 0 (0.0%) |
| $500,000 to $749,999 | 2 (5.3%) | 0 (0.0%) |
| $750,000 to $999,999 | 0 (0.0%) | 0 (0.0%) |
| $1,000,000 or more | 0 (0.0%) | 0 (0.0%) |
| Total | 38 (100.0%) | 11 (100.0%) |
Household Income by Mortgage Status in Love Valley
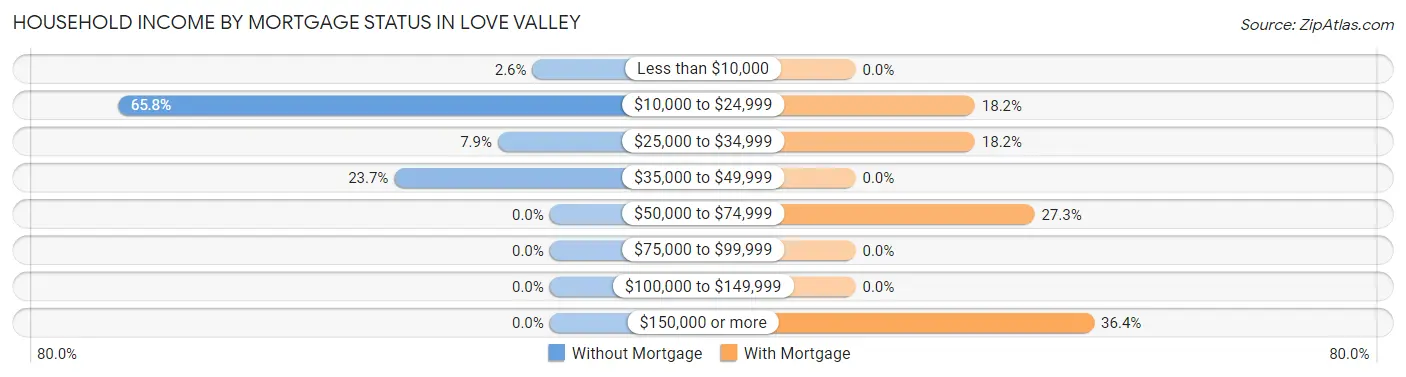
| Household Income | Without Mortgage | With Mortgage |
| Less than $10,000 | 1 (2.6%) | 0 (0.0%) |
| $10,000 to $24,999 | 25 (65.8%) | 2 (18.2%) |
| $25,000 to $34,999 | 3 (7.9%) | 2 (18.2%) |
| $35,000 to $49,999 | 9 (23.7%) | 0 (0.0%) |
| $50,000 to $74,999 | 0 (0.0%) | 3 (27.3%) |
| $75,000 to $99,999 | 0 (0.0%) | 0 (0.0%) |
| $100,000 to $149,999 | 0 (0.0%) | 0 (0.0%) |
| $150,000 or more | 0 (0.0%) | 4 (36.4%) |
| Total | 38 (100.0%) | 11 (100.0%) |
Property Value to Household Income Ratio in Love Valley
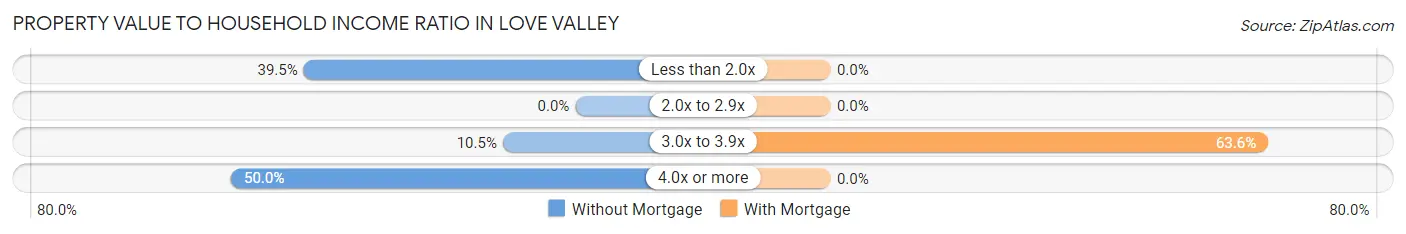
| Value-to-Income Ratio | Without Mortgage | With Mortgage |
| Less than 2.0x | 15 (39.5%) | 0 (0.0%) |
| 2.0x to 2.9x | 0 (0.0%) | 0 (0.0%) |
| 3.0x to 3.9x | 4 (10.5%) | 7 (63.6%) |
| 4.0x or more | 19 (50.0%) | 0 (0.0%) |
| Total | 38 (100.0%) | 11 (100.0%) |
Real Estate Taxes by Mortgage Status in Love Valley
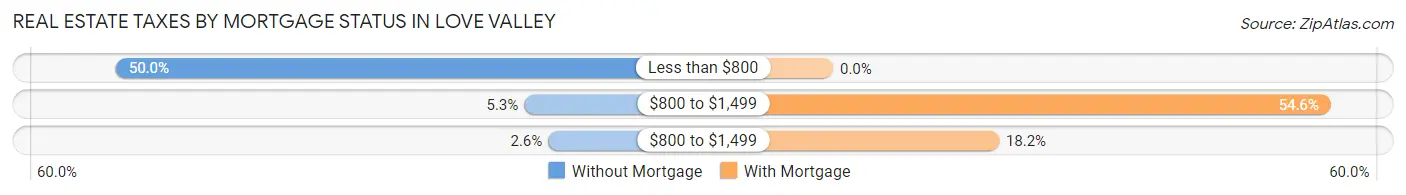
| Property Taxes | Without Mortgage | With Mortgage |
| Less than $800 | 19 (50.0%) | 0 (0.0%) |
| $800 to $1,499 | 2 (5.3%) | 6 (54.5%) |
| $800 to $1,499 | 1 (2.6%) | 2 (18.2%) |
| Total | 38 (100.0%) | 11 (100.0%) |
Health & Disability in Love Valley
Health Insurance Coverage by Age in Love Valley
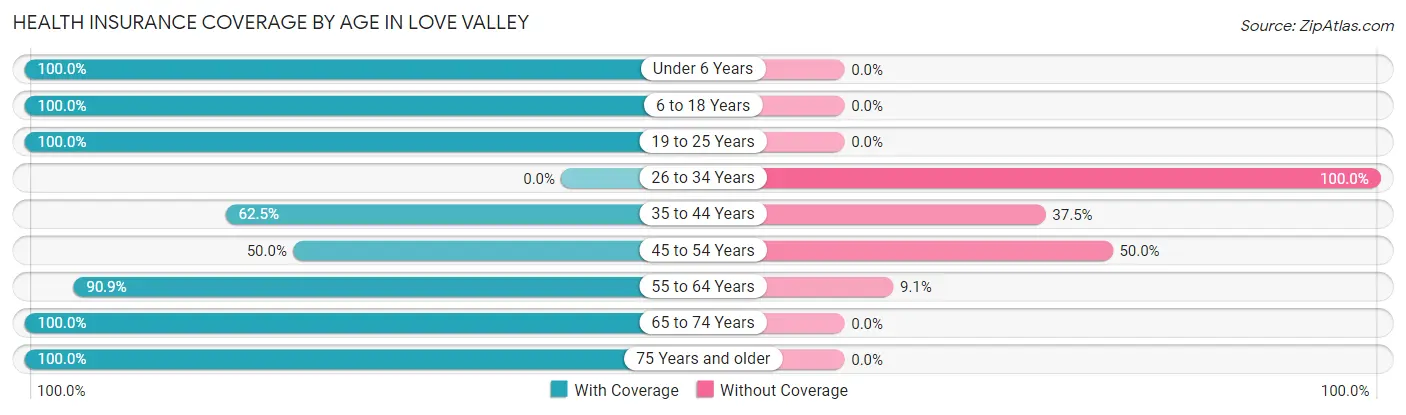
| Age Bracket | With Coverage | Without Coverage |
| Under 6 Years | 5 (100.0%) | 0 (0.0%) |
| 6 to 18 Years | 10 (100.0%) | 0 (0.0%) |
| 19 to 25 Years | 13 (100.0%) | 0 (0.0%) |
| 26 to 34 Years | 0 (0.0%) | 11 (100.0%) |
| 35 to 44 Years | 10 (62.5%) | 6 (37.5%) |
| 45 to 54 Years | 3 (50.0%) | 3 (50.0%) |
| 55 to 64 Years | 40 (90.9%) | 4 (9.1%) |
| 65 to 74 Years | 6 (100.0%) | 0 (0.0%) |
| 75 Years and older | 19 (100.0%) | 0 (0.0%) |
| Total | 106 (81.5%) | 24 (18.5%) |
Health Insurance Coverage by Citizenship Status in Love Valley
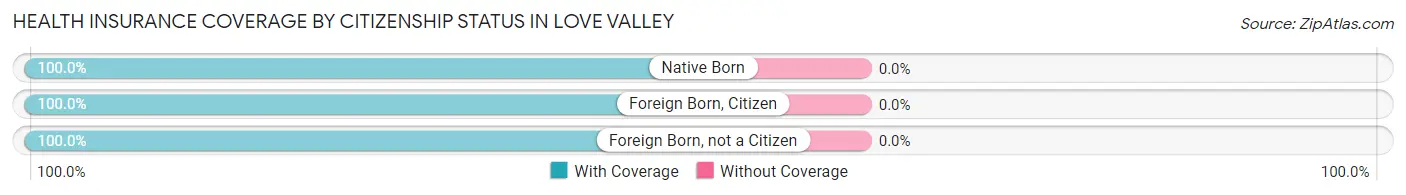
| Citizenship Status | With Coverage | Without Coverage |
| Native Born | 5 (100.0%) | 0 (0.0%) |
| Foreign Born, Citizen | 10 (100.0%) | 0 (0.0%) |
| Foreign Born, not a Citizen | 13 (100.0%) | 0 (0.0%) |
Health Insurance Coverage by Household Income in Love Valley
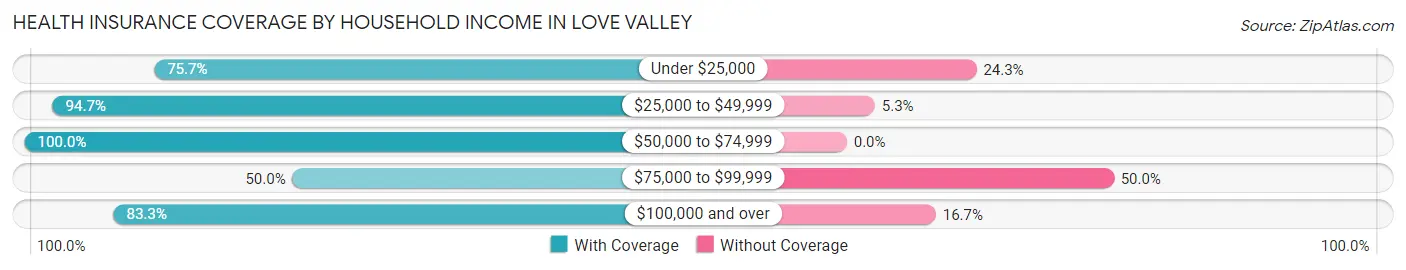
| Household Income | With Coverage | Without Coverage |
| Under $25,000 | 53 (75.7%) | 17 (24.3%) |
| $25,000 to $49,999 | 36 (94.7%) | 2 (5.3%) |
| $50,000 to $74,999 | 4 (100.0%) | 0 (0.0%) |
| $75,000 to $99,999 | 3 (50.0%) | 3 (50.0%) |
| $100,000 and over | 10 (83.3%) | 2 (16.7%) |
Public vs Private Health Insurance Coverage by Age in Love Valley
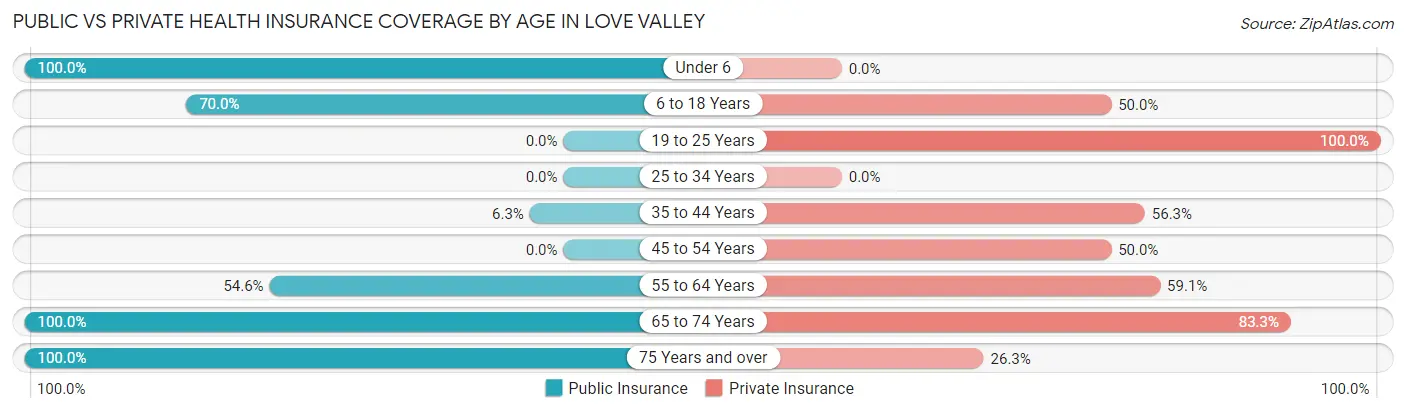
| Age Bracket | Public Insurance | Private Insurance |
| Under 6 | 5 (100.0%) | 0 (0.0%) |
| 6 to 18 Years | 7 (70.0%) | 5 (50.0%) |
| 19 to 25 Years | 0 (0.0%) | 13 (100.0%) |
| 25 to 34 Years | 0 (0.0%) | 0 (0.0%) |
| 35 to 44 Years | 1 (6.2%) | 9 (56.2%) |
| 45 to 54 Years | 0 (0.0%) | 3 (50.0%) |
| 55 to 64 Years | 24 (54.5%) | 26 (59.1%) |
| 65 to 74 Years | 6 (100.0%) | 5 (83.3%) |
| 75 Years and over | 19 (100.0%) | 5 (26.3%) |
| Total | 62 (47.7%) | 66 (50.8%) |
Disability Status by Sex by Age in Love Valley
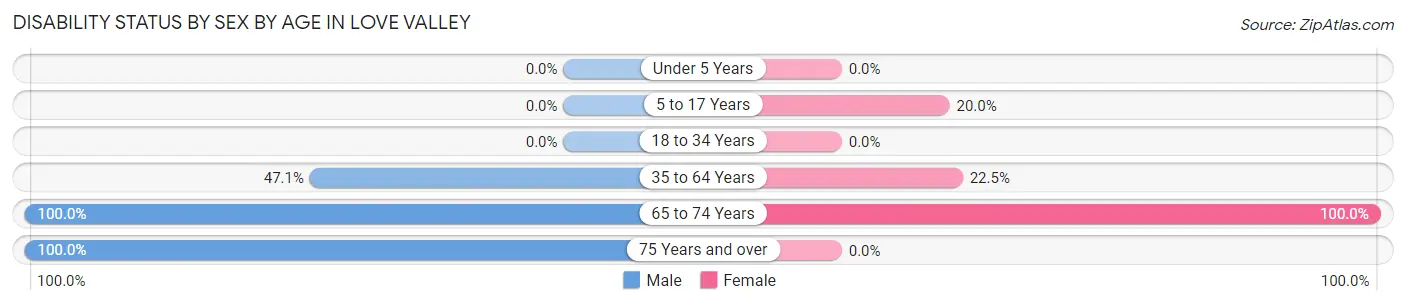
| Age Bracket | Male | Female |
| Under 5 Years | 0 (0.0%) | 0 (0.0%) |
| 5 to 17 Years | 0 (0.0%) | 1 (20.0%) |
| 18 to 34 Years | 0 (0.0%) | 0 (0.0%) |
| 35 to 64 Years | 8 (47.1%) | 11 (22.5%) |
| 65 to 74 Years | 5 (100.0%) | 1 (100.0%) |
| 75 Years and over | 10 (100.0%) | 0 (0.0%) |
Disability Class by Sex by Age in Love Valley
Disability Class: Hearing Difficulty
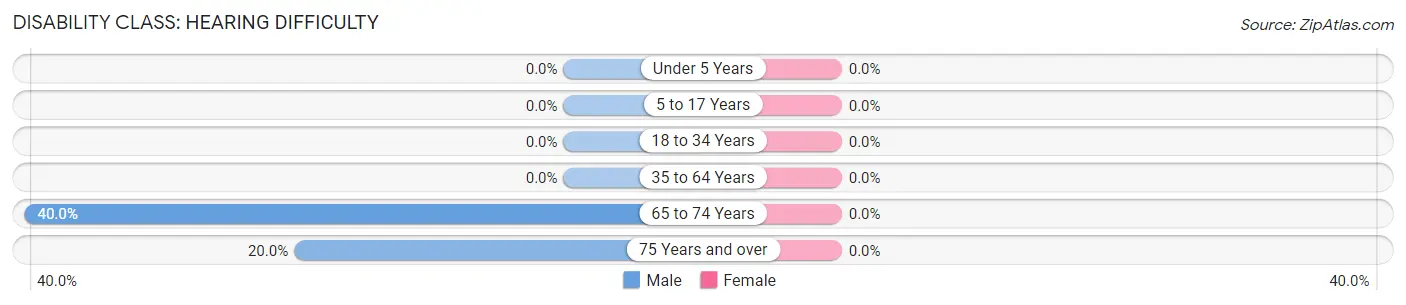
| Age Bracket | Male | Female |
| Under 5 Years | 0 (0.0%) | 0 (0.0%) |
| 5 to 17 Years | 0 (0.0%) | 0 (0.0%) |
| 18 to 34 Years | 0 (0.0%) | 0 (0.0%) |
| 35 to 64 Years | 0 (0.0%) | 0 (0.0%) |
| 65 to 74 Years | 2 (40.0%) | 0 (0.0%) |
| 75 Years and over | 2 (20.0%) | 0 (0.0%) |
Disability Class: Vision Difficulty
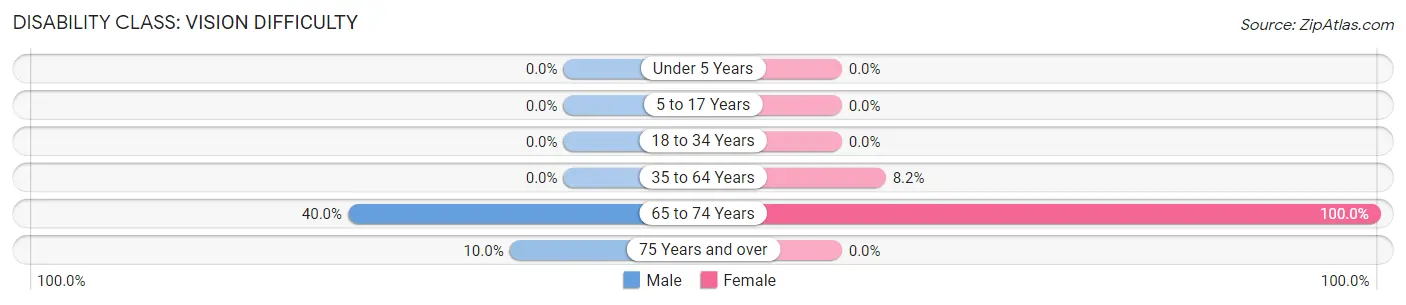
| Age Bracket | Male | Female |
| Under 5 Years | 0 (0.0%) | 0 (0.0%) |
| 5 to 17 Years | 0 (0.0%) | 0 (0.0%) |
| 18 to 34 Years | 0 (0.0%) | 0 (0.0%) |
| 35 to 64 Years | 0 (0.0%) | 4 (8.2%) |
| 65 to 74 Years | 2 (40.0%) | 1 (100.0%) |
| 75 Years and over | 1 (10.0%) | 0 (0.0%) |
Disability Class: Cognitive Difficulty
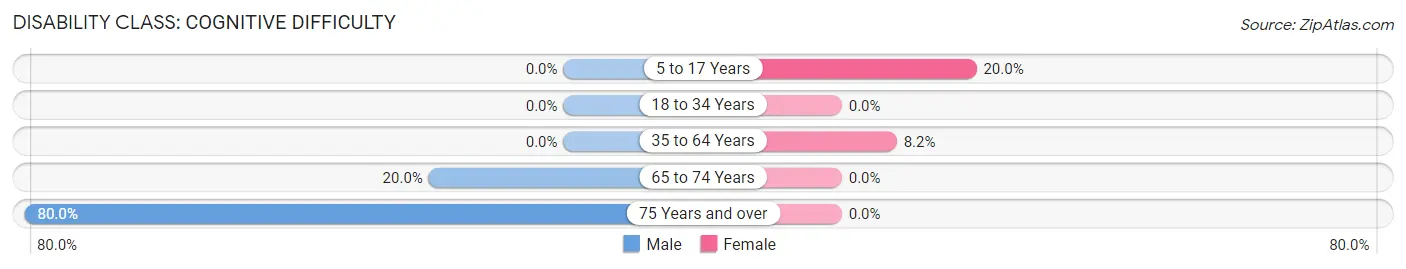
| Age Bracket | Male | Female |
| 5 to 17 Years | 0 (0.0%) | 1 (20.0%) |
| 18 to 34 Years | 0 (0.0%) | 0 (0.0%) |
| 35 to 64 Years | 0 (0.0%) | 4 (8.2%) |
| 65 to 74 Years | 1 (20.0%) | 0 (0.0%) |
| 75 Years and over | 8 (80.0%) | 0 (0.0%) |
Disability Class: Ambulatory Difficulty
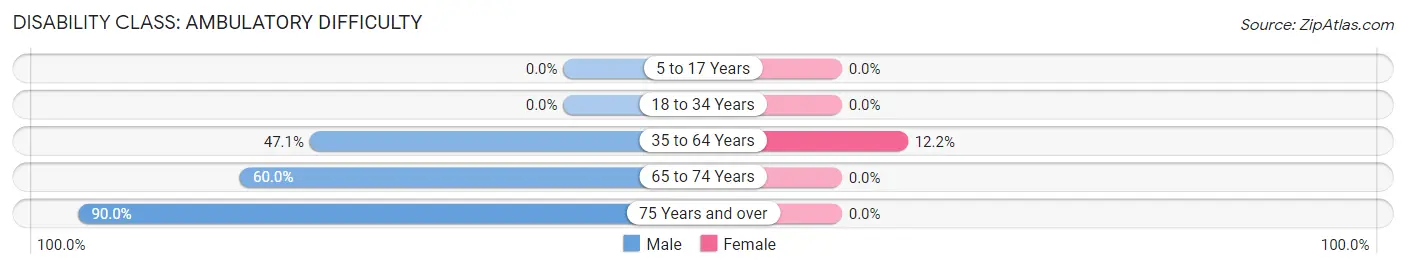
| Age Bracket | Male | Female |
| 5 to 17 Years | 0 (0.0%) | 0 (0.0%) |
| 18 to 34 Years | 0 (0.0%) | 0 (0.0%) |
| 35 to 64 Years | 8 (47.1%) | 6 (12.2%) |
| 65 to 74 Years | 3 (60.0%) | 0 (0.0%) |
| 75 Years and over | 9 (90.0%) | 0 (0.0%) |
Disability Class: Self-Care Difficulty
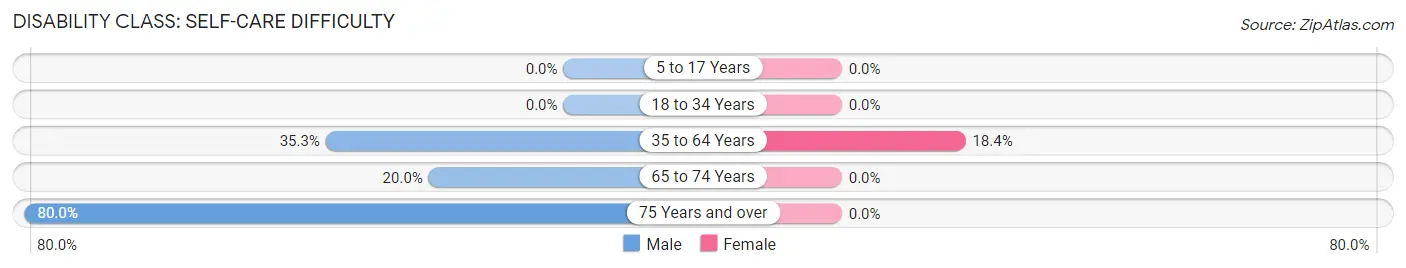
| Age Bracket | Male | Female |
| 5 to 17 Years | 0 (0.0%) | 0 (0.0%) |
| 18 to 34 Years | 0 (0.0%) | 0 (0.0%) |
| 35 to 64 Years | 6 (35.3%) | 9 (18.4%) |
| 65 to 74 Years | 1 (20.0%) | 0 (0.0%) |
| 75 Years and over | 8 (80.0%) | 0 (0.0%) |
Technology Access in Love Valley
Computing Device Access in Love Valley
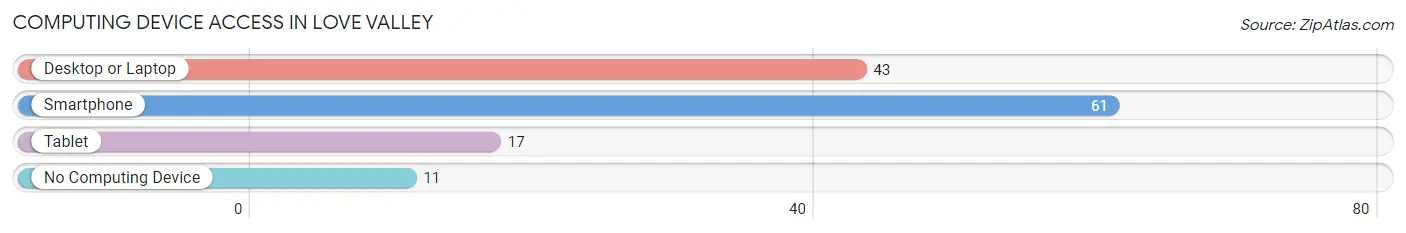
| Device Type | # Households | % Households |
| Desktop or Laptop | 43 | 54.4% |
| Smartphone | 61 | 77.2% |
| Tablet | 17 | 21.5% |
| No Computing Device | 11 | 13.9% |
| Total | 79 | 100.0% |
Internet Access in Love Valley
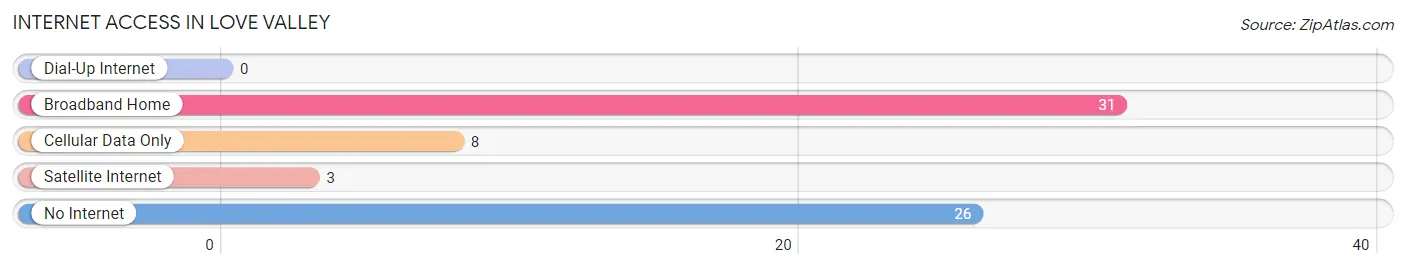
| Internet Type | # Households | % Households |
| Dial-Up Internet | 0 | 0.0% |
| Broadband Home | 31 | 39.2% |
| Cellular Data Only | 8 | 10.1% |
| Satellite Internet | 3 | 3.8% |
| No Internet | 26 | 32.9% |
| Total | 79 | 100.0% |
Love Valley Summary
History
Love Valley, North Carolina is a small town located in Iredell County, North Carolina. It was founded in the late 1800s by a group of settlers who were looking for a place to settle and start a new life. The town was named after the nearby Love Valley Creek, which was named after a local Native American chief. The town was originally a farming community, but it soon became a popular destination for tourists and outdoor enthusiasts.
The town was officially incorporated in 1909 and has since become a popular destination for horseback riding, camping, and other outdoor activities. The town is also home to the Love Valley Speedway, which hosts a variety of racing events throughout the year.
Geography
Love Valley is located in the foothills of the Blue Ridge Mountains in Iredell County, North Carolina. The town is situated at an elevation of 1,000 feet above sea level and is surrounded by rolling hills and lush forests. The town is located approximately 30 miles north of Charlotte and is accessible via Interstate 77.
The town is located in a temperate climate zone and experiences mild winters and hot summers. The average annual temperature is around 60 degrees Fahrenheit and the average annual precipitation is around 45 inches.
Economy
Love Valley’s economy is largely based on tourism and outdoor recreation. The town is home to the Love Valley Speedway, which hosts a variety of racing events throughout the year. The town is also home to several campgrounds, horseback riding trails, and other outdoor activities.
The town is also home to several small businesses, including restaurants, shops, and other services. The town is also home to a few manufacturing companies, including a furniture factory and a textile mill.
Demographics
As of the 2010 census, the population of Love Valley was 545. The racial makeup of the town was 97.3% White, 0.7% African American, 0.2% Native American, 0.2% Asian, 0.2% from other races, and 1.6% from two or more races. Hispanic or Latino of any race were 0.7% of the population.
The median income for a household in the town was $37,500 and the median income for a family was $41,250. The per capita income for the town was $17,845. About 11.2% of families and 13.2% of the population were below the poverty line, including 16.7% of those under age 18 and 8.3% of those age 65 or over.
Common Questions
What is Per Capita Income in Love Valley?
Per Capita income in Love Valley is $20,092.
What is the Median Household income in Love Valley?
Median Household Income in Love Valley is $20,938.
What is Inequality or Gini Index in Love Valley?
Inequality or Gini Index in Love Valley is 0.42.
What is the Total Population of Love Valley?
Total Population of Love Valley is 130.
What is the Total Male Population of Love Valley?
Total Male Population of Love Valley is 53.
What is the Total Female Population of Love Valley?
Total Female Population of Love Valley is 77.
What is the Ratio of Males per 100 Females in Love Valley?
There are 68.83 Males per 100 Females in Love Valley.
What is the Ratio of Females per 100 Males in Love Valley?
There are 145.28 Females per 100 Males in Love Valley.
What is the Median Population Age in Love Valley?
Median Population Age in Love Valley is 55.4 Years.
What is the Average Family Size in Love Valley
Average Family Size in Love Valley is 2.3 People.
What is the Average Household Size in Love Valley
Average Household Size in Love Valley is 1.6 People.
How Large is the Labor Force in Love Valley?
There are 56 People in the Labor Forcein in Love Valley.
What is the Percentage of People in the Labor Force in Love Valley?
47.1% of People are in the Labor Force in Love Valley.
What is the Unemployment Rate in Love Valley?
Unemployment Rate in Love Valley is 23.2%.