Buies Creek, NC Map & Demographics
Buies Creek Map
Buies Creek Overview
$18,595
PER CAPITA INCOME
$93,636
AVG FAMILY INCOME
$42,208
AVG HOUSEHOLD INCOME
34.7%
WAGE / INCOME GAP [ % ]
65.3¢/ $1
WAGE / INCOME GAP [ $ ]
0.57
INEQUALITY / GINI INDEX
3,589
TOTAL POPULATION
1,842
MALE POPULATION
1,747
FEMALE POPULATION
105.44
MALES / 100 FEMALES
94.84
FEMALES / 100 MALES
21.4
MEDIAN AGE
2.6
AVG FAMILY SIZE
2.2
AVG HOUSEHOLD SIZE
1,569
LABOR FORCE [ PEOPLE ]
46.0%
PERCENT IN LABOR FORCE
1.4%
UNEMPLOYMENT RATE
Buies Creek Zip Codes
Income in Buies Creek
Income Overview in Buies Creek
Per Capita Income in Buies Creek is $18,595, while median incomes of families and households are $93,636 and $42,208 respectively.
| Characteristic | Number | Measure |
| Per Capita Income | 3,589 | $18,595 |
| Median Family Income | 404 | $93,636 |
| Mean Family Income | 404 | $102,305 |
| Median Household Income | 987 | $42,208 |
| Mean Household Income | 987 | $59,714 |
| Income Deficit | 404 | $0 |
| Wage / Income Gap (%) | 3,589 | 34.71% |
| Wage / Income Gap ($) | 3,589 | 65.29¢ per $1 |
| Gini / Inequality Index | 3,589 | 0.57 |
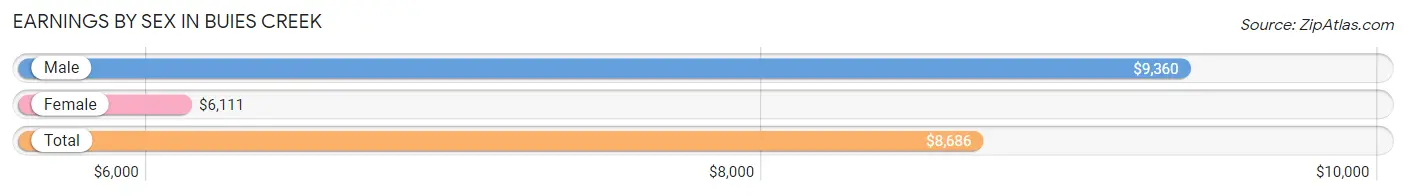
Earnings by Sex in Buies Creek
Average Earnings in Buies Creek are $8,686, $9,360 for men and $6,111 for women, a difference of 34.7%.
| Sex | Number | Average Earnings |
| Male | 1,284 (56.4%) | $9,360 |
| Female | 992 (43.6%) | $6,111 |
| Total | 2,276 (100.0%) | $8,686 |
Earnings by Sex by Income Bracket in Buies Creek
The most common earnings brackets in Buies Creek are $2,499 or less for men (276 | 21.5%) and $2,499 or less for women (359 | 36.2%).

| Income | Male | Female |
| $2,499 or less | 276 (21.5%) | 359 (36.2%) |
| $2,500 to $4,999 | 78 (6.1%) | 105 (10.6%) |
| $5,000 to $7,499 | 99 (7.7%) | 72 (7.3%) |
| $7,500 to $9,999 | 254 (19.8%) | 60 (6.0%) |
| $10,000 to $12,499 | 64 (5.0%) | 13 (1.3%) |
| $12,500 to $14,999 | 20 (1.6%) | 31 (3.1%) |
| $15,000 to $17,499 | 17 (1.3%) | 51 (5.1%) |
| $17,500 to $19,999 | 7 (0.5%) | 0 (0.0%) |
| $20,000 to $22,499 | 22 (1.7%) | 17 (1.7%) |
| $22,500 to $24,999 | 10 (0.8%) | 33 (3.3%) |
| $25,000 to $29,999 | 74 (5.8%) | 55 (5.5%) |
| $30,000 to $34,999 | 0 (0.0%) | 19 (1.9%) |
| $35,000 to $39,999 | 27 (2.1%) | 12 (1.2%) |
| $40,000 to $44,999 | 42 (3.3%) | 59 (5.9%) |
| $45,000 to $49,999 | 57 (4.4%) | 20 (2.0%) |
| $50,000 to $54,999 | 68 (5.3%) | 0 (0.0%) |
| $55,000 to $64,999 | 18 (1.4%) | 36 (3.6%) |
| $65,000 to $74,999 | 31 (2.4%) | 21 (2.1%) |
| $75,000 to $99,999 | 52 (4.1%) | 10 (1.0%) |
| $100,000+ | 68 (5.3%) | 19 (1.9%) |
| Total | 1,284 (100.0%) | 992 (100.0%) |
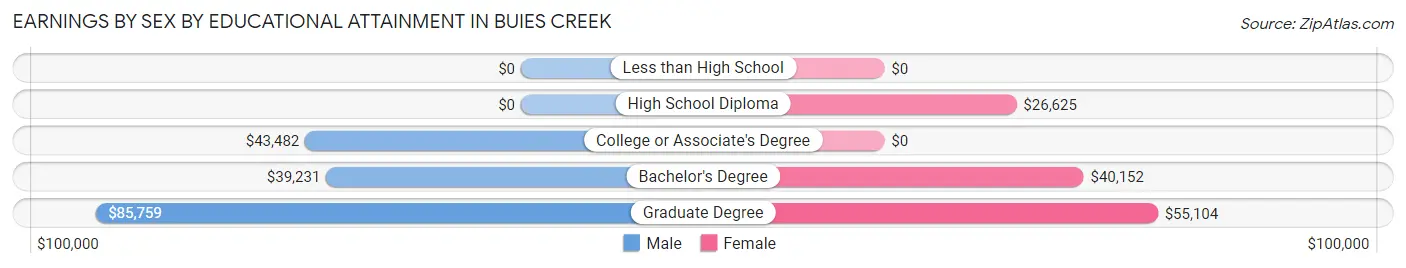
Earnings by Sex by Educational Attainment in Buies Creek
Average earnings in Buies Creek are $52,647 for men and $36,563 for women, a difference of 30.5%. Men with an educational attainment of graduate degree enjoy the highest average annual earnings of $85,759, while those with bachelor's degree education earn the least with $39,231. Women with an educational attainment of graduate degree earn the most with the average annual earnings of $55,104, while those with high school diploma education have the smallest earnings of $26,625.
| Educational Attainment | Male Income | Female Income |
| Less than High School | - | - |
| High School Diploma | - | - |
| College or Associate's Degree | $43,482 | $0 |
| Bachelor's Degree | $39,231 | $40,152 |
| Graduate Degree | $85,759 | $55,104 |
| Total | $52,647 | $36,563 |
Family Income in Buies Creek
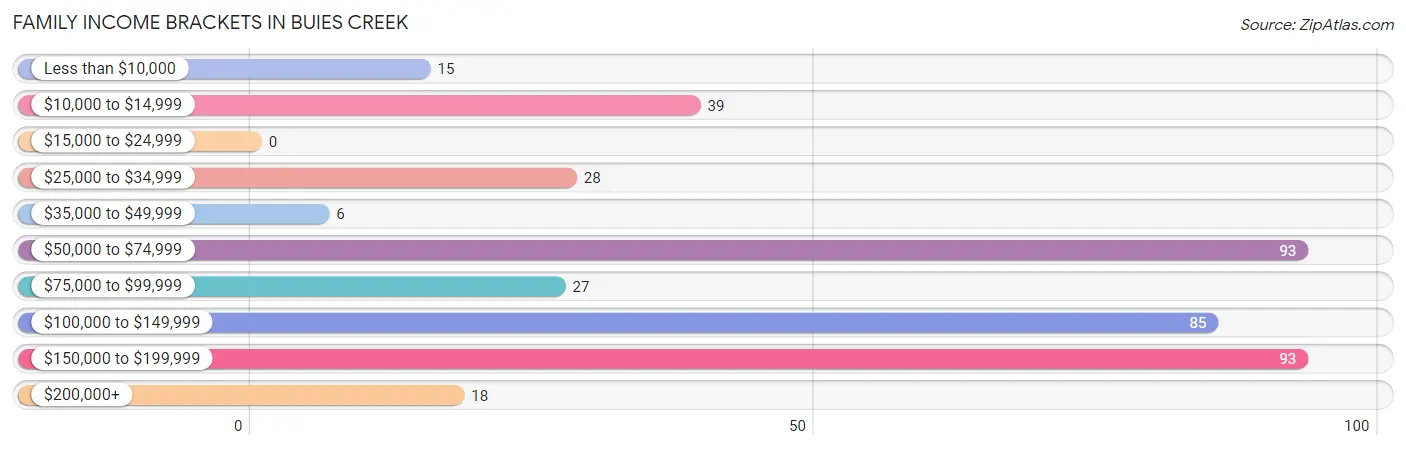
Family Income Brackets in Buies Creek
According to the Buies Creek family income data, there are 93 families falling into the $50,000 to $74,999 income range, which is the most common income bracket and makes up 23.0% of all families.
| Income Bracket | # Families | % Families |
| Less than $10,000 | 15 | 3.7% |
| $10,000 to $14,999 | 39 | 9.7% |
| $15,000 to $24,999 | 0 | 0.0% |
| $25,000 to $34,999 | 28 | 6.9% |
| $35,000 to $49,999 | 6 | 1.5% |
| $50,000 to $74,999 | 93 | 23.0% |
| $75,000 to $99,999 | 27 | 6.7% |
| $100,000 to $149,999 | 85 | 21.0% |
| $150,000 to $199,999 | 93 | 23.0% |
| $200,000+ | 18 | 4.5% |
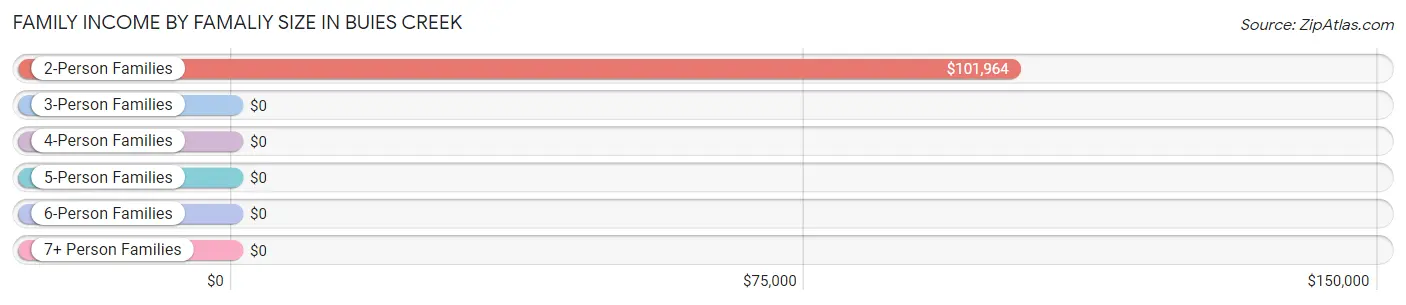
Family Income by Famaliy Size in Buies Creek
2-person families (252 | 62.4%) account for the highest median family income in Buies Creek with $101,964 per family, while 2-person families (252 | 62.4%) have the highest median income of $50,982 per family member.
| Income Bracket | # Families | Median Income |
| 2-Person Families | 252 (62.4%) | $101,964 |
| 3-Person Families | 60 (14.8%) | $0 |
| 4-Person Families | 92 (22.8%) | $0 |
| 5-Person Families | 0 (0.0%) | $0 |
| 6-Person Families | 0 (0.0%) | $0 |
| 7+ Person Families | 0 (0.0%) | $0 |
| Total | 404 (100.0%) | $93,636 |
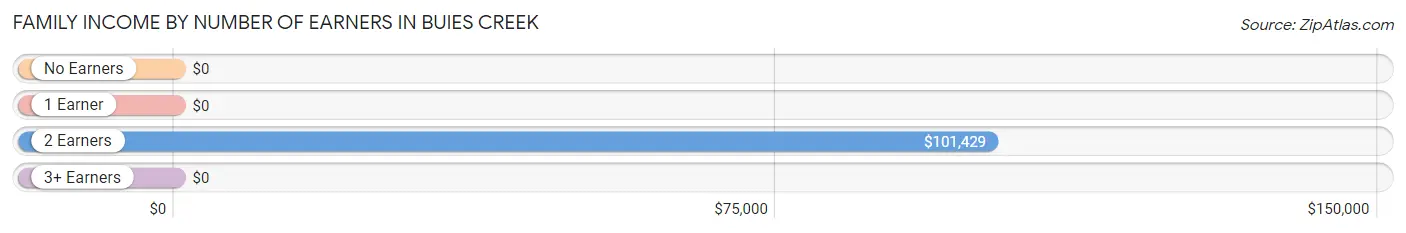
Family Income by Number of Earners in Buies Creek
| Number of Earners | # Families | Median Income |
| No Earners | 84 (20.8%) | $0 |
| 1 Earner | 116 (28.7%) | $0 |
| 2 Earners | 204 (50.5%) | $101,429 |
| 3+ Earners | 0 (0.0%) | $0 |
| Total | 404 (100.0%) | $93,636 |
Household Income in Buies Creek
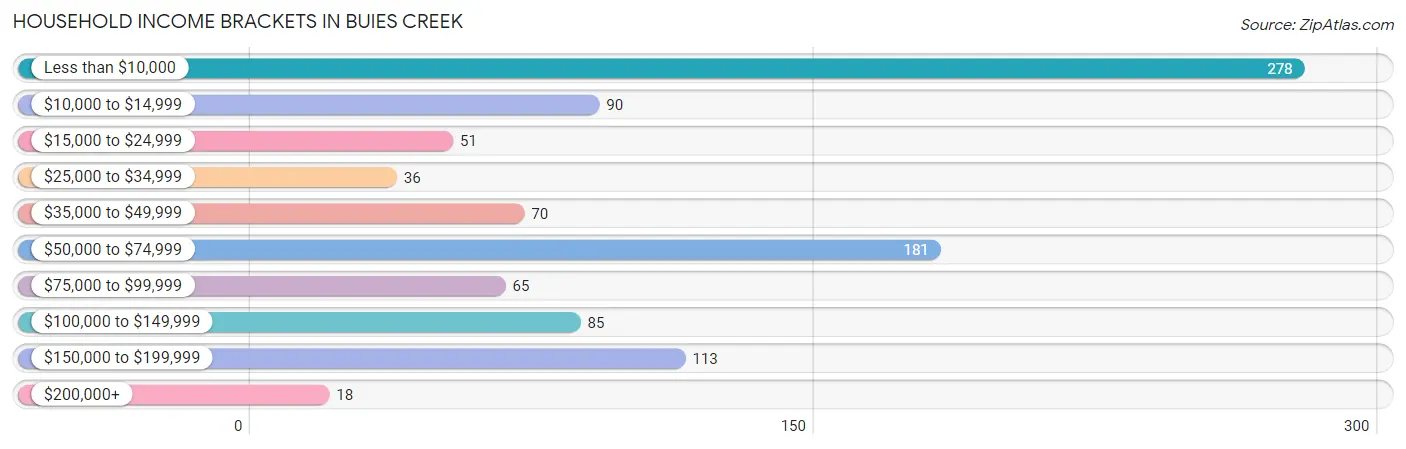
Household Income Brackets in Buies Creek
With 278 households falling in the category, the less than $10,000 income range is the most frequent in Buies Creek, accounting for 28.2% of all households. In contrast, only 18 households (1.8%) fall into the $200,000+ income bracket, making it the least populous group.
| Income Bracket | # Households | % Households |
| Less than $10,000 | 278 | 28.2% |
| $10,000 to $14,999 | 90 | 9.1% |
| $15,000 to $24,999 | 51 | 5.2% |
| $25,000 to $34,999 | 36 | 3.6% |
| $35,000 to $49,999 | 70 | 7.1% |
| $50,000 to $74,999 | 181 | 18.3% |
| $75,000 to $99,999 | 65 | 6.6% |
| $100,000 to $149,999 | 85 | 8.6% |
| $150,000 to $199,999 | 113 | 11.4% |
| $200,000+ | 18 | 1.8% |
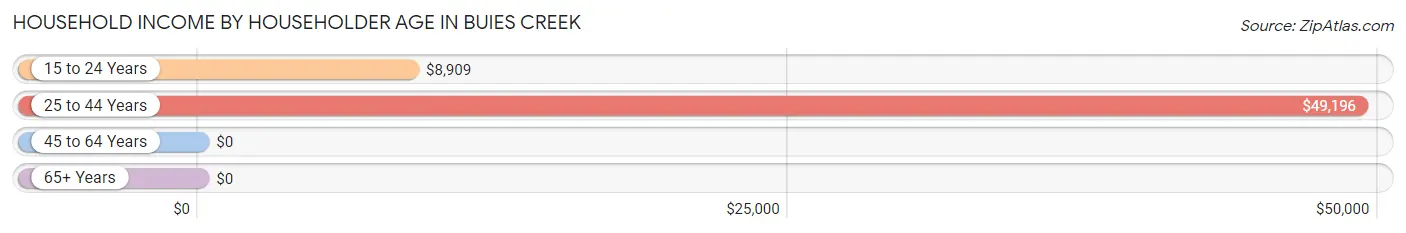
Household Income by Householder Age in Buies Creek
The median household income in Buies Creek is $42,208, with the highest median household income of $49,196 found in the 25 to 44 years age bracket for the primary householder. A total of 416 households (42.1%) fall into this category. Meanwhile, the 45 to 64 years age bracket for the primary householder has the lowest median household income of $0, with 158 households (16.0%) in this group.
| Income Bracket | # Households | Median Income |
| 15 to 24 Years | 280 (28.4%) | $8,909 |
| 25 to 44 Years | 416 (42.1%) | $49,196 |
| 45 to 64 Years | 158 (16.0%) | $0 |
| 65+ Years | 133 (13.5%) | $0 |
| Total | 987 (100.0%) | $42,208 |
Poverty in Buies Creek
Income Below Poverty by Sex and Age in Buies Creek
With 38.1% poverty level for males and 49.2% for females among the residents of Buies Creek, 15 year old males and 18 to 24 year old females are the most vulnerable to poverty, with 38 males (100.0%) and 425 females (90.2%) in their respective age groups living below the poverty level.
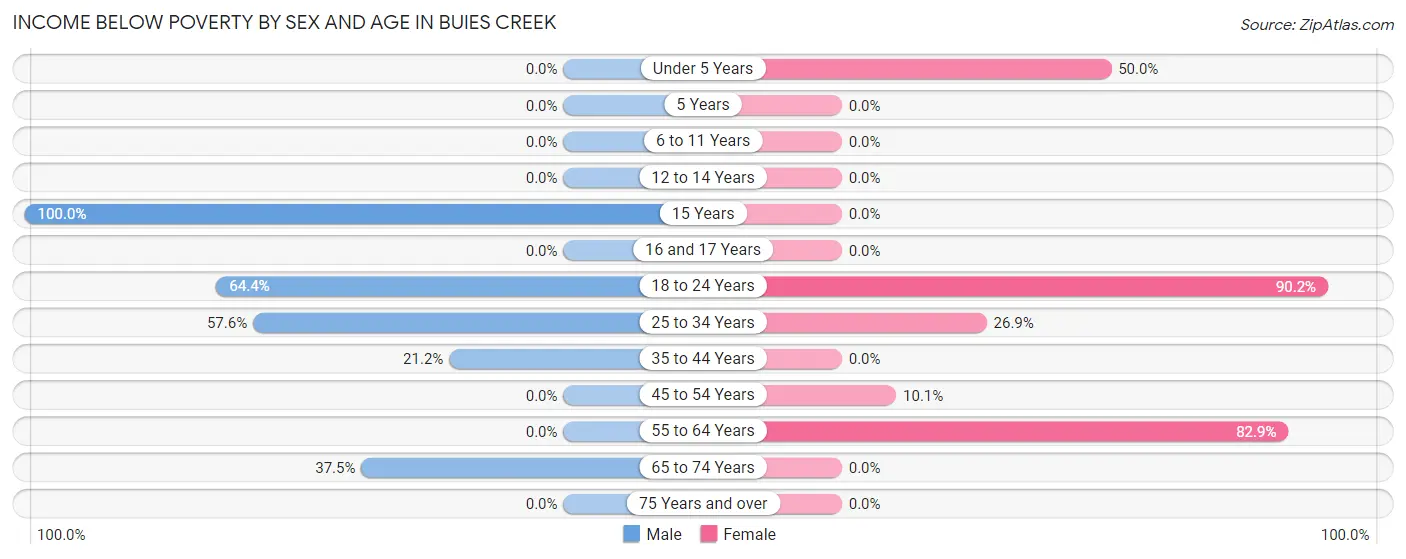
| Age Bracket | Male | Female |
| Under 5 Years | 0 (0.0%) | 10 (50.0%) |
| 5 Years | 0 (0.0%) | 0 (0.0%) |
| 6 to 11 Years | 0 (0.0%) | 0 (0.0%) |
| 12 to 14 Years | 0 (0.0%) | 0 (0.0%) |
| 15 Years | 38 (100.0%) | 0 (0.0%) |
| 16 and 17 Years | 0 (0.0%) | 0 (0.0%) |
| 18 to 24 Years | 179 (64.4%) | 425 (90.2%) |
| 25 to 34 Years | 106 (57.6%) | 75 (26.9%) |
| 35 to 44 Years | 39 (21.2%) | 0 (0.0%) |
| 45 to 54 Years | 0 (0.0%) | 12 (10.1%) |
| 55 to 64 Years | 0 (0.0%) | 58 (82.9%) |
| 65 to 74 Years | 27 (37.5%) | 0 (0.0%) |
| 75 Years and over | 0 (0.0%) | 0 (0.0%) |
| Total | 389 (38.1%) | 580 (49.2%) |
Income Above Poverty by Sex and Age in Buies Creek
According to the poverty statistics in Buies Creek, males aged under 5 years and females aged 5 years are the age groups that are most secure financially, with 100.0% of males and 100.0% of females in these age groups living above the poverty line.
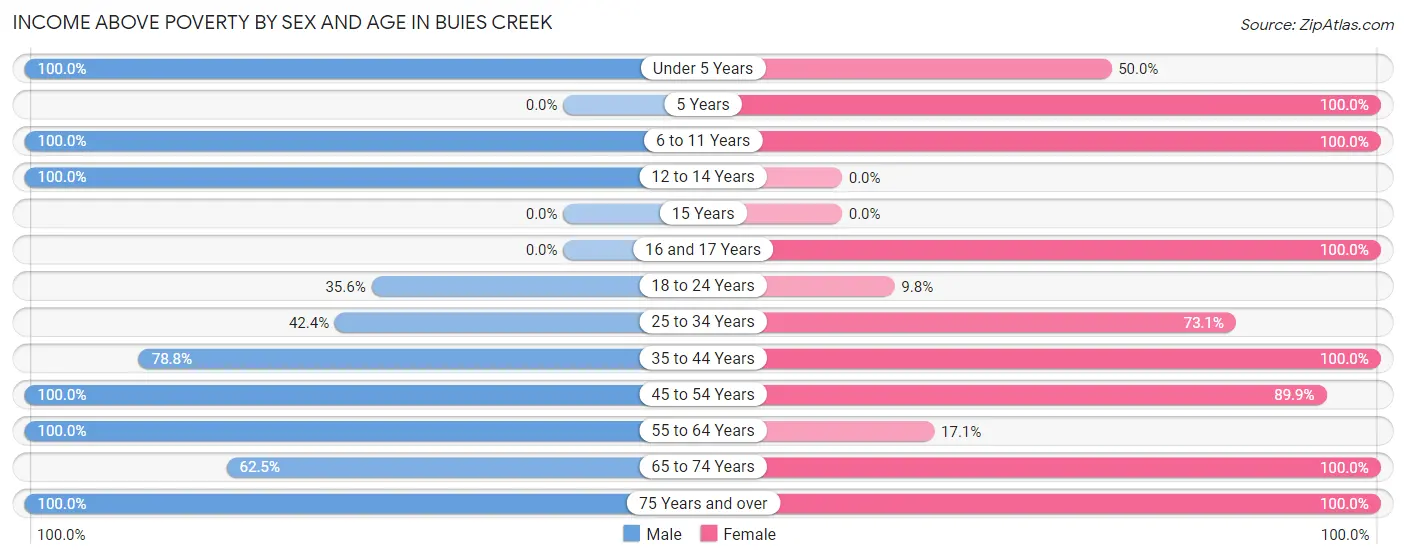
| Age Bracket | Male | Female |
| Under 5 Years | 30 (100.0%) | 10 (50.0%) |
| 5 Years | 0 (0.0%) | 41 (100.0%) |
| 6 to 11 Years | 7 (100.0%) | 7 (100.0%) |
| 12 to 14 Years | 36 (100.0%) | 0 (0.0%) |
| 15 Years | 0 (0.0%) | 0 (0.0%) |
| 16 and 17 Years | 0 (0.0%) | 33 (100.0%) |
| 18 to 24 Years | 99 (35.6%) | 46 (9.8%) |
| 25 to 34 Years | 78 (42.4%) | 204 (73.1%) |
| 35 to 44 Years | 145 (78.8%) | 34 (100.0%) |
| 45 to 54 Years | 40 (100.0%) | 107 (89.9%) |
| 55 to 64 Years | 107 (100.0%) | 12 (17.1%) |
| 65 to 74 Years | 45 (62.5%) | 57 (100.0%) |
| 75 Years and over | 45 (100.0%) | 47 (100.0%) |
| Total | 632 (61.9%) | 598 (50.8%) |
Income Below Poverty Among Married-Couple Families in Buies Creek
The poverty statistics for married-couple families in Buies Creek show that 4.7% or 15 of the total 322 families live below the poverty line. Families with 1 or 2 children have the highest poverty rate of 8.0%, comprising of 8 families. On the other hand, families with no children have the lowest poverty rate of 3.2%, which includes 7 families.
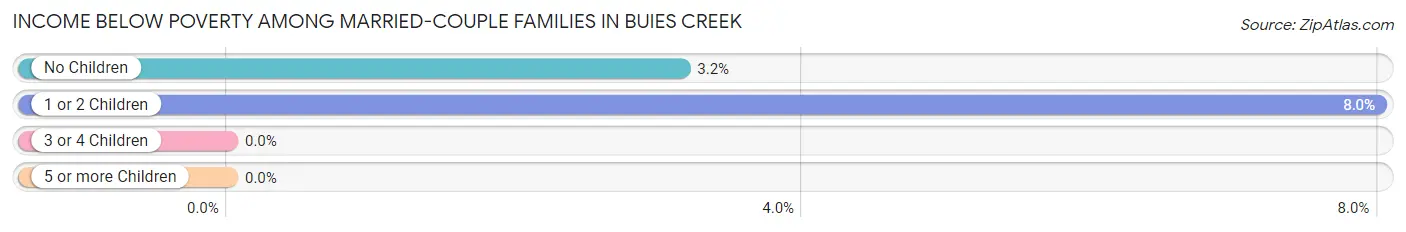
| Children | Above Poverty | Below Poverty |
| No Children | 215 (96.9%) | 7 (3.2%) |
| 1 or 2 Children | 92 (92.0%) | 8 (8.0%) |
| 3 or 4 Children | 0 (0.0%) | 0 (0.0%) |
| 5 or more Children | 0 (0.0%) | 0 (0.0%) |
| Total | 307 (95.3%) | 15 (4.7%) |
Income Below Poverty Among Single-Parent Households in Buies Creek
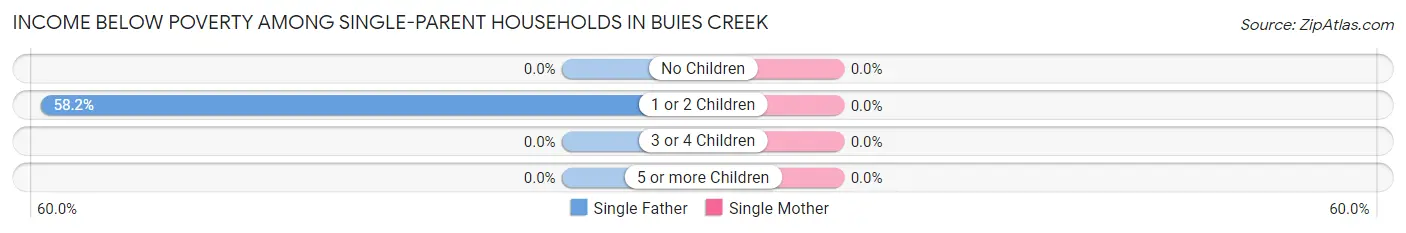
| Children | Single Father | Single Mother |
| No Children | 0 (0.0%) | 0 (0.0%) |
| 1 or 2 Children | 39 (58.2%) | 0 (0.0%) |
| 3 or 4 Children | 0 (0.0%) | 0 (0.0%) |
| 5 or more Children | 0 (0.0%) | 0 (0.0%) |
| Total | 39 (58.2%) | 0 (0.0%) |
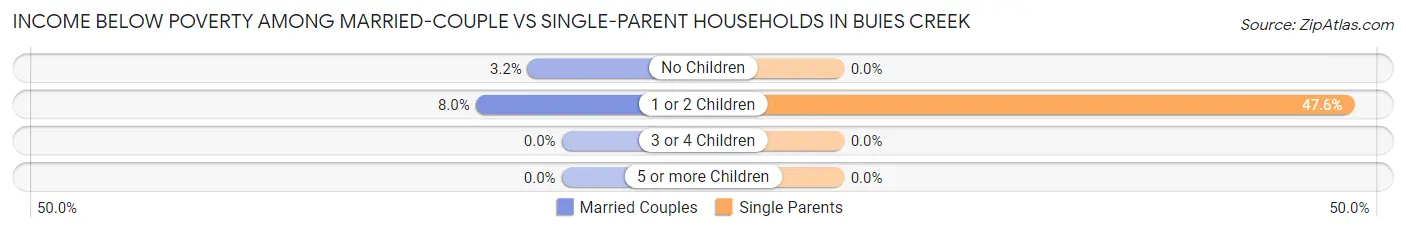
Income Below Poverty Among Married-Couple vs Single-Parent Households in Buies Creek
The poverty data for Buies Creek shows that 15 of the married-couple family households (4.7%) and 39 of the single-parent households (47.6%) are living below the poverty level. Within the married-couple family households, those with 1 or 2 children have the highest poverty rate, with 8 households (8.0%) falling below the poverty line. Among the single-parent households, those with 1 or 2 children have the highest poverty rate, with 39 household (47.6%) living below poverty.
| Children | Married-Couple Families | Single-Parent Households |
| No Children | 7 (3.2%) | 0 (0.0%) |
| 1 or 2 Children | 8 (8.0%) | 39 (47.6%) |
| 3 or 4 Children | 0 (0.0%) | 0 (0.0%) |
| 5 or more Children | 0 (0.0%) | 0 (0.0%) |
| Total | 15 (4.7%) | 39 (47.6%) |
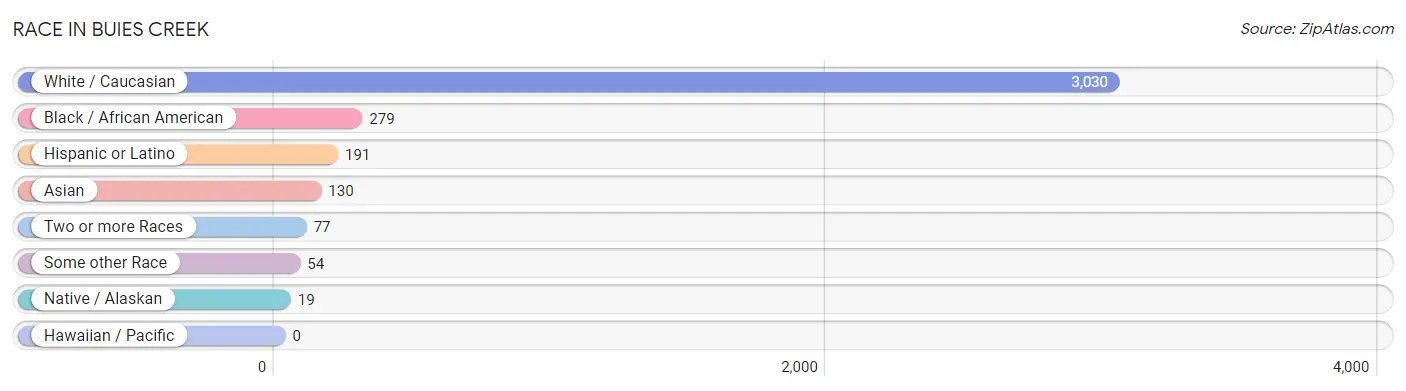
Race in Buies Creek
The most populous races in Buies Creek are White / Caucasian (3,030 | 84.4%), Black / African American (279 | 7.8%), and Hispanic or Latino (191 | 5.3%).
| Race | # Population | % Population |
| Asian | 130 | 3.6% |
| Black / African American | 279 | 7.8% |
| Hawaiian / Pacific | 0 | 0.0% |
| Hispanic or Latino | 191 | 5.3% |
| Native / Alaskan | 19 | 0.5% |
| White / Caucasian | 3,030 | 84.4% |
| Two or more Races | 77 | 2.1% |
| Some other Race | 54 | 1.5% |
| Total | 3,589 | 100.0% |
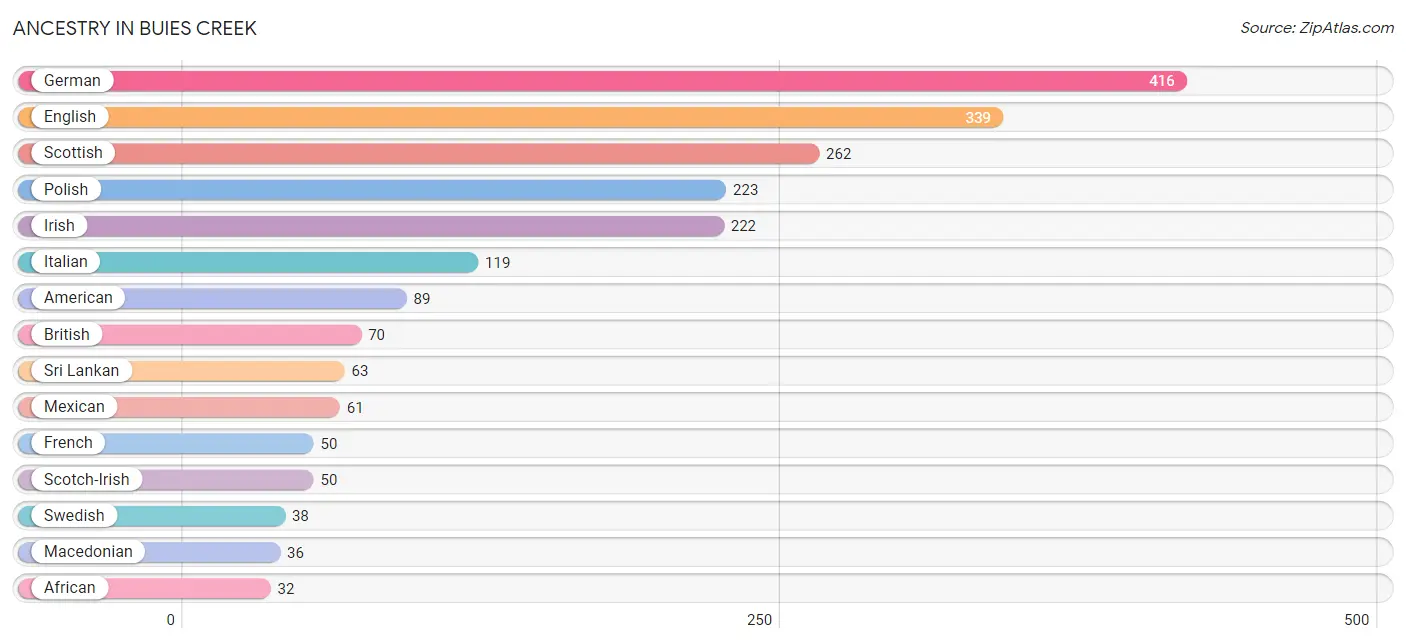
Ancestry in Buies Creek
The most populous ancestries reported in Buies Creek are German (416 | 11.6%), English (339 | 9.5%), Scottish (262 | 7.3%), Polish (223 | 6.2%), and Irish (222 | 6.2%), together accounting for 40.7% of all Buies Creek residents.
| Ancestry | # Population | % Population |
| African | 32 | 0.9% |
| Albanian | 18 | 0.5% |
| American | 89 | 2.5% |
| Bhutanese | 20 | 0.6% |
| British | 70 | 1.9% |
| Burmese | 30 | 0.8% |
| Canadian | 28 | 0.8% |
| Central American | 6 | 0.2% |
| Central American Indian | 8 | 0.2% |
| Choctaw | 11 | 0.3% |
| Colombian | 24 | 0.7% |
| Dutch | 7 | 0.2% |
| Eastern European | 1 | 0.0% |
| English | 339 | 9.5% |
| European | 10 | 0.3% |
| French | 50 | 1.4% |
| French Canadian | 7 | 0.2% |
| German | 416 | 11.6% |
| Greek | 25 | 0.7% |
| Guyanese | 9 | 0.3% |
| Indian (Asian) | 6 | 0.2% |
| Irish | 222 | 6.2% |
| Italian | 119 | 3.3% |
| Korean | 18 | 0.5% |
| Macedonian | 36 | 1.0% |
| Mexican | 61 | 1.7% |
| Norwegian | 25 | 0.7% |
| Polish | 223 | 6.2% |
| Portuguese | 8 | 0.2% |
| Puerto Rican | 21 | 0.6% |
| Salvadoran | 6 | 0.2% |
| Scandinavian | 12 | 0.3% |
| Scotch-Irish | 50 | 1.4% |
| Scottish | 262 | 7.3% |
| South American | 24 | 0.7% |
| Spaniard | 3 | 0.1% |
| Sri Lankan | 63 | 1.8% |
| Subsaharan African | 32 | 0.9% |
| Swedish | 38 | 1.1% |
| Swiss | 13 | 0.4% |
| Thai | 21 | 0.6% |
| Welsh | 29 | 0.8% | View All 42 Rows |
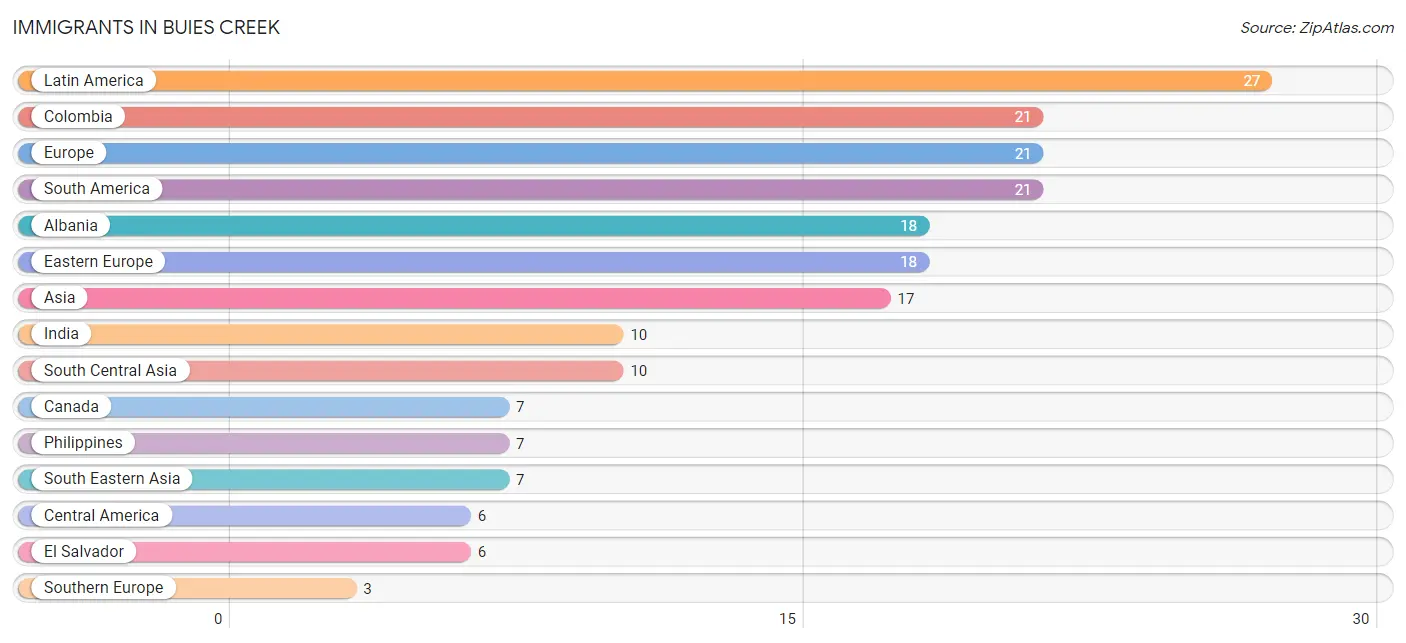
Immigrants in Buies Creek
The most numerous immigrant groups reported in Buies Creek came from Latin America (27 | 0.7%), Colombia (21 | 0.6%), Europe (21 | 0.6%), South America (21 | 0.6%), and Albania (18 | 0.5%), together accounting for 3.0% of all Buies Creek residents.
| Immigration Origin | # Population | % Population |
| Albania | 18 | 0.5% |
| Asia | 17 | 0.5% |
| Canada | 7 | 0.2% |
| Central America | 6 | 0.2% |
| Colombia | 21 | 0.6% |
| Eastern Europe | 18 | 0.5% |
| El Salvador | 6 | 0.2% |
| Europe | 21 | 0.6% |
| India | 10 | 0.3% |
| Latin America | 27 | 0.7% |
| Philippines | 7 | 0.2% |
| South America | 21 | 0.6% |
| South Central Asia | 10 | 0.3% |
| South Eastern Asia | 7 | 0.2% |
| Southern Europe | 3 | 0.1% |
| Spain | 3 | 0.1% | View All 16 Rows |
Sex and Age in Buies Creek
Sex and Age in Buies Creek
The most populous age groups in Buies Creek are 15 to 19 Years (667 | 36.2%) for men and 20 to 24 Years (790 | 45.2%) for women.
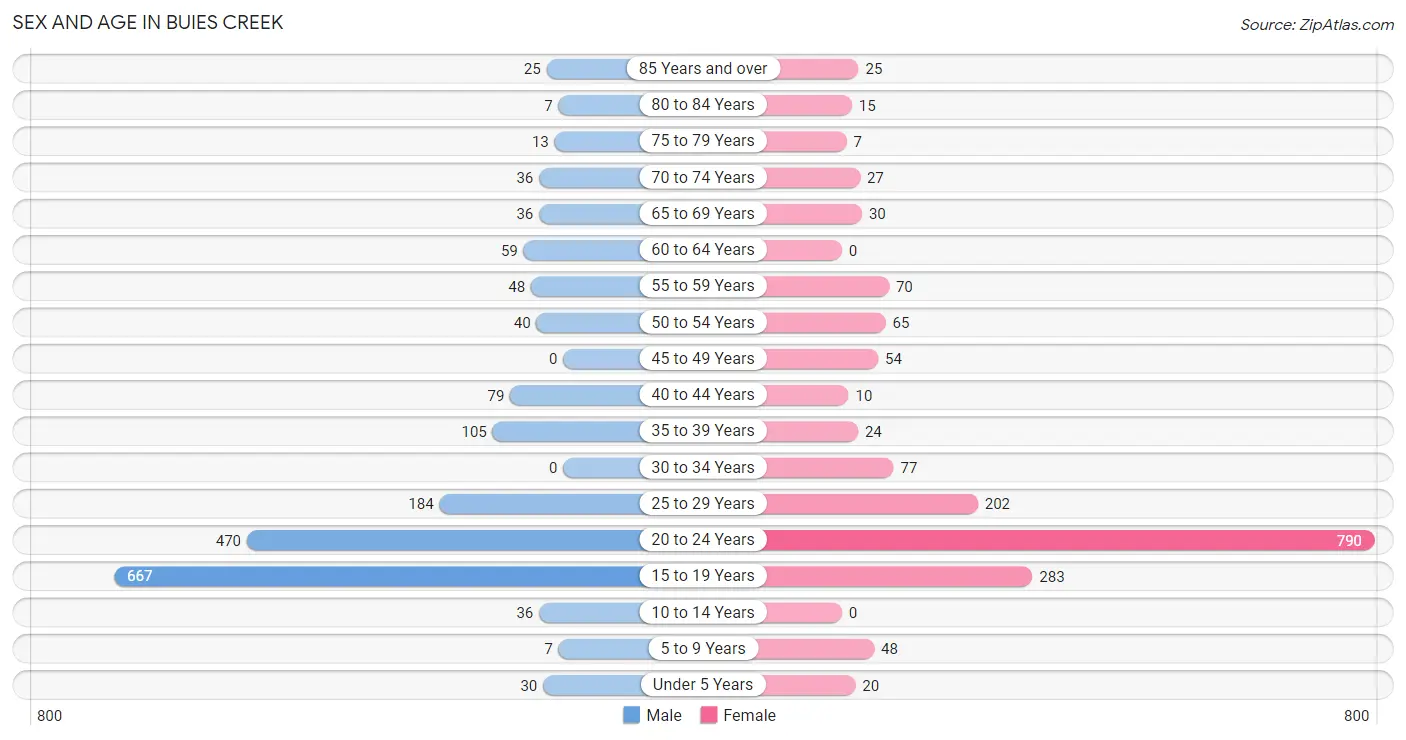
| Age Bracket | Male | Female |
| Under 5 Years | 30 (1.6%) | 20 (1.1%) |
| 5 to 9 Years | 7 (0.4%) | 48 (2.8%) |
| 10 to 14 Years | 36 (1.9%) | 0 (0.0%) |
| 15 to 19 Years | 667 (36.2%) | 283 (16.2%) |
| 20 to 24 Years | 470 (25.5%) | 790 (45.2%) |
| 25 to 29 Years | 184 (10.0%) | 202 (11.6%) |
| 30 to 34 Years | 0 (0.0%) | 77 (4.4%) |
| 35 to 39 Years | 105 (5.7%) | 24 (1.4%) |
| 40 to 44 Years | 79 (4.3%) | 10 (0.6%) |
| 45 to 49 Years | 0 (0.0%) | 54 (3.1%) |
| 50 to 54 Years | 40 (2.2%) | 65 (3.7%) |
| 55 to 59 Years | 48 (2.6%) | 70 (4.0%) |
| 60 to 64 Years | 59 (3.2%) | 0 (0.0%) |
| 65 to 69 Years | 36 (1.9%) | 30 (1.7%) |
| 70 to 74 Years | 36 (1.9%) | 27 (1.5%) |
| 75 to 79 Years | 13 (0.7%) | 7 (0.4%) |
| 80 to 84 Years | 7 (0.4%) | 15 (0.9%) |
| 85 Years and over | 25 (1.4%) | 25 (1.4%) |
| Total | 1,842 (100.0%) | 1,747 (100.0%) |
Families and Households in Buies Creek
Median Family Size in Buies Creek
The median family size in Buies Creek is 2.62 persons per family, with single male/father families (67 | 16.6%) accounting for the largest median family size of 2.78 persons per family. On the other hand, single female/mother families (15 | 3.7%) represent the smallest median family size with 2.20 persons per family.
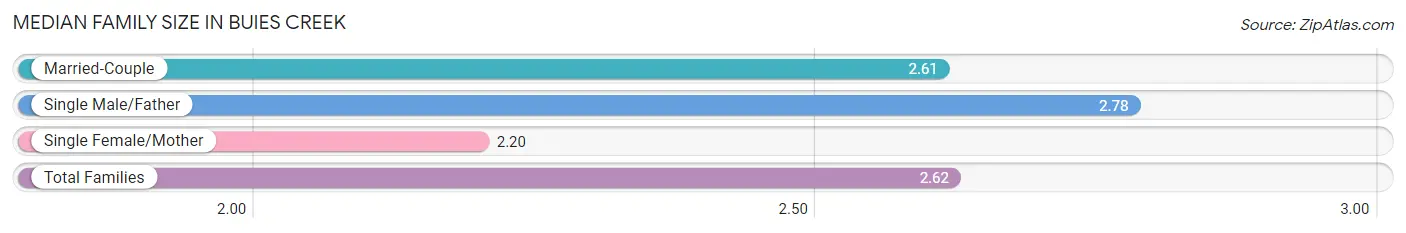
| Family Type | # Families | Family Size |
| Married-Couple | 322 (79.7%) | 2.61 |
| Single Male/Father | 67 (16.6%) | 2.78 |
| Single Female/Mother | 15 (3.7%) | 2.20 |
| Total Families | 404 (100.0%) | 2.62 |
Median Household Size in Buies Creek
The median household size in Buies Creek is 2.23 persons per household, with single female/mother households (15 | 1.5%) accounting for the largest median household size of 3.2 persons per household. non-family households (583 | 59.1%) represent the smallest median household size with 1.89 persons per household.
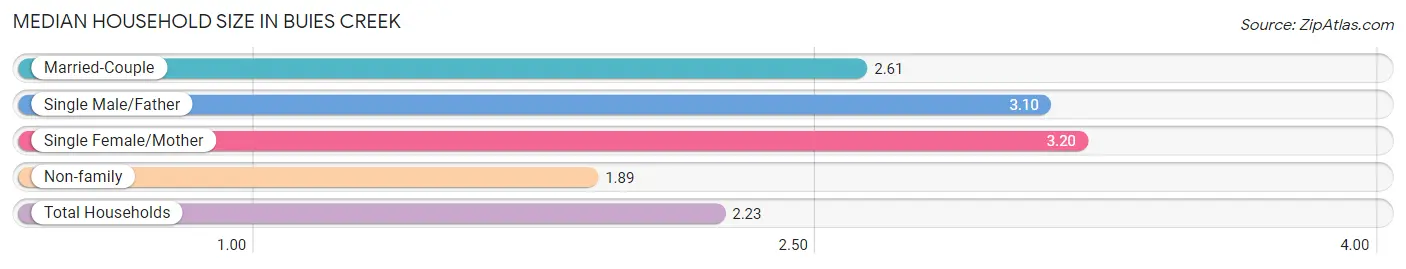
| Household Type | # Households | Household Size |
| Married-Couple | 322 (32.6%) | 2.61 |
| Single Male/Father | 67 (6.8%) | 3.10 |
| Single Female/Mother | 15 (1.5%) | 3.20 |
| Non-family | 583 (59.1%) | 1.89 |
| Total Households | 987 (100.0%) | 2.23 |
Household Size by Marriage Status in Buies Creek
Out of a total of 987 households in Buies Creek, 404 (40.9%) are family households, while 583 (59.1%) are nonfamily households. The most numerous type of family households are 2-person households, comprising 218, and the most common type of nonfamily households are 1-person households, comprising 385.
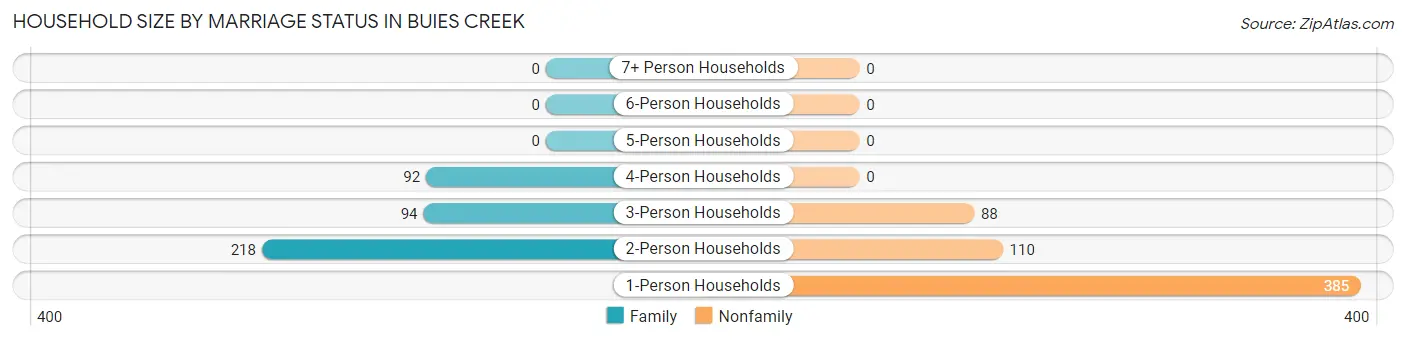
| Household Size | Family Households | Nonfamily Households |
| 1-Person Households | - | 385 (39.0%) |
| 2-Person Households | 218 (22.1%) | 110 (11.1%) |
| 3-Person Households | 94 (9.5%) | 88 (8.9%) |
| 4-Person Households | 92 (9.3%) | 0 (0.0%) |
| 5-Person Households | 0 (0.0%) | 0 (0.0%) |
| 6-Person Households | 0 (0.0%) | 0 (0.0%) |
| 7+ Person Households | 0 (0.0%) | 0 (0.0%) |
| Total | 404 (40.9%) | 583 (59.1%) |
Female Fertility in Buies Creek
Fertility by Age in Buies Creek
| Age Bracket | Women with Births | Births / 1,000 Women |
| 15 to 19 years | 0 (0.0%) | 0.0 |
| 20 to 34 years | 0 (0.0%) | 0.0 |
| 35 to 50 years | 0 (0.0%) | 0.0 |
| Total | 0 (0.0%) | 0.0 |
Fertility by Age by Marriage Status in Buies Creek
| Age Bracket | Married | Unmarried |
| 15 to 19 years | 0 (0.0%) | 0 (0.0%) |
| 20 to 34 years | 0 (0.0%) | 0 (0.0%) |
| 35 to 50 years | 0 (0.0%) | 0 (0.0%) |
| Total | 0 (0.0%) | 0 (0.0%) |
Fertility by Education in Buies Creek
| Educational Attainment | Women with Births | Births / 1,000 Women |
| Less than High School | 0 (0.0%) | 0.0 |
| High School Diploma | 0 (0.0%) | 0.0 |
| College or Associate's Degree | 0 (0.0%) | 0.0 |
| Bachelor's Degree | 0 (0.0%) | 0.0 |
| Graduate Degree | 0 (0.0%) | 0.0 |
| Total | 0 (0.0%) | 0.0 |
Fertility by Education by Marriage Status in Buies Creek
| Educational Attainment | Married | Unmarried |
| Less than High School | 0 (0.0%) | 0 (0.0%) |
| High School Diploma | 0 (0.0%) | 0 (0.0%) |
| College or Associate's Degree | 0 (0.0%) | 0 (0.0%) |
| Bachelor's Degree | 0 (0.0%) | 0 (0.0%) |
| Graduate Degree | 0 (0.0%) | 0 (0.0%) |
| Total | 0 (0.0%) | 0 (0.0%) |
Employment Characteristics in Buies Creek
Employment by Class of Employer in Buies Creek
Among the 1,470 employed individuals in Buies Creek, private company employees (1,012 | 68.8%), local government employees (142 | 9.7%), and not-for-profit organizations (141 | 9.6%) make up the most common classes of employment.
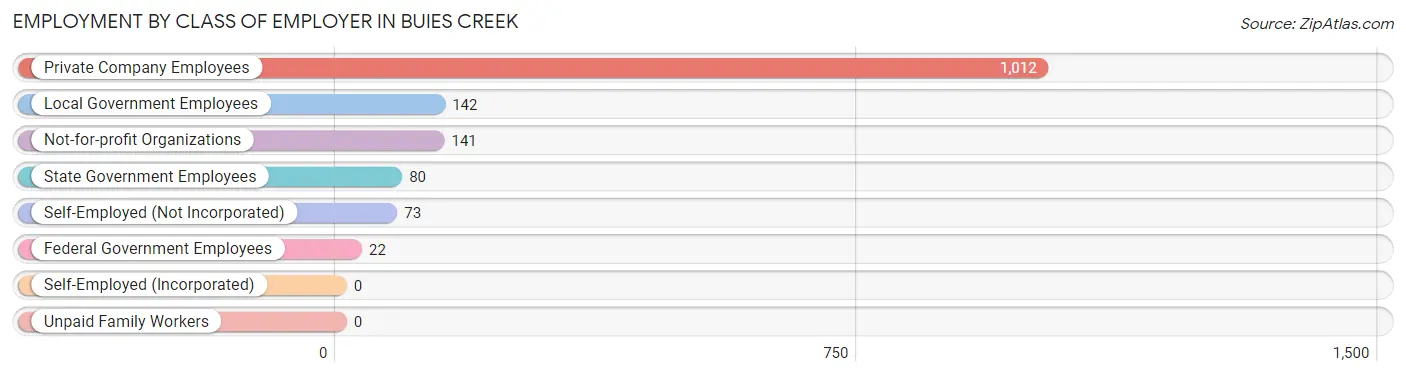
| Employer Class | # Employees | % Employees |
| Private Company Employees | 1,012 | 68.8% |
| Self-Employed (Incorporated) | 0 | 0.0% |
| Self-Employed (Not Incorporated) | 73 | 5.0% |
| Not-for-profit Organizations | 141 | 9.6% |
| Local Government Employees | 142 | 9.7% |
| State Government Employees | 80 | 5.4% |
| Federal Government Employees | 22 | 1.5% |
| Unpaid Family Workers | 0 | 0.0% |
| Total | 1,470 | 100.0% |
Employment Status by Age in Buies Creek
According to the labor force statistics for Buies Creek, out of the total population over 16 years of age (3,410), 46.0% or 1,569 individuals are in the labor force, with 1.4% or 22 of them unemployed. The age group with the highest labor force participation rate is 60 to 64 years, with 100.0% or 59 individuals in the labor force. Within the labor force, the 16 to 19 years age range has the highest percentage of unemployed individuals, with 4.9% or 22 of them being unemployed.
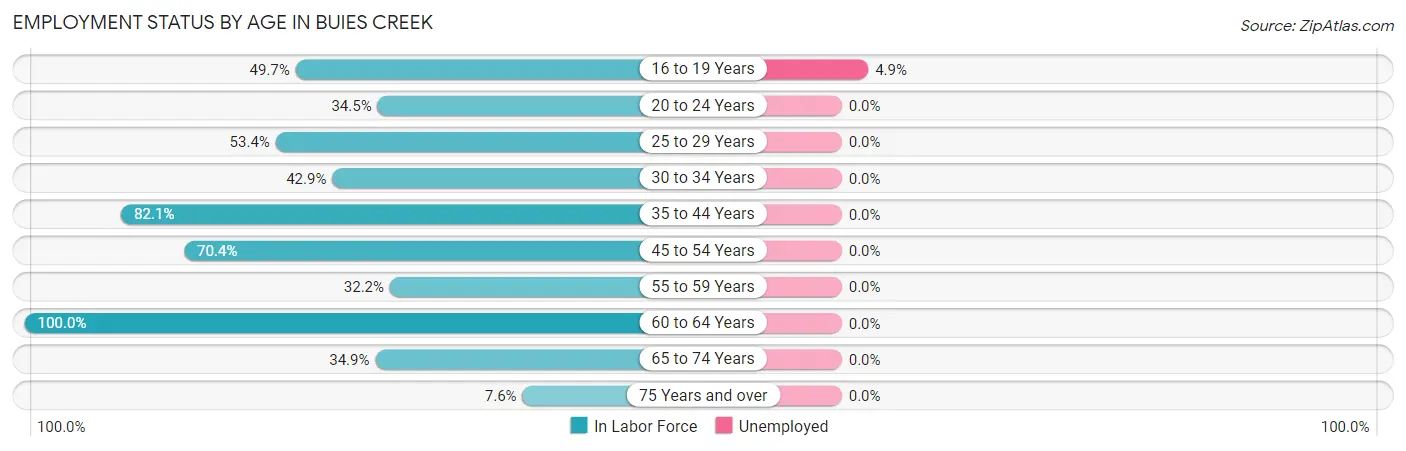
| Age Bracket | In Labor Force | Unemployed |
| 16 to 19 Years | 453 (49.7%) | 22 (4.9%) |
| 20 to 24 Years | 435 (34.5%) | 0 (0.0%) |
| 25 to 29 Years | 206 (53.4%) | 0 (0.0%) |
| 30 to 34 Years | 33 (42.9%) | 0 (0.0%) |
| 35 to 44 Years | 179 (82.1%) | 0 (0.0%) |
| 45 to 54 Years | 112 (70.4%) | 0 (0.0%) |
| 55 to 59 Years | 38 (32.2%) | 0 (0.0%) |
| 60 to 64 Years | 59 (100.0%) | 0 (0.0%) |
| 65 to 74 Years | 45 (34.9%) | 0 (0.0%) |
| 75 Years and over | 7 (7.6%) | 0 (0.0%) |
| Total | 1,569 (46.0%) | 22 (1.4%) |
Employment Status by Educational Attainment in Buies Creek
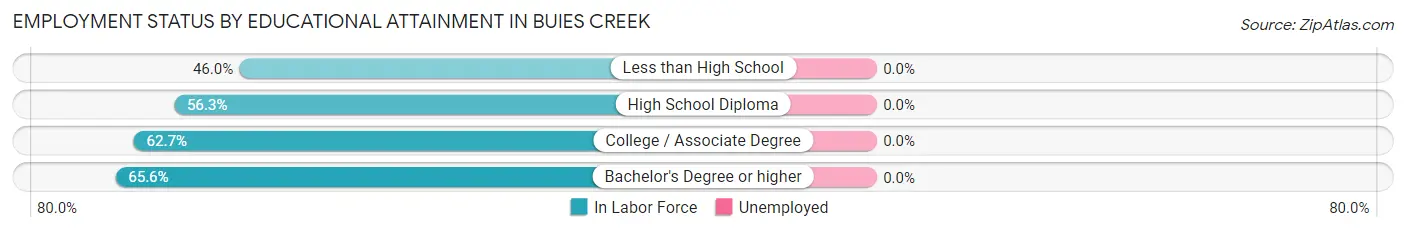
| Educational Attainment | In Labor Force | Unemployed |
| Less than High School | 46 (46.0%) | 0 (0.0%) |
| High School Diploma | 103 (56.3%) | 0 (0.0%) |
| College / Associate Degree | 74 (62.7%) | 0 (0.0%) |
| Bachelor's Degree or higher | 404 (65.6%) | 0 (0.0%) |
| Total | 627 (61.7%) | 0 (0.0%) |
Employment Occupations by Sex in Buies Creek
Management, Business, Science and Arts Occupations
The most common Management, Business, Science and Arts occupations in Buies Creek are Community & Social Service (301 | 19.5%), Health Diagnosing & Treating (173 | 11.2%), Management (143 | 9.3%), Arts, Media & Entertainment (111 | 7.2%), and Education Instruction & Library (108 | 7.0%).
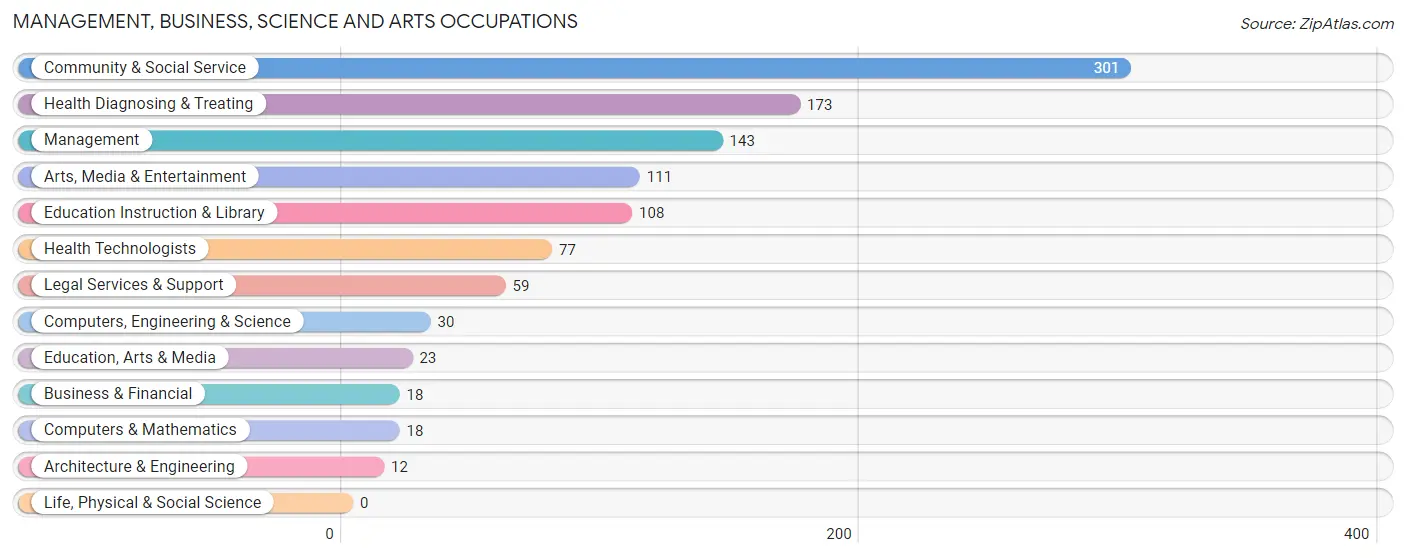
Management, Business, Science and Arts Occupations by Sex
Within the Management, Business, Science and Arts occupations in Buies Creek, the most male-oriented occupations are Computers, Engineering & Science (100.0%), Computers & Mathematics (100.0%), and Architecture & Engineering (100.0%), while the most female-oriented occupations are Business & Financial (55.6%), Health Diagnosing & Treating (53.8%), and Health Technologists (46.8%).
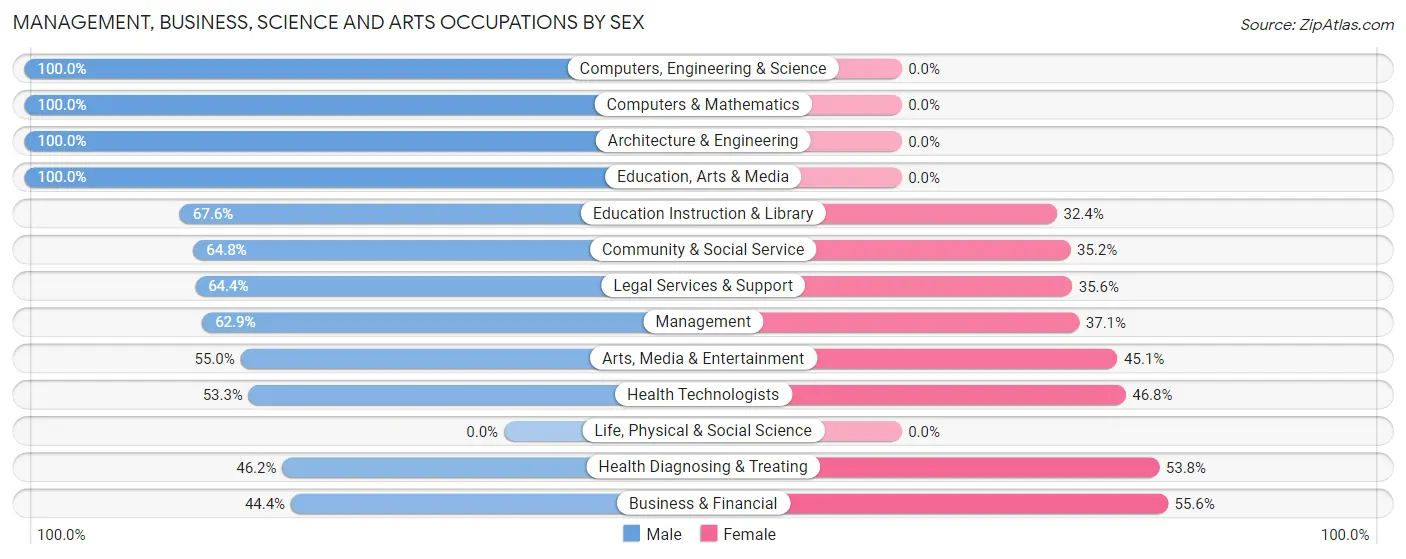
| Occupation | Male | Female |
| Management | 90 (62.9%) | 53 (37.1%) |
| Business & Financial | 8 (44.4%) | 10 (55.6%) |
| Computers, Engineering & Science | 30 (100.0%) | 0 (0.0%) |
| Computers & Mathematics | 18 (100.0%) | 0 (0.0%) |
| Architecture & Engineering | 12 (100.0%) | 0 (0.0%) |
| Life, Physical & Social Science | 0 (0.0%) | 0 (0.0%) |
| Community & Social Service | 195 (64.8%) | 106 (35.2%) |
| Education, Arts & Media | 23 (100.0%) | 0 (0.0%) |
| Legal Services & Support | 38 (64.4%) | 21 (35.6%) |
| Education Instruction & Library | 73 (67.6%) | 35 (32.4%) |
| Arts, Media & Entertainment | 61 (54.9%) | 50 (45.1%) |
| Health Diagnosing & Treating | 80 (46.2%) | 93 (53.8%) |
| Health Technologists | 41 (53.2%) | 36 (46.8%) |
| Total (Category) | 403 (60.6%) | 262 (39.4%) |
| Total (Overall) | 894 (57.9%) | 651 (42.1%) |
Services Occupations
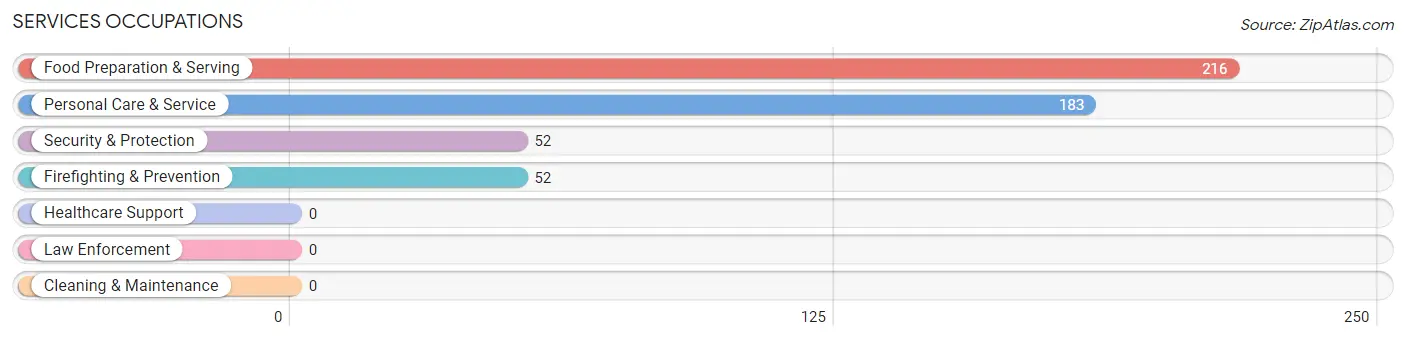
The most common Services occupations in Buies Creek are Food Preparation & Serving (216 | 14.0%), Personal Care & Service (183 | 11.8%), Security & Protection (52 | 3.4%), and Firefighting & Prevention (52 | 3.4%).
Services Occupations by Sex
Within the Services occupations in Buies Creek, the most male-oriented occupations are Personal Care & Service (86.3%), Food Preparation & Serving (49.5%), and Security & Protection (40.4%), while the most female-oriented occupations are Security & Protection (59.6%), Firefighting & Prevention (59.6%), and Food Preparation & Serving (50.5%).
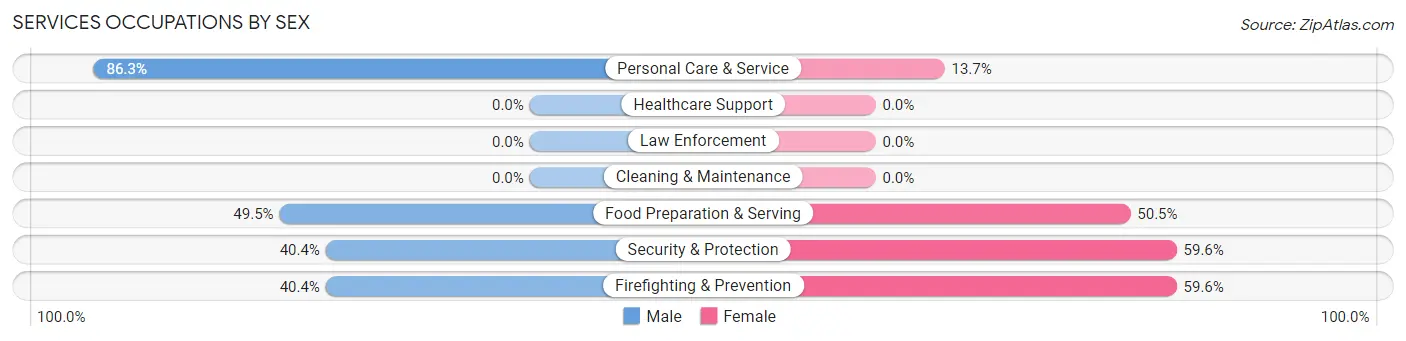
| Occupation | Male | Female |
| Healthcare Support | 0 (0.0%) | 0 (0.0%) |
| Security & Protection | 21 (40.4%) | 31 (59.6%) |
| Firefighting & Prevention | 21 (40.4%) | 31 (59.6%) |
| Law Enforcement | 0 (0.0%) | 0 (0.0%) |
| Food Preparation & Serving | 107 (49.5%) | 109 (50.5%) |
| Cleaning & Maintenance | 0 (0.0%) | 0 (0.0%) |
| Personal Care & Service | 158 (86.3%) | 25 (13.7%) |
| Total (Category) | 286 (63.4%) | 165 (36.6%) |
| Total (Overall) | 894 (57.9%) | 651 (42.1%) |
Sales and Office Occupations
The most common Sales and Office occupations in Buies Creek are Sales & Related (110 | 7.1%), and Office & Administration (81 | 5.2%).
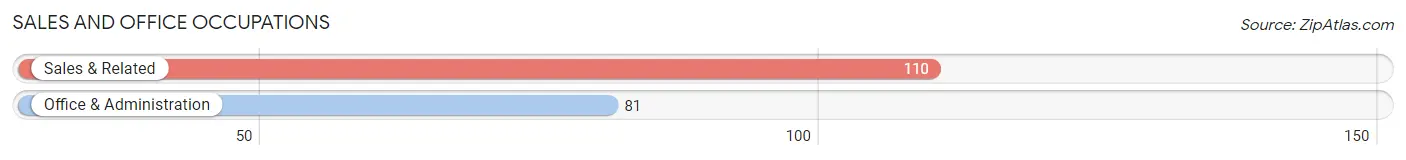
Sales and Office Occupations by Sex
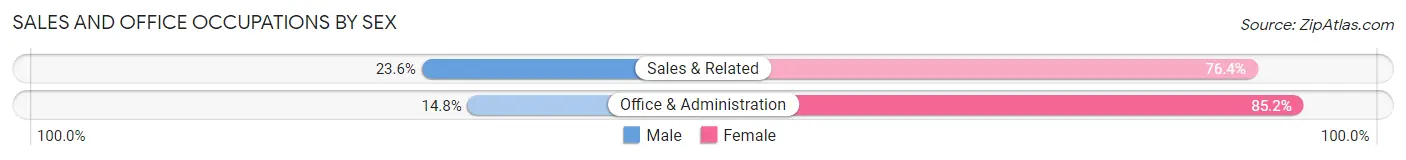
| Occupation | Male | Female |
| Sales & Related | 26 (23.6%) | 84 (76.4%) |
| Office & Administration | 12 (14.8%) | 69 (85.2%) |
| Total (Category) | 38 (19.9%) | 153 (80.1%) |
| Total (Overall) | 894 (57.9%) | 651 (42.1%) |
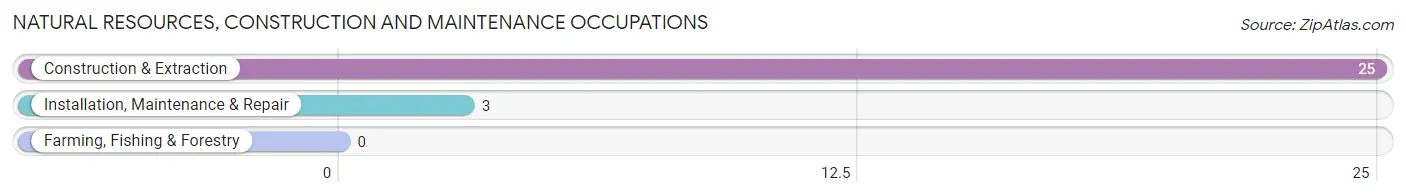
Natural Resources, Construction and Maintenance Occupations
The most common Natural Resources, Construction and Maintenance occupations in Buies Creek are Construction & Extraction (25 | 1.6%), and Installation, Maintenance & Repair (3 | 0.2%).
Natural Resources, Construction and Maintenance Occupations by Sex
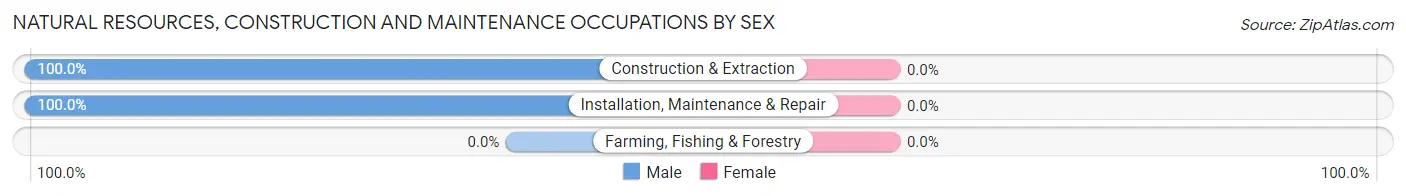
| Occupation | Male | Female |
| Farming, Fishing & Forestry | 0 (0.0%) | 0 (0.0%) |
| Construction & Extraction | 25 (100.0%) | 0 (0.0%) |
| Installation, Maintenance & Repair | 3 (100.0%) | 0 (0.0%) |
| Total (Category) | 28 (100.0%) | 0 (0.0%) |
| Total (Overall) | 894 (57.9%) | 651 (42.1%) |
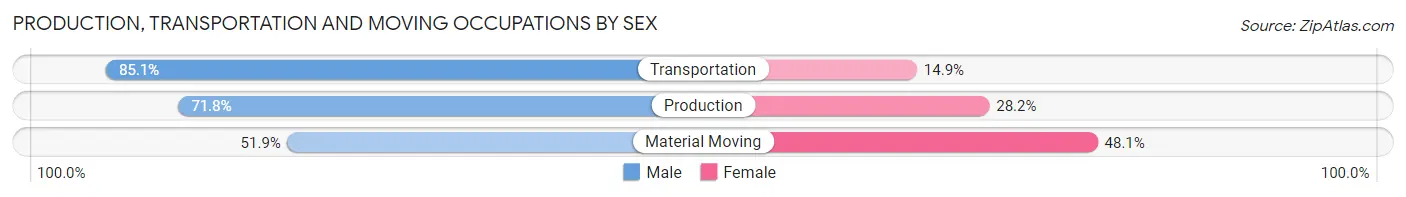
Production, Transportation and Moving Occupations
The most common Production, Transportation and Moving occupations in Buies Creek are Material Moving (104 | 6.7%), Transportation (67 | 4.3%), and Production (39 | 2.5%).
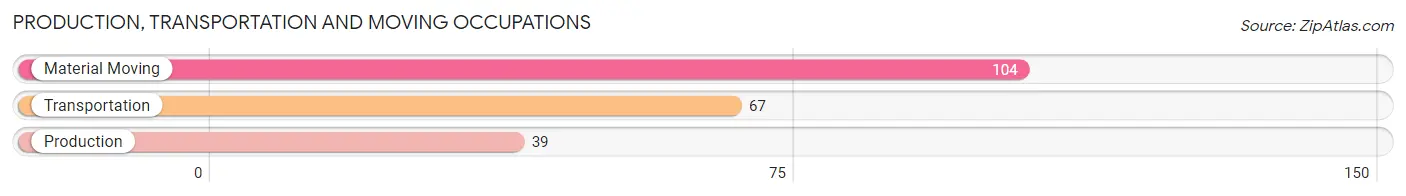
Production, Transportation and Moving Occupations by Sex
| Occupation | Male | Female |
| Production | 28 (71.8%) | 11 (28.2%) |
| Transportation | 57 (85.1%) | 10 (14.9%) |
| Material Moving | 54 (51.9%) | 50 (48.1%) |
| Total (Category) | 139 (66.2%) | 71 (33.8%) |
| Total (Overall) | 894 (57.9%) | 651 (42.1%) |
Employment Industries by Sex in Buies Creek
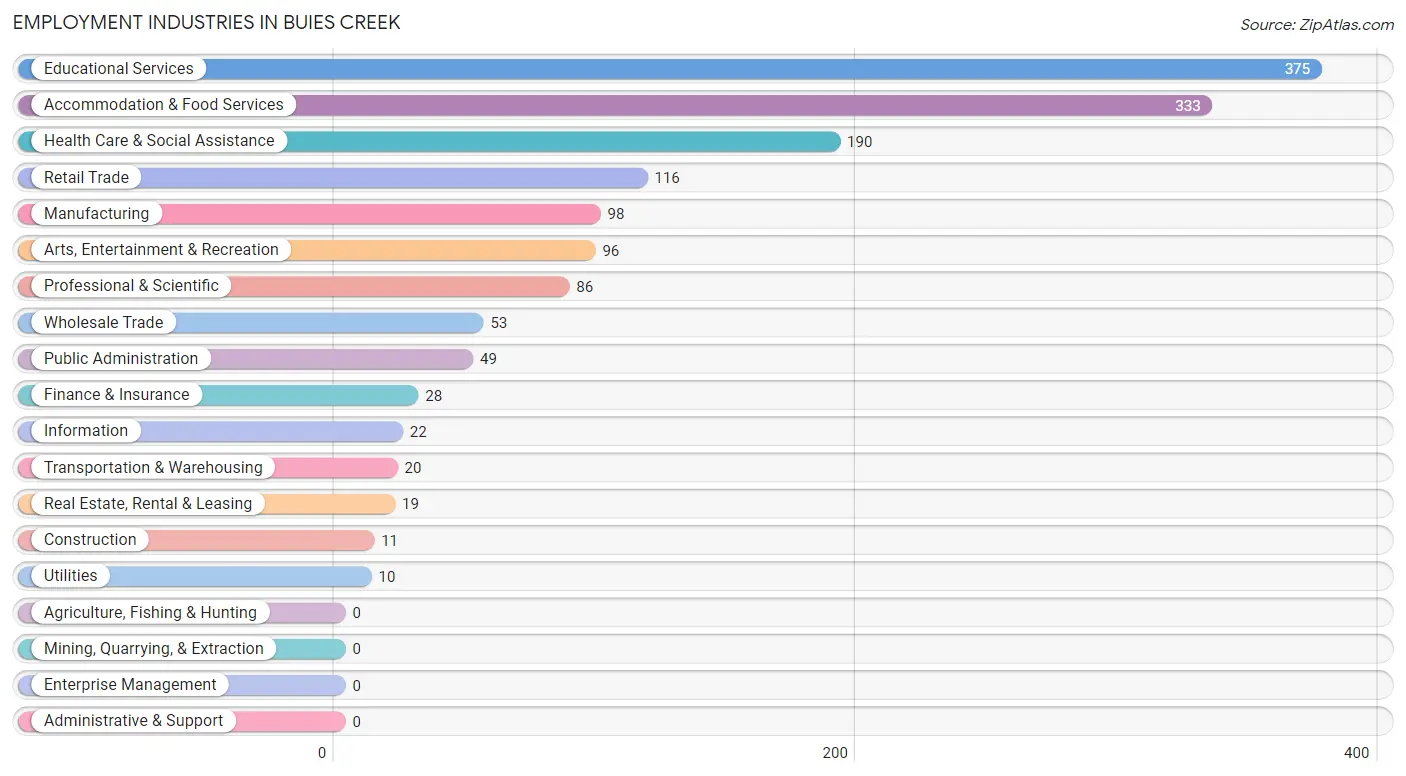
Employment Industries in Buies Creek
The major employment industries in Buies Creek include Educational Services (375 | 24.3%), Accommodation & Food Services (333 | 21.5%), Health Care & Social Assistance (190 | 12.3%), Retail Trade (116 | 7.5%), and Manufacturing (98 | 6.3%).
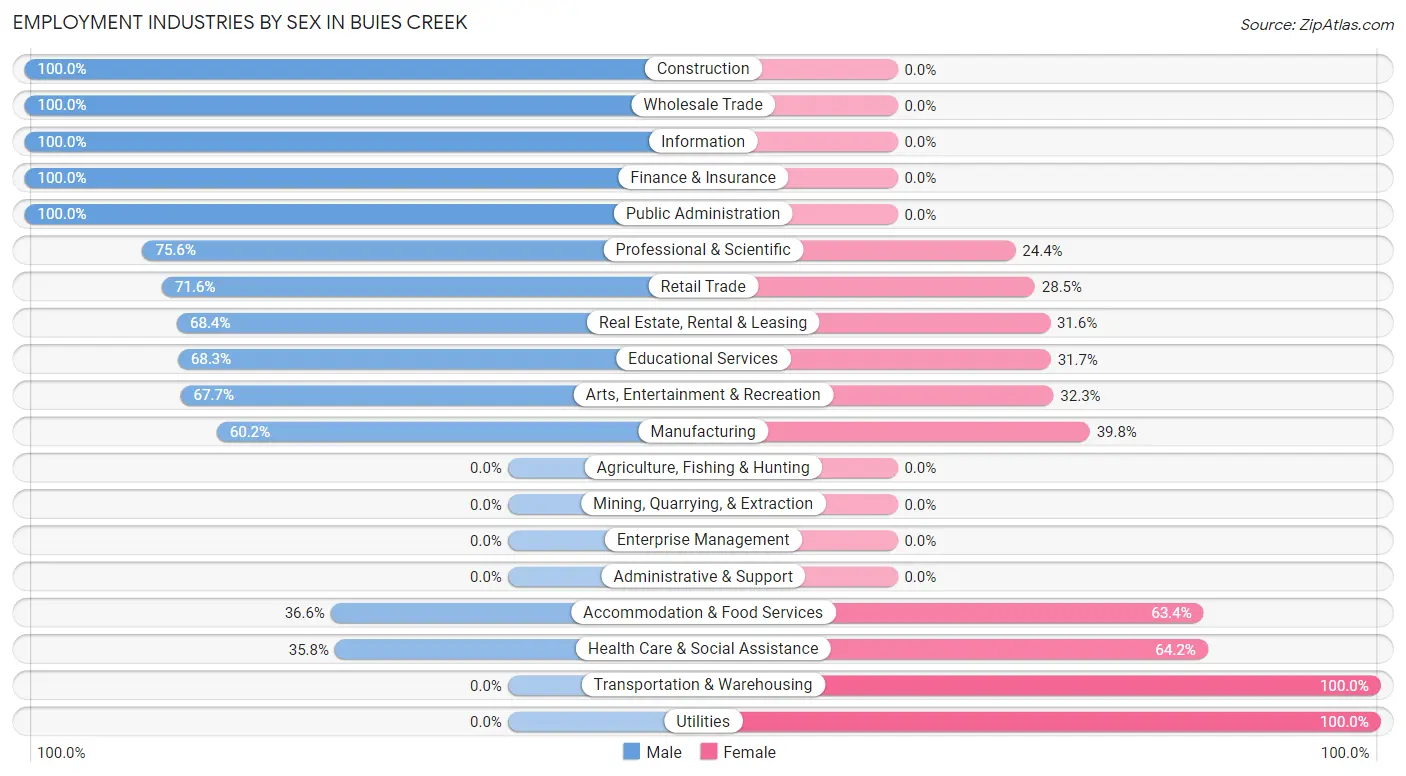
Employment Industries by Sex in Buies Creek
The Buies Creek industries that see more men than women are Construction (100.0%), Wholesale Trade (100.0%), and Information (100.0%), whereas the industries that tend to have a higher number of women are Transportation & Warehousing (100.0%), Utilities (100.0%), and Health Care & Social Assistance (64.2%).
| Industry | Male | Female |
| Agriculture, Fishing & Hunting | 0 (0.0%) | 0 (0.0%) |
| Mining, Quarrying, & Extraction | 0 (0.0%) | 0 (0.0%) |
| Construction | 11 (100.0%) | 0 (0.0%) |
| Manufacturing | 59 (60.2%) | 39 (39.8%) |
| Wholesale Trade | 53 (100.0%) | 0 (0.0%) |
| Retail Trade | 83 (71.6%) | 33 (28.4%) |
| Transportation & Warehousing | 0 (0.0%) | 20 (100.0%) |
| Utilities | 0 (0.0%) | 10 (100.0%) |
| Information | 22 (100.0%) | 0 (0.0%) |
| Finance & Insurance | 28 (100.0%) | 0 (0.0%) |
| Real Estate, Rental & Leasing | 13 (68.4%) | 6 (31.6%) |
| Professional & Scientific | 65 (75.6%) | 21 (24.4%) |
| Enterprise Management | 0 (0.0%) | 0 (0.0%) |
| Administrative & Support | 0 (0.0%) | 0 (0.0%) |
| Educational Services | 256 (68.3%) | 119 (31.7%) |
| Health Care & Social Assistance | 68 (35.8%) | 122 (64.2%) |
| Arts, Entertainment & Recreation | 65 (67.7%) | 31 (32.3%) |
| Accommodation & Food Services | 122 (36.6%) | 211 (63.4%) |
| Public Administration | 49 (100.0%) | 0 (0.0%) |
| Total | 894 (57.9%) | 651 (42.1%) |
Education in Buies Creek
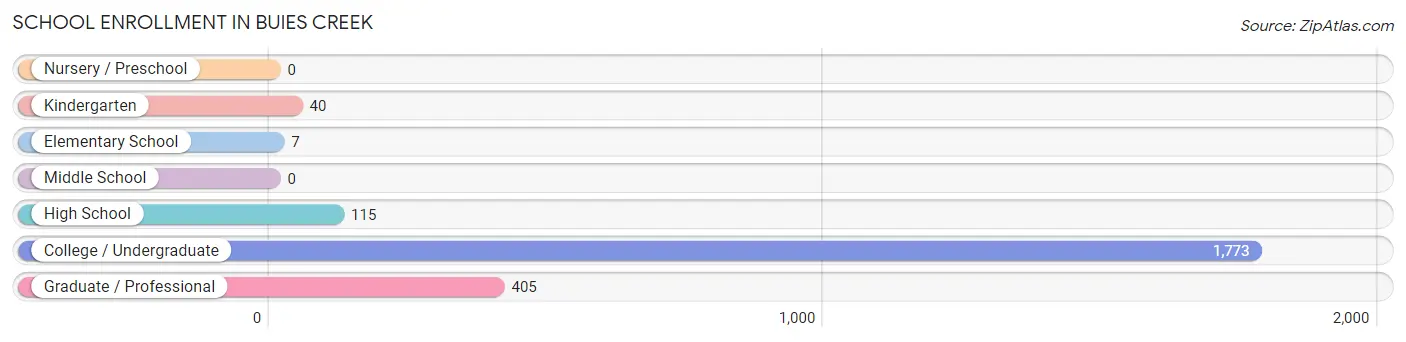
School Enrollment in Buies Creek
The most common levels of schooling among the 2,340 students in Buies Creek are college / undergraduate (1,773 | 75.8%), graduate / professional (405 | 17.3%), and high school (115 | 4.9%).
| School Level | # Students | % Students |
| Nursery / Preschool | 0 | 0.0% |
| Kindergarten | 40 | 1.7% |
| Elementary School | 7 | 0.3% |
| Middle School | 0 | 0.0% |
| High School | 115 | 4.9% |
| College / Undergraduate | 1,773 | 75.8% |
| Graduate / Professional | 405 | 17.3% |
| Total | 2,340 | 100.0% |
School Enrollment by Age by Funding Source in Buies Creek
Out of a total of 2,340 students who are enrolled in schools in Buies Creek, 2,022 (86.4%) attend a private institution, while the remaining 318 (13.6%) are enrolled in public schools. The age group of 25 to 34 year olds has the highest likelihood of being enrolled in private schools, with 178 (100.0% in the age bracket) enrolled. Conversely, the age group of 5 to 9 year old has the lowest likelihood of being enrolled in a private school, with 47 (100.0% in the age bracket) attending a public institution.
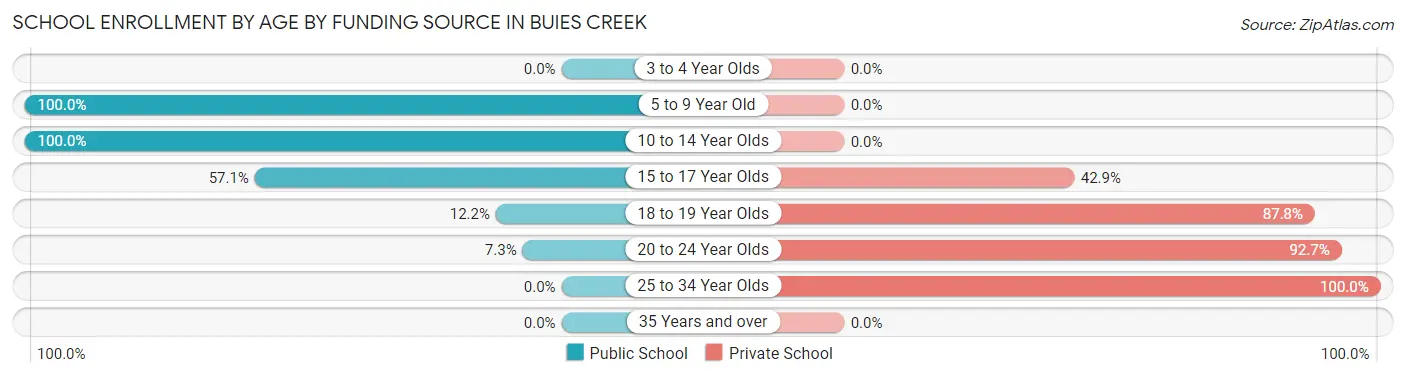
| Age Bracket | Public School | Private School |
| 3 to 4 Year Olds | 0 (0.0%) | 0 (0.0%) |
| 5 to 9 Year Old | 47 (100.0%) | 0 (0.0%) |
| 10 to 14 Year Olds | 36 (100.0%) | 0 (0.0%) |
| 15 to 17 Year Olds | 48 (57.1%) | 36 (42.9%) |
| 18 to 19 Year Olds | 106 (12.2%) | 760 (87.8%) |
| 20 to 24 Year Olds | 82 (7.3%) | 1,047 (92.7%) |
| 25 to 34 Year Olds | 0 (0.0%) | 178 (100.0%) |
| 35 Years and over | 0 (0.0%) | 0 (0.0%) |
| Total | 318 (13.6%) | 2,022 (86.4%) |
Educational Attainment by Field of Study in Buies Creek
Education (159 | 19.2%), bio, nature & agricultural (120 | 14.5%), arts & humanities (103 | 12.4%), science & technology (101 | 12.2%), and social sciences (69 | 8.3%) are the most common fields of study among 829 individuals in Buies Creek who have obtained a bachelor's degree or higher.
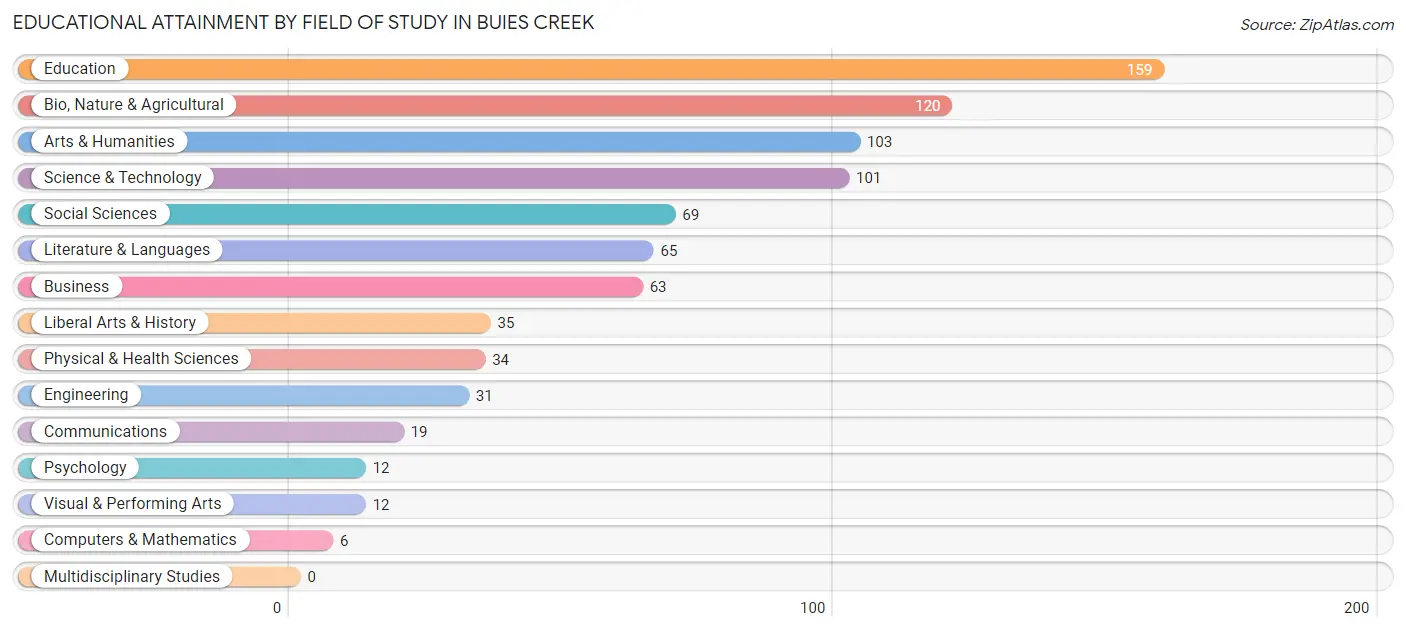
| Field of Study | # Graduates | % Graduates |
| Computers & Mathematics | 6 | 0.7% |
| Bio, Nature & Agricultural | 120 | 14.5% |
| Physical & Health Sciences | 34 | 4.1% |
| Psychology | 12 | 1.5% |
| Social Sciences | 69 | 8.3% |
| Engineering | 31 | 3.7% |
| Multidisciplinary Studies | 0 | 0.0% |
| Science & Technology | 101 | 12.2% |
| Business | 63 | 7.6% |
| Education | 159 | 19.2% |
| Literature & Languages | 65 | 7.8% |
| Liberal Arts & History | 35 | 4.2% |
| Visual & Performing Arts | 12 | 1.5% |
| Communications | 19 | 2.3% |
| Arts & Humanities | 103 | 12.4% |
| Total | 829 | 100.0% |
Transportation & Commute in Buies Creek
Vehicle Availability by Sex in Buies Creek
The most prevalent vehicle ownership categories in Buies Creek are males with 2 vehicles (225, accounting for 40.8%) and females with 2 vehicles (97, making up 49.3%).
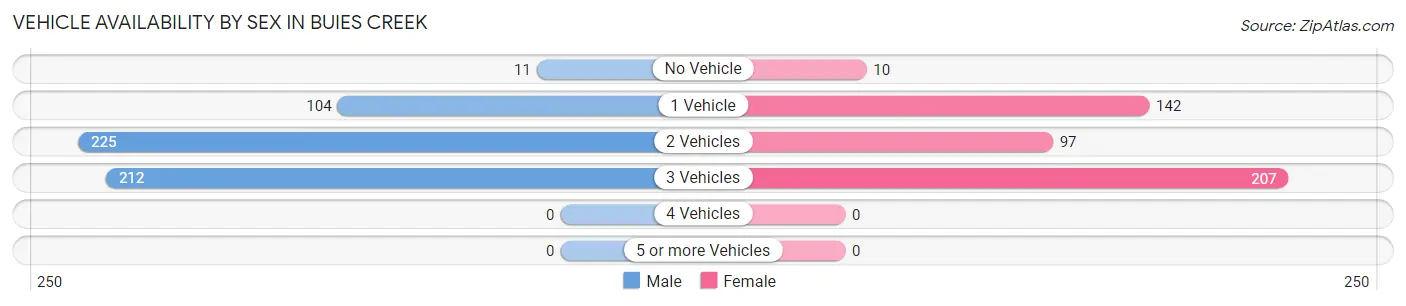
| Vehicles Available | Male | Female |
| No Vehicle | 11 (2.0%) | 10 (2.2%) |
| 1 Vehicle | 104 (18.8%) | 142 (31.1%) |
| 2 Vehicles | 225 (40.8%) | 97 (21.3%) |
| 3 Vehicles | 212 (38.4%) | 207 (45.4%) |
| 4 Vehicles | 0 (0.0%) | 0 (0.0%) |
| 5 or more Vehicles | 0 (0.0%) | 0 (0.0%) |
| Total | 552 (100.0%) | 456 (100.0%) |
Commute Time in Buies Creek
The most frequently occuring commute durations in Buies Creek are 20 to 24 minutes (256 commuters, 17.9%), 10 to 14 minutes (214 commuters, 14.9%), and 15 to 19 minutes (205 commuters, 14.3%).
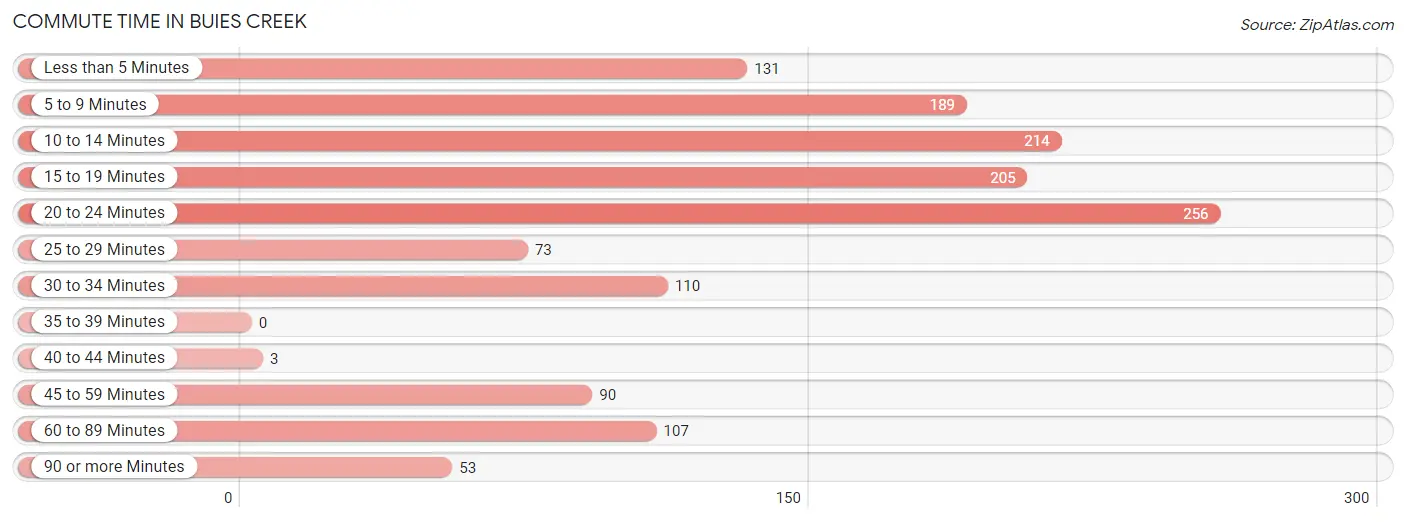
| Commute Time | # Commuters | % Commuters |
| Less than 5 Minutes | 131 | 9.1% |
| 5 to 9 Minutes | 189 | 13.2% |
| 10 to 14 Minutes | 214 | 14.9% |
| 15 to 19 Minutes | 205 | 14.3% |
| 20 to 24 Minutes | 256 | 17.9% |
| 25 to 29 Minutes | 73 | 5.1% |
| 30 to 34 Minutes | 110 | 7.7% |
| 35 to 39 Minutes | 0 | 0.0% |
| 40 to 44 Minutes | 3 | 0.2% |
| 45 to 59 Minutes | 90 | 6.3% |
| 60 to 89 Minutes | 107 | 7.5% |
| 90 or more Minutes | 53 | 3.7% |
Commute Time by Sex in Buies Creek
The most common commute times in Buies Creek are 20 to 24 minutes (190 commuters, 23.5%) for males and 10 to 14 minutes (146 commuters, 23.4%) for females.
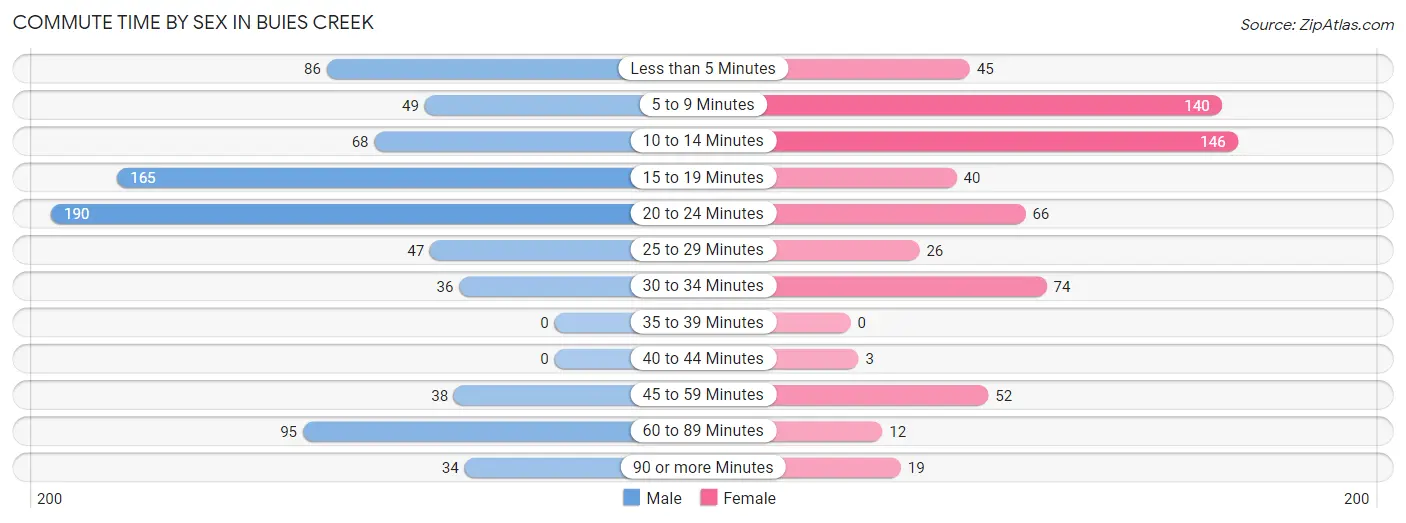
| Commute Time | Male | Female |
| Less than 5 Minutes | 86 (10.6%) | 45 (7.2%) |
| 5 to 9 Minutes | 49 (6.1%) | 140 (22.5%) |
| 10 to 14 Minutes | 68 (8.4%) | 146 (23.4%) |
| 15 to 19 Minutes | 165 (20.4%) | 40 (6.4%) |
| 20 to 24 Minutes | 190 (23.5%) | 66 (10.6%) |
| 25 to 29 Minutes | 47 (5.8%) | 26 (4.2%) |
| 30 to 34 Minutes | 36 (4.5%) | 74 (11.9%) |
| 35 to 39 Minutes | 0 (0.0%) | 0 (0.0%) |
| 40 to 44 Minutes | 0 (0.0%) | 3 (0.5%) |
| 45 to 59 Minutes | 38 (4.7%) | 52 (8.4%) |
| 60 to 89 Minutes | 95 (11.8%) | 12 (1.9%) |
| 90 or more Minutes | 34 (4.2%) | 19 (3.0%) |
Time of Departure to Work by Sex in Buies Creek
The most frequent times of departure to work in Buies Creek are 12:00 PM to 3:59 PM (236, 29.2%) for males and 12:00 PM to 3:59 PM (149, 23.9%) for females.
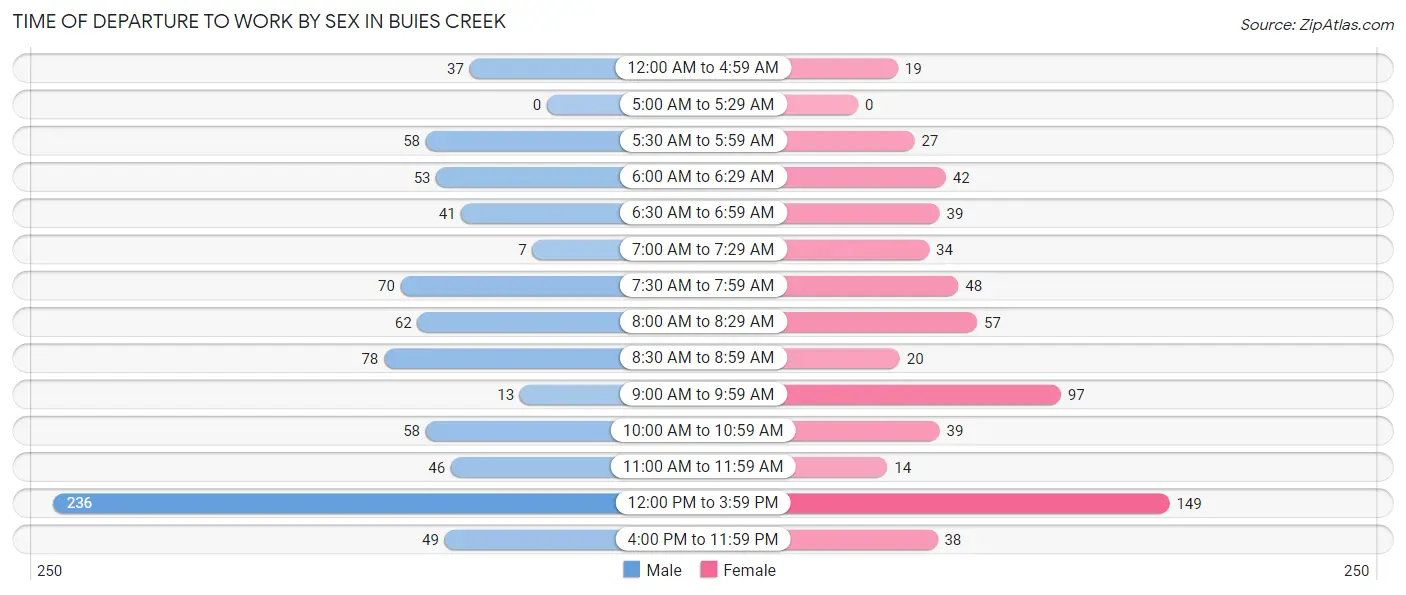
| Time of Departure | Male | Female |
| 12:00 AM to 4:59 AM | 37 (4.6%) | 19 (3.0%) |
| 5:00 AM to 5:29 AM | 0 (0.0%) | 0 (0.0%) |
| 5:30 AM to 5:59 AM | 58 (7.2%) | 27 (4.3%) |
| 6:00 AM to 6:29 AM | 53 (6.6%) | 42 (6.7%) |
| 6:30 AM to 6:59 AM | 41 (5.1%) | 39 (6.3%) |
| 7:00 AM to 7:29 AM | 7 (0.9%) | 34 (5.5%) |
| 7:30 AM to 7:59 AM | 70 (8.7%) | 48 (7.7%) |
| 8:00 AM to 8:29 AM | 62 (7.7%) | 57 (9.1%) |
| 8:30 AM to 8:59 AM | 78 (9.7%) | 20 (3.2%) |
| 9:00 AM to 9:59 AM | 13 (1.6%) | 97 (15.6%) |
| 10:00 AM to 10:59 AM | 58 (7.2%) | 39 (6.3%) |
| 11:00 AM to 11:59 AM | 46 (5.7%) | 14 (2.2%) |
| 12:00 PM to 3:59 PM | 236 (29.2%) | 149 (23.9%) |
| 4:00 PM to 11:59 PM | 49 (6.1%) | 38 (6.1%) |
| Total | 808 (100.0%) | 623 (100.0%) |
Housing Occupancy in Buies Creek
Occupancy by Ownership in Buies Creek
Of the total 987 dwellings in Buies Creek, owner-occupied units account for 331 (33.5%), while renter-occupied units make up 656 (66.5%).
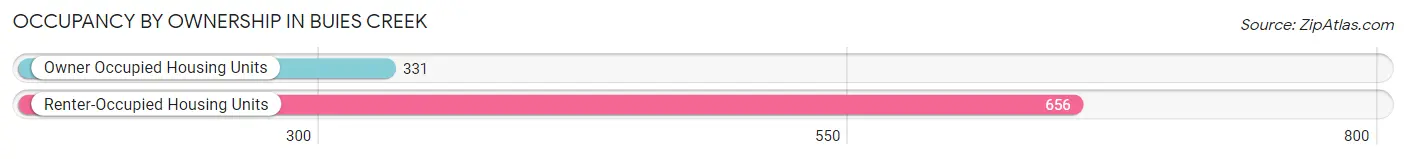
| Occupancy | # Housing Units | % Housing Units |
| Owner Occupied Housing Units | 331 | 33.5% |
| Renter-Occupied Housing Units | 656 | 66.5% |
| Total Occupied Housing Units | 987 | 100.0% |
Occupancy by Household Size in Buies Creek
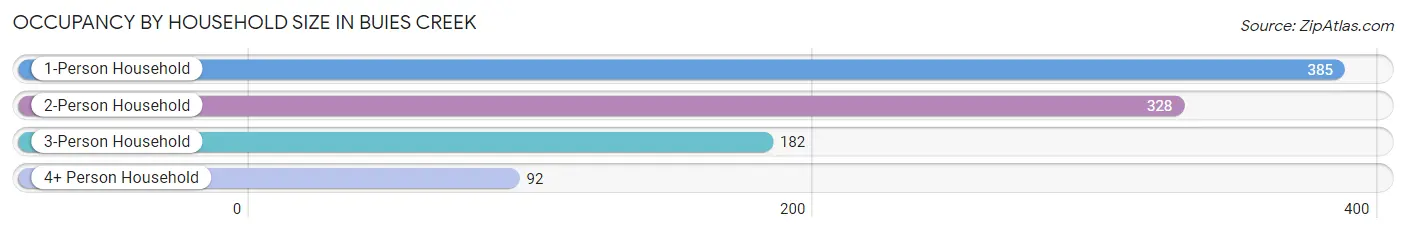
| Household Size | # Housing Units | % Housing Units |
| 1-Person Household | 385 | 39.0% |
| 2-Person Household | 328 | 33.2% |
| 3-Person Household | 182 | 18.4% |
| 4+ Person Household | 92 | 9.3% |
| Total Housing Units | 987 | 100.0% |
Occupancy by Ownership by Household Size in Buies Creek
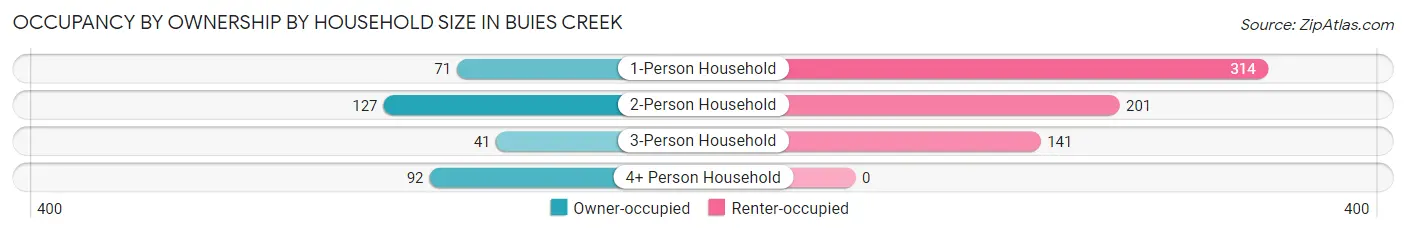
| Household Size | Owner-occupied | Renter-occupied |
| 1-Person Household | 71 (18.4%) | 314 (81.6%) |
| 2-Person Household | 127 (38.7%) | 201 (61.3%) |
| 3-Person Household | 41 (22.5%) | 141 (77.5%) |
| 4+ Person Household | 92 (100.0%) | 0 (0.0%) |
| Total Housing Units | 331 (33.5%) | 656 (66.5%) |
Occupancy by Educational Attainment in Buies Creek
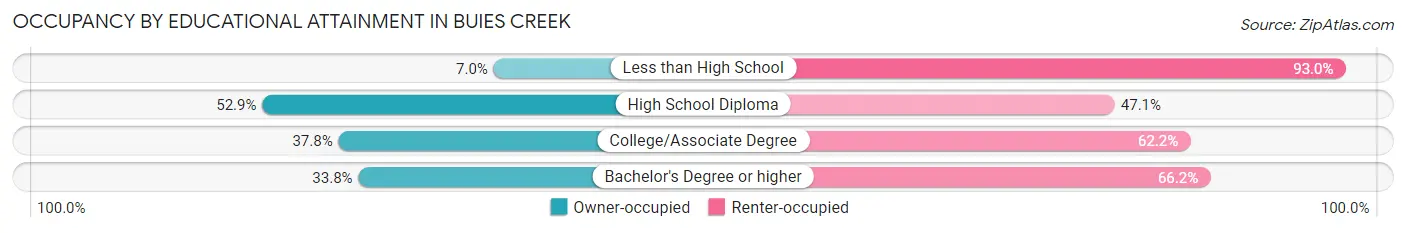
| Household Size | Owner-occupied | Renter-occupied |
| Less than High School | 7 (7.0%) | 93 (93.0%) |
| High School Diploma | 46 (52.9%) | 41 (47.1%) |
| College/Associate Degree | 71 (37.8%) | 117 (62.2%) |
| Bachelor's Degree or higher | 207 (33.8%) | 405 (66.2%) |
Occupancy by Age of Householder in Buies Creek
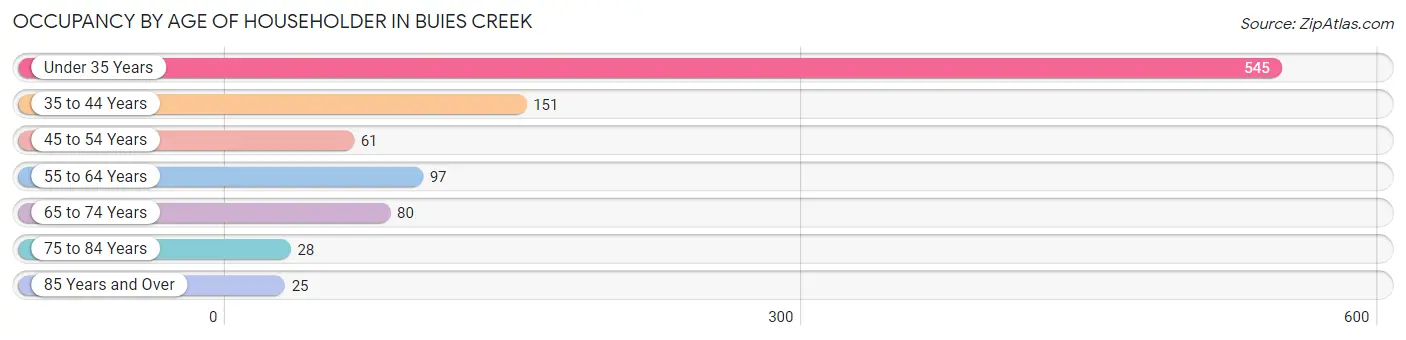
| Age Bracket | # Households | % Households |
| Under 35 Years | 545 | 55.2% |
| 35 to 44 Years | 151 | 15.3% |
| 45 to 54 Years | 61 | 6.2% |
| 55 to 64 Years | 97 | 9.8% |
| 65 to 74 Years | 80 | 8.1% |
| 75 to 84 Years | 28 | 2.8% |
| 85 Years and Over | 25 | 2.5% |
| Total | 987 | 100.0% |
Housing Finances in Buies Creek
Median Income by Occupancy in Buies Creek
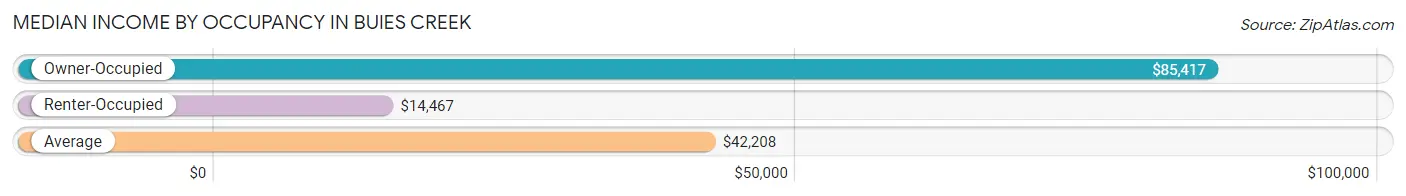
| Occupancy Type | # Households | Median Income |
| Owner-Occupied | 331 (33.5%) | $85,417 |
| Renter-Occupied | 656 (66.5%) | $14,467 |
| Average | 987 (100.0%) | $42,208 |
Occupancy by Householder Income Bracket in Buies Creek
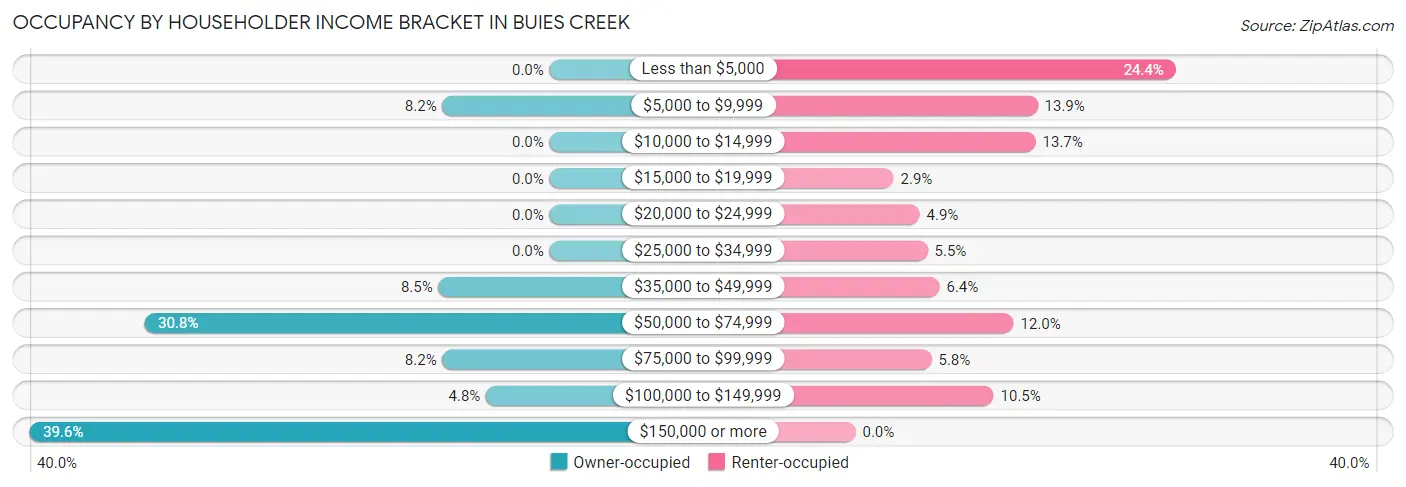
| Income Bracket | Owner-occupied | Renter-occupied |
| Less than $5,000 | 0 (0.0%) | 160 (24.4%) |
| $5,000 to $9,999 | 27 (8.2%) | 91 (13.9%) |
| $10,000 to $14,999 | 0 (0.0%) | 90 (13.7%) |
| $15,000 to $19,999 | 0 (0.0%) | 19 (2.9%) |
| $20,000 to $24,999 | 0 (0.0%) | 32 (4.9%) |
| $25,000 to $34,999 | 0 (0.0%) | 36 (5.5%) |
| $35,000 to $49,999 | 28 (8.5%) | 42 (6.4%) |
| $50,000 to $74,999 | 102 (30.8%) | 79 (12.0%) |
| $75,000 to $99,999 | 27 (8.2%) | 38 (5.8%) |
| $100,000 to $149,999 | 16 (4.8%) | 69 (10.5%) |
| $150,000 or more | 131 (39.6%) | 0 (0.0%) |
| Total | 331 (100.0%) | 656 (100.0%) |
Monthly Housing Cost Tiers in Buies Creek
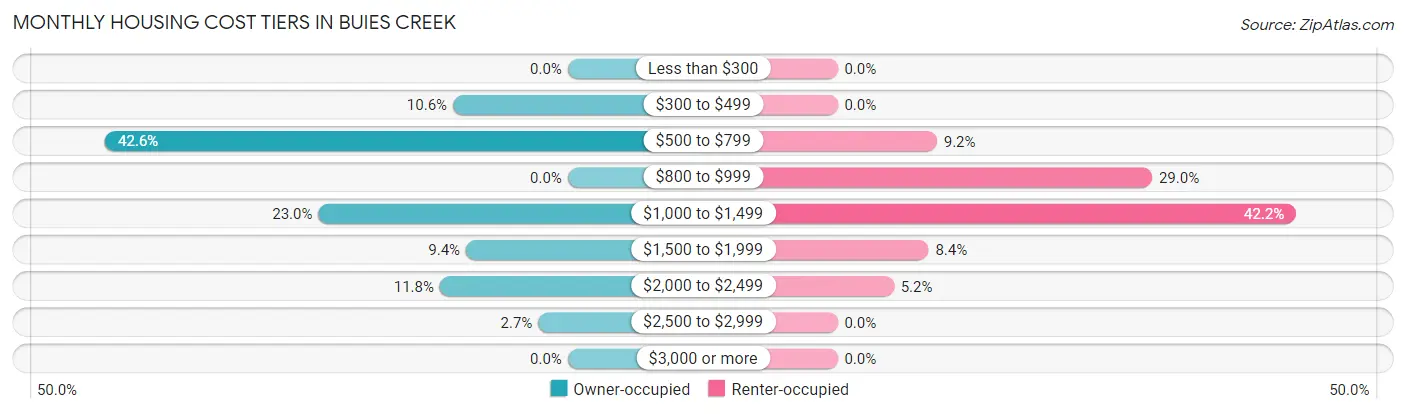
| Monthly Cost | Owner-occupied | Renter-occupied |
| Less than $300 | 0 (0.0%) | 0 (0.0%) |
| $300 to $499 | 35 (10.6%) | 0 (0.0%) |
| $500 to $799 | 141 (42.6%) | 60 (9.1%) |
| $800 to $999 | 0 (0.0%) | 190 (29.0%) |
| $1,000 to $1,499 | 76 (23.0%) | 277 (42.2%) |
| $1,500 to $1,999 | 31 (9.4%) | 55 (8.4%) |
| $2,000 to $2,499 | 39 (11.8%) | 34 (5.2%) |
| $2,500 to $2,999 | 9 (2.7%) | 0 (0.0%) |
| $3,000 or more | 0 (0.0%) | 0 (0.0%) |
| Total | 331 (100.0%) | 656 (100.0%) |
Physical Housing Characteristics in Buies Creek
Housing Structures in Buies Creek
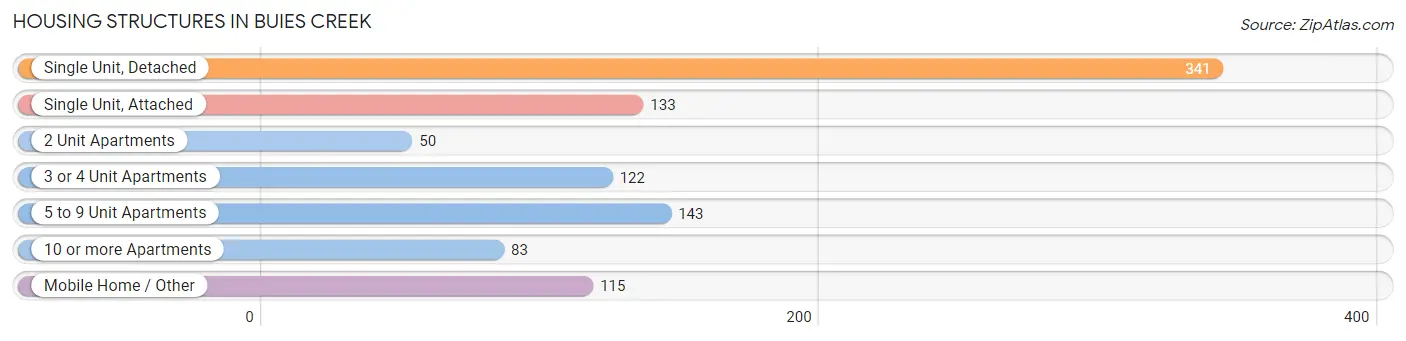
| Structure Type | # Housing Units | % Housing Units |
| Single Unit, Detached | 341 | 34.5% |
| Single Unit, Attached | 133 | 13.5% |
| 2 Unit Apartments | 50 | 5.1% |
| 3 or 4 Unit Apartments | 122 | 12.4% |
| 5 to 9 Unit Apartments | 143 | 14.5% |
| 10 or more Apartments | 83 | 8.4% |
| Mobile Home / Other | 115 | 11.7% |
| Total | 987 | 100.0% |
Housing Structures by Occupancy in Buies Creek
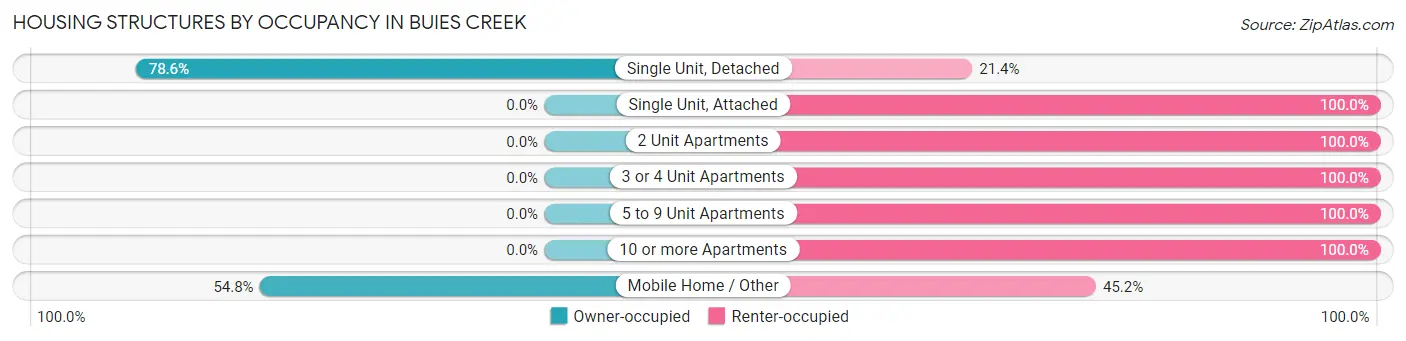
| Structure Type | Owner-occupied | Renter-occupied |
| Single Unit, Detached | 268 (78.6%) | 73 (21.4%) |
| Single Unit, Attached | 0 (0.0%) | 133 (100.0%) |
| 2 Unit Apartments | 0 (0.0%) | 50 (100.0%) |
| 3 or 4 Unit Apartments | 0 (0.0%) | 122 (100.0%) |
| 5 to 9 Unit Apartments | 0 (0.0%) | 143 (100.0%) |
| 10 or more Apartments | 0 (0.0%) | 83 (100.0%) |
| Mobile Home / Other | 63 (54.8%) | 52 (45.2%) |
| Total | 331 (33.5%) | 656 (66.5%) |
Housing Structures by Number of Rooms in Buies Creek
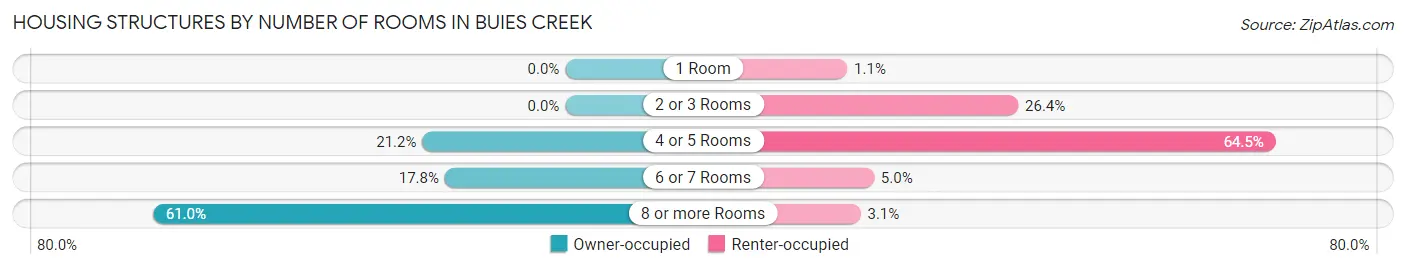
| Number of Rooms | Owner-occupied | Renter-occupied |
| 1 Room | 0 (0.0%) | 7 (1.1%) |
| 2 or 3 Rooms | 0 (0.0%) | 173 (26.4%) |
| 4 or 5 Rooms | 70 (21.1%) | 423 (64.5%) |
| 6 or 7 Rooms | 59 (17.8%) | 33 (5.0%) |
| 8 or more Rooms | 202 (61.0%) | 20 (3.0%) |
| Total | 331 (100.0%) | 656 (100.0%) |
Housing Structure by Heating Type in Buies Creek
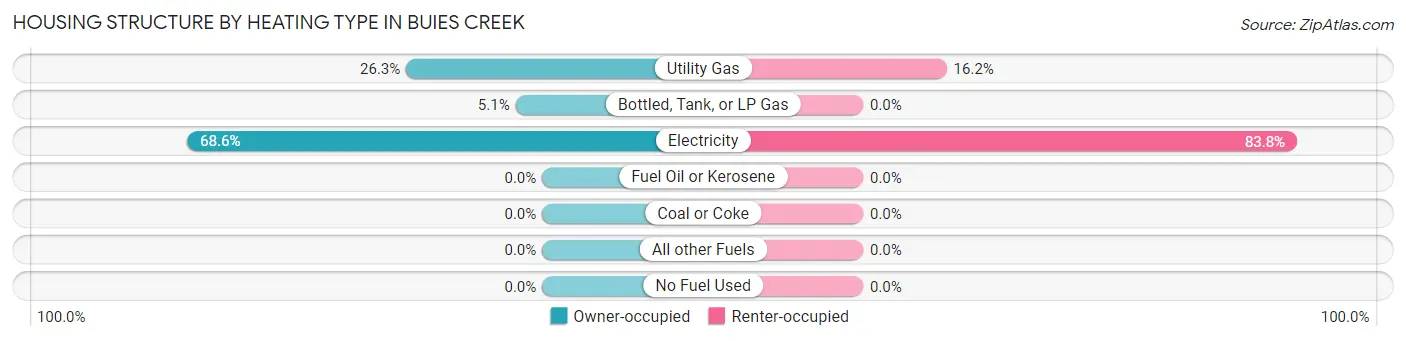
| Heating Type | Owner-occupied | Renter-occupied |
| Utility Gas | 87 (26.3%) | 106 (16.2%) |
| Bottled, Tank, or LP Gas | 17 (5.1%) | 0 (0.0%) |
| Electricity | 227 (68.6%) | 550 (83.8%) |
| Fuel Oil or Kerosene | 0 (0.0%) | 0 (0.0%) |
| Coal or Coke | 0 (0.0%) | 0 (0.0%) |
| All other Fuels | 0 (0.0%) | 0 (0.0%) |
| No Fuel Used | 0 (0.0%) | 0 (0.0%) |
| Total | 331 (100.0%) | 656 (100.0%) |
Household Vehicle Usage in Buies Creek
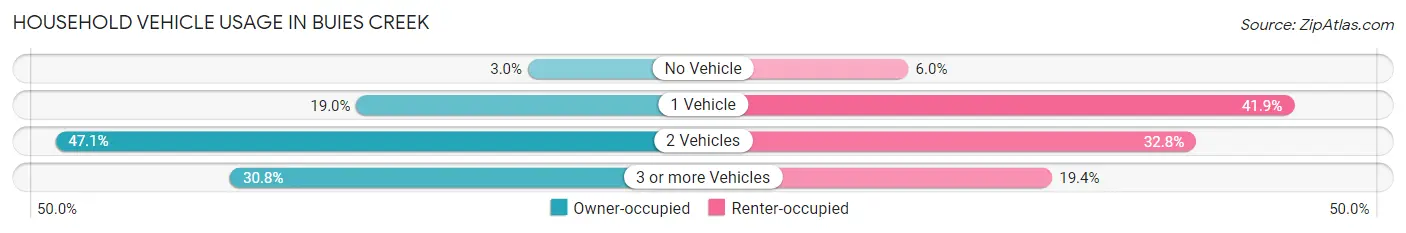
| Vehicles per Household | Owner-occupied | Renter-occupied |
| No Vehicle | 10 (3.0%) | 39 (5.9%) |
| 1 Vehicle | 63 (19.0%) | 275 (41.9%) |
| 2 Vehicles | 156 (47.1%) | 215 (32.8%) |
| 3 or more Vehicles | 102 (30.8%) | 127 (19.4%) |
| Total | 331 (100.0%) | 656 (100.0%) |
Real Estate & Mortgages in Buies Creek
Real Estate and Mortgage Overview in Buies Creek
| Characteristic | Without Mortgage | With Mortgage |
| Housing Units | 168 | 163 |
| Median Property Value | - | - |
| Median Household Income | $57,786 | $95 |
| Monthly Housing Costs | $565 | $0 |
| Real Estate Taxes | - | - |
Property Value by Mortgage Status in Buies Creek
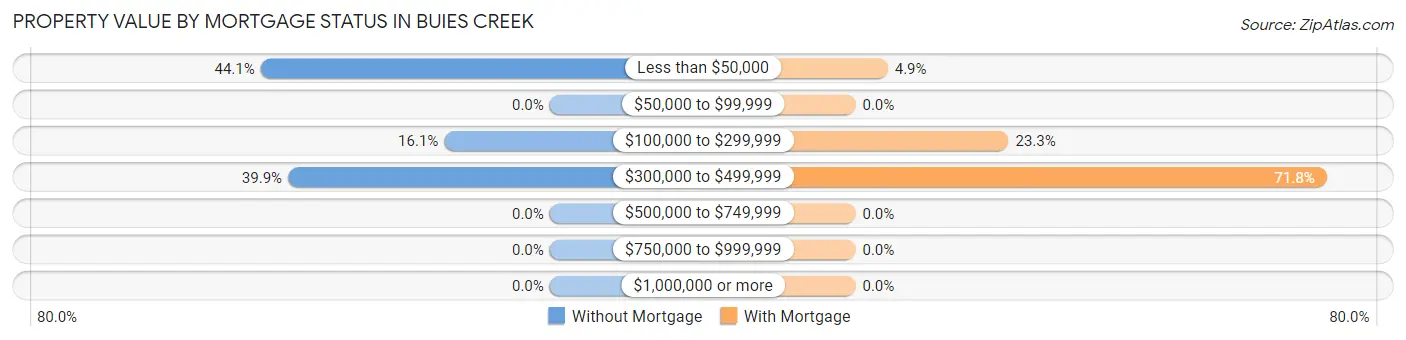
| Property Value | Without Mortgage | With Mortgage |
| Less than $50,000 | 74 (44.1%) | 8 (4.9%) |
| $50,000 to $99,999 | 0 (0.0%) | 0 (0.0%) |
| $100,000 to $299,999 | 27 (16.1%) | 38 (23.3%) |
| $300,000 to $499,999 | 67 (39.9%) | 117 (71.8%) |
| $500,000 to $749,999 | 0 (0.0%) | 0 (0.0%) |
| $750,000 to $999,999 | 0 (0.0%) | 0 (0.0%) |
| $1,000,000 or more | 0 (0.0%) | 0 (0.0%) |
| Total | 168 (100.0%) | 163 (100.0%) |
Household Income by Mortgage Status in Buies Creek
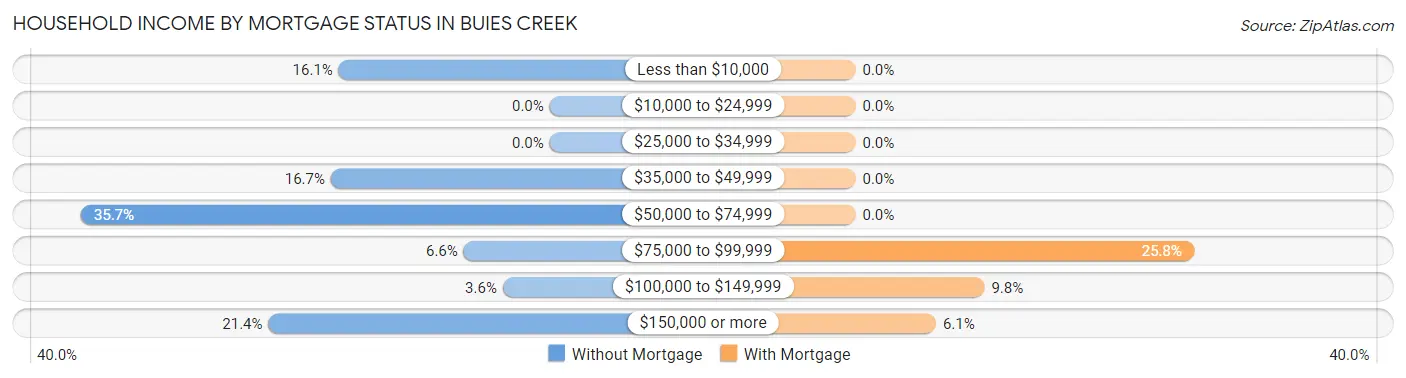
| Household Income | Without Mortgage | With Mortgage |
| Less than $10,000 | 27 (16.1%) | 0 (0.0%) |
| $10,000 to $24,999 | 0 (0.0%) | 0 (0.0%) |
| $25,000 to $34,999 | 0 (0.0%) | 0 (0.0%) |
| $35,000 to $49,999 | 28 (16.7%) | 0 (0.0%) |
| $50,000 to $74,999 | 60 (35.7%) | 0 (0.0%) |
| $75,000 to $99,999 | 11 (6.6%) | 42 (25.8%) |
| $100,000 to $149,999 | 6 (3.6%) | 16 (9.8%) |
| $150,000 or more | 36 (21.4%) | 10 (6.1%) |
| Total | 168 (100.0%) | 163 (100.0%) |
Property Value to Household Income Ratio in Buies Creek
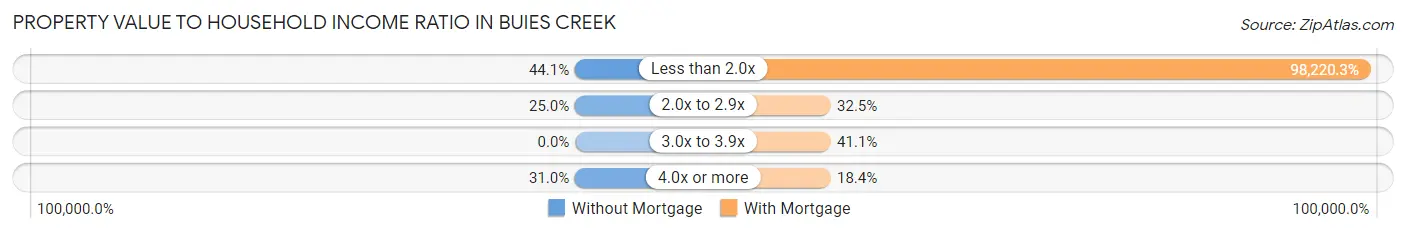
| Value-to-Income Ratio | Without Mortgage | With Mortgage |
| Less than 2.0x | 74 (44.1%) | 160,099 (98,220.2%) |
| 2.0x to 2.9x | 42 (25.0%) | 53 (32.5%) |
| 3.0x to 3.9x | 0 (0.0%) | 67 (41.1%) |
| 4.0x or more | 52 (30.9%) | 30 (18.4%) |
| Total | 168 (100.0%) | 163 (100.0%) |
Real Estate Taxes by Mortgage Status in Buies Creek
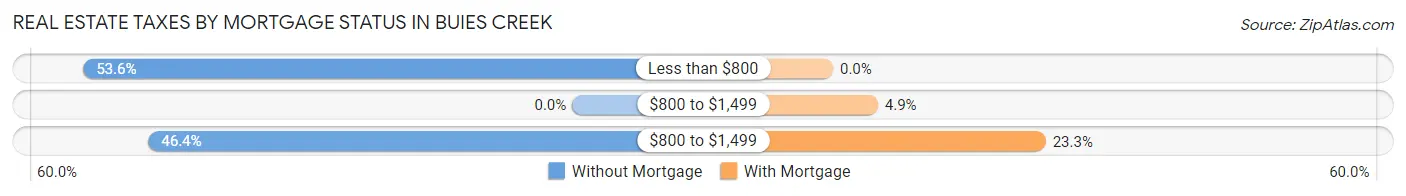
| Property Taxes | Without Mortgage | With Mortgage |
| Less than $800 | 90 (53.6%) | 0 (0.0%) |
| $800 to $1,499 | 0 (0.0%) | 8 (4.9%) |
| $800 to $1,499 | 78 (46.4%) | 38 (23.3%) |
| Total | 168 (100.0%) | 163 (100.0%) |
Health & Disability in Buies Creek
Health Insurance Coverage by Age in Buies Creek
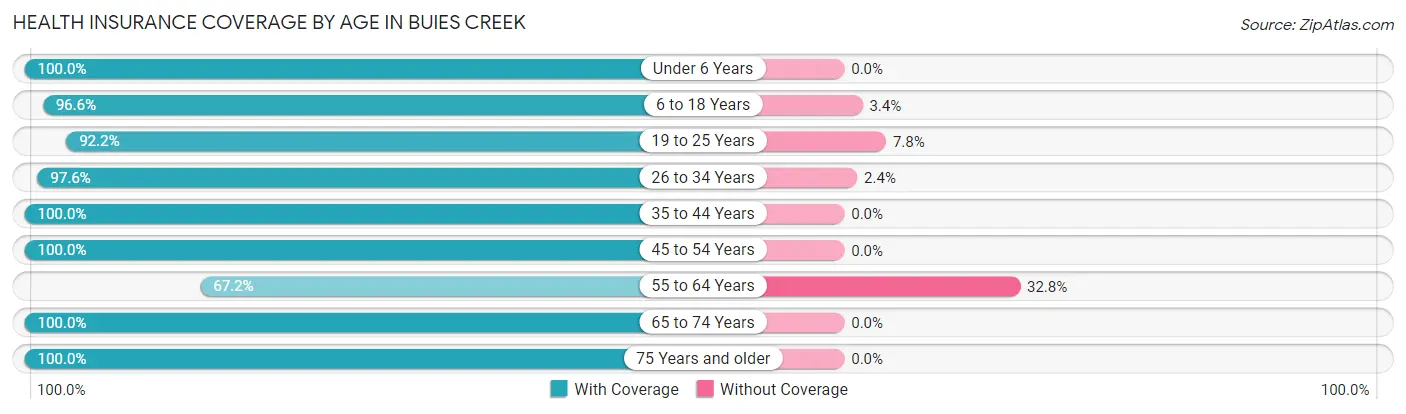
| Age Bracket | With Coverage | Without Coverage |
| Under 6 Years | 91 (100.0%) | 0 (0.0%) |
| 6 to 18 Years | 656 (96.6%) | 23 (3.4%) |
| 19 to 25 Years | 1,578 (92.2%) | 133 (7.8%) |
| 26 to 34 Years | 325 (97.6%) | 8 (2.4%) |
| 35 to 44 Years | 218 (100.0%) | 0 (0.0%) |
| 45 to 54 Years | 159 (100.0%) | 0 (0.0%) |
| 55 to 64 Years | 119 (67.2%) | 58 (32.8%) |
| 65 to 74 Years | 129 (100.0%) | 0 (0.0%) |
| 75 Years and older | 92 (100.0%) | 0 (0.0%) |
| Total | 3,367 (93.8%) | 222 (6.2%) |
Health Insurance Coverage by Citizenship Status in Buies Creek
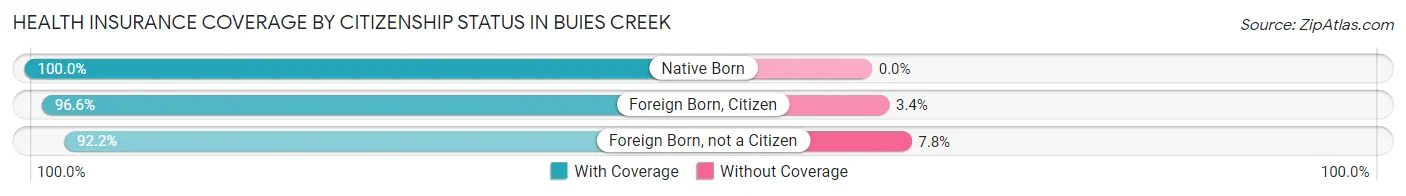
| Citizenship Status | With Coverage | Without Coverage |
| Native Born | 91 (100.0%) | 0 (0.0%) |
| Foreign Born, Citizen | 656 (96.6%) | 23 (3.4%) |
| Foreign Born, not a Citizen | 1,578 (92.2%) | 133 (7.8%) |
Health Insurance Coverage by Household Income in Buies Creek
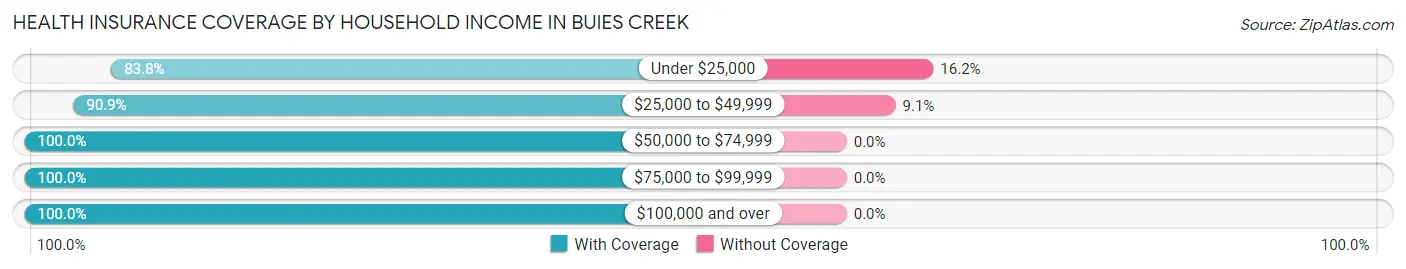
| Household Income | With Coverage | Without Coverage |
| Under $25,000 | 795 (83.8%) | 154 (16.2%) |
| $25,000 to $49,999 | 159 (90.9%) | 16 (9.1%) |
| $50,000 to $74,999 | 384 (100.0%) | 0 (0.0%) |
| $75,000 to $99,999 | 168 (100.0%) | 0 (0.0%) |
| $100,000 and over | 523 (100.0%) | 0 (0.0%) |
Public vs Private Health Insurance Coverage by Age in Buies Creek
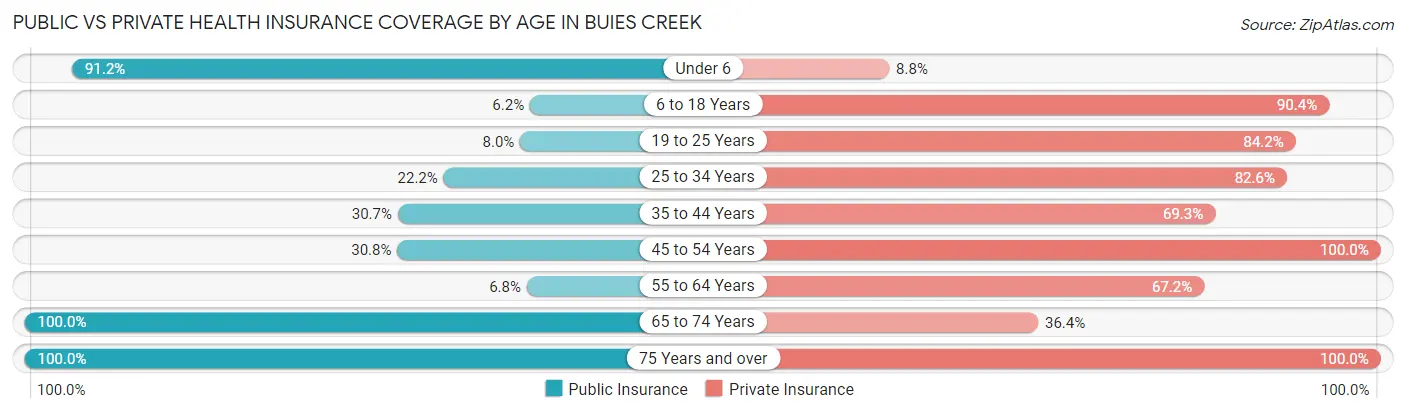
| Age Bracket | Public Insurance | Private Insurance |
| Under 6 | 83 (91.2%) | 8 (8.8%) |
| 6 to 18 Years | 42 (6.2%) | 614 (90.4%) |
| 19 to 25 Years | 137 (8.0%) | 1,441 (84.2%) |
| 25 to 34 Years | 74 (22.2%) | 275 (82.6%) |
| 35 to 44 Years | 67 (30.7%) | 151 (69.3%) |
| 45 to 54 Years | 49 (30.8%) | 159 (100.0%) |
| 55 to 64 Years | 12 (6.8%) | 119 (67.2%) |
| 65 to 74 Years | 129 (100.0%) | 47 (36.4%) |
| 75 Years and over | 92 (100.0%) | 92 (100.0%) |
| Total | 685 (19.1%) | 2,906 (81.0%) |
Disability Status by Sex by Age in Buies Creek
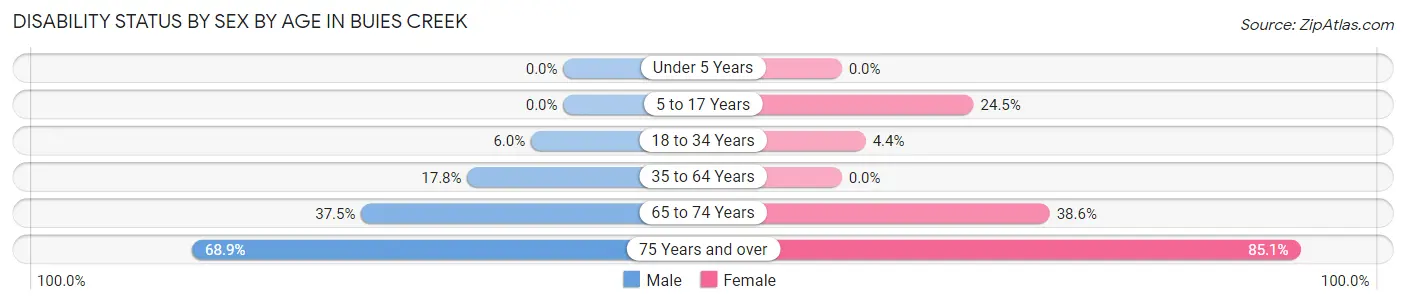
| Age Bracket | Male | Female |
| Under 5 Years | 0 (0.0%) | 0 (0.0%) |
| 5 to 17 Years | 0 (0.0%) | 23 (24.5%) |
| 18 to 34 Years | 77 (6.0%) | 58 (4.4%) |
| 35 to 64 Years | 59 (17.8%) | 0 (0.0%) |
| 65 to 74 Years | 27 (37.5%) | 22 (38.6%) |
| 75 Years and over | 31 (68.9%) | 40 (85.1%) |
Disability Class by Sex by Age in Buies Creek
Disability Class: Hearing Difficulty
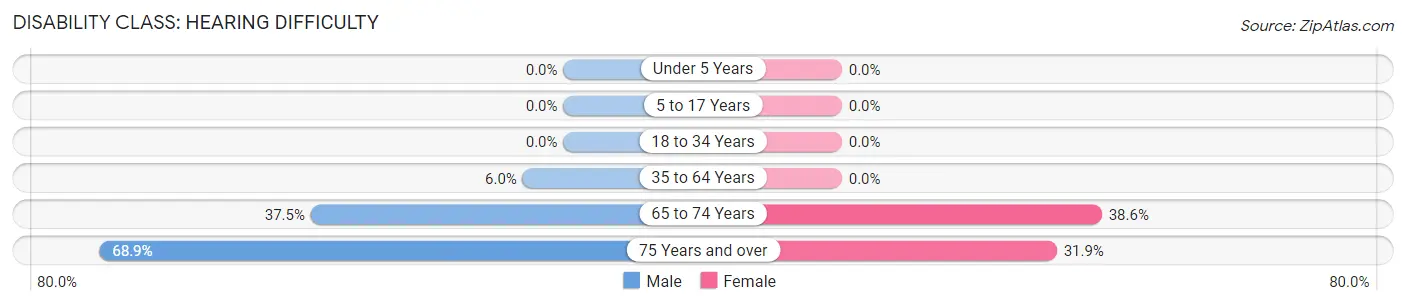
| Age Bracket | Male | Female |
| Under 5 Years | 0 (0.0%) | 0 (0.0%) |
| 5 to 17 Years | 0 (0.0%) | 0 (0.0%) |
| 18 to 34 Years | 0 (0.0%) | 0 (0.0%) |
| 35 to 64 Years | 20 (6.0%) | 0 (0.0%) |
| 65 to 74 Years | 27 (37.5%) | 22 (38.6%) |
| 75 Years and over | 31 (68.9%) | 15 (31.9%) |
Disability Class: Vision Difficulty
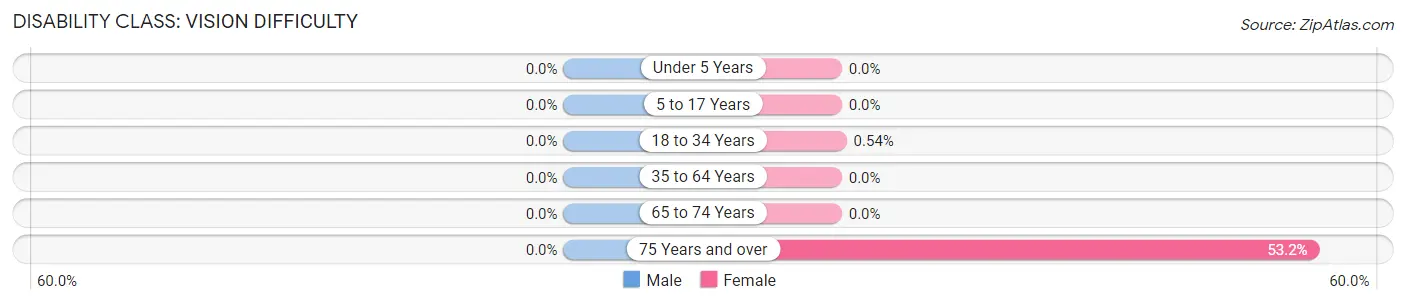
| Age Bracket | Male | Female |
| Under 5 Years | 0 (0.0%) | 0 (0.0%) |
| 5 to 17 Years | 0 (0.0%) | 0 (0.0%) |
| 18 to 34 Years | 0 (0.0%) | 7 (0.5%) |
| 35 to 64 Years | 0 (0.0%) | 0 (0.0%) |
| 65 to 74 Years | 0 (0.0%) | 0 (0.0%) |
| 75 Years and over | 0 (0.0%) | 25 (53.2%) |
Disability Class: Cognitive Difficulty
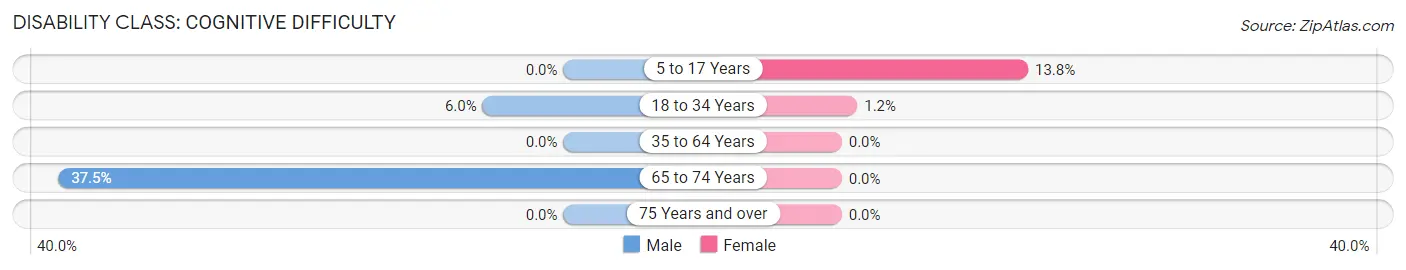
| Age Bracket | Male | Female |
| 5 to 17 Years | 0 (0.0%) | 13 (13.8%) |
| 18 to 34 Years | 77 (6.0%) | 15 (1.1%) |
| 35 to 64 Years | 0 (0.0%) | 0 (0.0%) |
| 65 to 74 Years | 27 (37.5%) | 0 (0.0%) |
| 75 Years and over | 0 (0.0%) | 0 (0.0%) |
Disability Class: Ambulatory Difficulty
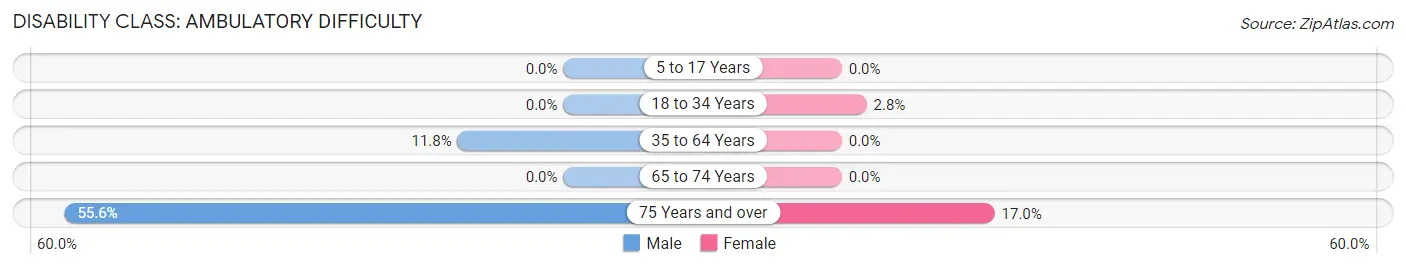
| Age Bracket | Male | Female |
| 5 to 17 Years | 0 (0.0%) | 0 (0.0%) |
| 18 to 34 Years | 0 (0.0%) | 36 (2.8%) |
| 35 to 64 Years | 39 (11.8%) | 0 (0.0%) |
| 65 to 74 Years | 0 (0.0%) | 0 (0.0%) |
| 75 Years and over | 25 (55.6%) | 8 (17.0%) |
Disability Class: Self-Care Difficulty
| Age Bracket | Male | Female |
| 5 to 17 Years | 0 (0.0%) | 0 (0.0%) |
| 18 to 34 Years | 0 (0.0%) | 0 (0.0%) |
| 35 to 64 Years | 0 (0.0%) | 0 (0.0%) |
| 65 to 74 Years | 0 (0.0%) | 0 (0.0%) |
| 75 Years and over | 0 (0.0%) | 0 (0.0%) |
Technology Access in Buies Creek
Computing Device Access in Buies Creek
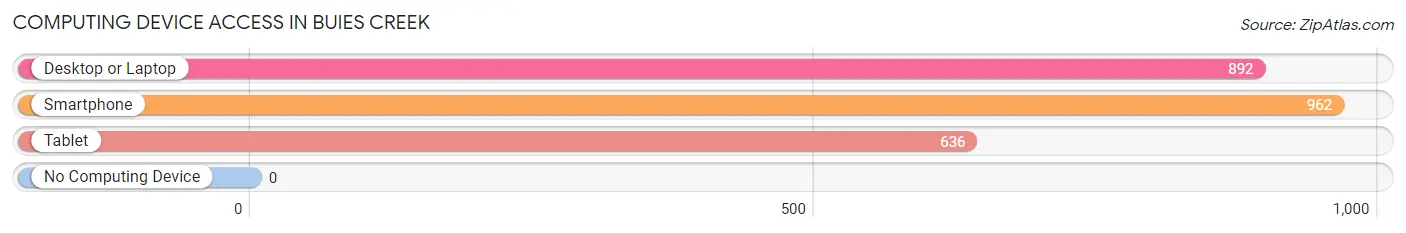
| Device Type | # Households | % Households |
| Desktop or Laptop | 892 | 90.4% |
| Smartphone | 962 | 97.5% |
| Tablet | 636 | 64.4% |
| No Computing Device | 0 | 0.0% |
| Total | 987 | 100.0% |
Internet Access in Buies Creek
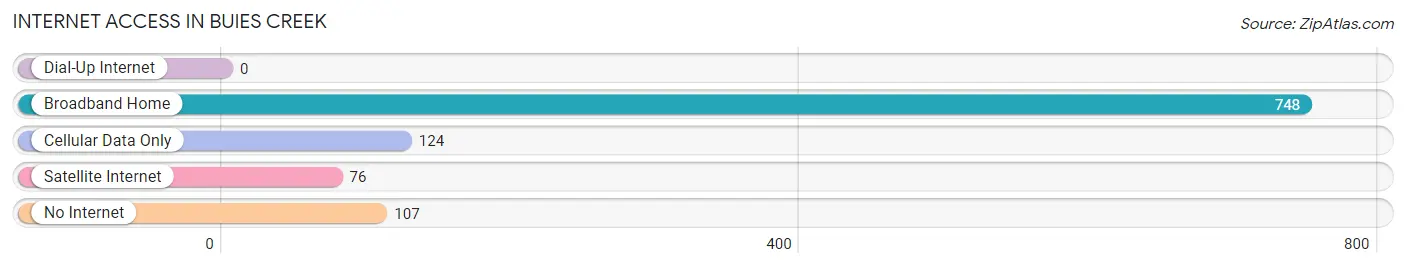
| Internet Type | # Households | % Households |
| Dial-Up Internet | 0 | 0.0% |
| Broadband Home | 748 | 75.8% |
| Cellular Data Only | 124 | 12.6% |
| Satellite Internet | 76 | 7.7% |
| No Internet | 107 | 10.8% |
| Total | 987 | 100.0% |
Buies Creek Summary
Buies Creek is a small unincorporated community located in Harnett County, North Carolina. It is situated in the heart of the Sandhills region of the state, approximately 25 miles south of Fayetteville and 40 miles north of Raleigh. The town is home to Campbell University, a private Baptist university founded in 1887.
History
The area that is now Buies Creek was originally inhabited by the Tuscarora Indians. The first European settlers arrived in the area in the late 1700s, and the town was officially established in 1887 when the Buies Creek Academy was founded. The academy was later renamed Campbell University in honor of its founder, James Archibald Campbell.
The town of Buies Creek was incorporated in 1901, and the population grew steadily throughout the 20th century. The town was home to several businesses, including a cotton mill, a sawmill, and a gristmill. The town also had a post office, a bank, and a general store.
Geography
Buies Creek is located in the Sandhills region of North Carolina, approximately 25 miles south of Fayetteville and 40 miles north of Raleigh. The town is situated in the Cape Fear River basin, and is surrounded by rolling hills and forests. The town is located at an elevation of approximately 200 feet above sea level.
The climate in Buies Creek is humid subtropical, with hot, humid summers and mild winters. The average annual temperature is around 70 degrees Fahrenheit, and the average annual precipitation is around 45 inches.
Economy
The economy of Buies Creek is largely driven by Campbell University, which is the town’s largest employer. The university employs over 1,000 people, and provides a variety of services to the community, including healthcare, education, and research.
In addition to the university, Buies Creek is home to several small businesses, including restaurants, retail stores, and professional services. The town is also home to a number of agricultural operations, including farms, nurseries, and greenhouses.
Demographics
As of the 2010 census, the population of Buies Creek was 1,845. The racial makeup of the town was 79.3% White, 15.2% African American, 0.7% Native American, 1.2% Asian, and 3.6% from other races. The median household income was $37,917, and the median age was 33.
Conclusion
Buies Creek is a small unincorporated community located in Harnett County, North Carolina. It is situated in the heart of the Sandhills region of the state, and is home to Campbell University, a private Baptist university founded in 1887. The town’s economy is largely driven by the university, and the population is diverse, with a median age of 33 and a median household income of $37,917.
Common Questions
What is Per Capita Income in Buies Creek?
Per Capita income in Buies Creek is $18,595.
What is the Median Family Income in Buies Creek?
Median Family Income in Buies Creek is $93,636.
What is the Median Household income in Buies Creek?
Median Household Income in Buies Creek is $42,208.
What is Income or Wage Gap in Buies Creek?
Income or Wage Gap in Buies Creek is 34.7%.
Women in Buies Creek earn 65.3 cents for every dollar earned by a man.
What is Inequality or Gini Index in Buies Creek?
Inequality or Gini Index in Buies Creek is 0.57.
What is the Total Population of Buies Creek?
Total Population of Buies Creek is 3,589.
What is the Total Male Population of Buies Creek?
Total Male Population of Buies Creek is 1,842.
What is the Total Female Population of Buies Creek?
Total Female Population of Buies Creek is 1,747.
What is the Ratio of Males per 100 Females in Buies Creek?
There are 105.44 Males per 100 Females in Buies Creek.
What is the Ratio of Females per 100 Males in Buies Creek?
There are 94.84 Females per 100 Males in Buies Creek.
What is the Median Population Age in Buies Creek?
Median Population Age in Buies Creek is 21.4 Years.
What is the Average Family Size in Buies Creek
Average Family Size in Buies Creek is 2.6 People.
What is the Average Household Size in Buies Creek
Average Household Size in Buies Creek is 2.2 People.
How Large is the Labor Force in Buies Creek?
There are 1,569 People in the Labor Forcein in Buies Creek.
What is the Percentage of People in the Labor Force in Buies Creek?
46.0% of People are in the Labor Force in Buies Creek.
What is the Unemployment Rate in Buies Creek?
Unemployment Rate in Buies Creek is 1.4%.