Calypso, NC Map & Demographics
Calypso Map
Calypso Overview
$27,608
PER CAPITA INCOME
$70,250
AVG FAMILY INCOME
0.36
INEQUALITY / GINI INDEX
429
TOTAL POPULATION
221
MALE POPULATION
208
FEMALE POPULATION
106.25
MALES / 100 FEMALES
94.12
FEMALES / 100 MALES
28.7
MEDIAN AGE
2.1
AVG FAMILY SIZE
2.1
AVG HOUSEHOLD SIZE
272
LABOR FORCE [ PEOPLE ]
72.5%
PERCENT IN LABOR FORCE
7.4%
UNEMPLOYMENT RATE
Calypso Zip Codes
Calypso Area Codes
Income in Calypso
Income Overview in Calypso
| Characteristic | Number | Measure |
| Per Capita Income | 429 | $27,608 |
| Median Family Income | 143 | $70,250 |
| Mean Family Income | 143 | $61,834 |
| Median Household Income | 201 | $0 |
| Mean Household Income | 201 | $59,249 |
| Income Deficit | 143 | $0 |
| Wage / Income Gap (%) | 429 | 0.00% |
| Wage / Income Gap ($) | 429 | 100.00¢ per $1 |
| Gini / Inequality Index | 429 | 0.36 |
Earnings by Sex in Calypso
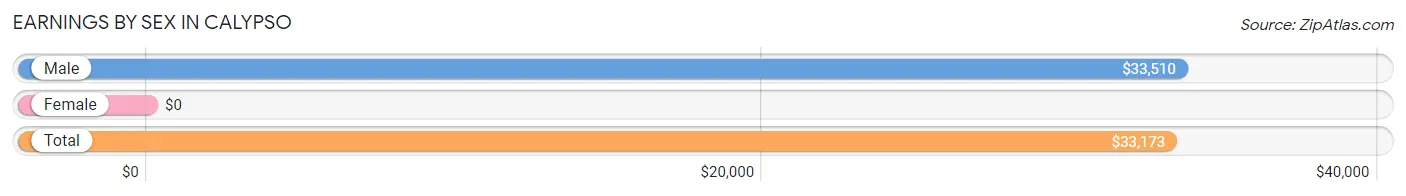
| Sex | Number | Average Earnings |
| Male | 156 (56.5%) | $33,510 |
| Female | 120 (43.5%) | $0 |
| Total | 276 (100.0%) | $33,173 |
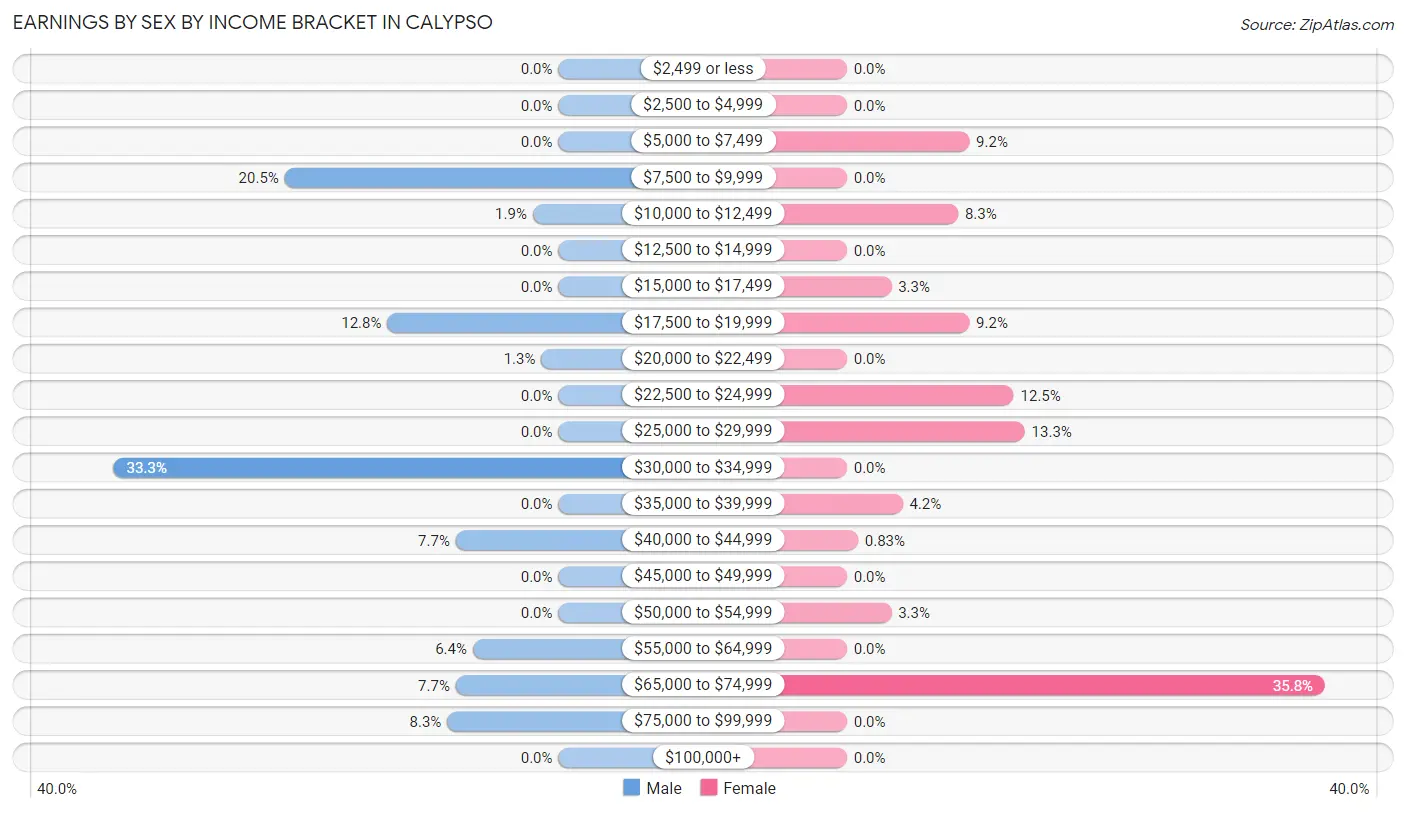
Earnings by Sex by Income Bracket in Calypso
The most common earnings brackets in Calypso are $30,000 to $34,999 for men (52 | 33.3%) and $65,000 to $74,999 for women (43 | 35.8%).
| Income | Male | Female |
| $2,499 or less | 0 (0.0%) | 0 (0.0%) |
| $2,500 to $4,999 | 0 (0.0%) | 0 (0.0%) |
| $5,000 to $7,499 | 0 (0.0%) | 11 (9.2%) |
| $7,500 to $9,999 | 32 (20.5%) | 0 (0.0%) |
| $10,000 to $12,499 | 3 (1.9%) | 10 (8.3%) |
| $12,500 to $14,999 | 0 (0.0%) | 0 (0.0%) |
| $15,000 to $17,499 | 0 (0.0%) | 4 (3.3%) |
| $17,500 to $19,999 | 20 (12.8%) | 11 (9.2%) |
| $20,000 to $22,499 | 2 (1.3%) | 0 (0.0%) |
| $22,500 to $24,999 | 0 (0.0%) | 15 (12.5%) |
| $25,000 to $29,999 | 0 (0.0%) | 16 (13.3%) |
| $30,000 to $34,999 | 52 (33.3%) | 0 (0.0%) |
| $35,000 to $39,999 | 0 (0.0%) | 5 (4.2%) |
| $40,000 to $44,999 | 12 (7.7%) | 1 (0.8%) |
| $45,000 to $49,999 | 0 (0.0%) | 0 (0.0%) |
| $50,000 to $54,999 | 0 (0.0%) | 4 (3.3%) |
| $55,000 to $64,999 | 10 (6.4%) | 0 (0.0%) |
| $65,000 to $74,999 | 12 (7.7%) | 43 (35.8%) |
| $75,000 to $99,999 | 13 (8.3%) | 0 (0.0%) |
| $100,000+ | 0 (0.0%) | 0 (0.0%) |
| Total | 156 (100.0%) | 120 (100.0%) |
Earnings by Sex by Educational Attainment in Calypso
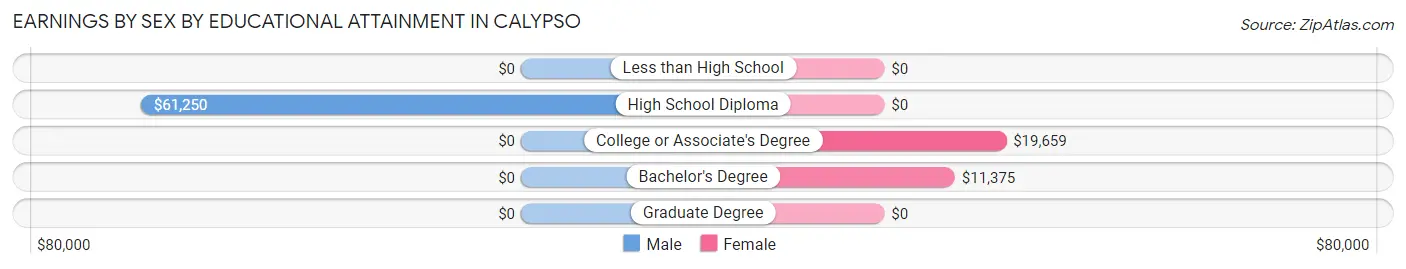
| Educational Attainment | Male Income | Female Income |
| Less than High School | - | - |
| High School Diploma | $61,250 | $0 |
| College or Associate's Degree | - | - |
| Bachelor's Degree | - | - |
| Graduate Degree | - | - |
| Total | - | - |
Family Income in Calypso
Family Income Brackets in Calypso
According to the Calypso family income data, there are 47 families falling into the $75,000 to $99,999 income range, which is the most common income bracket and makes up 32.9% of all families.
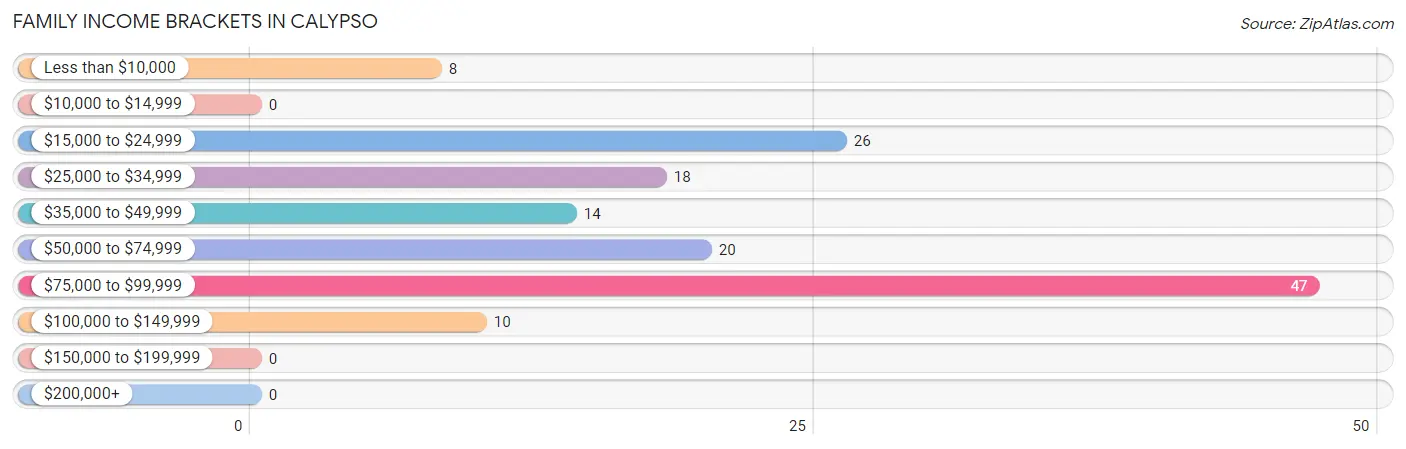
| Income Bracket | # Families | % Families |
| Less than $10,000 | 8 | 5.6% |
| $10,000 to $14,999 | 0 | 0.0% |
| $15,000 to $24,999 | 26 | 18.2% |
| $25,000 to $34,999 | 18 | 12.6% |
| $35,000 to $49,999 | 14 | 9.8% |
| $50,000 to $74,999 | 20 | 14.0% |
| $75,000 to $99,999 | 47 | 32.9% |
| $100,000 to $149,999 | 10 | 7.0% |
| $150,000 to $199,999 | 0 | 0.0% |
| $200,000+ | 0 | 0.0% |
Family Income by Famaliy Size in Calypso
2-person families (86 | 60.1%) account for the highest median family income in Calypso with $26,250 per family, while 2-person families (86 | 60.1%) have the highest median income of $13,125 per family member.
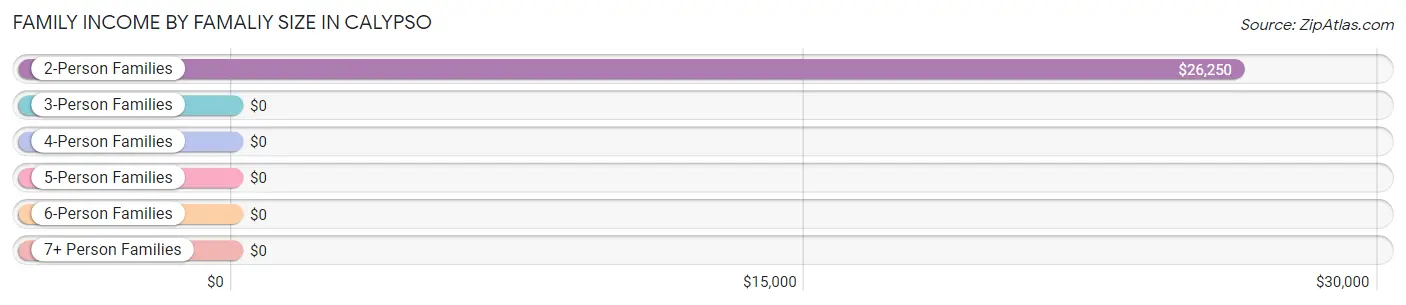
| Income Bracket | # Families | Median Income |
| 2-Person Families | 86 (60.1%) | $26,250 |
| 3-Person Families | 42 (29.4%) | $0 |
| 4-Person Families | 5 (3.5%) | $0 |
| 5-Person Families | 10 (7.0%) | $0 |
| 6-Person Families | 0 (0.0%) | $0 |
| 7+ Person Families | 0 (0.0%) | $0 |
| Total | 143 (100.0%) | $70,250 |
Family Income by Number of Earners in Calypso
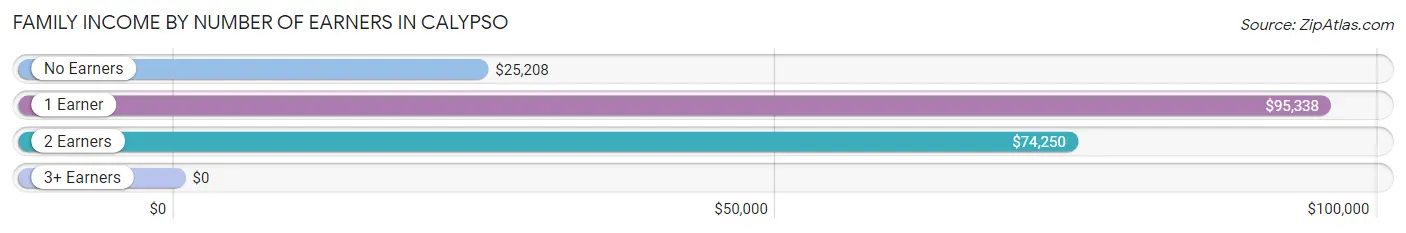
| Number of Earners | # Families | Median Income |
| No Earners | 33 (23.1%) | $25,208 |
| 1 Earner | 76 (53.1%) | $95,338 |
| 2 Earners | 34 (23.8%) | $74,250 |
| 3+ Earners | 0 (0.0%) | $0 |
| Total | 143 (100.0%) | $70,250 |
Household Income in Calypso
Household Income Brackets in Calypso
With 51 households falling in the category, the $75,000 to $99,999 income range is the most frequent in Calypso, accounting for 25.4% of all households.
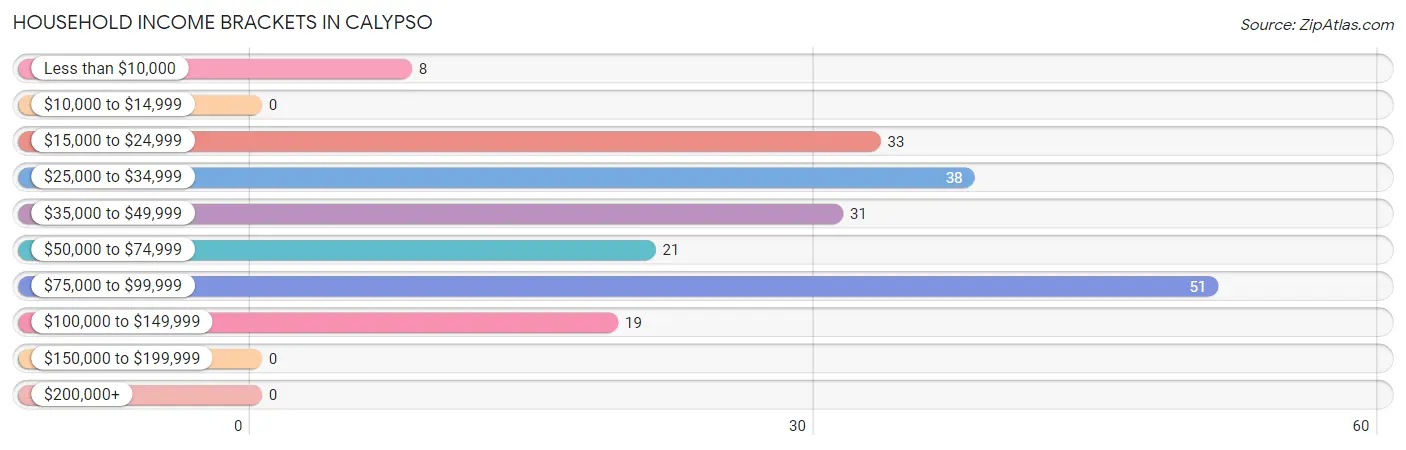
| Income Bracket | # Households | % Households |
| Less than $10,000 | 8 | 4.0% |
| $10,000 to $14,999 | 0 | 0.0% |
| $15,000 to $24,999 | 33 | 16.4% |
| $25,000 to $34,999 | 38 | 18.9% |
| $35,000 to $49,999 | 31 | 15.4% |
| $50,000 to $74,999 | 21 | 10.4% |
| $75,000 to $99,999 | 51 | 25.4% |
| $100,000 to $149,999 | 19 | 9.5% |
| $150,000 to $199,999 | 0 | 0.0% |
| $200,000+ | 0 | 0.0% |
Household Income by Householder Age in Calypso
The median household income in Calypso is $0, with the highest median household income of $66,750 found in the 45 to 64 years age bracket for the primary householder. A total of 37 households (18.4%) fall into this category. Meanwhile, the 15 to 24 years age bracket for the primary householder has the lowest median household income of $0, with 52 households (25.9%) in this group.
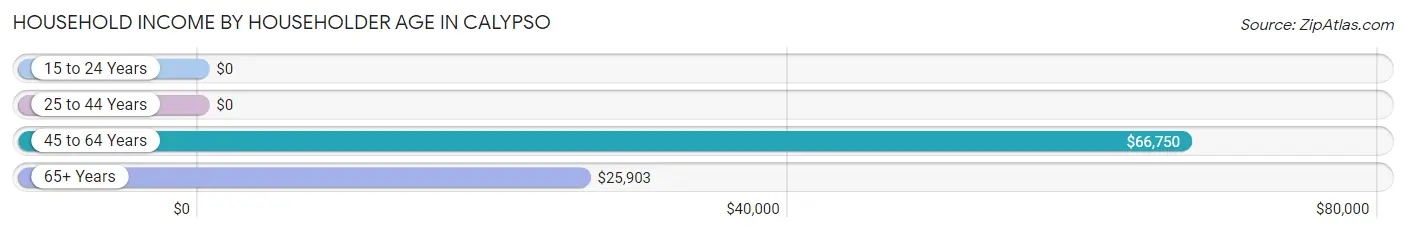
| Income Bracket | # Households | Median Income |
| 15 to 24 Years | 52 (25.9%) | $0 |
| 25 to 44 Years | 45 (22.4%) | $0 |
| 45 to 64 Years | 37 (18.4%) | $66,750 |
| 65+ Years | 67 (33.3%) | $25,903 |
| Total | 201 (100.0%) | $0 |
Poverty in Calypso
Income Below Poverty by Sex and Age in Calypso
With 17.2% poverty level for males and 13.9% for females among the residents of Calypso, under 5 year old males and 25 to 34 year old females are the most vulnerable to poverty, with 5 males (100.0%) and 19 females (65.5%) in their respective age groups living below the poverty level.
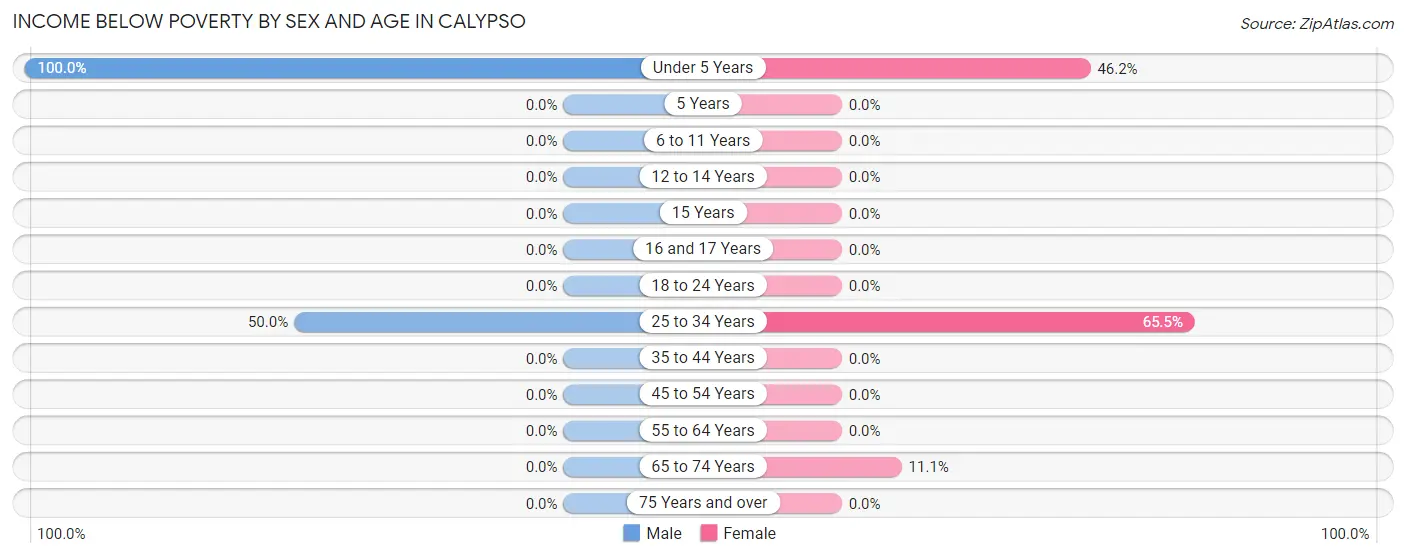
| Age Bracket | Male | Female |
| Under 5 Years | 5 (100.0%) | 6 (46.2%) |
| 5 Years | 0 (0.0%) | 0 (0.0%) |
| 6 to 11 Years | 0 (0.0%) | 0 (0.0%) |
| 12 to 14 Years | 0 (0.0%) | 0 (0.0%) |
| 15 Years | 0 (0.0%) | 0 (0.0%) |
| 16 and 17 Years | 0 (0.0%) | 0 (0.0%) |
| 18 to 24 Years | 0 (0.0%) | 0 (0.0%) |
| 25 to 34 Years | 32 (50.0%) | 19 (65.5%) |
| 35 to 44 Years | 0 (0.0%) | 0 (0.0%) |
| 45 to 54 Years | 0 (0.0%) | 0 (0.0%) |
| 55 to 64 Years | 0 (0.0%) | 0 (0.0%) |
| 65 to 74 Years | 0 (0.0%) | 4 (11.1%) |
| 75 Years and over | 0 (0.0%) | 0 (0.0%) |
| Total | 37 (17.2%) | 29 (13.9%) |
Income Above Poverty by Sex and Age in Calypso
According to the poverty statistics in Calypso, males aged 6 to 11 years and females aged 5 years are the age groups that are most secure financially, with 100.0% of males and 100.0% of females in these age groups living above the poverty line.
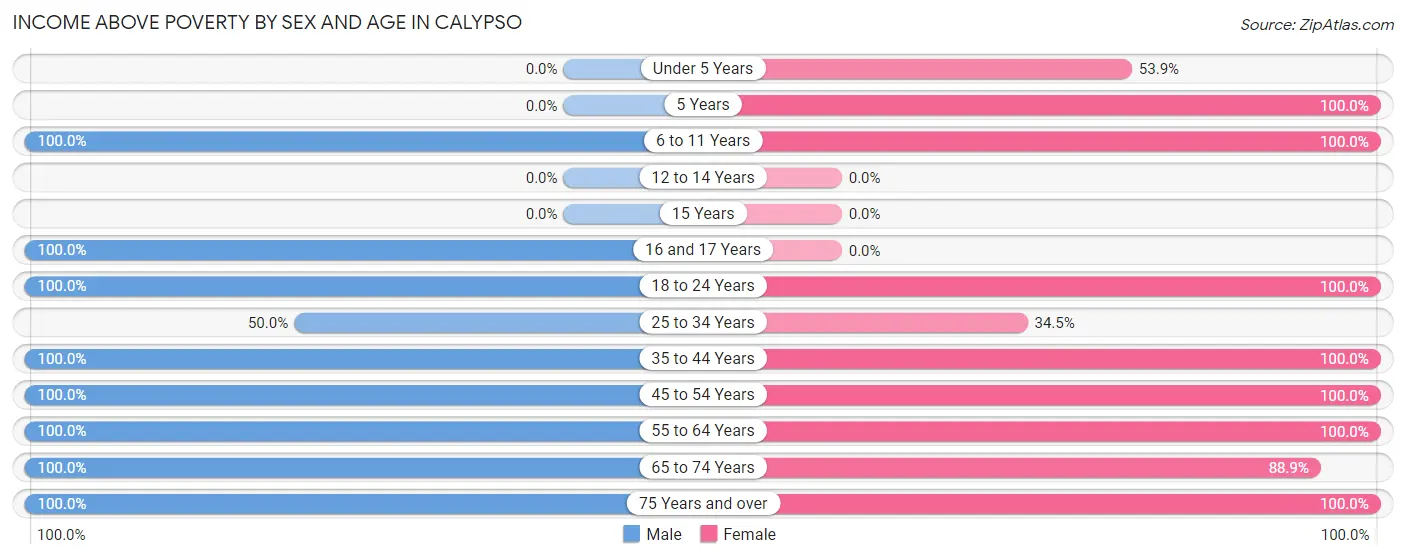
| Age Bracket | Male | Female |
| Under 5 Years | 0 (0.0%) | 7 (53.8%) |
| 5 Years | 0 (0.0%) | 12 (100.0%) |
| 6 to 11 Years | 14 (100.0%) | 4 (100.0%) |
| 12 to 14 Years | 0 (0.0%) | 0 (0.0%) |
| 15 Years | 0 (0.0%) | 0 (0.0%) |
| 16 and 17 Years | 6 (100.0%) | 0 (0.0%) |
| 18 to 24 Years | 42 (100.0%) | 52 (100.0%) |
| 25 to 34 Years | 32 (50.0%) | 10 (34.5%) |
| 35 to 44 Years | 14 (100.0%) | 8 (100.0%) |
| 45 to 54 Years | 19 (100.0%) | 15 (100.0%) |
| 55 to 64 Years | 18 (100.0%) | 6 (100.0%) |
| 65 to 74 Years | 12 (100.0%) | 32 (88.9%) |
| 75 Years and over | 21 (100.0%) | 33 (100.0%) |
| Total | 178 (82.8%) | 179 (86.1%) |
Income Below Poverty Among Married-Couple Families in Calypso
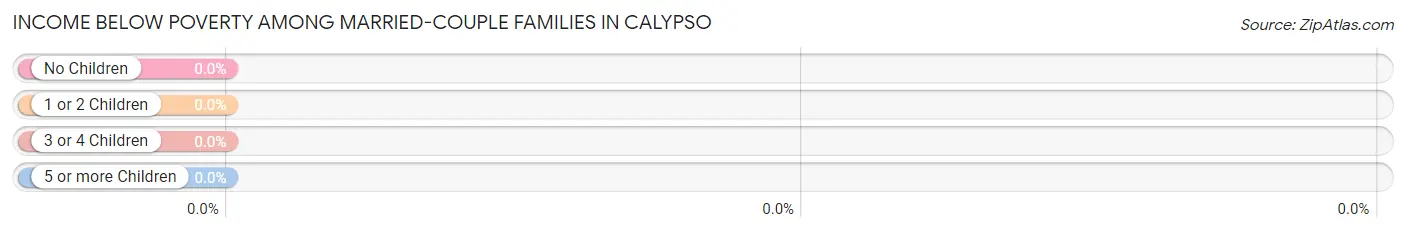
| Children | Above Poverty | Below Poverty |
| No Children | 46 (100.0%) | 0 (0.0%) |
| 1 or 2 Children | 10 (100.0%) | 0 (0.0%) |
| 3 or 4 Children | 10 (100.0%) | 0 (0.0%) |
| 5 or more Children | 0 (0.0%) | 0 (0.0%) |
| Total | 66 (100.0%) | 0 (0.0%) |
Income Below Poverty Among Single-Parent Households in Calypso
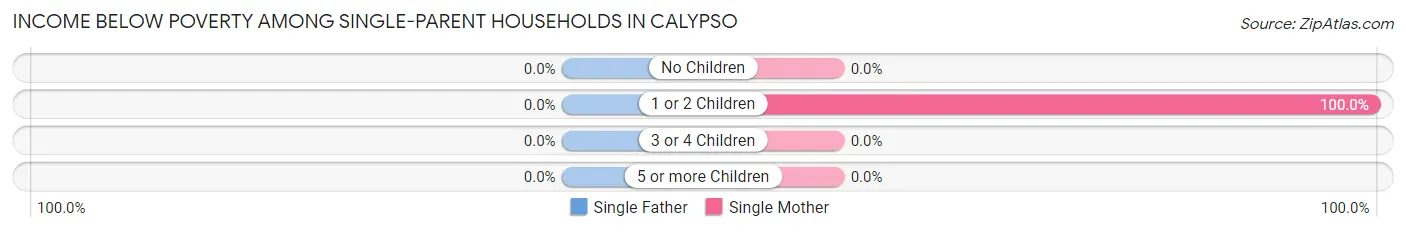
| Children | Single Father | Single Mother |
| No Children | 0 (0.0%) | 0 (0.0%) |
| 1 or 2 Children | 0 (0.0%) | 19 (100.0%) |
| 3 or 4 Children | 0 (0.0%) | 0 (0.0%) |
| 5 or more Children | 0 (0.0%) | 0 (0.0%) |
| Total | 0 (0.0%) | 19 (28.4%) |
Income Below Poverty Among Married-Couple vs Single-Parent Households in Calypso
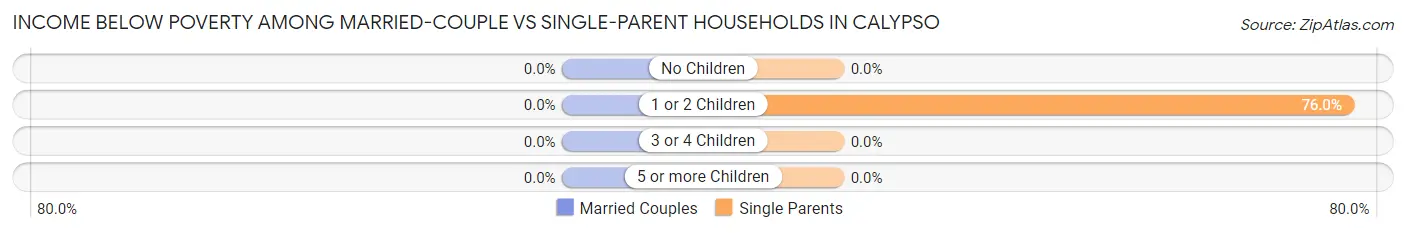
| Children | Married-Couple Families | Single-Parent Households |
| No Children | 0 (0.0%) | 0 (0.0%) |
| 1 or 2 Children | 0 (0.0%) | 19 (76.0%) |
| 3 or 4 Children | 0 (0.0%) | 0 (0.0%) |
| 5 or more Children | 0 (0.0%) | 0 (0.0%) |
| Total | 0 (0.0%) | 19 (24.7%) |
Race in Calypso
The most populous races in Calypso are White / Caucasian (242 | 56.4%), Black / African American (112 | 26.1%), and Hispanic or Latino (79 | 18.4%).
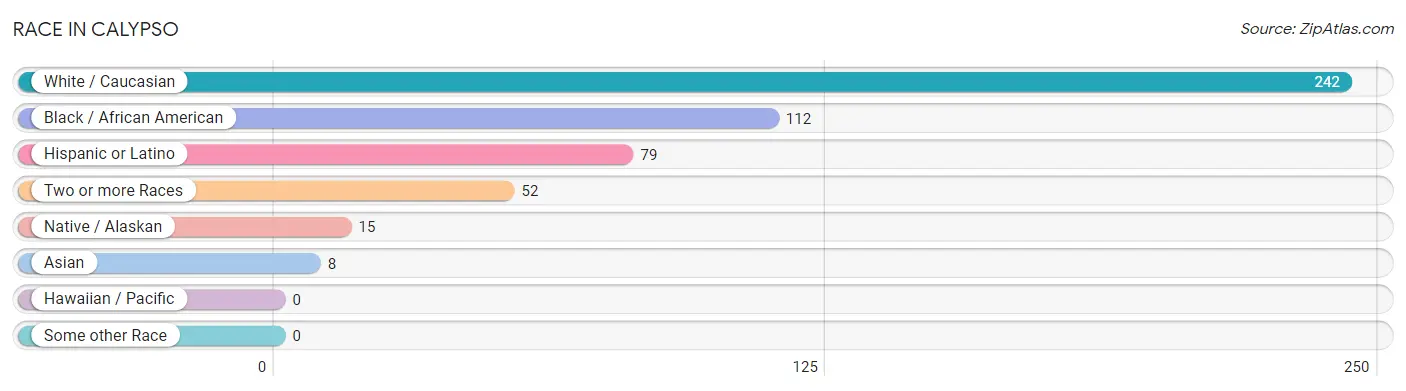
| Race | # Population | % Population |
| Asian | 8 | 1.9% |
| Black / African American | 112 | 26.1% |
| Hawaiian / Pacific | 0 | 0.0% |
| Hispanic or Latino | 79 | 18.4% |
| Native / Alaskan | 15 | 3.5% |
| White / Caucasian | 242 | 56.4% |
| Two or more Races | 52 | 12.1% |
| Some other Race | 0 | 0.0% |
| Total | 429 | 100.0% |
Ancestry in Calypso
The most populous ancestries reported in Calypso are Mexican (79 | 18.4%), Irish (65 | 15.1%), Italian (46 | 10.7%), English (13 | 3.0%), and Mexican American Indian (10 | 2.3%), together accounting for 49.6% of all Calypso residents.
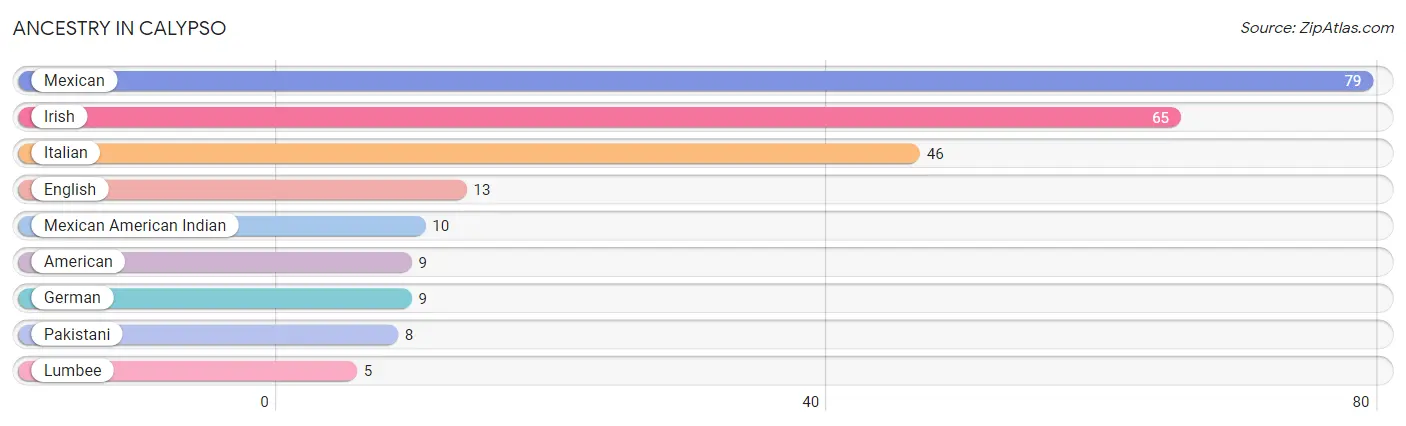
| Ancestry | # Population | % Population |
| American | 9 | 2.1% |
| English | 13 | 3.0% |
| German | 9 | 2.1% |
| Irish | 65 | 15.1% |
| Italian | 46 | 10.7% |
| Lumbee | 5 | 1.2% |
| Mexican | 79 | 18.4% |
| Mexican American Indian | 10 | 2.3% |
| Pakistani | 8 | 1.9% | View All 9 Rows |
Immigrants in Calypso
The most numerous immigrant groups reported in Calypso came from Central America (26 | 6.1%), Latin America (26 | 6.1%), Mexico (15 | 3.5%), Guatemala (11 | 2.6%), and Asia (8 | 1.9%), together accounting for 20.0% of all Calypso residents.
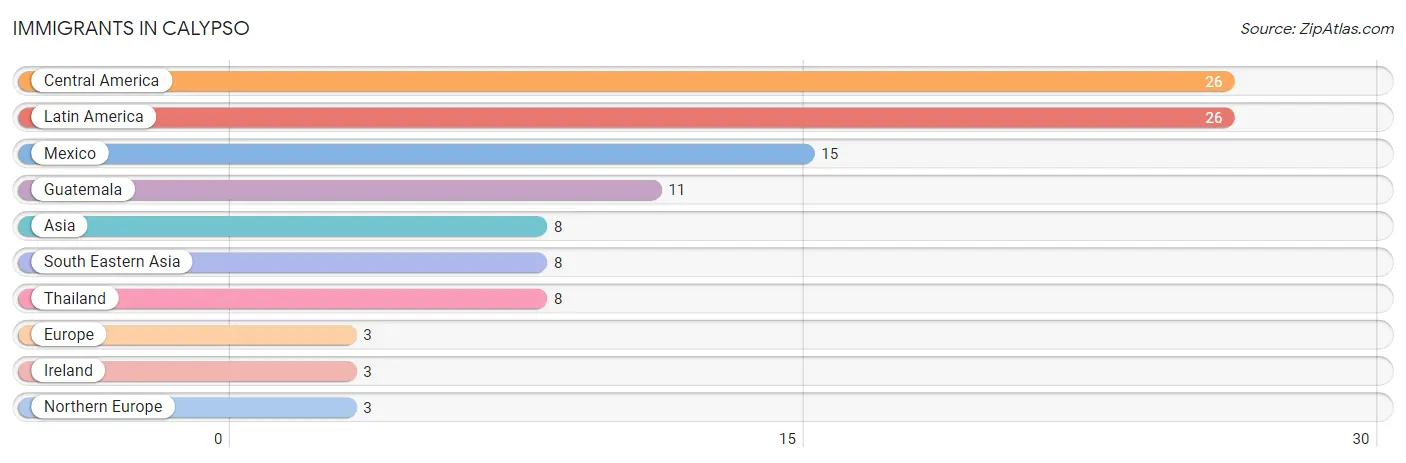
| Immigration Origin | # Population | % Population |
| Asia | 8 | 1.9% |
| Central America | 26 | 6.1% |
| Europe | 3 | 0.7% |
| Guatemala | 11 | 2.6% |
| Ireland | 3 | 0.7% |
| Latin America | 26 | 6.1% |
| Mexico | 15 | 3.5% |
| Northern Europe | 3 | 0.7% |
| South Eastern Asia | 8 | 1.9% |
| Thailand | 8 | 1.9% | View All 10 Rows |
Sex and Age in Calypso
Sex and Age in Calypso
The most populous age groups in Calypso are 25 to 29 Years (52 | 23.5%) for men and 20 to 24 Years (52 | 25.0%) for women.
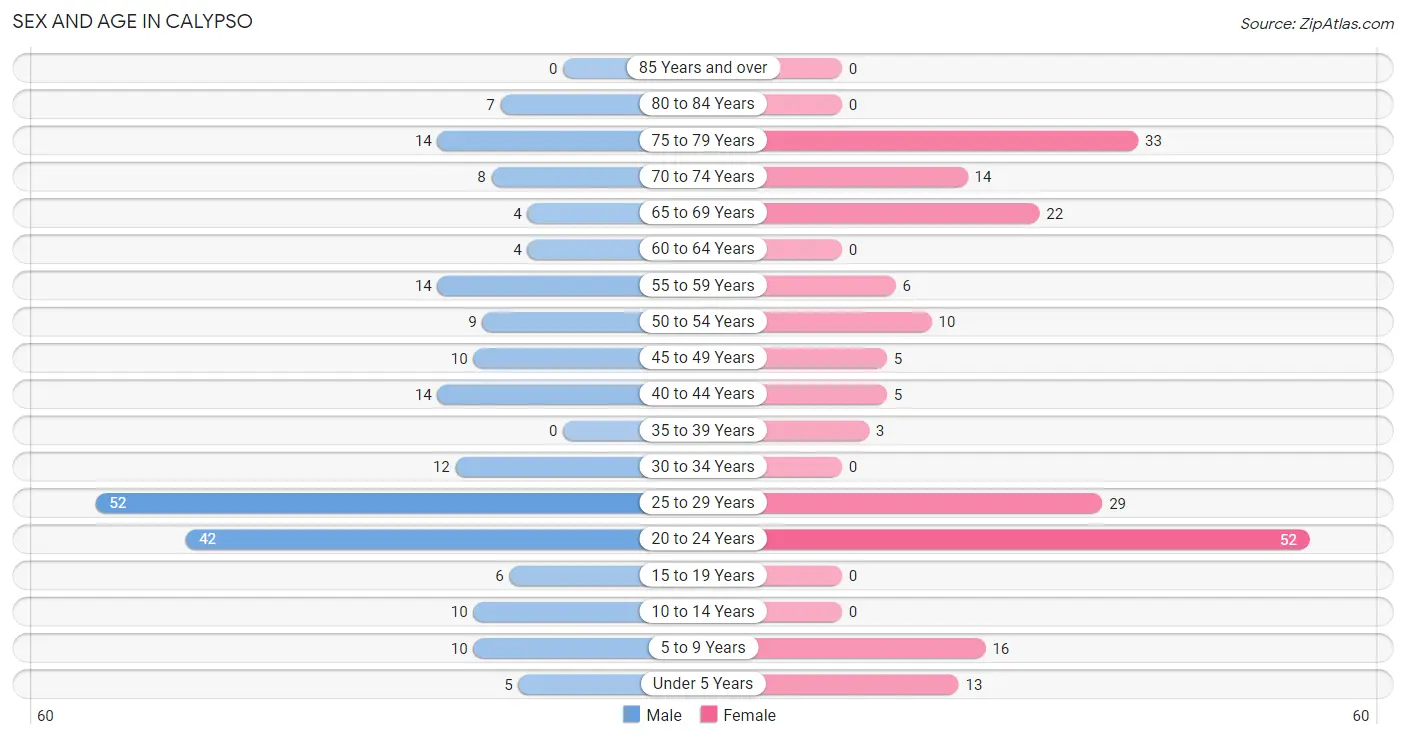
| Age Bracket | Male | Female |
| Under 5 Years | 5 (2.3%) | 13 (6.2%) |
| 5 to 9 Years | 10 (4.5%) | 16 (7.7%) |
| 10 to 14 Years | 10 (4.5%) | 0 (0.0%) |
| 15 to 19 Years | 6 (2.7%) | 0 (0.0%) |
| 20 to 24 Years | 42 (19.0%) | 52 (25.0%) |
| 25 to 29 Years | 52 (23.5%) | 29 (13.9%) |
| 30 to 34 Years | 12 (5.4%) | 0 (0.0%) |
| 35 to 39 Years | 0 (0.0%) | 3 (1.4%) |
| 40 to 44 Years | 14 (6.3%) | 5 (2.4%) |
| 45 to 49 Years | 10 (4.5%) | 5 (2.4%) |
| 50 to 54 Years | 9 (4.1%) | 10 (4.8%) |
| 55 to 59 Years | 14 (6.3%) | 6 (2.9%) |
| 60 to 64 Years | 4 (1.8%) | 0 (0.0%) |
| 65 to 69 Years | 4 (1.8%) | 22 (10.6%) |
| 70 to 74 Years | 8 (3.6%) | 14 (6.7%) |
| 75 to 79 Years | 14 (6.3%) | 33 (15.9%) |
| 80 to 84 Years | 7 (3.2%) | 0 (0.0%) |
| 85 Years and over | 0 (0.0%) | 0 (0.0%) |
| Total | 221 (100.0%) | 208 (100.0%) |
Families and Households in Calypso
Median Family Size in Calypso
The median family size in Calypso is 2.12 persons per family, with married-couple families (66 | 46.2%) accounting for the largest median family size of 2.41 persons per family. On the other hand, single male/father families (10 | 7.0%) represent the smallest median family size with 1.60 persons per family.
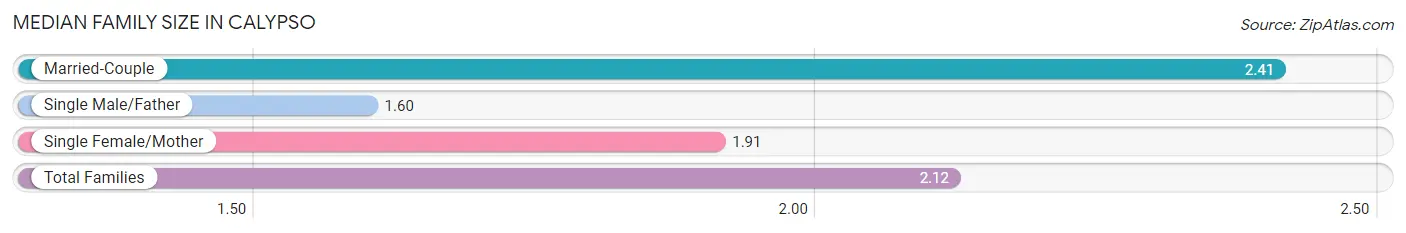
| Family Type | # Families | Family Size |
| Married-Couple | 66 (46.2%) | 2.41 |
| Single Male/Father | 10 (7.0%) | 1.60 |
| Single Female/Mother | 67 (46.9%) | 1.91 |
| Total Families | 143 (100.0%) | 2.12 |
Median Household Size in Calypso
The median household size in Calypso is 2.13 persons per household, with married-couple households (66 | 32.8%) accounting for the largest median household size of 2.41 persons per household. single male/father households (10 | 5.0%) represent the smallest median household size with 1.60 persons per household.
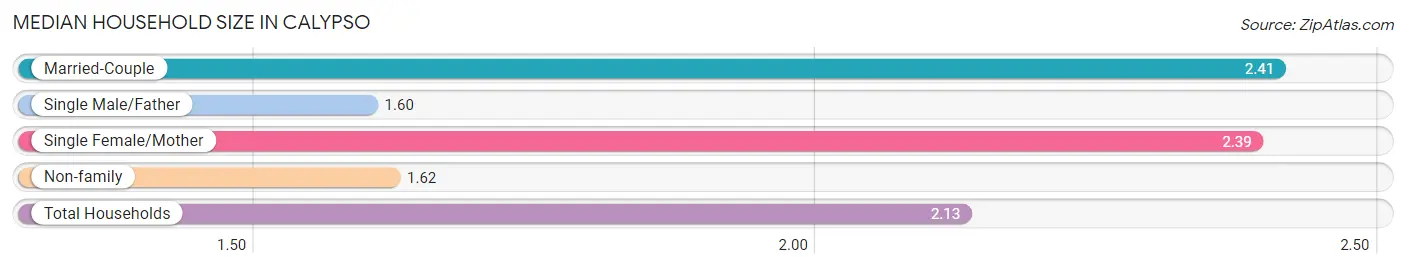
| Household Type | # Households | Household Size |
| Married-Couple | 66 (32.8%) | 2.41 |
| Single Male/Father | 10 (5.0%) | 1.60 |
| Single Female/Mother | 67 (33.3%) | 2.39 |
| Non-family | 58 (28.9%) | 1.62 |
| Total Households | 201 (100.0%) | 2.13 |
Household Size by Marriage Status in Calypso
Out of a total of 201 households in Calypso, 143 (71.1%) are family households, while 58 (28.9%) are nonfamily households. The most numerous type of family households are 2-person households, comprising 75, and the most common type of nonfamily households are 1-person households, comprising 30.
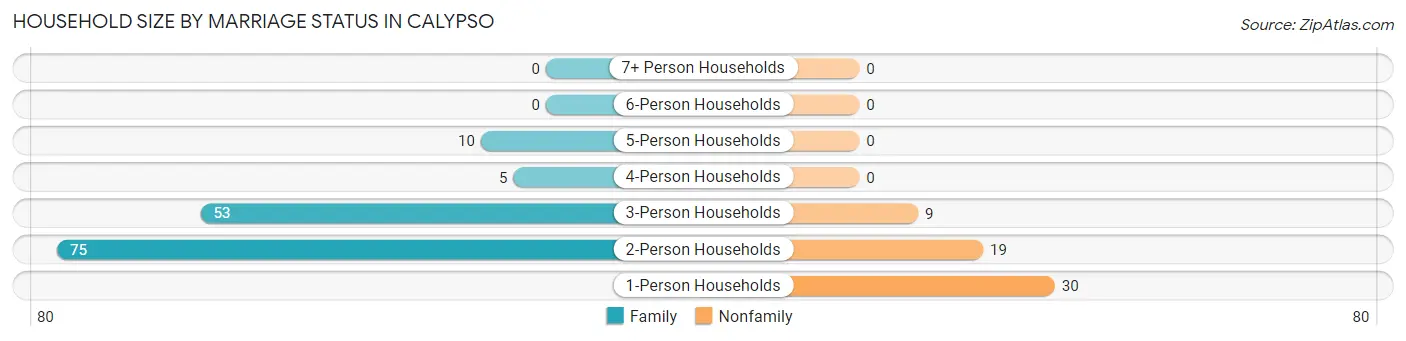
| Household Size | Family Households | Nonfamily Households |
| 1-Person Households | - | 30 (14.9%) |
| 2-Person Households | 75 (37.3%) | 19 (9.5%) |
| 3-Person Households | 53 (26.4%) | 9 (4.5%) |
| 4-Person Households | 5 (2.5%) | 0 (0.0%) |
| 5-Person Households | 10 (5.0%) | 0 (0.0%) |
| 6-Person Households | 0 (0.0%) | 0 (0.0%) |
| 7+ Person Households | 0 (0.0%) | 0 (0.0%) |
| Total | 143 (71.1%) | 58 (28.9%) |
Female Fertility in Calypso
Fertility by Age in Calypso
| Age Bracket | Women with Births | Births / 1,000 Women |
| 15 to 19 years | 0 (0.0%) | 0.0 |
| 20 to 34 years | 0 (0.0%) | 0.0 |
| 35 to 50 years | 0 (0.0%) | 0.0 |
| Total | 0 (0.0%) | 0.0 |
Fertility by Age by Marriage Status in Calypso
| Age Bracket | Married | Unmarried |
| 15 to 19 years | 0 (0.0%) | 0 (0.0%) |
| 20 to 34 years | 0 (0.0%) | 0 (0.0%) |
| 35 to 50 years | 0 (0.0%) | 0 (0.0%) |
| Total | 0 (0.0%) | 0 (0.0%) |
Fertility by Education in Calypso
| Educational Attainment | Women with Births | Births / 1,000 Women |
| Less than High School | 0 (0.0%) | 0.0 |
| High School Diploma | 0 (0.0%) | 0.0 |
| College or Associate's Degree | 0 (0.0%) | 0.0 |
| Bachelor's Degree | 0 (0.0%) | 0.0 |
| Graduate Degree | 0 (0.0%) | 0.0 |
| Total | 0 (0.0%) | 0.0 |
Fertility by Education by Marriage Status in Calypso
| Educational Attainment | Married | Unmarried |
| Less than High School | 0 (0.0%) | 0 (0.0%) |
| High School Diploma | 0 (0.0%) | 0 (0.0%) |
| College or Associate's Degree | 0 (0.0%) | 0 (0.0%) |
| Bachelor's Degree | 0 (0.0%) | 0 (0.0%) |
| Graduate Degree | 0 (0.0%) | 0 (0.0%) |
| Total | 0 (0.0%) | 0 (0.0%) |
Employment Characteristics in Calypso
Employment by Class of Employer in Calypso
Among the 244 employed individuals in Calypso, private company employees (223 | 91.4%), not-for-profit organizations (14 | 5.7%), and local government employees (4 | 1.6%) make up the most common classes of employment.
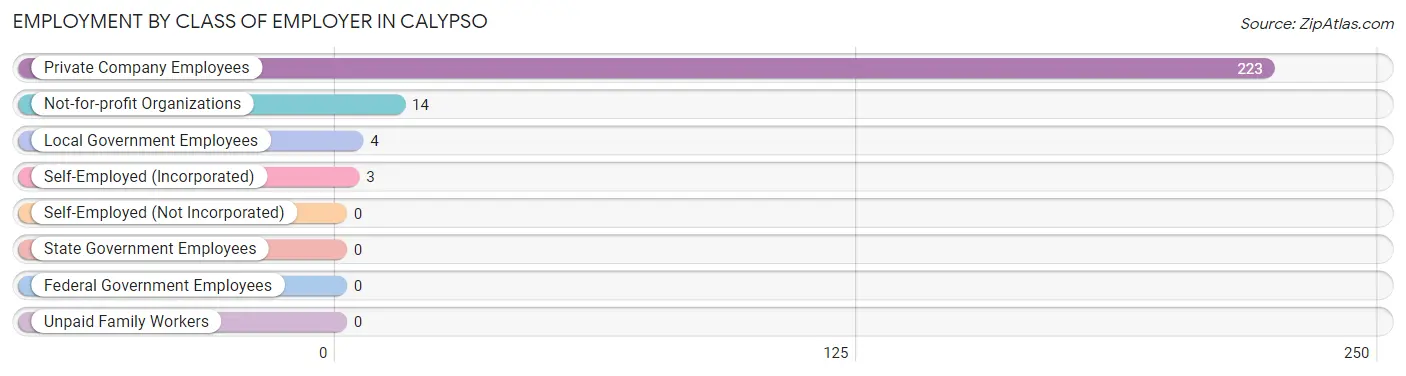
| Employer Class | # Employees | % Employees |
| Private Company Employees | 223 | 91.4% |
| Self-Employed (Incorporated) | 3 | 1.2% |
| Self-Employed (Not Incorporated) | 0 | 0.0% |
| Not-for-profit Organizations | 14 | 5.7% |
| Local Government Employees | 4 | 1.6% |
| State Government Employees | 0 | 0.0% |
| Federal Government Employees | 0 | 0.0% |
| Unpaid Family Workers | 0 | 0.0% |
| Total | 244 | 100.0% |
Employment Status by Age in Calypso
According to the labor force statistics for Calypso, out of the total population over 16 years of age (375), 72.5% or 272 individuals are in the labor force, with 7.4% or 20 of them unemployed. The age group with the highest labor force participation rate is 20 to 24 years, with 100.0% or 94 individuals in the labor force. Within the labor force, the 25 to 29 years age range has the highest percentage of unemployed individuals, with 24.7% or 20 of them being unemployed.
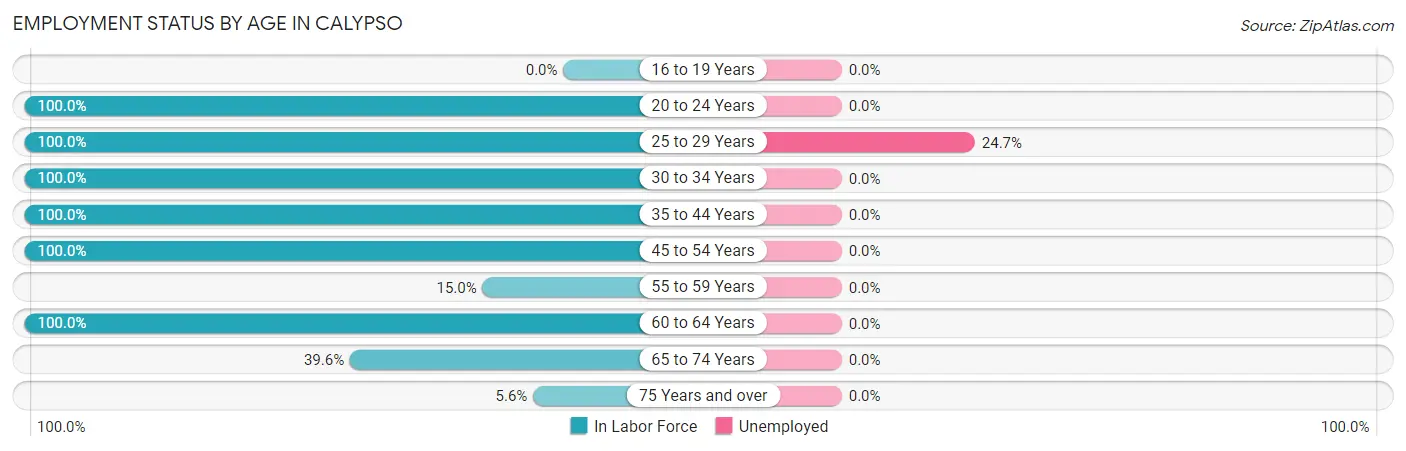
| Age Bracket | In Labor Force | Unemployed |
| 16 to 19 Years | 0 (0.0%) | 0 (0.0%) |
| 20 to 24 Years | 94 (100.0%) | 0 (0.0%) |
| 25 to 29 Years | 81 (100.0%) | 20 (24.7%) |
| 30 to 34 Years | 12 (100.0%) | 0 (0.0%) |
| 35 to 44 Years | 22 (100.0%) | 0 (0.0%) |
| 45 to 54 Years | 34 (100.0%) | 0 (0.0%) |
| 55 to 59 Years | 3 (15.0%) | 0 (0.0%) |
| 60 to 64 Years | 4 (100.0%) | 0 (0.0%) |
| 65 to 74 Years | 19 (39.6%) | 0 (0.0%) |
| 75 Years and over | 3 (5.6%) | 0 (0.0%) |
| Total | 272 (72.5%) | 20 (7.4%) |
Employment Status by Educational Attainment in Calypso
According to labor force statistics for Calypso, 90.2% of individuals (156) out of the total population between 25 and 64 years of age (173) are in the labor force, with 12.8% or 20 of them being unemployed. The group with the highest labor force participation rate are those with the educational attainment of less than high school, with 100.0% or 29 individuals in the labor force. Within the labor force, individuals with less than high school education have the highest percentage of unemployment, with 69.0% or 20 of them being unemployed.
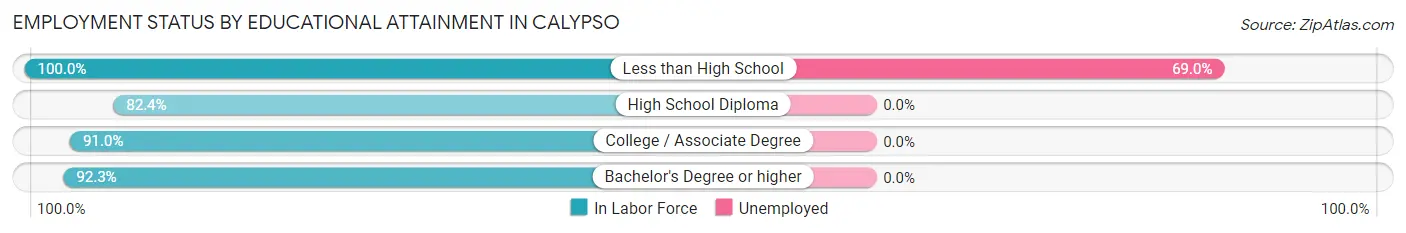
| Educational Attainment | In Labor Force | Unemployed |
| Less than High School | 29 (100.0%) | 20 (69.0%) |
| High School Diploma | 42 (82.4%) | 0 (0.0%) |
| College / Associate Degree | 61 (91.0%) | 0 (0.0%) |
| Bachelor's Degree or higher | 24 (92.3%) | 0 (0.0%) |
| Total | 156 (90.2%) | 22 (12.8%) |
Employment Occupations by Sex in Calypso
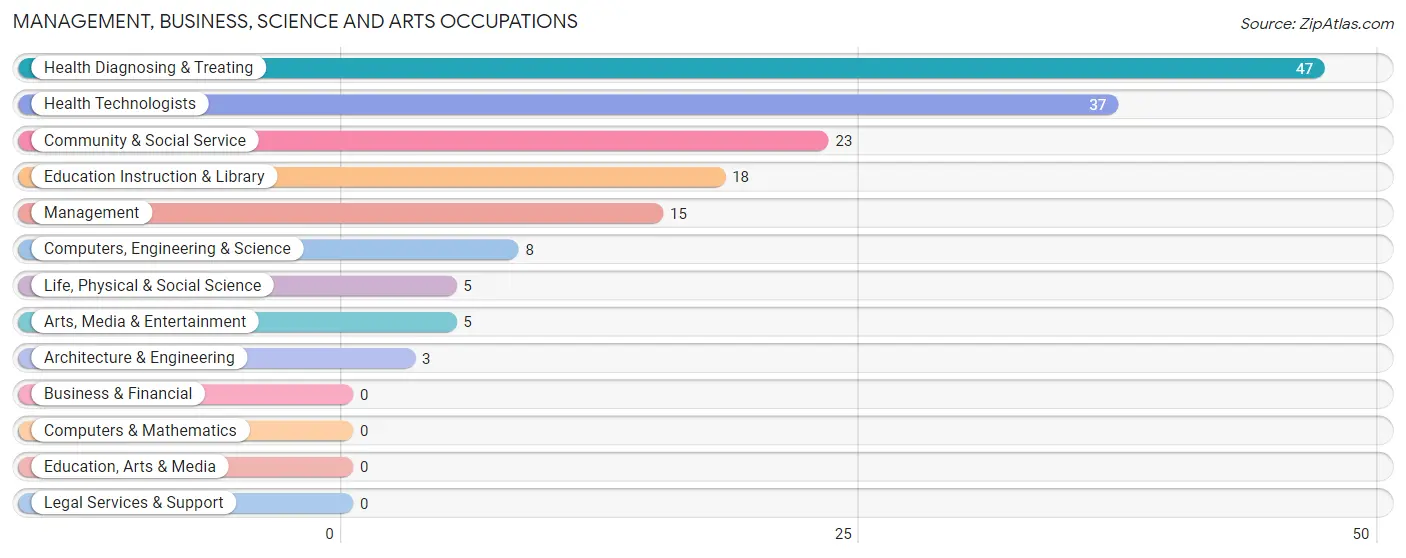
Management, Business, Science and Arts Occupations
The most common Management, Business, Science and Arts occupations in Calypso are Health Diagnosing & Treating (47 | 18.6%), Health Technologists (37 | 14.7%), Community & Social Service (23 | 9.1%), Education Instruction & Library (18 | 7.1%), and Management (15 | 5.9%).
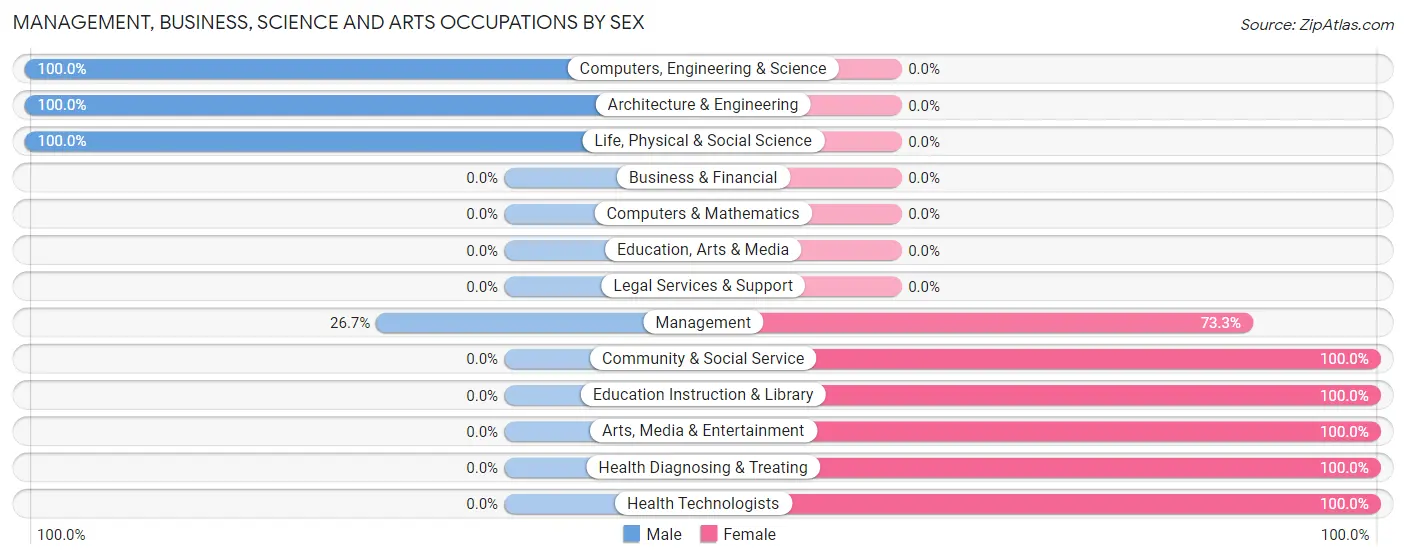
Management, Business, Science and Arts Occupations by Sex
Within the Management, Business, Science and Arts occupations in Calypso, the most male-oriented occupations are Computers, Engineering & Science (100.0%), Architecture & Engineering (100.0%), and Life, Physical & Social Science (100.0%), while the most female-oriented occupations are Community & Social Service (100.0%), Education Instruction & Library (100.0%), and Arts, Media & Entertainment (100.0%).
| Occupation | Male | Female |
| Management | 4 (26.7%) | 11 (73.3%) |
| Business & Financial | 0 (0.0%) | 0 (0.0%) |
| Computers, Engineering & Science | 8 (100.0%) | 0 (0.0%) |
| Computers & Mathematics | 0 (0.0%) | 0 (0.0%) |
| Architecture & Engineering | 3 (100.0%) | 0 (0.0%) |
| Life, Physical & Social Science | 5 (100.0%) | 0 (0.0%) |
| Community & Social Service | 0 (0.0%) | 23 (100.0%) |
| Education, Arts & Media | 0 (0.0%) | 0 (0.0%) |
| Legal Services & Support | 0 (0.0%) | 0 (0.0%) |
| Education Instruction & Library | 0 (0.0%) | 18 (100.0%) |
| Arts, Media & Entertainment | 0 (0.0%) | 5 (100.0%) |
| Health Diagnosing & Treating | 0 (0.0%) | 47 (100.0%) |
| Health Technologists | 0 (0.0%) | 37 (100.0%) |
| Total (Category) | 12 (12.9%) | 81 (87.1%) |
| Total (Overall) | 136 (54.0%) | 116 (46.0%) |
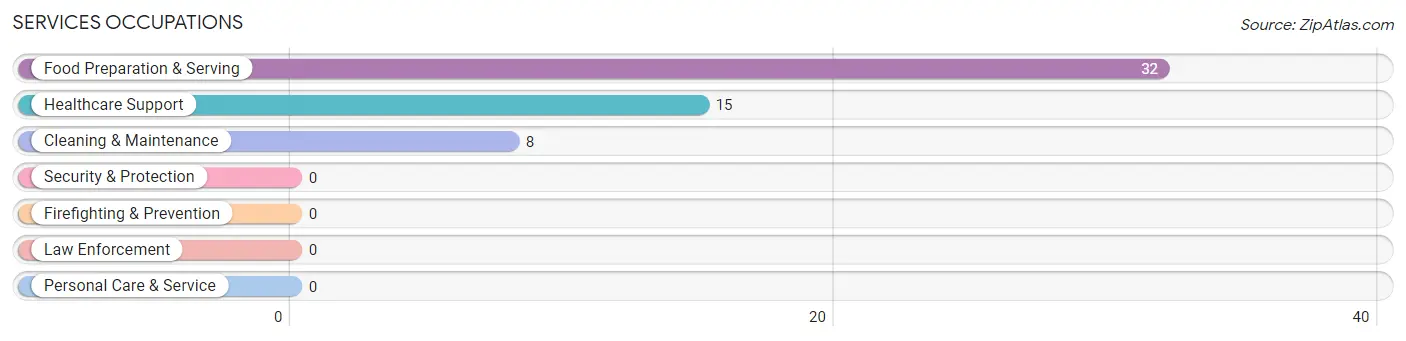
Services Occupations
The most common Services occupations in Calypso are Food Preparation & Serving (32 | 12.7%), Healthcare Support (15 | 5.9%), and Cleaning & Maintenance (8 | 3.2%).
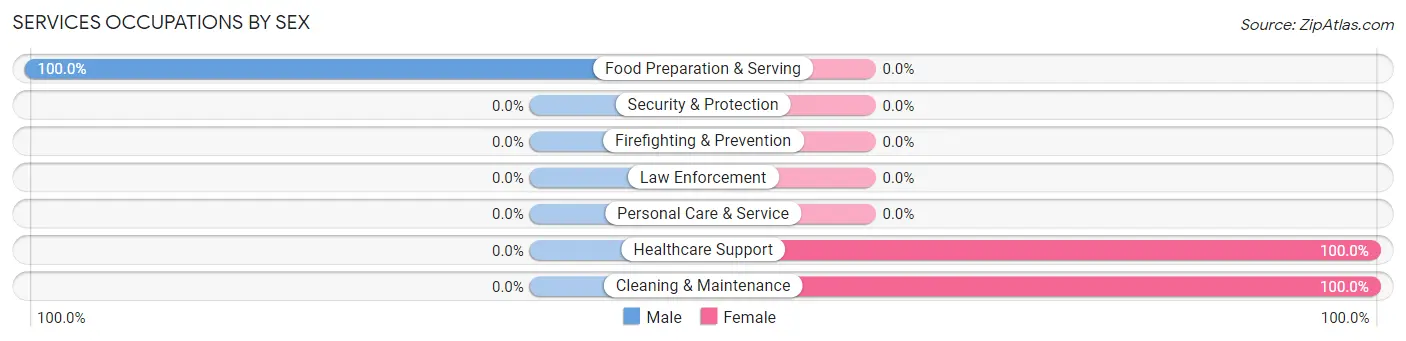
Services Occupations by Sex
| Occupation | Male | Female |
| Healthcare Support | 0 (0.0%) | 15 (100.0%) |
| Security & Protection | 0 (0.0%) | 0 (0.0%) |
| Firefighting & Prevention | 0 (0.0%) | 0 (0.0%) |
| Law Enforcement | 0 (0.0%) | 0 (0.0%) |
| Food Preparation & Serving | 32 (100.0%) | 0 (0.0%) |
| Cleaning & Maintenance | 0 (0.0%) | 8 (100.0%) |
| Personal Care & Service | 0 (0.0%) | 0 (0.0%) |
| Total (Category) | 32 (58.2%) | 23 (41.8%) |
| Total (Overall) | 136 (54.0%) | 116 (46.0%) |
Sales and Office Occupations
The most common Sales and Office occupations in Calypso are Sales & Related (14 | 5.6%), and Office & Administration (10 | 4.0%).
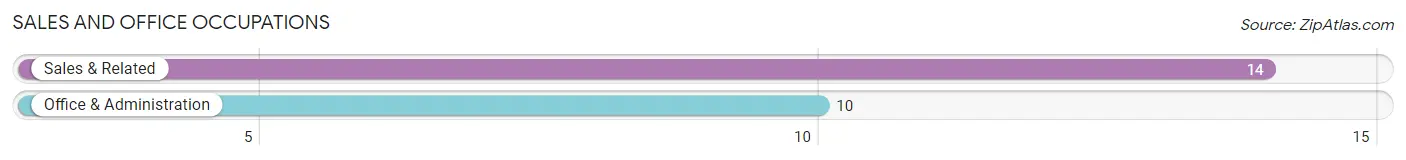
Sales and Office Occupations by Sex
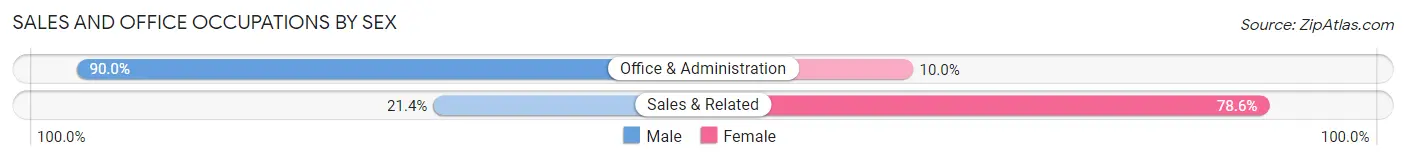
| Occupation | Male | Female |
| Sales & Related | 3 (21.4%) | 11 (78.6%) |
| Office & Administration | 9 (90.0%) | 1 (10.0%) |
| Total (Category) | 12 (50.0%) | 12 (50.0%) |
| Total (Overall) | 136 (54.0%) | 116 (46.0%) |
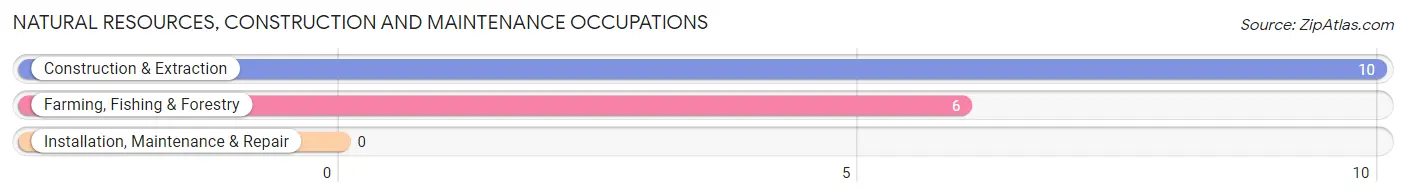
Natural Resources, Construction and Maintenance Occupations
The most common Natural Resources, Construction and Maintenance occupations in Calypso are Construction & Extraction (10 | 4.0%), and Farming, Fishing & Forestry (6 | 2.4%).
Natural Resources, Construction and Maintenance Occupations by Sex
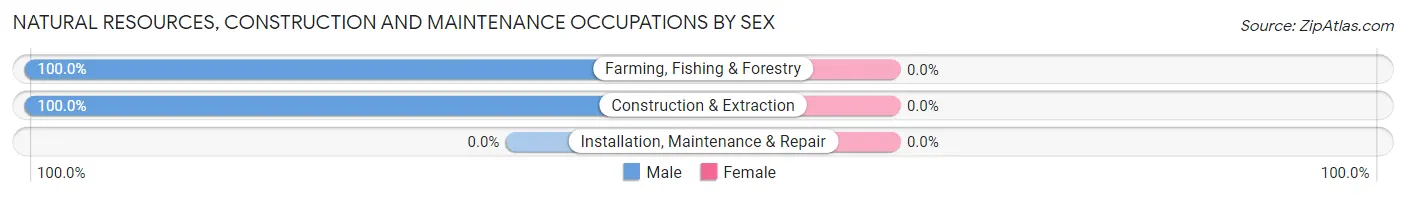
| Occupation | Male | Female |
| Farming, Fishing & Forestry | 6 (100.0%) | 0 (0.0%) |
| Construction & Extraction | 10 (100.0%) | 0 (0.0%) |
| Installation, Maintenance & Repair | 0 (0.0%) | 0 (0.0%) |
| Total (Category) | 16 (100.0%) | 0 (0.0%) |
| Total (Overall) | 136 (54.0%) | 116 (46.0%) |
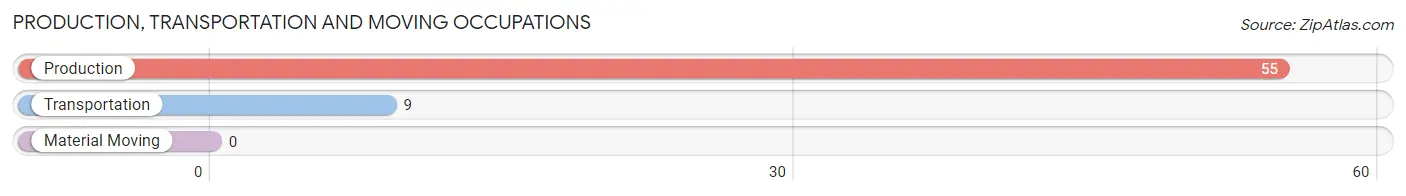
Production, Transportation and Moving Occupations
The most common Production, Transportation and Moving occupations in Calypso are Production (55 | 21.8%), and Transportation (9 | 3.6%).
Production, Transportation and Moving Occupations by Sex
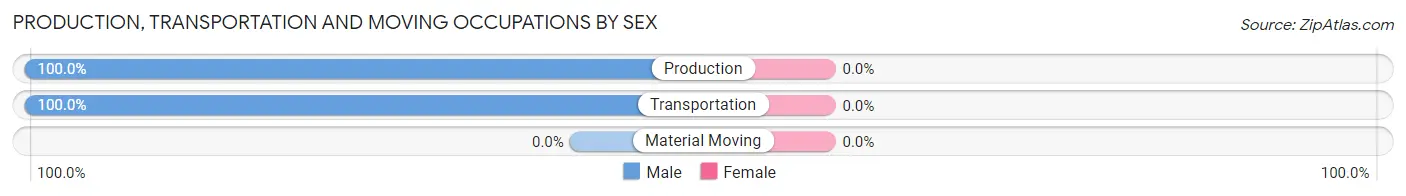
| Occupation | Male | Female |
| Production | 55 (100.0%) | 0 (0.0%) |
| Transportation | 9 (100.0%) | 0 (0.0%) |
| Material Moving | 0 (0.0%) | 0 (0.0%) |
| Total (Category) | 64 (100.0%) | 0 (0.0%) |
| Total (Overall) | 136 (54.0%) | 116 (46.0%) |
Employment Industries by Sex in Calypso
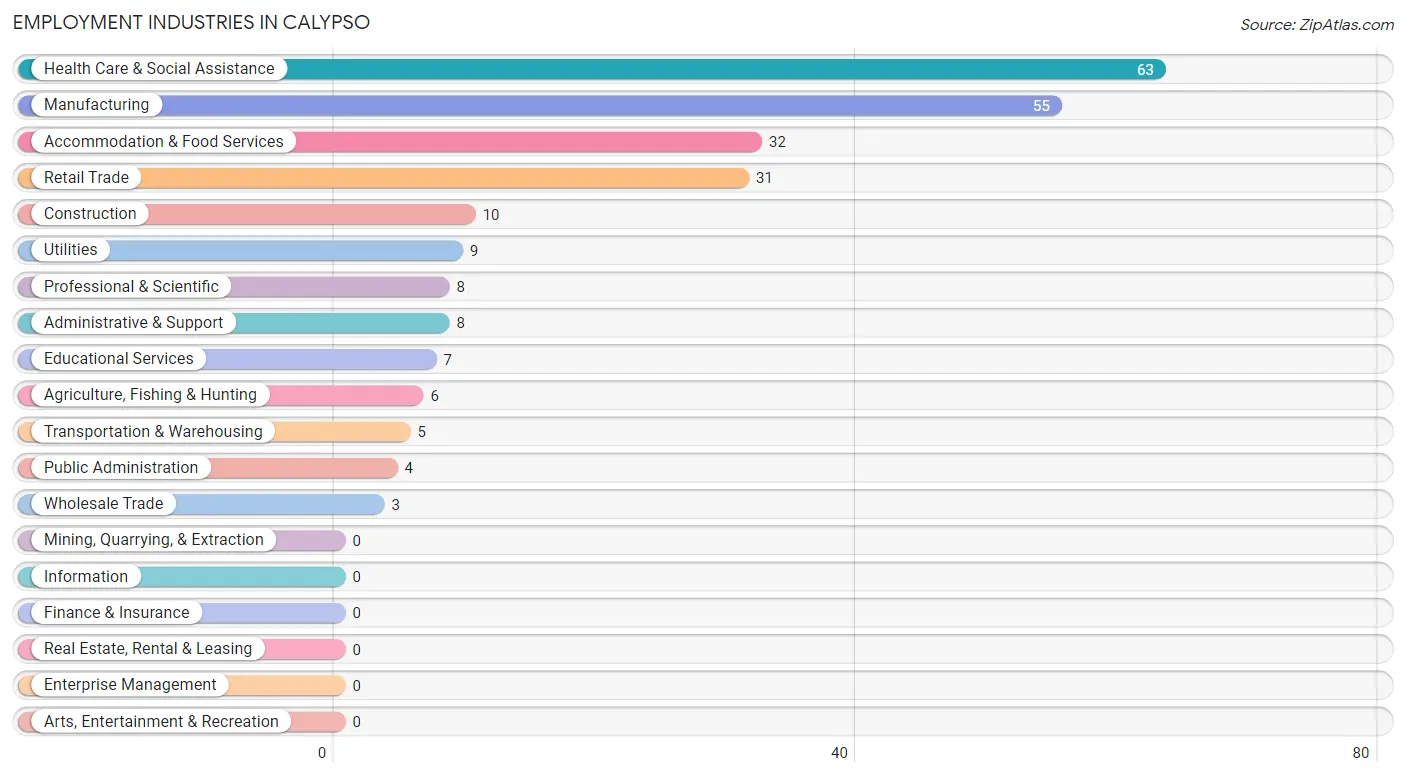
Employment Industries in Calypso
The major employment industries in Calypso include Health Care & Social Assistance (63 | 25.0%), Manufacturing (55 | 21.8%), Accommodation & Food Services (32 | 12.7%), Retail Trade (31 | 12.3%), and Construction (10 | 4.0%).
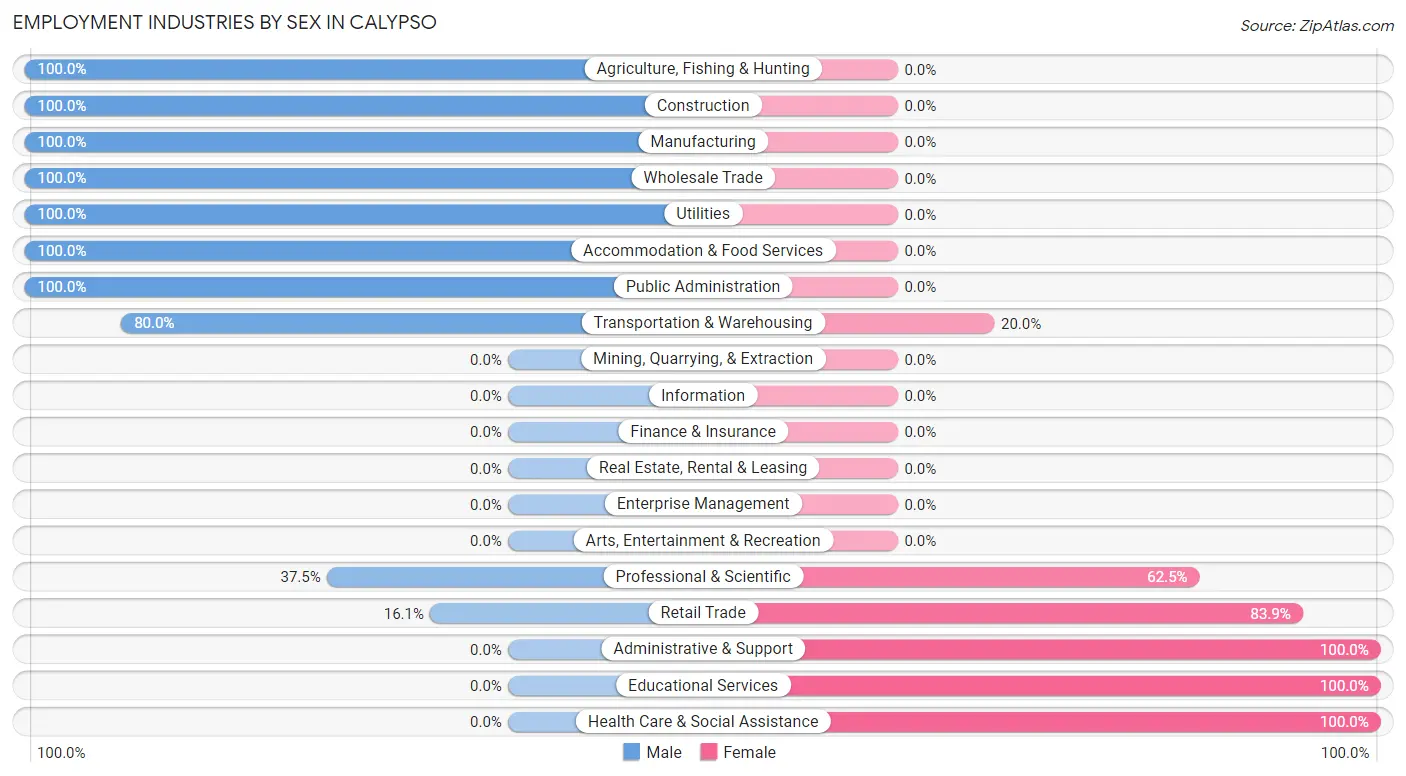
Employment Industries by Sex in Calypso
The Calypso industries that see more men than women are Agriculture, Fishing & Hunting (100.0%), Construction (100.0%), and Manufacturing (100.0%), whereas the industries that tend to have a higher number of women are Administrative & Support (100.0%), Educational Services (100.0%), and Health Care & Social Assistance (100.0%).
| Industry | Male | Female |
| Agriculture, Fishing & Hunting | 6 (100.0%) | 0 (0.0%) |
| Mining, Quarrying, & Extraction | 0 (0.0%) | 0 (0.0%) |
| Construction | 10 (100.0%) | 0 (0.0%) |
| Manufacturing | 55 (100.0%) | 0 (0.0%) |
| Wholesale Trade | 3 (100.0%) | 0 (0.0%) |
| Retail Trade | 5 (16.1%) | 26 (83.9%) |
| Transportation & Warehousing | 4 (80.0%) | 1 (20.0%) |
| Utilities | 9 (100.0%) | 0 (0.0%) |
| Information | 0 (0.0%) | 0 (0.0%) |
| Finance & Insurance | 0 (0.0%) | 0 (0.0%) |
| Real Estate, Rental & Leasing | 0 (0.0%) | 0 (0.0%) |
| Professional & Scientific | 3 (37.5%) | 5 (62.5%) |
| Enterprise Management | 0 (0.0%) | 0 (0.0%) |
| Administrative & Support | 0 (0.0%) | 8 (100.0%) |
| Educational Services | 0 (0.0%) | 7 (100.0%) |
| Health Care & Social Assistance | 0 (0.0%) | 63 (100.0%) |
| Arts, Entertainment & Recreation | 0 (0.0%) | 0 (0.0%) |
| Accommodation & Food Services | 32 (100.0%) | 0 (0.0%) |
| Public Administration | 4 (100.0%) | 0 (0.0%) |
| Total | 136 (54.0%) | 116 (46.0%) |
Education in Calypso
School Enrollment in Calypso
The most common levels of schooling among the 119 students in Calypso are college / undergraduate (89 | 74.8%), elementary school (18 | 15.1%), and middle school (6 | 5.0%).
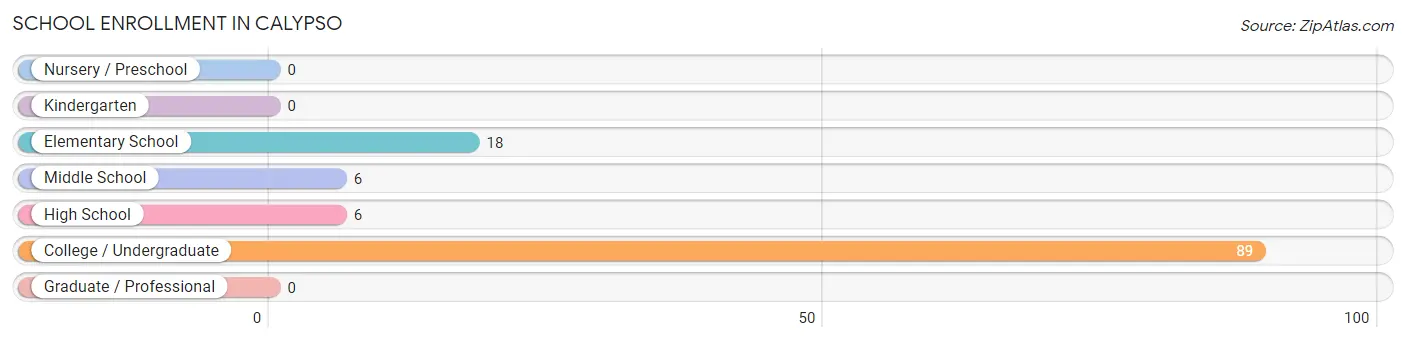
| School Level | # Students | % Students |
| Nursery / Preschool | 0 | 0.0% |
| Kindergarten | 0 | 0.0% |
| Elementary School | 18 | 15.1% |
| Middle School | 6 | 5.0% |
| High School | 6 | 5.0% |
| College / Undergraduate | 89 | 74.8% |
| Graduate / Professional | 0 | 0.0% |
| Total | 119 | 100.0% |
School Enrollment by Age by Funding Source in Calypso
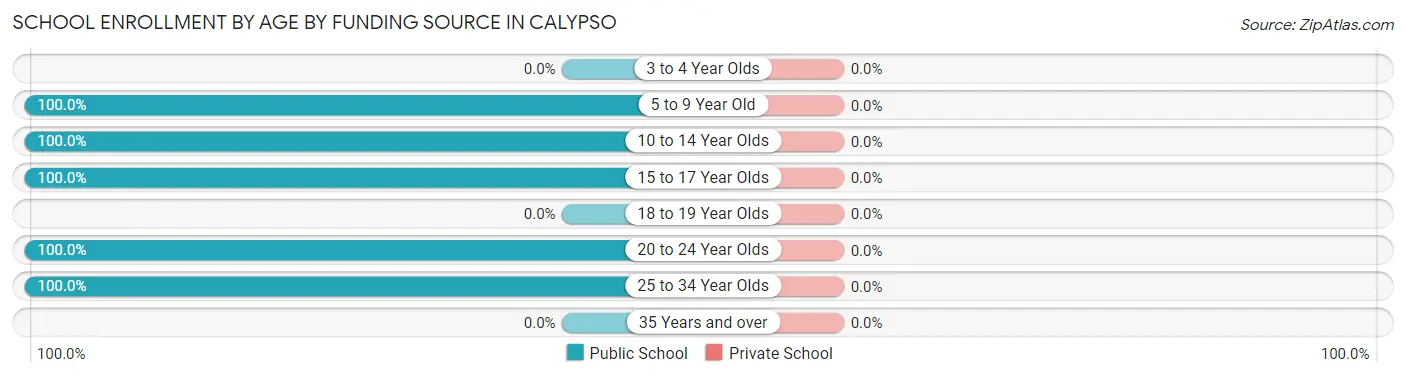
| Age Bracket | Public School | Private School |
| 3 to 4 Year Olds | 0 (0.0%) | 0 (0.0%) |
| 5 to 9 Year Old | 14 (100.0%) | 0 (0.0%) |
| 10 to 14 Year Olds | 10 (100.0%) | 0 (0.0%) |
| 15 to 17 Year Olds | 6 (100.0%) | 0 (0.0%) |
| 18 to 19 Year Olds | 0 (0.0%) | 0 (0.0%) |
| 20 to 24 Year Olds | 57 (100.0%) | 0 (0.0%) |
| 25 to 34 Year Olds | 32 (100.0%) | 0 (0.0%) |
| 35 Years and over | 0 (0.0%) | 0 (0.0%) |
| Total | 119 (100.0%) | 0 (0.0%) |
Educational Attainment by Field of Study in Calypso
Arts & humanities (10 | 34.5%), business (9 | 31.0%), liberal arts & history (5 | 17.2%), education (3 | 10.3%), and bio, nature & agricultural (2 | 6.9%) are the most common fields of study among 29 individuals in Calypso who have obtained a bachelor's degree or higher.
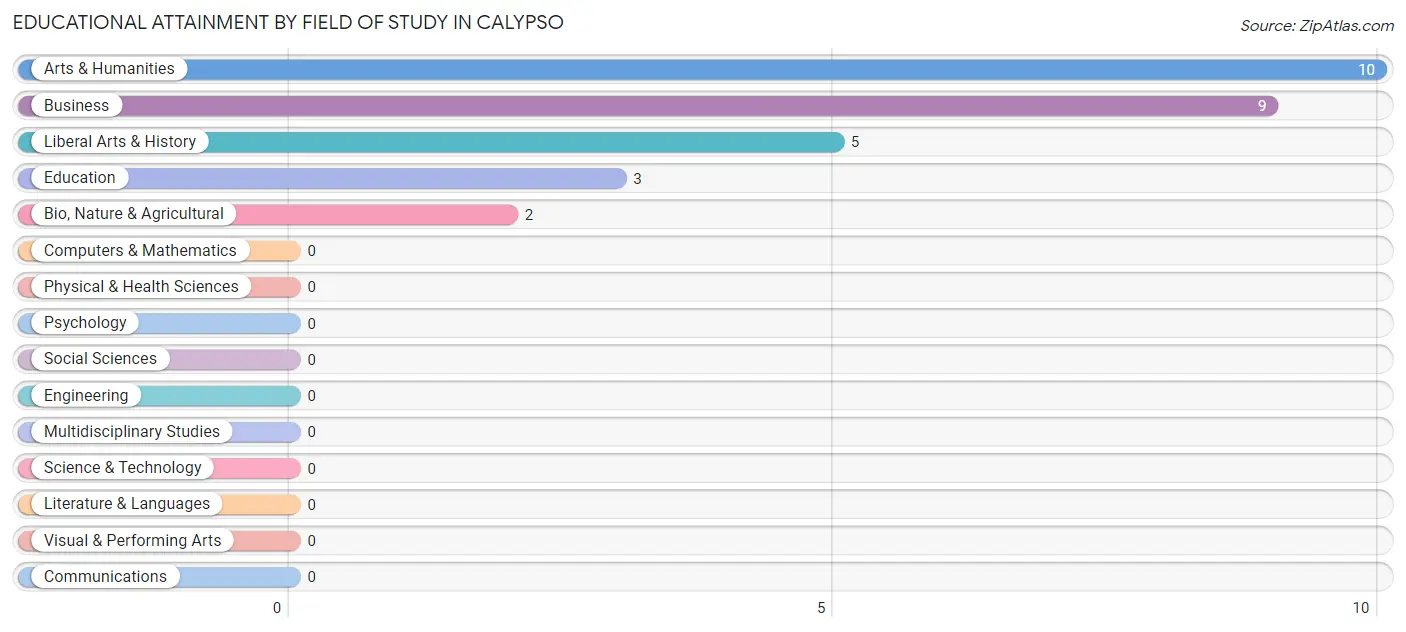
| Field of Study | # Graduates | % Graduates |
| Computers & Mathematics | 0 | 0.0% |
| Bio, Nature & Agricultural | 2 | 6.9% |
| Physical & Health Sciences | 0 | 0.0% |
| Psychology | 0 | 0.0% |
| Social Sciences | 0 | 0.0% |
| Engineering | 0 | 0.0% |
| Multidisciplinary Studies | 0 | 0.0% |
| Science & Technology | 0 | 0.0% |
| Business | 9 | 31.0% |
| Education | 3 | 10.3% |
| Literature & Languages | 0 | 0.0% |
| Liberal Arts & History | 5 | 17.2% |
| Visual & Performing Arts | 0 | 0.0% |
| Communications | 0 | 0.0% |
| Arts & Humanities | 10 | 34.5% |
| Total | 29 | 100.0% |
Transportation & Commute in Calypso
Vehicle Availability by Sex in Calypso
The most prevalent vehicle ownership categories in Calypso are males with 2 vehicles (42, accounting for 30.9%) and females with 2 vehicles (31, making up 38.9%).
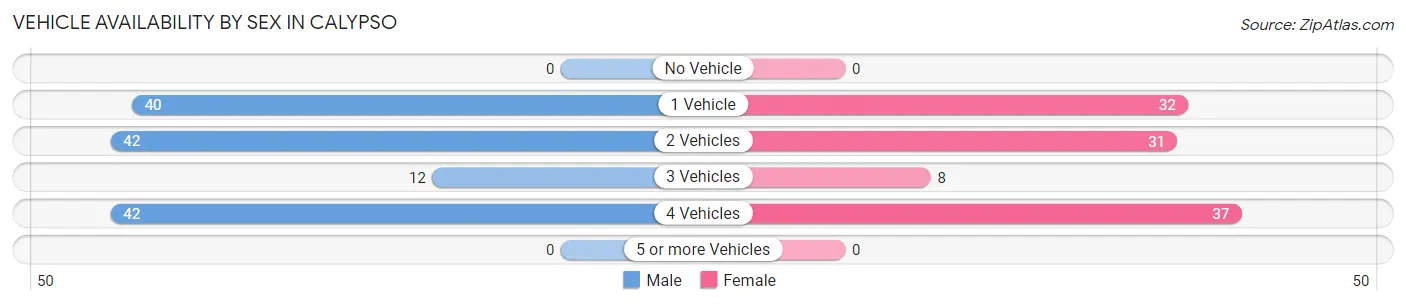
| Vehicles Available | Male | Female |
| No Vehicle | 0 (0.0%) | 0 (0.0%) |
| 1 Vehicle | 40 (29.4%) | 32 (29.6%) |
| 2 Vehicles | 42 (30.9%) | 31 (28.7%) |
| 3 Vehicles | 12 (8.8%) | 8 (7.4%) |
| 4 Vehicles | 42 (30.9%) | 37 (34.3%) |
| 5 or more Vehicles | 0 (0.0%) | 0 (0.0%) |
| Total | 136 (100.0%) | 108 (100.0%) |
Commute Time in Calypso
The most frequently occuring commute durations in Calypso are 20 to 24 minutes (64 commuters, 27.1%), 45 to 59 minutes (48 commuters, 20.3%), and 5 to 9 minutes (47 commuters, 19.9%).
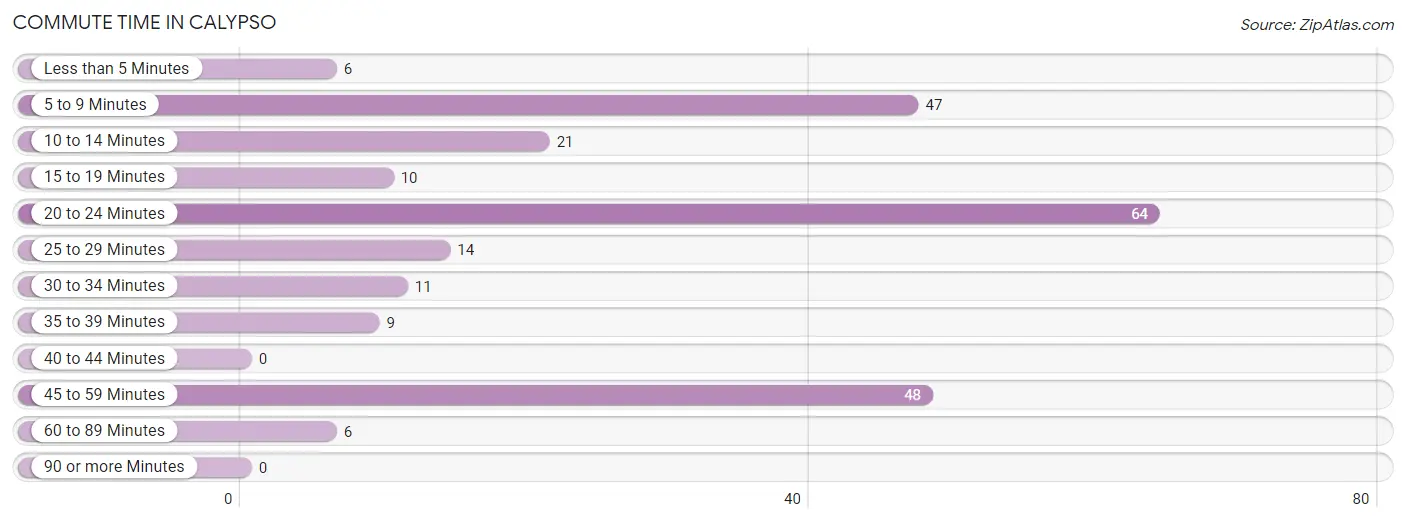
| Commute Time | # Commuters | % Commuters |
| Less than 5 Minutes | 6 | 2.5% |
| 5 to 9 Minutes | 47 | 19.9% |
| 10 to 14 Minutes | 21 | 8.9% |
| 15 to 19 Minutes | 10 | 4.2% |
| 20 to 24 Minutes | 64 | 27.1% |
| 25 to 29 Minutes | 14 | 5.9% |
| 30 to 34 Minutes | 11 | 4.7% |
| 35 to 39 Minutes | 9 | 3.8% |
| 40 to 44 Minutes | 0 | 0.0% |
| 45 to 59 Minutes | 48 | 20.3% |
| 60 to 89 Minutes | 6 | 2.5% |
| 90 or more Minutes | 0 | 0.0% |
Commute Time by Sex in Calypso
The most common commute times in Calypso are 45 to 59 minutes (44 commuters, 33.6%) for males and 20 to 24 minutes (64 commuters, 61.0%) for females.
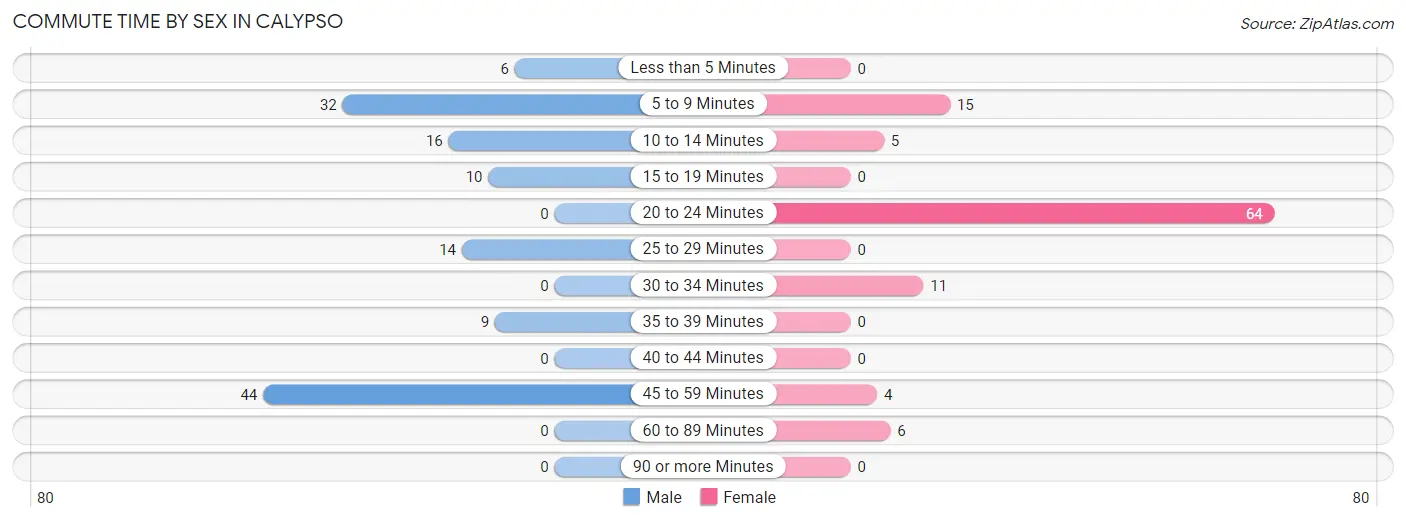
| Commute Time | Male | Female |
| Less than 5 Minutes | 6 (4.6%) | 0 (0.0%) |
| 5 to 9 Minutes | 32 (24.4%) | 15 (14.3%) |
| 10 to 14 Minutes | 16 (12.2%) | 5 (4.8%) |
| 15 to 19 Minutes | 10 (7.6%) | 0 (0.0%) |
| 20 to 24 Minutes | 0 (0.0%) | 64 (61.0%) |
| 25 to 29 Minutes | 14 (10.7%) | 0 (0.0%) |
| 30 to 34 Minutes | 0 (0.0%) | 11 (10.5%) |
| 35 to 39 Minutes | 9 (6.9%) | 0 (0.0%) |
| 40 to 44 Minutes | 0 (0.0%) | 0 (0.0%) |
| 45 to 59 Minutes | 44 (33.6%) | 4 (3.8%) |
| 60 to 89 Minutes | 0 (0.0%) | 6 (5.7%) |
| 90 or more Minutes | 0 (0.0%) | 0 (0.0%) |
Time of Departure to Work by Sex in Calypso
The most frequent times of departure to work in Calypso are 5:30 AM to 5:59 AM (74, 56.5%) for males and 7:30 AM to 7:59 AM (52, 49.5%) for females.
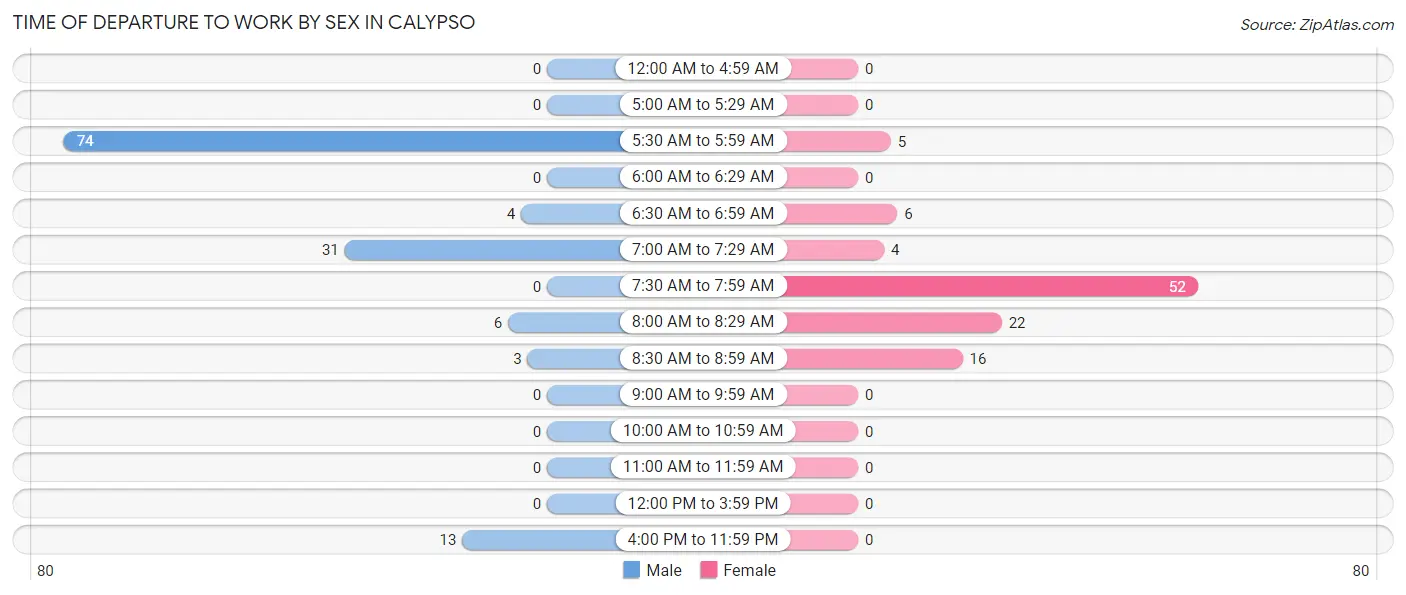
| Time of Departure | Male | Female |
| 12:00 AM to 4:59 AM | 0 (0.0%) | 0 (0.0%) |
| 5:00 AM to 5:29 AM | 0 (0.0%) | 0 (0.0%) |
| 5:30 AM to 5:59 AM | 74 (56.5%) | 5 (4.8%) |
| 6:00 AM to 6:29 AM | 0 (0.0%) | 0 (0.0%) |
| 6:30 AM to 6:59 AM | 4 (3.0%) | 6 (5.7%) |
| 7:00 AM to 7:29 AM | 31 (23.7%) | 4 (3.8%) |
| 7:30 AM to 7:59 AM | 0 (0.0%) | 52 (49.5%) |
| 8:00 AM to 8:29 AM | 6 (4.6%) | 22 (20.9%) |
| 8:30 AM to 8:59 AM | 3 (2.3%) | 16 (15.2%) |
| 9:00 AM to 9:59 AM | 0 (0.0%) | 0 (0.0%) |
| 10:00 AM to 10:59 AM | 0 (0.0%) | 0 (0.0%) |
| 11:00 AM to 11:59 AM | 0 (0.0%) | 0 (0.0%) |
| 12:00 PM to 3:59 PM | 0 (0.0%) | 0 (0.0%) |
| 4:00 PM to 11:59 PM | 13 (9.9%) | 0 (0.0%) |
| Total | 131 (100.0%) | 105 (100.0%) |
Housing Occupancy in Calypso
Occupancy by Ownership in Calypso
Of the total 201 dwellings in Calypso, owner-occupied units account for 100 (49.7%), while renter-occupied units make up 101 (50.2%).
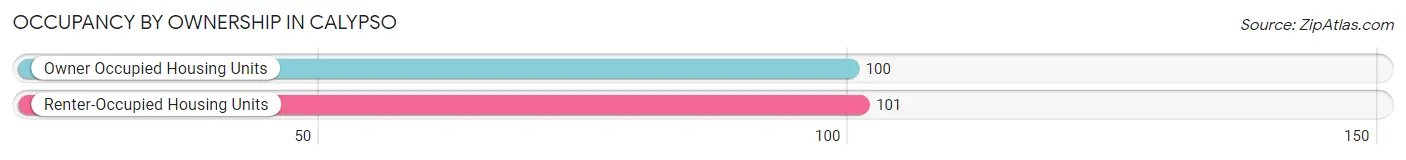
| Occupancy | # Housing Units | % Housing Units |
| Owner Occupied Housing Units | 100 | 49.7% |
| Renter-Occupied Housing Units | 101 | 50.2% |
| Total Occupied Housing Units | 201 | 100.0% |
Occupancy by Household Size in Calypso
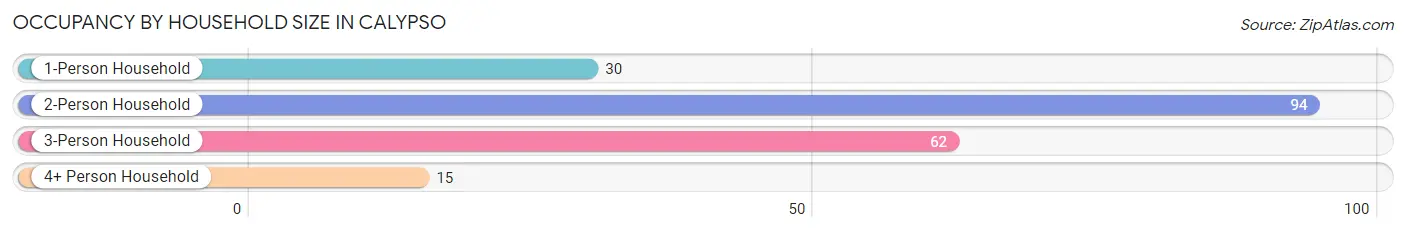
| Household Size | # Housing Units | % Housing Units |
| 1-Person Household | 30 | 14.9% |
| 2-Person Household | 94 | 46.8% |
| 3-Person Household | 62 | 30.8% |
| 4+ Person Household | 15 | 7.5% |
| Total Housing Units | 201 | 100.0% |
Occupancy by Ownership by Household Size in Calypso
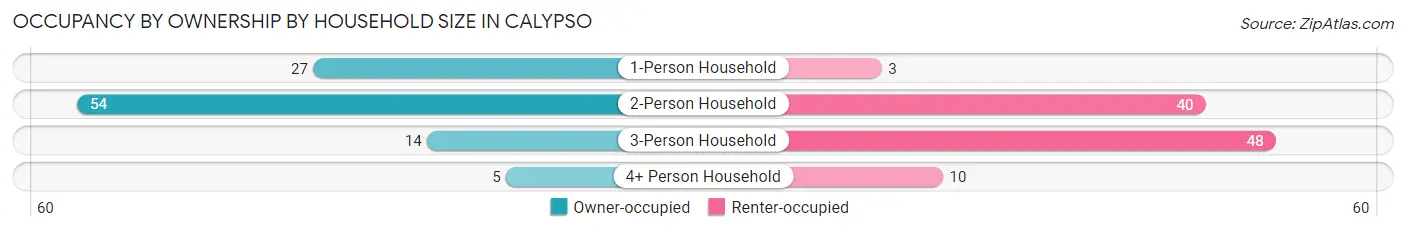
| Household Size | Owner-occupied | Renter-occupied |
| 1-Person Household | 27 (90.0%) | 3 (10.0%) |
| 2-Person Household | 54 (57.5%) | 40 (42.5%) |
| 3-Person Household | 14 (22.6%) | 48 (77.4%) |
| 4+ Person Household | 5 (33.3%) | 10 (66.7%) |
| Total Housing Units | 100 (49.7%) | 101 (50.2%) |
Occupancy by Educational Attainment in Calypso
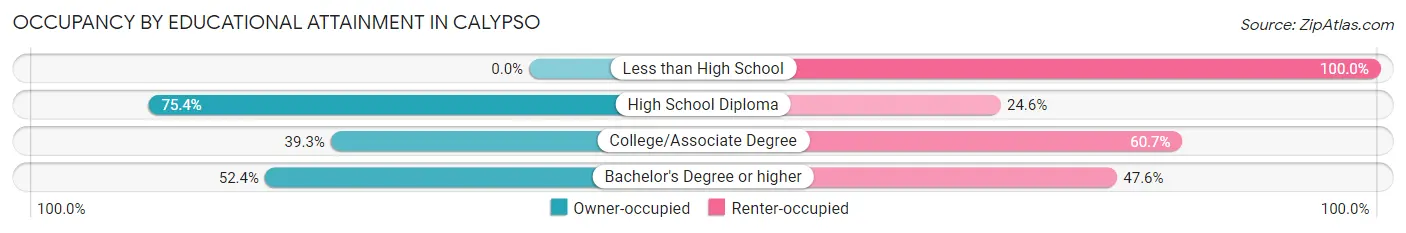
| Household Size | Owner-occupied | Renter-occupied |
| Less than High School | 0 (0.0%) | 6 (100.0%) |
| High School Diploma | 43 (75.4%) | 14 (24.6%) |
| College/Associate Degree | 46 (39.3%) | 71 (60.7%) |
| Bachelor's Degree or higher | 11 (52.4%) | 10 (47.6%) |
Occupancy by Age of Householder in Calypso
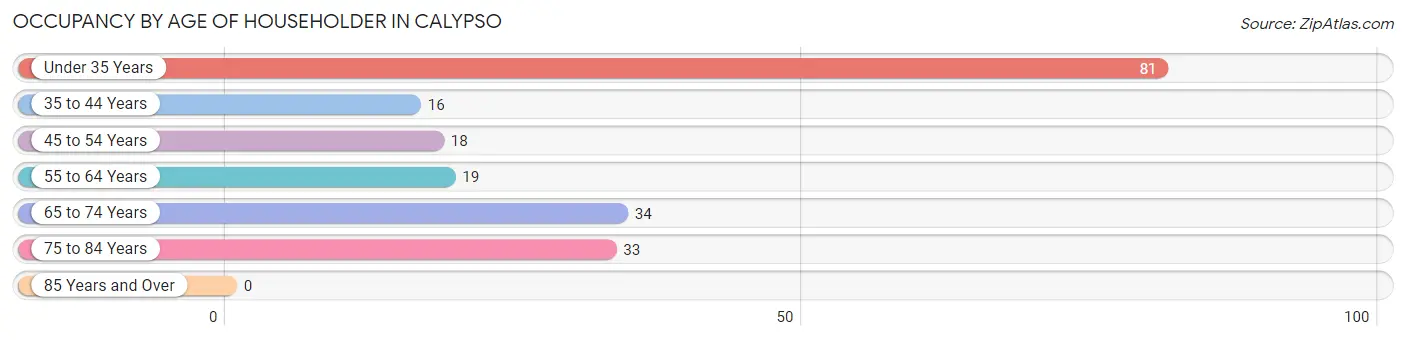
| Age Bracket | # Households | % Households |
| Under 35 Years | 81 | 40.3% |
| 35 to 44 Years | 16 | 8.0% |
| 45 to 54 Years | 18 | 9.0% |
| 55 to 64 Years | 19 | 9.5% |
| 65 to 74 Years | 34 | 16.9% |
| 75 to 84 Years | 33 | 16.4% |
| 85 Years and Over | 0 | 0.0% |
| Total | 201 | 100.0% |
Housing Finances in Calypso
Median Income by Occupancy in Calypso
| Occupancy Type | # Households | Median Income |
| Owner-Occupied | 100 (49.7%) | $0 |
| Renter-Occupied | 101 (50.2%) | $0 |
| Average | 201 (100.0%) | $0 |
Occupancy by Householder Income Bracket in Calypso
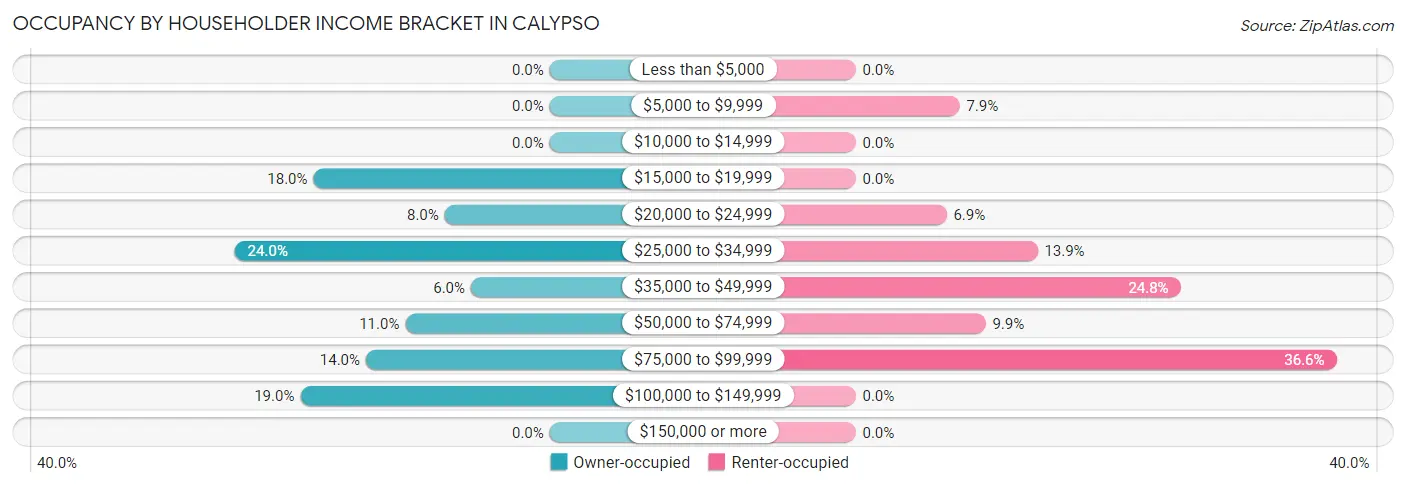
| Income Bracket | Owner-occupied | Renter-occupied |
| Less than $5,000 | 0 (0.0%) | 0 (0.0%) |
| $5,000 to $9,999 | 0 (0.0%) | 8 (7.9%) |
| $10,000 to $14,999 | 0 (0.0%) | 0 (0.0%) |
| $15,000 to $19,999 | 18 (18.0%) | 0 (0.0%) |
| $20,000 to $24,999 | 8 (8.0%) | 7 (6.9%) |
| $25,000 to $34,999 | 24 (24.0%) | 14 (13.9%) |
| $35,000 to $49,999 | 6 (6.0%) | 25 (24.7%) |
| $50,000 to $74,999 | 11 (11.0%) | 10 (9.9%) |
| $75,000 to $99,999 | 14 (14.0%) | 37 (36.6%) |
| $100,000 to $149,999 | 19 (19.0%) | 0 (0.0%) |
| $150,000 or more | 0 (0.0%) | 0 (0.0%) |
| Total | 100 (100.0%) | 101 (100.0%) |
Monthly Housing Cost Tiers in Calypso
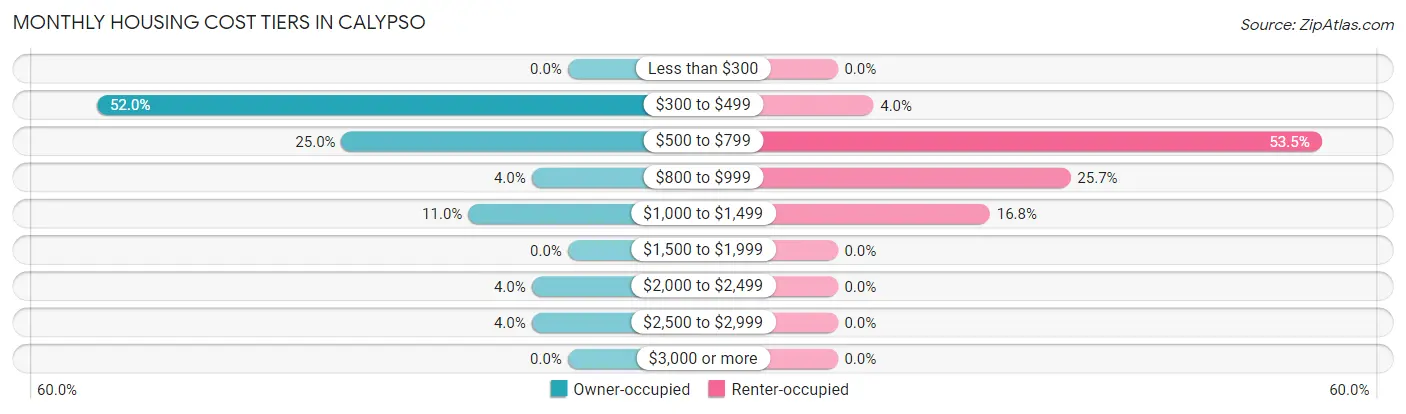
| Monthly Cost | Owner-occupied | Renter-occupied |
| Less than $300 | 0 (0.0%) | 0 (0.0%) |
| $300 to $499 | 52 (52.0%) | 4 (4.0%) |
| $500 to $799 | 25 (25.0%) | 54 (53.5%) |
| $800 to $999 | 4 (4.0%) | 26 (25.7%) |
| $1,000 to $1,499 | 11 (11.0%) | 17 (16.8%) |
| $1,500 to $1,999 | 0 (0.0%) | 0 (0.0%) |
| $2,000 to $2,499 | 4 (4.0%) | 0 (0.0%) |
| $2,500 to $2,999 | 4 (4.0%) | 0 (0.0%) |
| $3,000 or more | 0 (0.0%) | 0 (0.0%) |
| Total | 100 (100.0%) | 101 (100.0%) |
Physical Housing Characteristics in Calypso
Housing Structures in Calypso
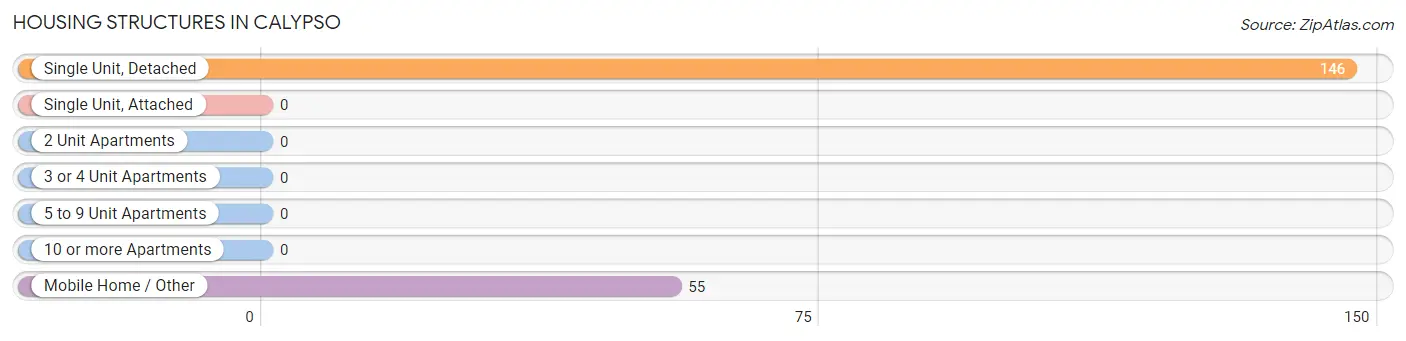
| Structure Type | # Housing Units | % Housing Units |
| Single Unit, Detached | 146 | 72.6% |
| Single Unit, Attached | 0 | 0.0% |
| 2 Unit Apartments | 0 | 0.0% |
| 3 or 4 Unit Apartments | 0 | 0.0% |
| 5 to 9 Unit Apartments | 0 | 0.0% |
| 10 or more Apartments | 0 | 0.0% |
| Mobile Home / Other | 55 | 27.4% |
| Total | 201 | 100.0% |
Housing Structures by Occupancy in Calypso
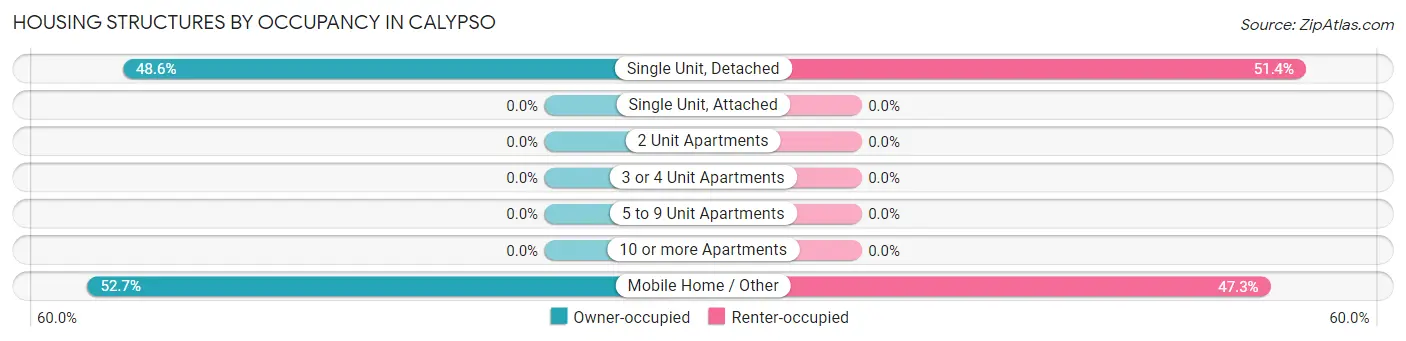
| Structure Type | Owner-occupied | Renter-occupied |
| Single Unit, Detached | 71 (48.6%) | 75 (51.4%) |
| Single Unit, Attached | 0 (0.0%) | 0 (0.0%) |
| 2 Unit Apartments | 0 (0.0%) | 0 (0.0%) |
| 3 or 4 Unit Apartments | 0 (0.0%) | 0 (0.0%) |
| 5 to 9 Unit Apartments | 0 (0.0%) | 0 (0.0%) |
| 10 or more Apartments | 0 (0.0%) | 0 (0.0%) |
| Mobile Home / Other | 29 (52.7%) | 26 (47.3%) |
| Total | 100 (49.7%) | 101 (50.2%) |
Housing Structures by Number of Rooms in Calypso
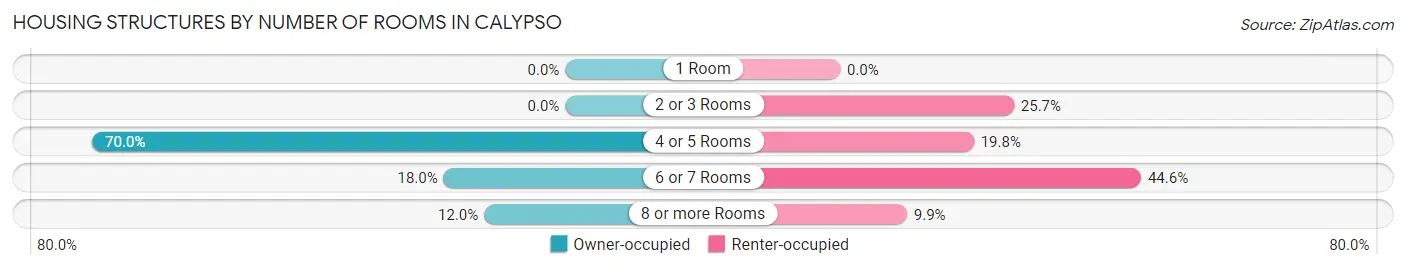
| Number of Rooms | Owner-occupied | Renter-occupied |
| 1 Room | 0 (0.0%) | 0 (0.0%) |
| 2 or 3 Rooms | 0 (0.0%) | 26 (25.7%) |
| 4 or 5 Rooms | 70 (70.0%) | 20 (19.8%) |
| 6 or 7 Rooms | 18 (18.0%) | 45 (44.6%) |
| 8 or more Rooms | 12 (12.0%) | 10 (9.9%) |
| Total | 100 (100.0%) | 101 (100.0%) |
Housing Structure by Heating Type in Calypso
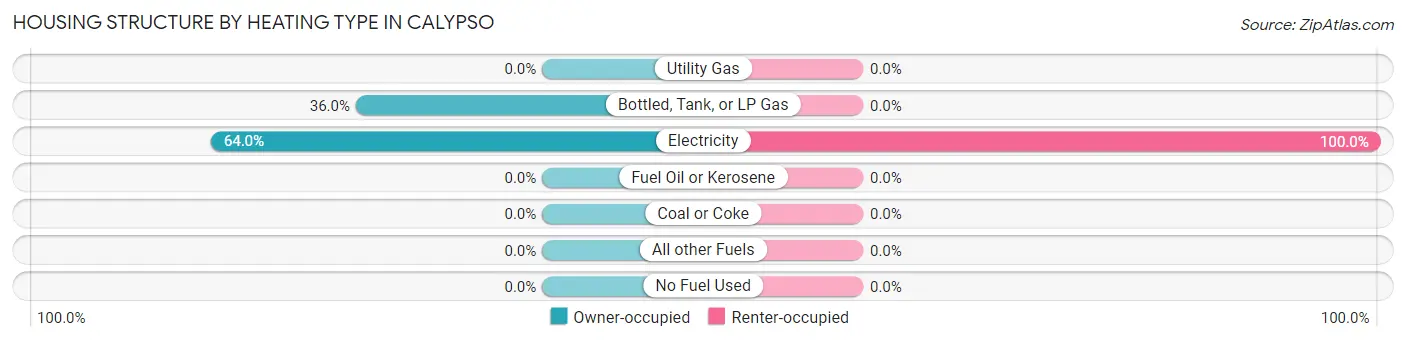
| Heating Type | Owner-occupied | Renter-occupied |
| Utility Gas | 0 (0.0%) | 0 (0.0%) |
| Bottled, Tank, or LP Gas | 36 (36.0%) | 0 (0.0%) |
| Electricity | 64 (64.0%) | 101 (100.0%) |
| Fuel Oil or Kerosene | 0 (0.0%) | 0 (0.0%) |
| Coal or Coke | 0 (0.0%) | 0 (0.0%) |
| All other Fuels | 0 (0.0%) | 0 (0.0%) |
| No Fuel Used | 0 (0.0%) | 0 (0.0%) |
| Total | 100 (100.0%) | 101 (100.0%) |
Household Vehicle Usage in Calypso
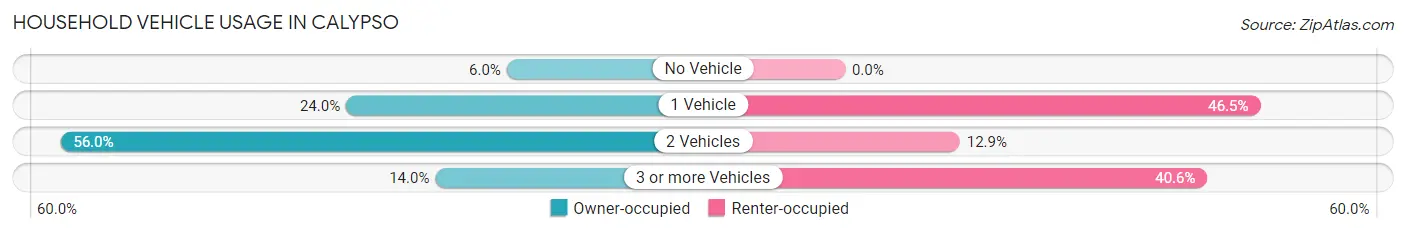
| Vehicles per Household | Owner-occupied | Renter-occupied |
| No Vehicle | 6 (6.0%) | 0 (0.0%) |
| 1 Vehicle | 24 (24.0%) | 47 (46.5%) |
| 2 Vehicles | 56 (56.0%) | 13 (12.9%) |
| 3 or more Vehicles | 14 (14.0%) | 41 (40.6%) |
| Total | 100 (100.0%) | 101 (100.0%) |
Real Estate & Mortgages in Calypso
Real Estate and Mortgage Overview in Calypso
| Characteristic | Without Mortgage | With Mortgage |
| Housing Units | 80 | 20 |
| Median Property Value | $70,000 | $125,000 |
| Median Household Income | - | - |
| Monthly Housing Costs | $388 | $0 |
| Real Estate Taxes | $558 | $0 |
Property Value by Mortgage Status in Calypso
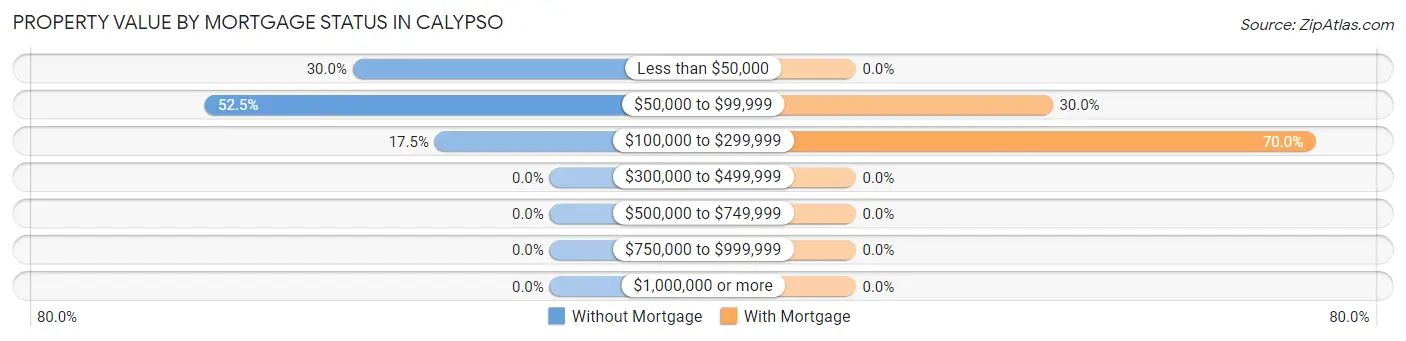
| Property Value | Without Mortgage | With Mortgage |
| Less than $50,000 | 24 (30.0%) | 0 (0.0%) |
| $50,000 to $99,999 | 42 (52.5%) | 6 (30.0%) |
| $100,000 to $299,999 | 14 (17.5%) | 14 (70.0%) |
| $300,000 to $499,999 | 0 (0.0%) | 0 (0.0%) |
| $500,000 to $749,999 | 0 (0.0%) | 0 (0.0%) |
| $750,000 to $999,999 | 0 (0.0%) | 0 (0.0%) |
| $1,000,000 or more | 0 (0.0%) | 0 (0.0%) |
| Total | 80 (100.0%) | 20 (100.0%) |
Household Income by Mortgage Status in Calypso
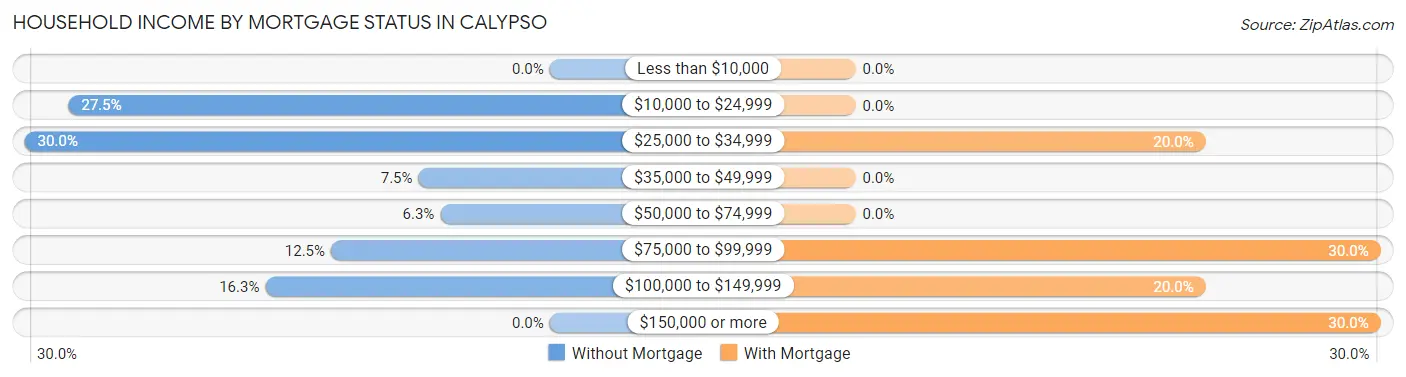
| Household Income | Without Mortgage | With Mortgage |
| Less than $10,000 | 0 (0.0%) | 0 (0.0%) |
| $10,000 to $24,999 | 22 (27.5%) | 0 (0.0%) |
| $25,000 to $34,999 | 24 (30.0%) | 4 (20.0%) |
| $35,000 to $49,999 | 6 (7.5%) | 0 (0.0%) |
| $50,000 to $74,999 | 5 (6.2%) | 0 (0.0%) |
| $75,000 to $99,999 | 10 (12.5%) | 6 (30.0%) |
| $100,000 to $149,999 | 13 (16.3%) | 4 (20.0%) |
| $150,000 or more | 0 (0.0%) | 6 (30.0%) |
| Total | 80 (100.0%) | 20 (100.0%) |
Property Value to Household Income Ratio in Calypso
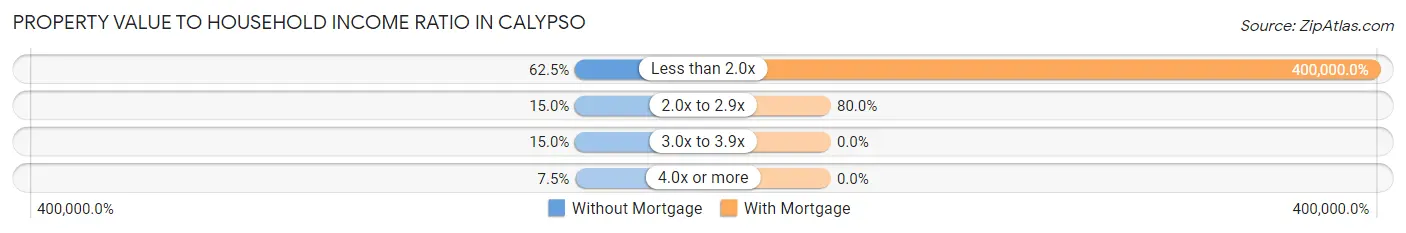
| Value-to-Income Ratio | Without Mortgage | With Mortgage |
| Less than 2.0x | 50 (62.5%) | 80,000 (400,000.0%) |
| 2.0x to 2.9x | 12 (15.0%) | 16 (80.0%) |
| 3.0x to 3.9x | 12 (15.0%) | 0 (0.0%) |
| 4.0x or more | 6 (7.5%) | 0 (0.0%) |
| Total | 80 (100.0%) | 20 (100.0%) |
Real Estate Taxes by Mortgage Status in Calypso
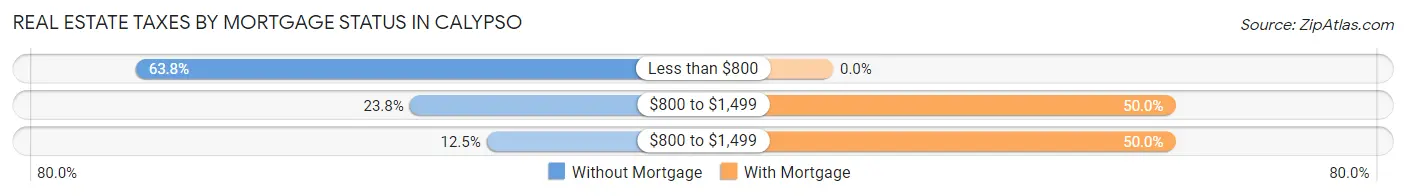
| Property Taxes | Without Mortgage | With Mortgage |
| Less than $800 | 51 (63.7%) | 0 (0.0%) |
| $800 to $1,499 | 19 (23.7%) | 10 (50.0%) |
| $800 to $1,499 | 10 (12.5%) | 10 (50.0%) |
| Total | 80 (100.0%) | 20 (100.0%) |
Health & Disability in Calypso
Health Insurance Coverage by Age in Calypso
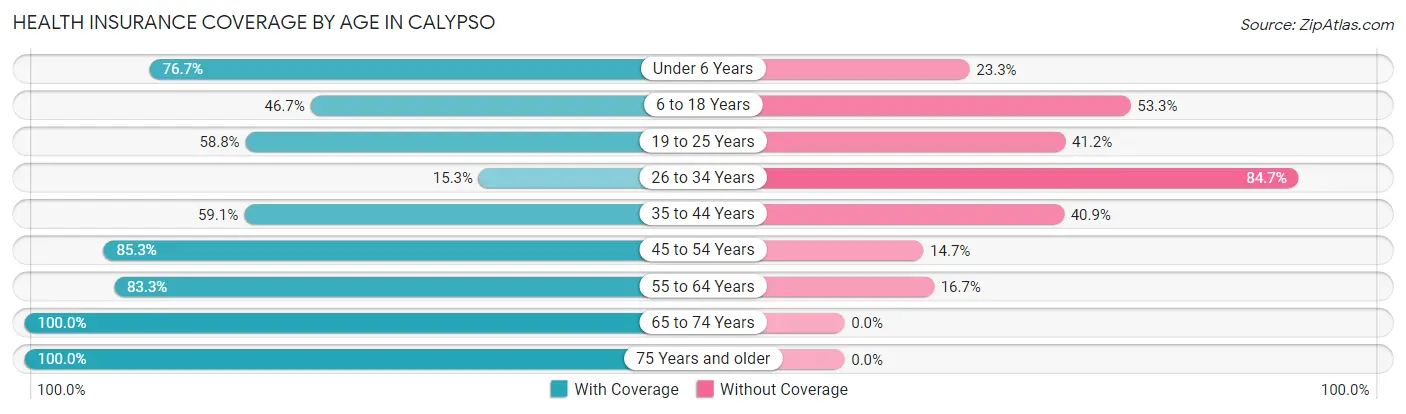
| Age Bracket | With Coverage | Without Coverage |
| Under 6 Years | 23 (76.7%) | 7 (23.3%) |
| 6 to 18 Years | 14 (46.7%) | 16 (53.3%) |
| 19 to 25 Years | 60 (58.8%) | 42 (41.2%) |
| 26 to 34 Years | 13 (15.3%) | 72 (84.7%) |
| 35 to 44 Years | 13 (59.1%) | 9 (40.9%) |
| 45 to 54 Years | 29 (85.3%) | 5 (14.7%) |
| 55 to 64 Years | 20 (83.3%) | 4 (16.7%) |
| 65 to 74 Years | 48 (100.0%) | 0 (0.0%) |
| 75 Years and older | 54 (100.0%) | 0 (0.0%) |
| Total | 274 (63.9%) | 155 (36.1%) |
Health Insurance Coverage by Citizenship Status in Calypso
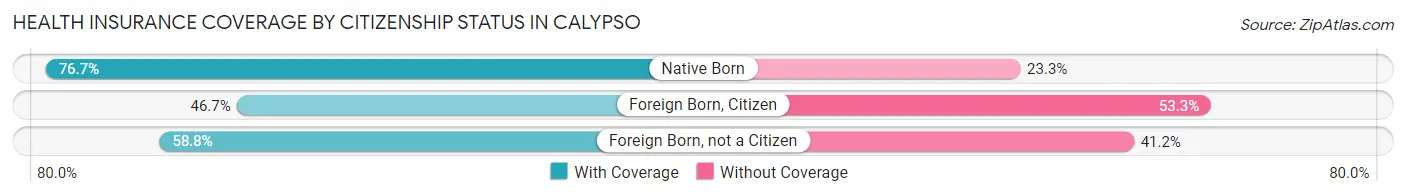
| Citizenship Status | With Coverage | Without Coverage |
| Native Born | 23 (76.7%) | 7 (23.3%) |
| Foreign Born, Citizen | 14 (46.7%) | 16 (53.3%) |
| Foreign Born, not a Citizen | 60 (58.8%) | 42 (41.2%) |
Health Insurance Coverage by Household Income in Calypso
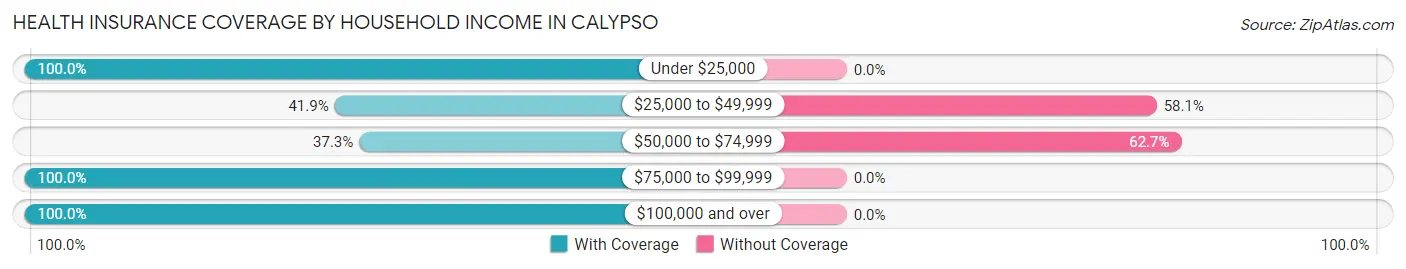
| Household Income | With Coverage | Without Coverage |
| Under $25,000 | 58 (100.0%) | 0 (0.0%) |
| $25,000 to $49,999 | 78 (41.9%) | 108 (58.1%) |
| $50,000 to $74,999 | 28 (37.3%) | 47 (62.7%) |
| $75,000 to $99,999 | 72 (100.0%) | 0 (0.0%) |
| $100,000 and over | 38 (100.0%) | 0 (0.0%) |
Public vs Private Health Insurance Coverage by Age in Calypso
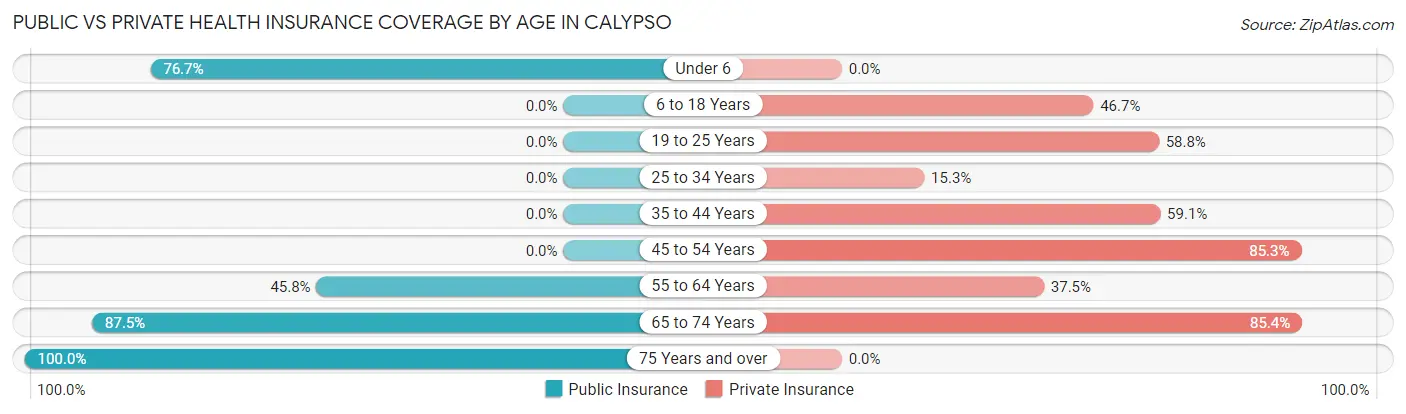
| Age Bracket | Public Insurance | Private Insurance |
| Under 6 | 23 (76.7%) | 0 (0.0%) |
| 6 to 18 Years | 0 (0.0%) | 14 (46.7%) |
| 19 to 25 Years | 0 (0.0%) | 60 (58.8%) |
| 25 to 34 Years | 0 (0.0%) | 13 (15.3%) |
| 35 to 44 Years | 0 (0.0%) | 13 (59.1%) |
| 45 to 54 Years | 0 (0.0%) | 29 (85.3%) |
| 55 to 64 Years | 11 (45.8%) | 9 (37.5%) |
| 65 to 74 Years | 42 (87.5%) | 41 (85.4%) |
| 75 Years and over | 54 (100.0%) | 0 (0.0%) |
| Total | 130 (30.3%) | 179 (41.7%) |
Disability Status by Sex by Age in Calypso
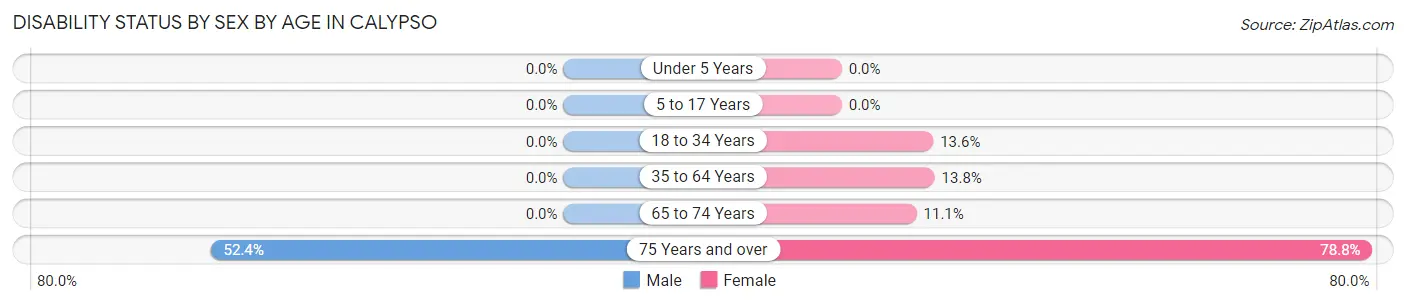
| Age Bracket | Male | Female |
| Under 5 Years | 0 (0.0%) | 0 (0.0%) |
| 5 to 17 Years | 0 (0.0%) | 0 (0.0%) |
| 18 to 34 Years | 0 (0.0%) | 11 (13.6%) |
| 35 to 64 Years | 0 (0.0%) | 4 (13.8%) |
| 65 to 74 Years | 0 (0.0%) | 4 (11.1%) |
| 75 Years and over | 11 (52.4%) | 26 (78.8%) |
Disability Class by Sex by Age in Calypso
Disability Class: Hearing Difficulty
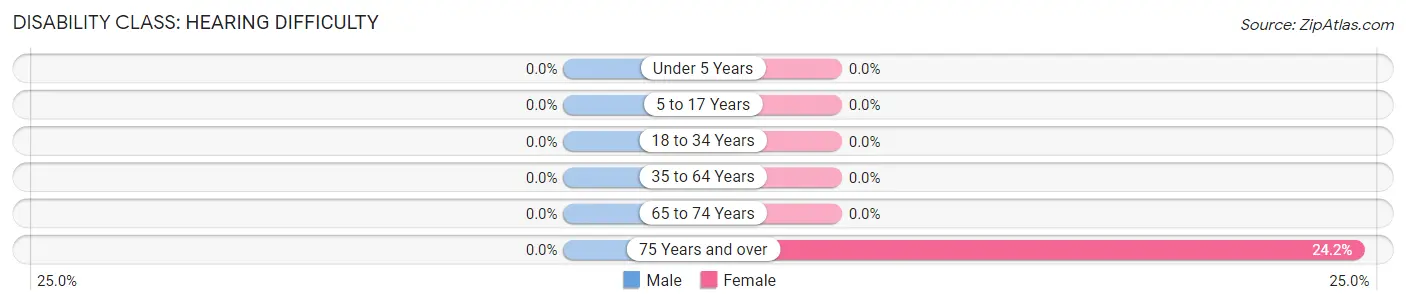
| Age Bracket | Male | Female |
| Under 5 Years | 0 (0.0%) | 0 (0.0%) |
| 5 to 17 Years | 0 (0.0%) | 0 (0.0%) |
| 18 to 34 Years | 0 (0.0%) | 0 (0.0%) |
| 35 to 64 Years | 0 (0.0%) | 0 (0.0%) |
| 65 to 74 Years | 0 (0.0%) | 0 (0.0%) |
| 75 Years and over | 0 (0.0%) | 8 (24.2%) |
Disability Class: Vision Difficulty
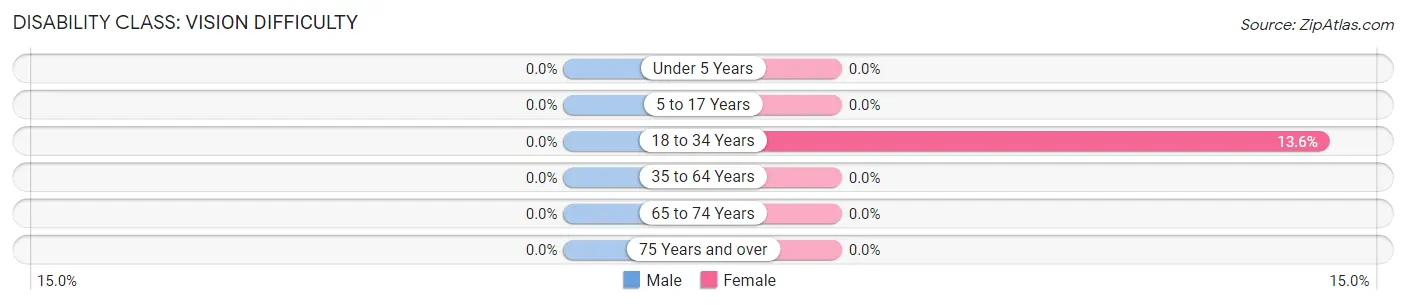
| Age Bracket | Male | Female |
| Under 5 Years | 0 (0.0%) | 0 (0.0%) |
| 5 to 17 Years | 0 (0.0%) | 0 (0.0%) |
| 18 to 34 Years | 0 (0.0%) | 11 (13.6%) |
| 35 to 64 Years | 0 (0.0%) | 0 (0.0%) |
| 65 to 74 Years | 0 (0.0%) | 0 (0.0%) |
| 75 Years and over | 0 (0.0%) | 0 (0.0%) |
Disability Class: Cognitive Difficulty
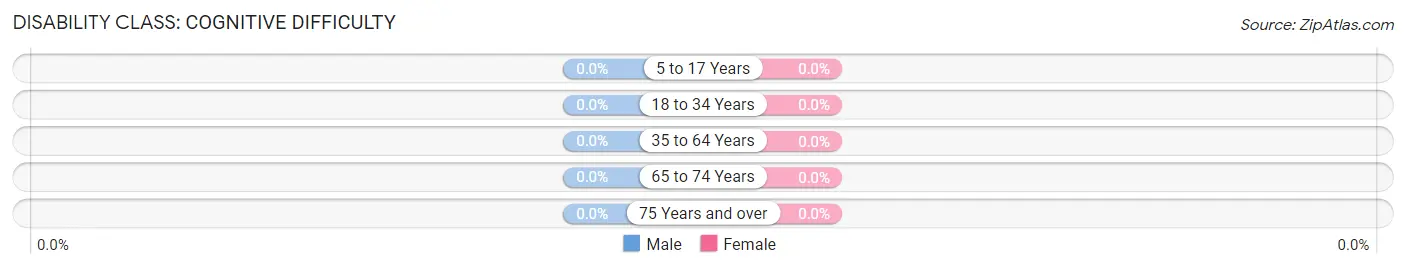
| Age Bracket | Male | Female |
| 5 to 17 Years | 0 (0.0%) | 0 (0.0%) |
| 18 to 34 Years | 0 (0.0%) | 0 (0.0%) |
| 35 to 64 Years | 0 (0.0%) | 0 (0.0%) |
| 65 to 74 Years | 0 (0.0%) | 0 (0.0%) |
| 75 Years and over | 0 (0.0%) | 0 (0.0%) |
Disability Class: Ambulatory Difficulty
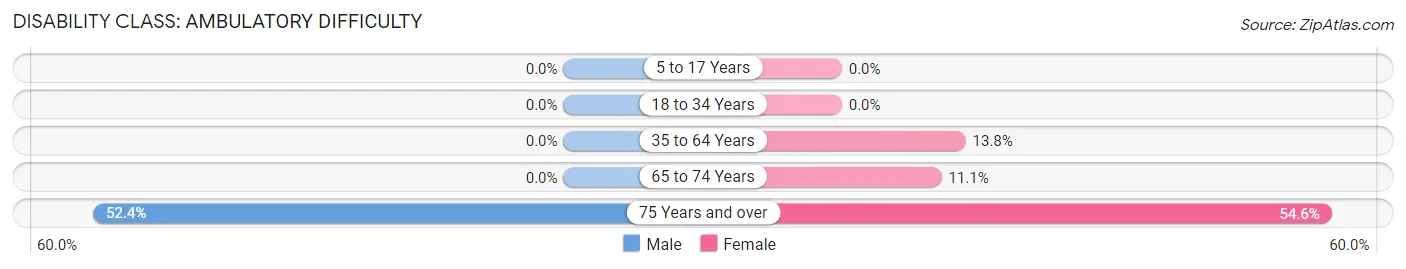
| Age Bracket | Male | Female |
| 5 to 17 Years | 0 (0.0%) | 0 (0.0%) |
| 18 to 34 Years | 0 (0.0%) | 0 (0.0%) |
| 35 to 64 Years | 0 (0.0%) | 4 (13.8%) |
| 65 to 74 Years | 0 (0.0%) | 4 (11.1%) |
| 75 Years and over | 11 (52.4%) | 18 (54.5%) |
Disability Class: Self-Care Difficulty
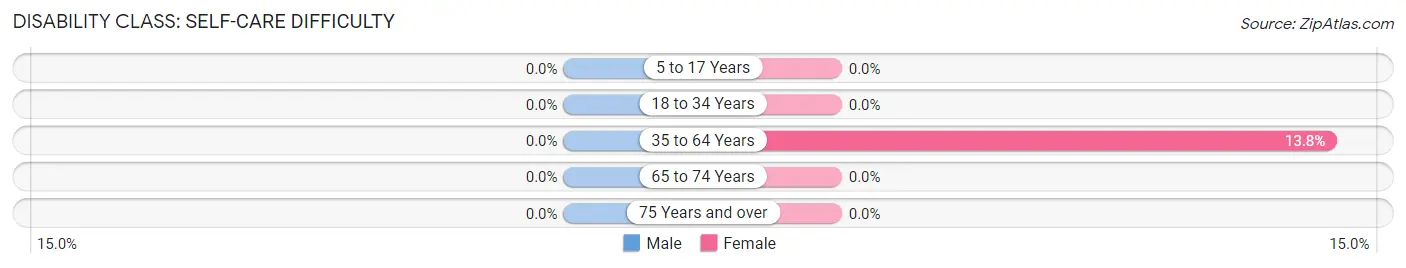
| Age Bracket | Male | Female |
| 5 to 17 Years | 0 (0.0%) | 0 (0.0%) |
| 18 to 34 Years | 0 (0.0%) | 0 (0.0%) |
| 35 to 64 Years | 0 (0.0%) | 4 (13.8%) |
| 65 to 74 Years | 0 (0.0%) | 0 (0.0%) |
| 75 Years and over | 0 (0.0%) | 0 (0.0%) |
Technology Access in Calypso
Computing Device Access in Calypso
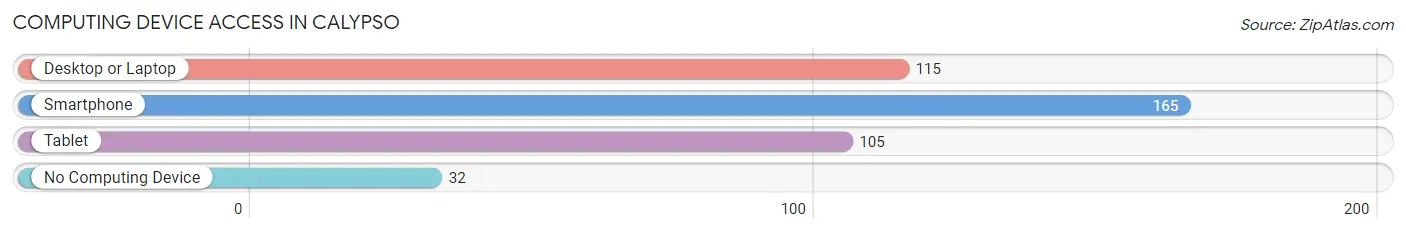
| Device Type | # Households | % Households |
| Desktop or Laptop | 115 | 57.2% |
| Smartphone | 165 | 82.1% |
| Tablet | 105 | 52.2% |
| No Computing Device | 32 | 15.9% |
| Total | 201 | 100.0% |
Internet Access in Calypso
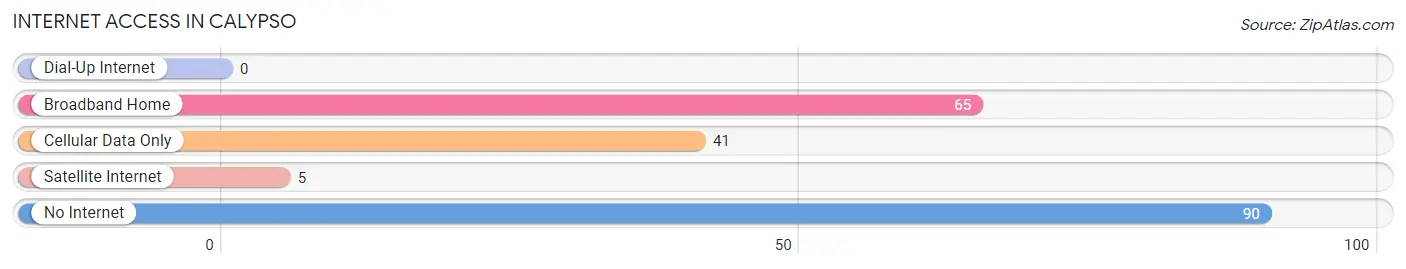
| Internet Type | # Households | % Households |
| Dial-Up Internet | 0 | 0.0% |
| Broadband Home | 65 | 32.3% |
| Cellular Data Only | 41 | 20.4% |
| Satellite Internet | 5 | 2.5% |
| No Internet | 90 | 44.8% |
| Total | 201 | 100.0% |
Calypso Summary
Calypso, North Carolina is a small town located in Duplin County, in the southeastern part of the state. It is situated on the banks of the Northeast Cape Fear River, and is home to a population of approximately 1,500 people. The town was founded in 1891 and has a rich history of agriculture, industry, and commerce.
Geography
Calypso is located in the Coastal Plain region of North Carolina, and is situated on the banks of the Northeast Cape Fear River. The town is surrounded by a number of small towns and villages, including Beulaville, Faison, and Wallace. The town is located approximately 30 miles from the city of Wilmington, and is within a two-hour drive of the cities of Raleigh and Charlotte.
The town is situated on a flat plain, with an elevation of approximately 50 feet above sea level. The climate in Calypso is humid subtropical, with hot, humid summers and mild winters. The average annual temperature is around 70 degrees Fahrenheit, and the average annual precipitation is around 50 inches.
Economy
Calypso’s economy is largely based on agriculture and industry. The town is home to a number of farms, which produce a variety of crops, including corn, soybeans, cotton, and tobacco. The town is also home to a number of manufacturing and industrial businesses, including a paper mill, a furniture factory, and a plastics plant.
The town is also home to a number of small businesses, including restaurants, retail stores, and service providers. The town is served by a number of local banks, and is home to a branch of the First Bank of North Carolina.
Demographics
As of the 2010 census, the population of Calypso was 1,500. The racial makeup of the town was 79.2% White, 17.3% African American, 0.7% Native American, 0.7% Asian, and 2.1% from other races. The median household income was $30,938, and the median family income was $37,813.
The town is served by the Duplin County School System, which includes Calypso Elementary School, Calypso Middle School, and Calypso High School. The town is also home to a number of churches, including Calypso Baptist Church, Calypso United Methodist Church, and Calypso Presbyterian Church.
Conclusion
Calypso, North Carolina is a small town located in Duplin County, in the southeastern part of the state. It is situated on the banks of the Northeast Cape Fear River, and is home to a population of approximately 1,500 people. The town has a rich history of agriculture, industry, and commerce, and its economy is largely based on these industries. The town is also home to a number of small businesses, churches, and schools. The town has a diverse population, with a median household income of $30,938.
Common Questions
What is Per Capita Income in Calypso?
Per Capita income in Calypso is $27,608.
What is the Median Family Income in Calypso?
Median Family Income in Calypso is $70,250.
What is Inequality or Gini Index in Calypso?
Inequality or Gini Index in Calypso is 0.36.
What is the Total Population of Calypso?
Total Population of Calypso is 429.
What is the Total Male Population of Calypso?
Total Male Population of Calypso is 221.
What is the Total Female Population of Calypso?
Total Female Population of Calypso is 208.
What is the Ratio of Males per 100 Females in Calypso?
There are 106.25 Males per 100 Females in Calypso.
What is the Ratio of Females per 100 Males in Calypso?
There are 94.12 Females per 100 Males in Calypso.
What is the Median Population Age in Calypso?
Median Population Age in Calypso is 28.7 Years.
What is the Average Family Size in Calypso
Average Family Size in Calypso is 2.1 People.
What is the Average Household Size in Calypso
Average Household Size in Calypso is 2.1 People.
How Large is the Labor Force in Calypso?
There are 272 People in the Labor Forcein in Calypso.
What is the Percentage of People in the Labor Force in Calypso?
72.5% of People are in the Labor Force in Calypso.
What is the Unemployment Rate in Calypso?
Unemployment Rate in Calypso is 7.4%.