Silver City, NC Map & Demographics
Silver City Map
Silver City Overview
$10,579
PER CAPITA INCOME
$21,159
AVG HOUSEHOLD INCOME
0.42
INEQUALITY / GINI INDEX
819
TOTAL POPULATION
486
MALE POPULATION
333
FEMALE POPULATION
145.95
MALES / 100 FEMALES
68.52
FEMALES / 100 MALES
47.8
MEDIAN AGE
4.7
AVG FAMILY SIZE
2.2
AVG HOUSEHOLD SIZE
332
LABOR FORCE [ PEOPLE ]
55.6%
PERCENT IN LABOR FORCE
5.7%
UNEMPLOYMENT RATE
Income in Silver City
Income Overview in Silver City
| Characteristic | Number | Measure |
| Per Capita Income | 819 | $10,579 |
| Median Family Income | 91 | $0 |
| Mean Family Income | 91 | $17,358 |
| Median Household Income | 374 | $21,159 |
| Mean Household Income | 374 | $22,445 |
| Income Deficit | 91 | $0 |
| Wage / Income Gap (%) | 819 | 0.00% |
| Wage / Income Gap ($) | 819 | 100.00¢ per $1 |
| Gini / Inequality Index | 819 | 0.42 |
Earnings by Sex in Silver City
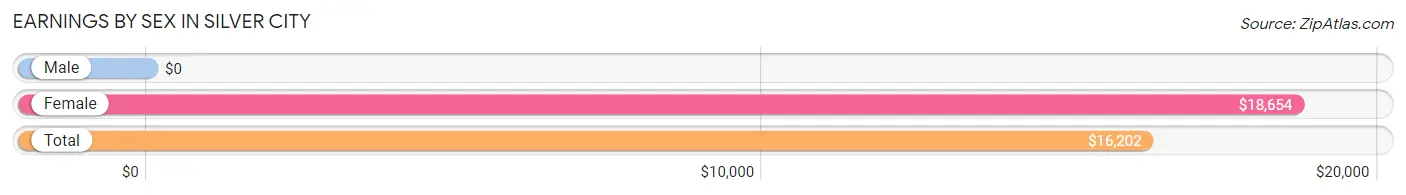
| Sex | Number | Average Earnings |
| Male | 191 (61.0%) | $0 |
| Female | 122 (39.0%) | $18,654 |
| Total | 313 (100.0%) | $16,202 |
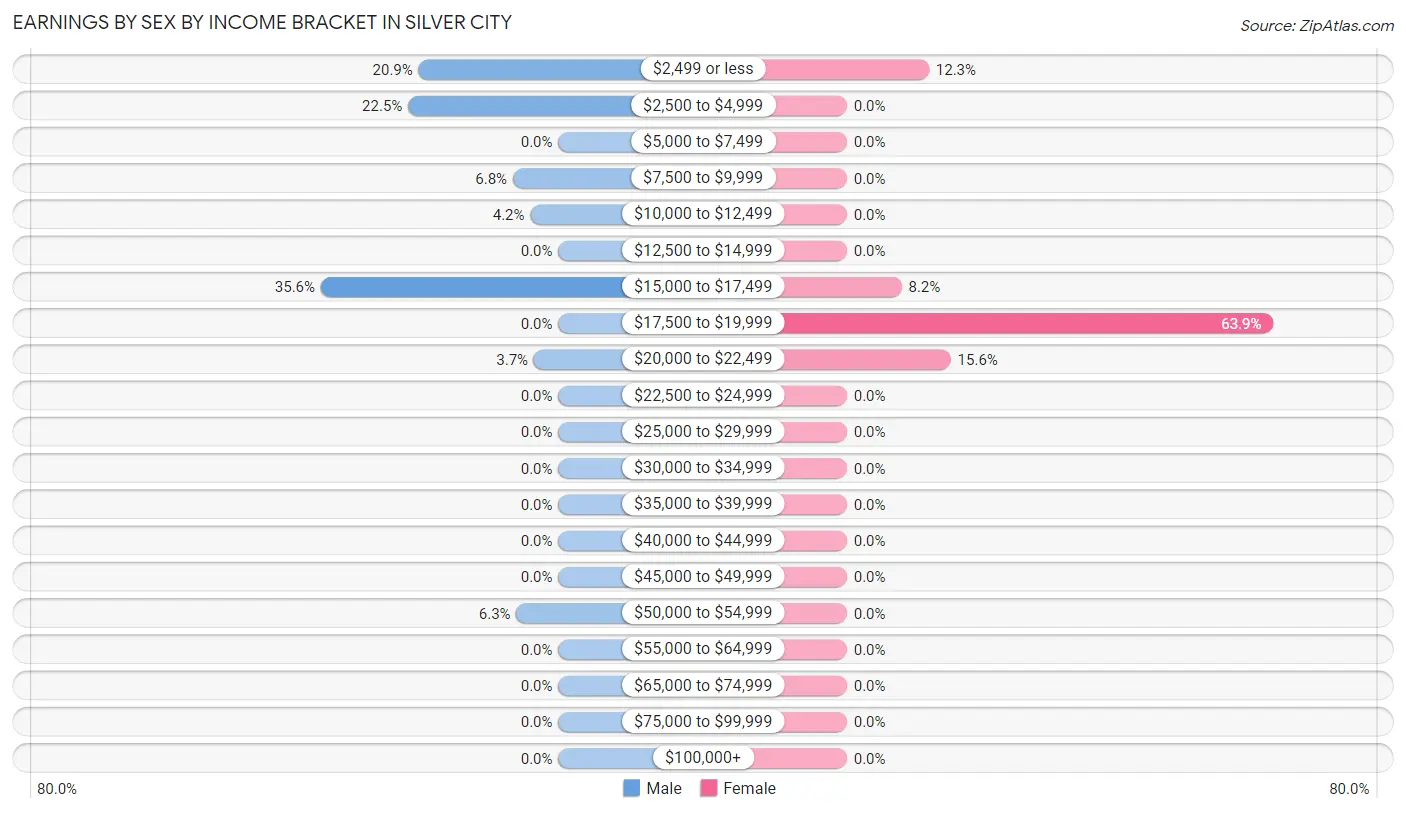
Earnings by Sex by Income Bracket in Silver City
The most common earnings brackets in Silver City are $15,000 to $17,499 for men (68 | 35.6%) and $17,500 to $19,999 for women (78 | 63.9%).
| Income | Male | Female |
| $2,499 or less | 40 (20.9%) | 15 (12.3%) |
| $2,500 to $4,999 | 43 (22.5%) | 0 (0.0%) |
| $5,000 to $7,499 | 0 (0.0%) | 0 (0.0%) |
| $7,500 to $9,999 | 13 (6.8%) | 0 (0.0%) |
| $10,000 to $12,499 | 8 (4.2%) | 0 (0.0%) |
| $12,500 to $14,999 | 0 (0.0%) | 0 (0.0%) |
| $15,000 to $17,499 | 68 (35.6%) | 10 (8.2%) |
| $17,500 to $19,999 | 0 (0.0%) | 78 (63.9%) |
| $20,000 to $22,499 | 7 (3.7%) | 19 (15.6%) |
| $22,500 to $24,999 | 0 (0.0%) | 0 (0.0%) |
| $25,000 to $29,999 | 0 (0.0%) | 0 (0.0%) |
| $30,000 to $34,999 | 0 (0.0%) | 0 (0.0%) |
| $35,000 to $39,999 | 0 (0.0%) | 0 (0.0%) |
| $40,000 to $44,999 | 0 (0.0%) | 0 (0.0%) |
| $45,000 to $49,999 | 0 (0.0%) | 0 (0.0%) |
| $50,000 to $54,999 | 12 (6.3%) | 0 (0.0%) |
| $55,000 to $64,999 | 0 (0.0%) | 0 (0.0%) |
| $65,000 to $74,999 | 0 (0.0%) | 0 (0.0%) |
| $75,000 to $99,999 | 0 (0.0%) | 0 (0.0%) |
| $100,000+ | 0 (0.0%) | 0 (0.0%) |
| Total | 191 (100.0%) | 122 (100.0%) |
Earnings by Sex by Educational Attainment in Silver City
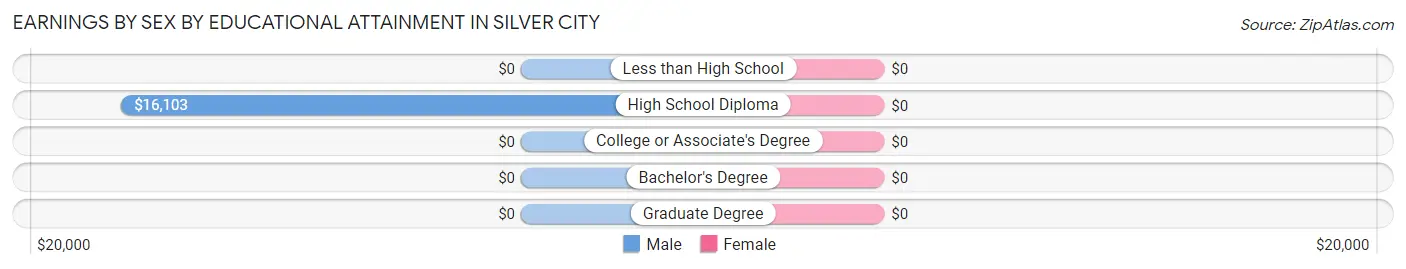
| Educational Attainment | Male Income | Female Income |
| Less than High School | - | - |
| High School Diploma | $16,103 | $0 |
| College or Associate's Degree | - | - |
| Bachelor's Degree | - | - |
| Graduate Degree | - | - |
| Total | - | - |
Family Income in Silver City
Family Income Brackets in Silver City
According to the Silver City family income data, there are 49 families falling into the less than $10,000 income range, which is the most common income bracket and makes up 53.8% of all families.

| Income Bracket | # Families | % Families |
| Less than $10,000 | 49 | 53.8% |
| $10,000 to $14,999 | 0 | 0.0% |
| $15,000 to $24,999 | 17 | 18.7% |
| $25,000 to $34,999 | 15 | 16.5% |
| $35,000 to $49,999 | 5 | 5.5% |
| $50,000 to $74,999 | 5 | 5.5% |
| $75,000 to $99,999 | 0 | 0.0% |
| $100,000 to $149,999 | 0 | 0.0% |
| $150,000 to $199,999 | 0 | 0.0% |
| $200,000+ | 0 | 0.0% |
Family Income by Famaliy Size in Silver City
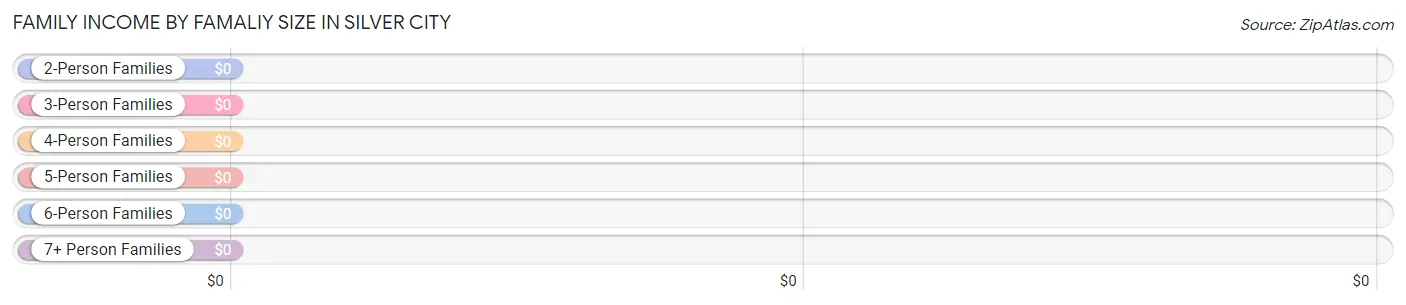
| Income Bracket | # Families | Median Income |
| 2-Person Families | 20 (22.0%) | $0 |
| 3-Person Families | 21 (23.1%) | $0 |
| 4-Person Families | 11 (12.1%) | $0 |
| 5-Person Families | 22 (24.2%) | $0 |
| 6-Person Families | 17 (18.7%) | $0 |
| 7+ Person Families | 0 (0.0%) | $0 |
| Total | 91 (100.0%) | $0 |
Family Income by Number of Earners in Silver City
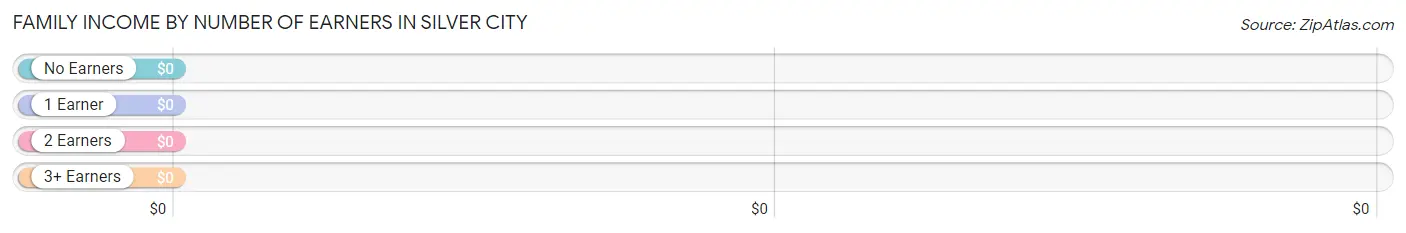
| Number of Earners | # Families | Median Income |
| No Earners | 48 (52.7%) | $0 |
| 1 Earner | 43 (47.2%) | $0 |
| 2 Earners | 0 (0.0%) | $0 |
| 3+ Earners | 0 (0.0%) | $0 |
| Total | 91 (100.0%) | $0 |
Household Income in Silver City
Household Income Brackets in Silver City
With 109 households falling in the category, the $25,000 to $34,999 income range is the most frequent in Silver City, accounting for 29.1% of all households.
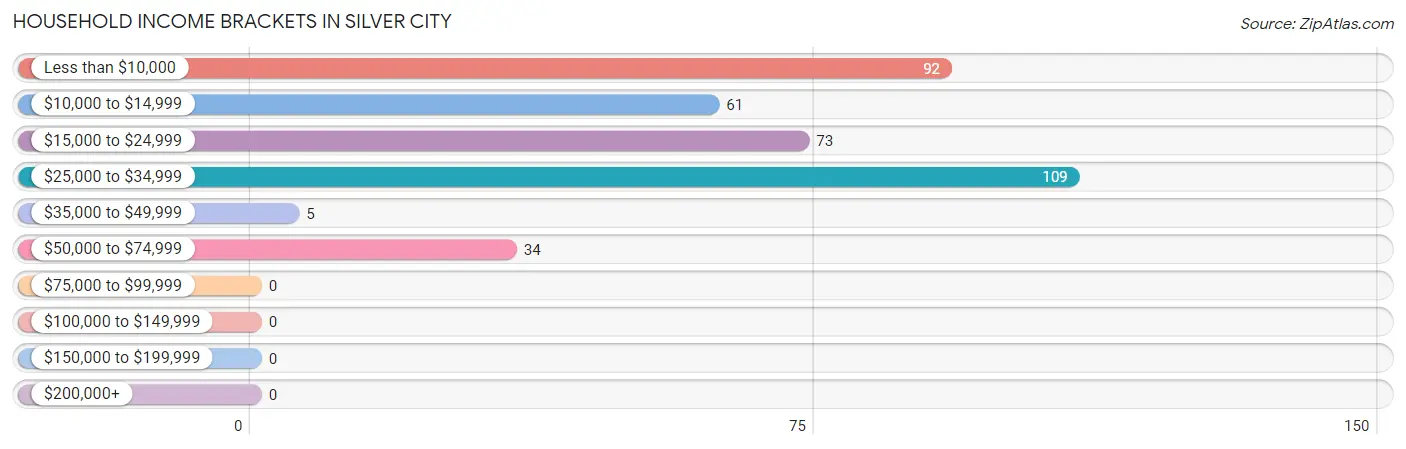
| Income Bracket | # Households | % Households |
| Less than $10,000 | 92 | 24.6% |
| $10,000 to $14,999 | 61 | 16.3% |
| $15,000 to $24,999 | 73 | 19.5% |
| $25,000 to $34,999 | 109 | 29.1% |
| $35,000 to $49,999 | 5 | 1.3% |
| $50,000 to $74,999 | 34 | 9.1% |
| $75,000 to $99,999 | 0 | 0.0% |
| $100,000 to $149,999 | 0 | 0.0% |
| $150,000 to $199,999 | 0 | 0.0% |
| $200,000+ | 0 | 0.0% |
Household Income by Householder Age in Silver City
The median household income in Silver City is $21,159, with the highest median household income of $30,735 found in the 65+ years age bracket for the primary householder. A total of 102 households (27.3%) fall into this category.
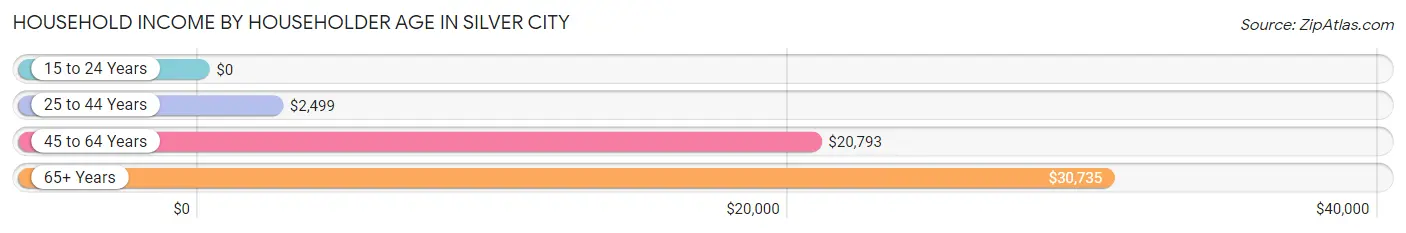
| Income Bracket | # Households | Median Income |
| 15 to 24 Years | 0 (0.0%) | $0 |
| 25 to 44 Years | 62 (16.6%) | $2,499 |
| 45 to 64 Years | 210 (56.1%) | $20,793 |
| 65+ Years | 102 (27.3%) | $30,735 |
| Total | 374 (100.0%) | $21,159 |
Poverty in Silver City
Income Below Poverty by Sex and Age in Silver City
With 64.2% poverty level for males and 58.0% for females among the residents of Silver City, under 5 year old males and 6 to 11 year old females are the most vulnerable to poverty, with 32 males (100.0%) and 49 females (100.0%) in their respective age groups living below the poverty level.
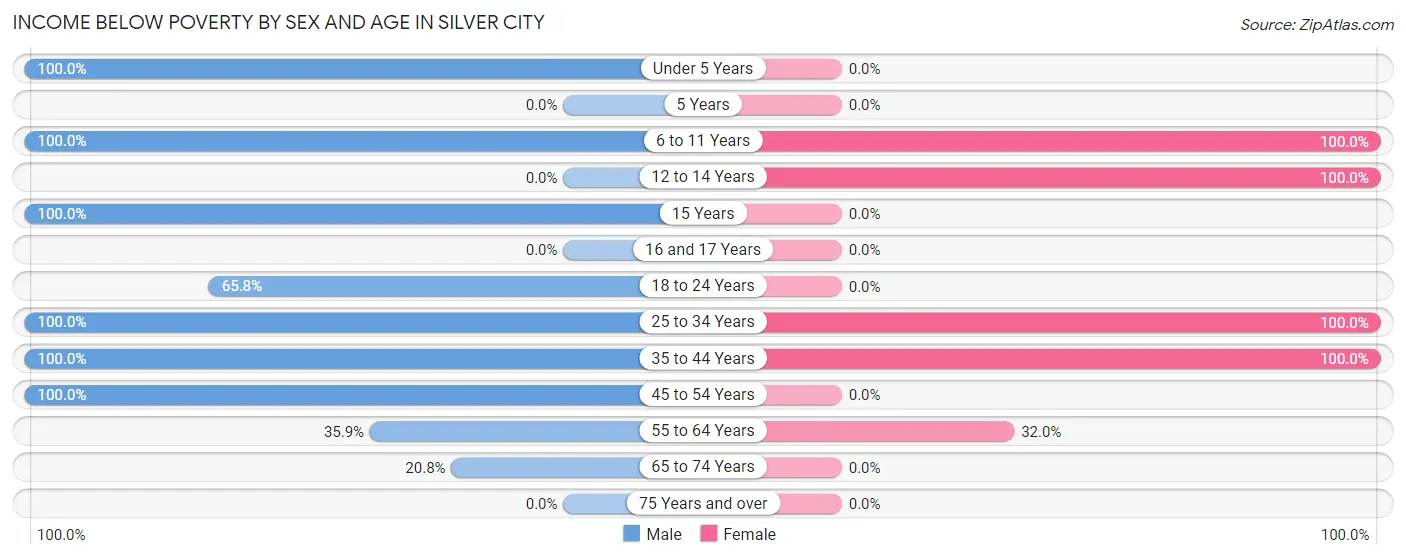
| Age Bracket | Male | Female |
| Under 5 Years | 32 (100.0%) | 0 (0.0%) |
| 5 Years | 0 (0.0%) | 0 (0.0%) |
| 6 to 11 Years | 115 (100.0%) | 49 (100.0%) |
| 12 to 14 Years | 0 (0.0%) | 13 (100.0%) |
| 15 Years | 13 (100.0%) | 0 (0.0%) |
| 16 and 17 Years | 0 (0.0%) | 0 (0.0%) |
| 18 to 24 Years | 25 (65.8%) | 0 (0.0%) |
| 25 to 34 Years | 24 (100.0%) | 41 (100.0%) |
| 35 to 44 Years | 29 (100.0%) | 42 (100.0%) |
| 45 to 54 Years | 16 (100.0%) | 0 (0.0%) |
| 55 to 64 Years | 42 (35.9%) | 48 (32.0%) |
| 65 to 74 Years | 16 (20.8%) | 0 (0.0%) |
| 75 Years and over | 0 (0.0%) | 0 (0.0%) |
| Total | 312 (64.2%) | 193 (58.0%) |
Income Above Poverty by Sex and Age in Silver City
According to the poverty statistics in Silver City, males aged 75 years and over and females aged 45 to 54 years are the age groups that are most secure financially, with 100.0% of males and 100.0% of females in these age groups living above the poverty line.
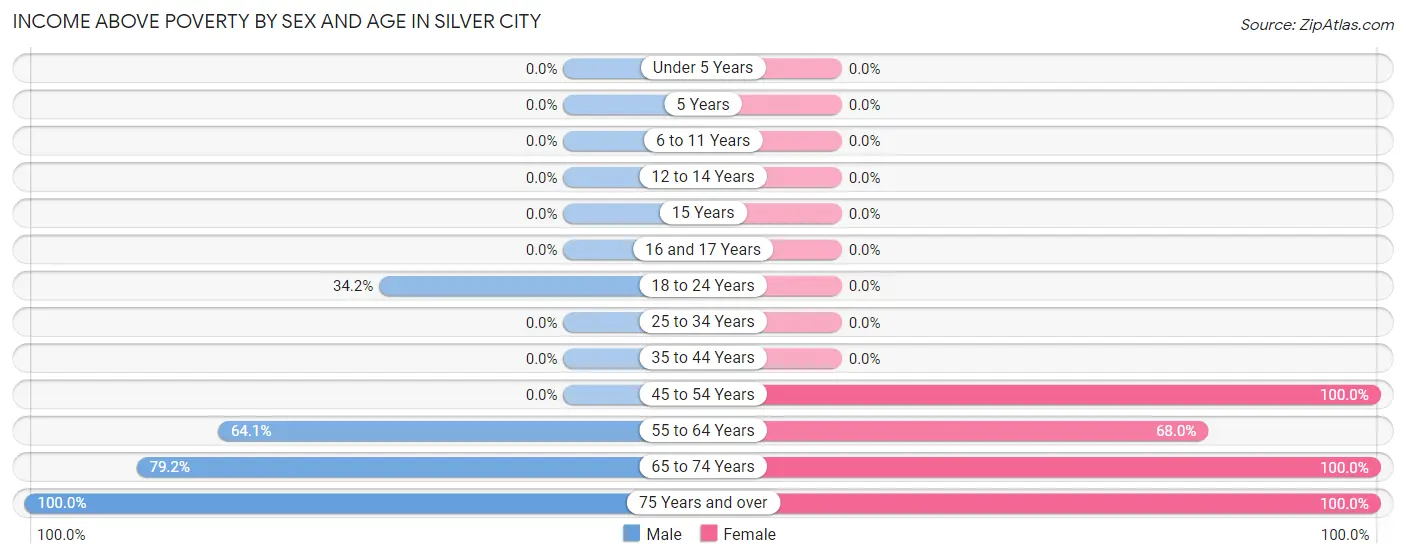
| Age Bracket | Male | Female |
| Under 5 Years | 0 (0.0%) | 0 (0.0%) |
| 5 Years | 0 (0.0%) | 0 (0.0%) |
| 6 to 11 Years | 0 (0.0%) | 0 (0.0%) |
| 12 to 14 Years | 0 (0.0%) | 0 (0.0%) |
| 15 Years | 0 (0.0%) | 0 (0.0%) |
| 16 and 17 Years | 0 (0.0%) | 0 (0.0%) |
| 18 to 24 Years | 13 (34.2%) | 0 (0.0%) |
| 25 to 34 Years | 0 (0.0%) | 0 (0.0%) |
| 35 to 44 Years | 0 (0.0%) | 0 (0.0%) |
| 45 to 54 Years | 0 (0.0%) | 19 (100.0%) |
| 55 to 64 Years | 75 (64.1%) | 102 (68.0%) |
| 65 to 74 Years | 61 (79.2%) | 5 (100.0%) |
| 75 Years and over | 25 (100.0%) | 14 (100.0%) |
| Total | 174 (35.8%) | 140 (42.0%) |
Income Below Poverty Among Married-Couple Families in Silver City
The poverty statistics for married-couple families in Silver City show that 65.5% or 38 of the total 58 families live below the poverty line. Families with 1 or 2 children have the highest poverty rate of 100.0%, comprising of 16 families. On the other hand, families with no children have the lowest poverty rate of 0.0%, which includes 0 families.
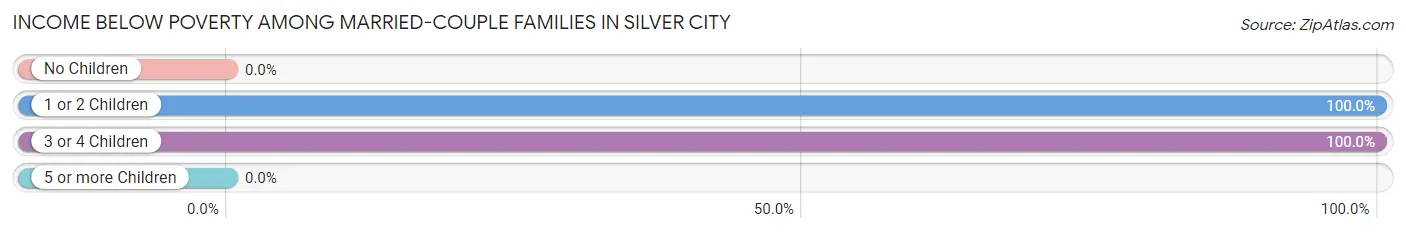
| Children | Above Poverty | Below Poverty |
| No Children | 20 (100.0%) | 0 (0.0%) |
| 1 or 2 Children | 0 (0.0%) | 16 (100.0%) |
| 3 or 4 Children | 0 (0.0%) | 22 (100.0%) |
| 5 or more Children | 0 (0.0%) | 0 (0.0%) |
| Total | 20 (34.5%) | 38 (65.5%) |
Income Below Poverty Among Single-Parent Households in Silver City
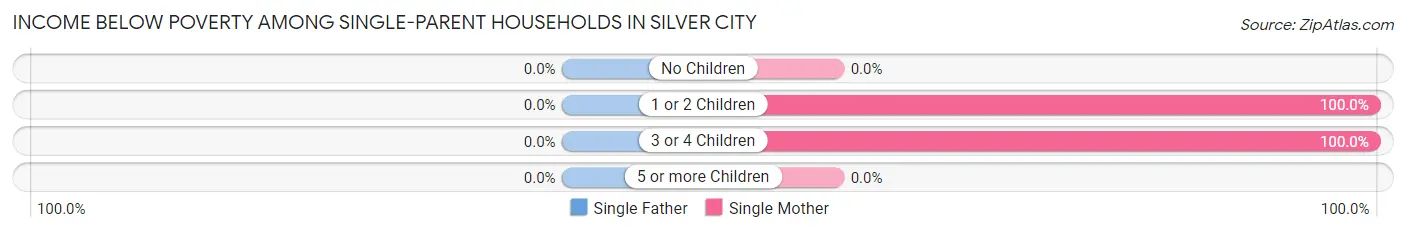
| Children | Single Father | Single Mother |
| No Children | 0 (0.0%) | 0 (0.0%) |
| 1 or 2 Children | 0 (0.0%) | 11 (100.0%) |
| 3 or 4 Children | 0 (0.0%) | 17 (100.0%) |
| 5 or more Children | 0 (0.0%) | 0 (0.0%) |
| Total | 0 (0.0%) | 28 (84.9%) |
Income Below Poverty Among Married-Couple vs Single-Parent Households in Silver City
The poverty data for Silver City shows that 38 of the married-couple family households (65.5%) and 28 of the single-parent households (84.9%) are living below the poverty level. Within the married-couple family households, those with 1 or 2 children have the highest poverty rate, with 16 households (100.0%) falling below the poverty line. Among the single-parent households, those with 1 or 2 children have the highest poverty rate, with 11 household (100.0%) living below poverty.
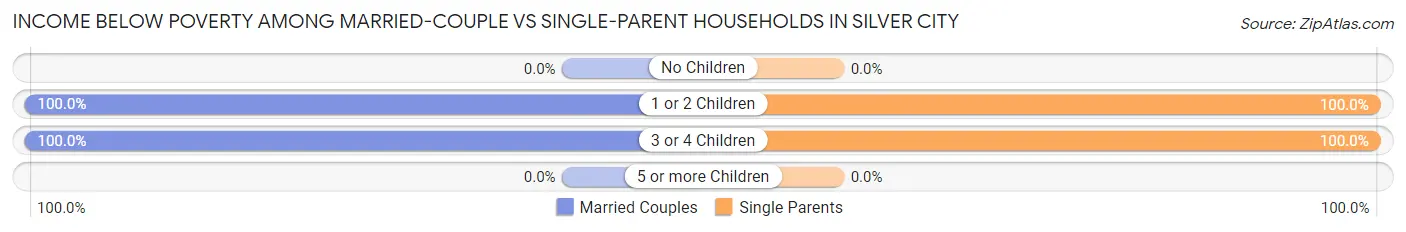
| Children | Married-Couple Families | Single-Parent Households |
| No Children | 0 (0.0%) | 0 (0.0%) |
| 1 or 2 Children | 16 (100.0%) | 11 (100.0%) |
| 3 or 4 Children | 22 (100.0%) | 17 (100.0%) |
| 5 or more Children | 0 (0.0%) | 0 (0.0%) |
| Total | 38 (65.5%) | 28 (84.9%) |
Race in Silver City
The most populous races in Silver City are Black / African American (795 | 97.1%), Two or more Races (16 | 1.9%), and Hispanic or Latino (8 | 1.0%).
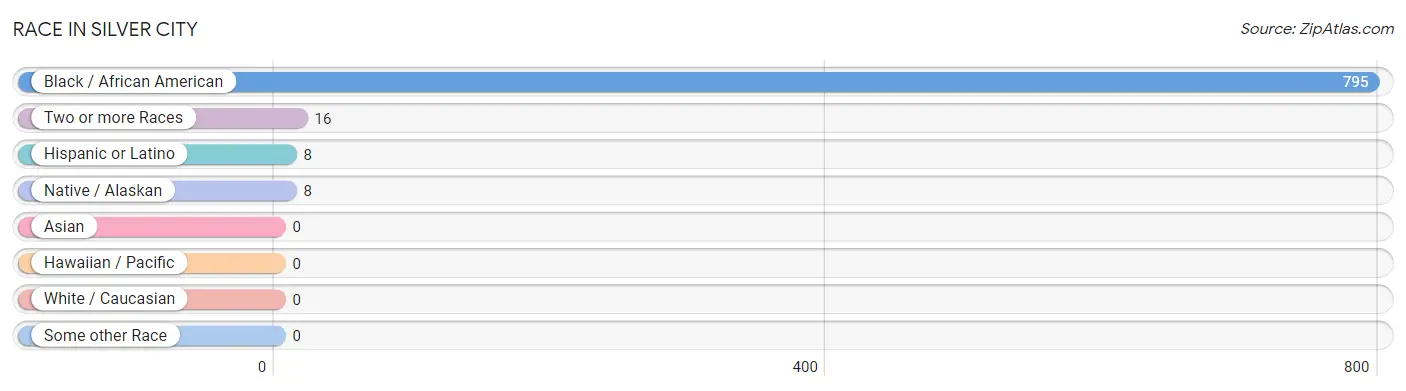
| Race | # Population | % Population |
| Asian | 0 | 0.0% |
| Black / African American | 795 | 97.1% |
| Hawaiian / Pacific | 0 | 0.0% |
| Hispanic or Latino | 8 | 1.0% |
| Native / Alaskan | 8 | 1.0% |
| White / Caucasian | 0 | 0.0% |
| Two or more Races | 16 | 1.9% |
| Some other Race | 0 | 0.0% |
| Total | 819 | 100.0% |
Ancestry in Silver City
The most populous ancestries reported in Silver City are African (129 | 15.8%), Subsaharan African (129 | 15.8%), Cherokee (16 | 1.9%), Peruvian (8 | 1.0%), and South American (8 | 1.0%), together accounting for 35.4% of all Silver City residents.
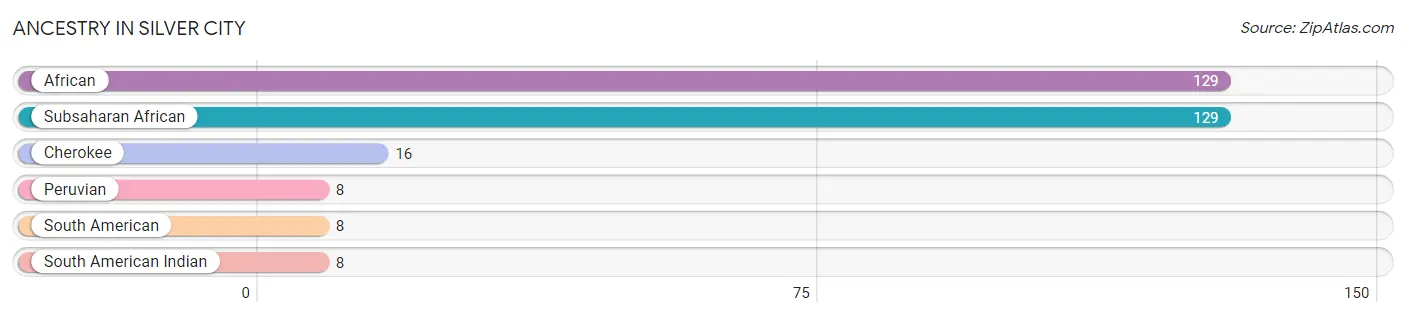
| Ancestry | # Population | % Population |
| African | 129 | 15.8% |
| Cherokee | 16 | 1.9% |
| Peruvian | 8 | 1.0% |
| South American | 8 | 1.0% |
| South American Indian | 8 | 1.0% |
| Subsaharan African | 129 | 15.8% | View All 6 Rows |
Immigrants in Silver City
The most numerous immigrant groups reported in Silver City came from Latin America (8 | 1.0%), Peru (8 | 1.0%), and South America (8 | 1.0%), together accounting for 2.9% of all Silver City residents.
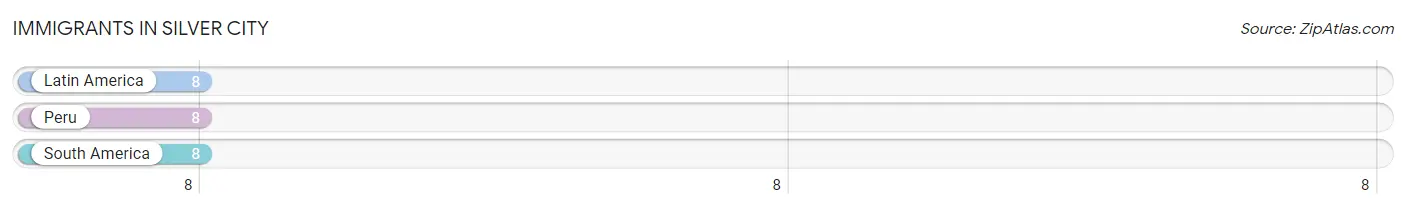
| Immigration Origin | # Population | % Population |
| Latin America | 8 | 1.0% |
| Peru | 8 | 1.0% |
| South America | 8 | 1.0% | View All 3 Rows |
Sex and Age in Silver City
Sex and Age in Silver City
The most populous age groups in Silver City are 5 to 9 Years (84 | 17.3%) for men and 60 to 64 Years (140 | 42.0%) for women.
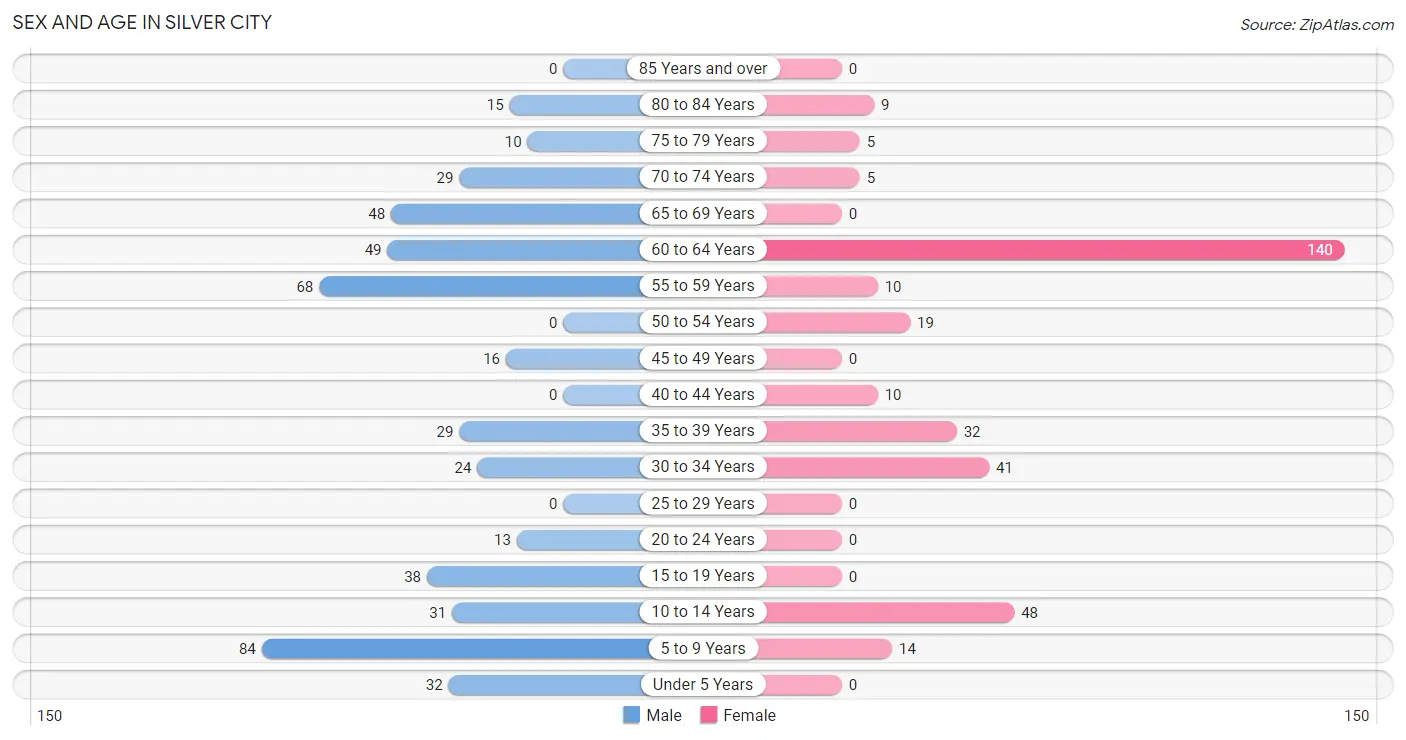
| Age Bracket | Male | Female |
| Under 5 Years | 32 (6.6%) | 0 (0.0%) |
| 5 to 9 Years | 84 (17.3%) | 14 (4.2%) |
| 10 to 14 Years | 31 (6.4%) | 48 (14.4%) |
| 15 to 19 Years | 38 (7.8%) | 0 (0.0%) |
| 20 to 24 Years | 13 (2.7%) | 0 (0.0%) |
| 25 to 29 Years | 0 (0.0%) | 0 (0.0%) |
| 30 to 34 Years | 24 (4.9%) | 41 (12.3%) |
| 35 to 39 Years | 29 (6.0%) | 32 (9.6%) |
| 40 to 44 Years | 0 (0.0%) | 10 (3.0%) |
| 45 to 49 Years | 16 (3.3%) | 0 (0.0%) |
| 50 to 54 Years | 0 (0.0%) | 19 (5.7%) |
| 55 to 59 Years | 68 (14.0%) | 10 (3.0%) |
| 60 to 64 Years | 49 (10.1%) | 140 (42.0%) |
| 65 to 69 Years | 48 (9.9%) | 0 (0.0%) |
| 70 to 74 Years | 29 (6.0%) | 5 (1.5%) |
| 75 to 79 Years | 10 (2.1%) | 5 (1.5%) |
| 80 to 84 Years | 15 (3.1%) | 9 (2.7%) |
| 85 Years and over | 0 (0.0%) | 0 (0.0%) |
| Total | 486 (100.0%) | 333 (100.0%) |
Families and Households in Silver City
Median Family Size in Silver City
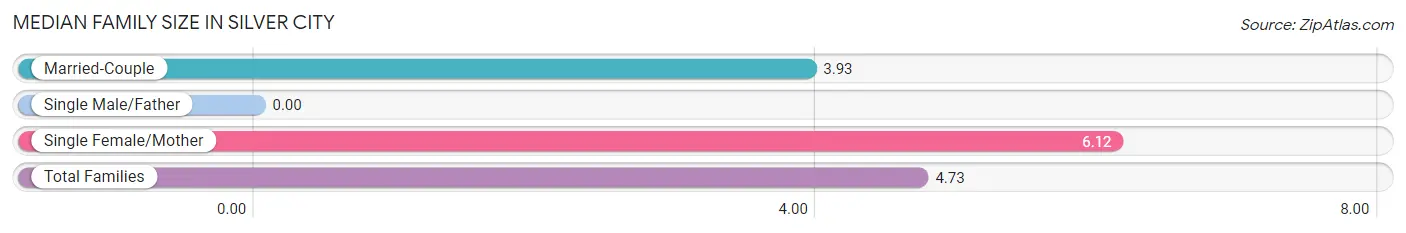
| Family Type | # Families | Family Size |
| Married-Couple | 58 (63.7%) | 3.93 |
| Single Male/Father | 0 (0.0%) | - |
| Single Female/Mother | 33 (36.3%) | 6.12 |
| Total Families | 91 (100.0%) | 4.73 |
Median Household Size in Silver City
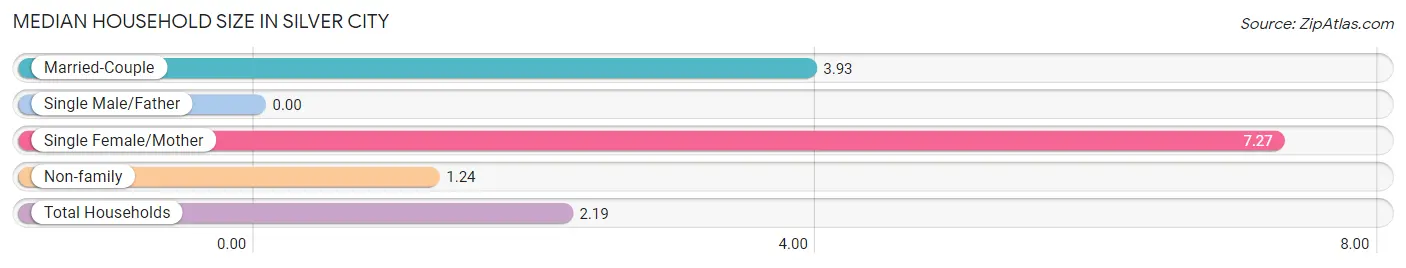
| Household Type | # Households | Household Size |
| Married-Couple | 58 (15.5%) | 3.93 |
| Single Male/Father | 0 (0.0%) | - |
| Single Female/Mother | 33 (8.8%) | 7.27 |
| Non-family | 283 (75.7%) | 1.24 |
| Total Households | 374 (100.0%) | 2.19 |
Household Size by Marriage Status in Silver City
Out of a total of 374 households in Silver City, 91 (24.3%) are family households, while 283 (75.7%) are nonfamily households. The most numerous type of family households are 6-person households, comprising 28, and the most common type of nonfamily households are 1-person households, comprising 222.
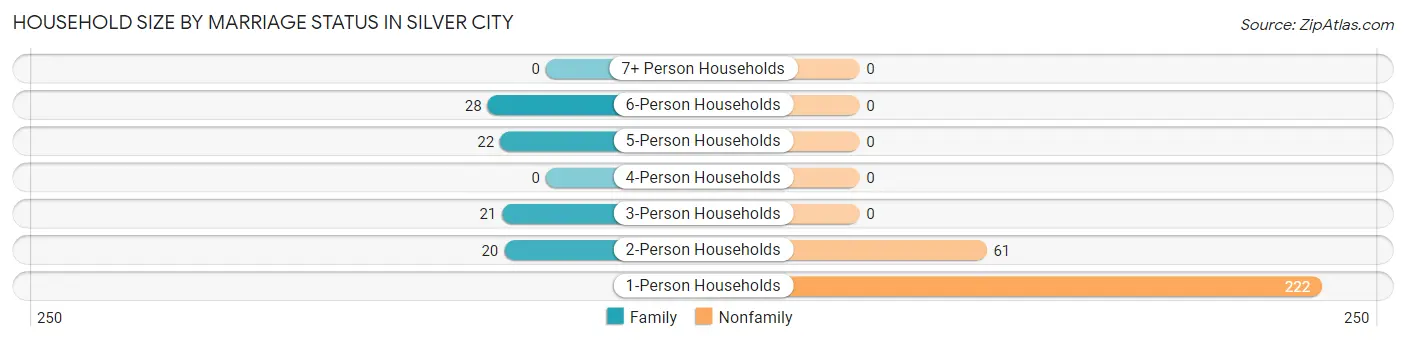
| Household Size | Family Households | Nonfamily Households |
| 1-Person Households | - | 222 (59.4%) |
| 2-Person Households | 20 (5.3%) | 61 (16.3%) |
| 3-Person Households | 21 (5.6%) | 0 (0.0%) |
| 4-Person Households | 0 (0.0%) | 0 (0.0%) |
| 5-Person Households | 22 (5.9%) | 0 (0.0%) |
| 6-Person Households | 28 (7.5%) | 0 (0.0%) |
| 7+ Person Households | 0 (0.0%) | 0 (0.0%) |
| Total | 91 (24.3%) | 283 (75.7%) |
Female Fertility in Silver City
Fertility by Age in Silver City
| Age Bracket | Women with Births | Births / 1,000 Women |
| 15 to 19 years | 0 (0.0%) | 0.0 |
| 20 to 34 years | 0 (0.0%) | 0.0 |
| 35 to 50 years | 0 (0.0%) | 0.0 |
| Total | 0 (0.0%) | 0.0 |
Fertility by Age by Marriage Status in Silver City
| Age Bracket | Married | Unmarried |
| 15 to 19 years | 0 (0.0%) | 0 (0.0%) |
| 20 to 34 years | 0 (0.0%) | 0 (0.0%) |
| 35 to 50 years | 0 (0.0%) | 0 (0.0%) |
| Total | 0 (0.0%) | 0 (0.0%) |
Fertility by Education in Silver City
| Educational Attainment | Women with Births | Births / 1,000 Women |
| Less than High School | 0 (0.0%) | 0.0 |
| High School Diploma | 0 (0.0%) | 0.0 |
| College or Associate's Degree | 0 (0.0%) | 0.0 |
| Bachelor's Degree | 0 (0.0%) | 0.0 |
| Graduate Degree | 0 (0.0%) | 0.0 |
| Total | 0 (0.0%) | 0.0 |
Fertility by Education by Marriage Status in Silver City
| Educational Attainment | Married | Unmarried |
| Less than High School | 0 (0.0%) | 0 (0.0%) |
| High School Diploma | 0 (0.0%) | 0 (0.0%) |
| College or Associate's Degree | 0 (0.0%) | 0 (0.0%) |
| Bachelor's Degree | 0 (0.0%) | 0 (0.0%) |
| Graduate Degree | 0 (0.0%) | 0 (0.0%) |
| Total | 0 (0.0%) | 0 (0.0%) |
Employment Characteristics in Silver City
Employment by Class of Employer in Silver City
Among the 313 employed individuals in Silver City, private company employees (201 | 64.2%), not-for-profit organizations (76 | 24.3%), and state government employees (36 | 11.5%) make up the most common classes of employment.
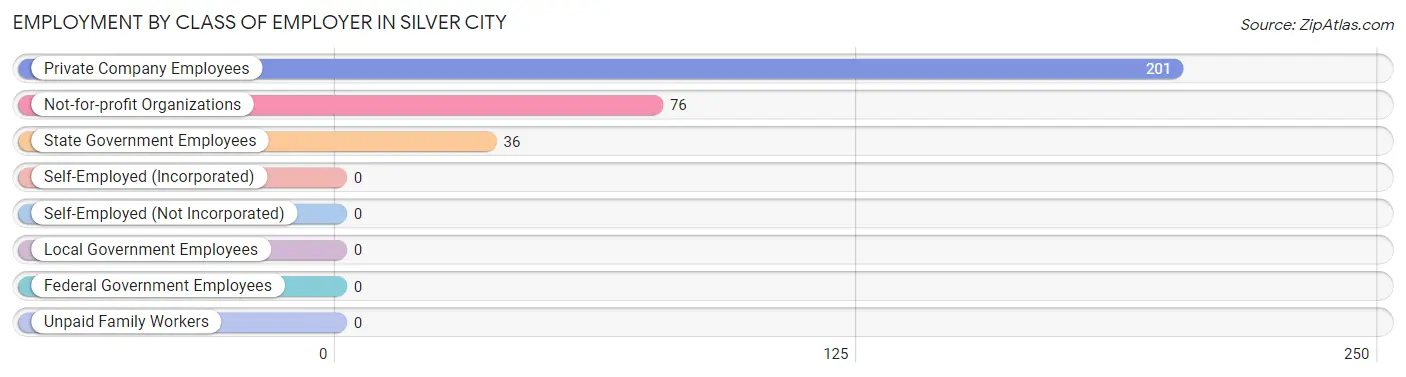
| Employer Class | # Employees | % Employees |
| Private Company Employees | 201 | 64.2% |
| Self-Employed (Incorporated) | 0 | 0.0% |
| Self-Employed (Not Incorporated) | 0 | 0.0% |
| Not-for-profit Organizations | 76 | 24.3% |
| Local Government Employees | 0 | 0.0% |
| State Government Employees | 36 | 11.5% |
| Federal Government Employees | 0 | 0.0% |
| Unpaid Family Workers | 0 | 0.0% |
| Total | 313 | 100.0% |
Employment Status by Age in Silver City
According to the labor force statistics for Silver City, out of the total population over 16 years of age (597), 55.6% or 332 individuals are in the labor force, with 5.7% or 19 of them unemployed. The age group with the highest labor force participation rate is 20 to 24 years, with 100.0% or 13 individuals in the labor force. Within the labor force, the 30 to 34 years age range has the highest percentage of unemployed individuals, with 44.2% or 19 of them being unemployed.
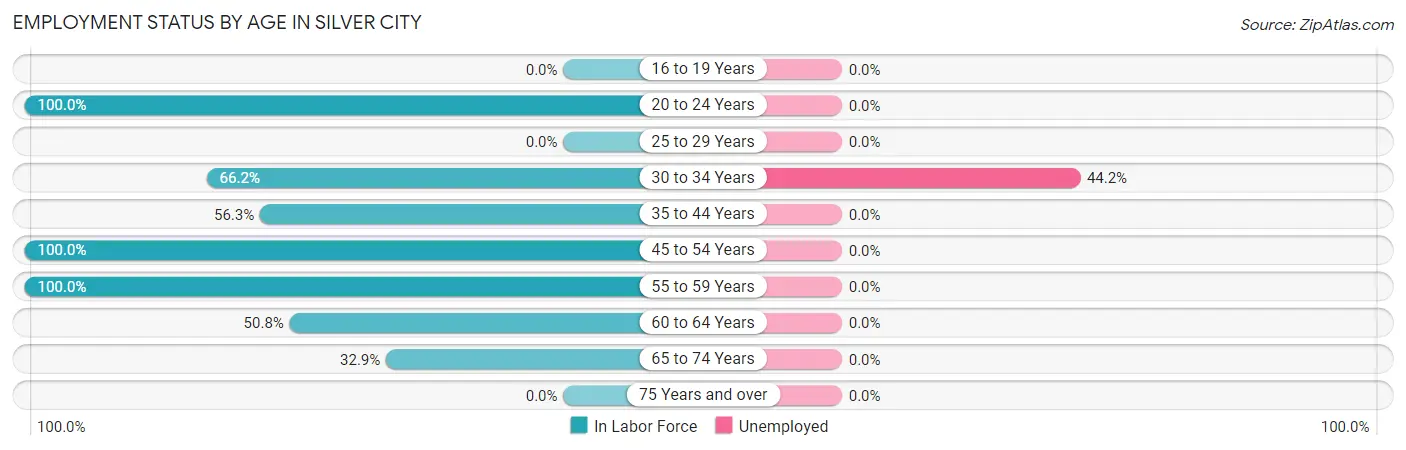
| Age Bracket | In Labor Force | Unemployed |
| 16 to 19 Years | 0 (0.0%) | 0 (0.0%) |
| 20 to 24 Years | 13 (100.0%) | 0 (0.0%) |
| 25 to 29 Years | 0 (0.0%) | 0 (0.0%) |
| 30 to 34 Years | 43 (66.2%) | 19 (44.2%) |
| 35 to 44 Years | 40 (56.3%) | 0 (0.0%) |
| 45 to 54 Years | 35 (100.0%) | 0 (0.0%) |
| 55 to 59 Years | 78 (100.0%) | 0 (0.0%) |
| 60 to 64 Years | 96 (50.8%) | 0 (0.0%) |
| 65 to 74 Years | 27 (32.9%) | 0 (0.0%) |
| 75 Years and over | 0 (0.0%) | 0 (0.0%) |
| Total | 332 (55.6%) | 19 (5.7%) |
Employment Status by Educational Attainment in Silver City
According to labor force statistics for Silver City, 66.7% of individuals (292) out of the total population between 25 and 64 years of age (438) are in the labor force, with 6.5% or 19 of them being unemployed. The group with the highest labor force participation rate are those with the educational attainment of high school diploma, with 69.8% or 104 individuals in the labor force. Within the labor force, individuals with college / associate degree education have the highest percentage of unemployment, with 24.1% or 19 of them being unemployed.
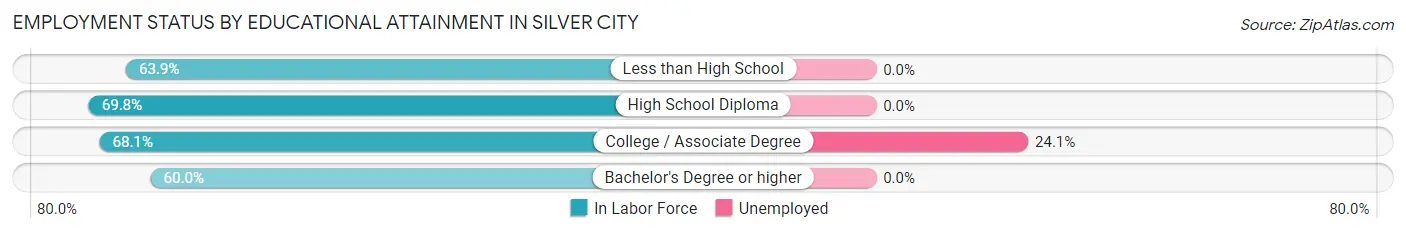
| Educational Attainment | In Labor Force | Unemployed |
| Less than High School | 85 (63.9%) | 0 (0.0%) |
| High School Diploma | 104 (69.8%) | 0 (0.0%) |
| College / Associate Degree | 79 (68.1%) | 28 (24.1%) |
| Bachelor's Degree or higher | 24 (60.0%) | 0 (0.0%) |
| Total | 292 (66.7%) | 28 (6.5%) |
Employment Occupations by Sex in Silver City
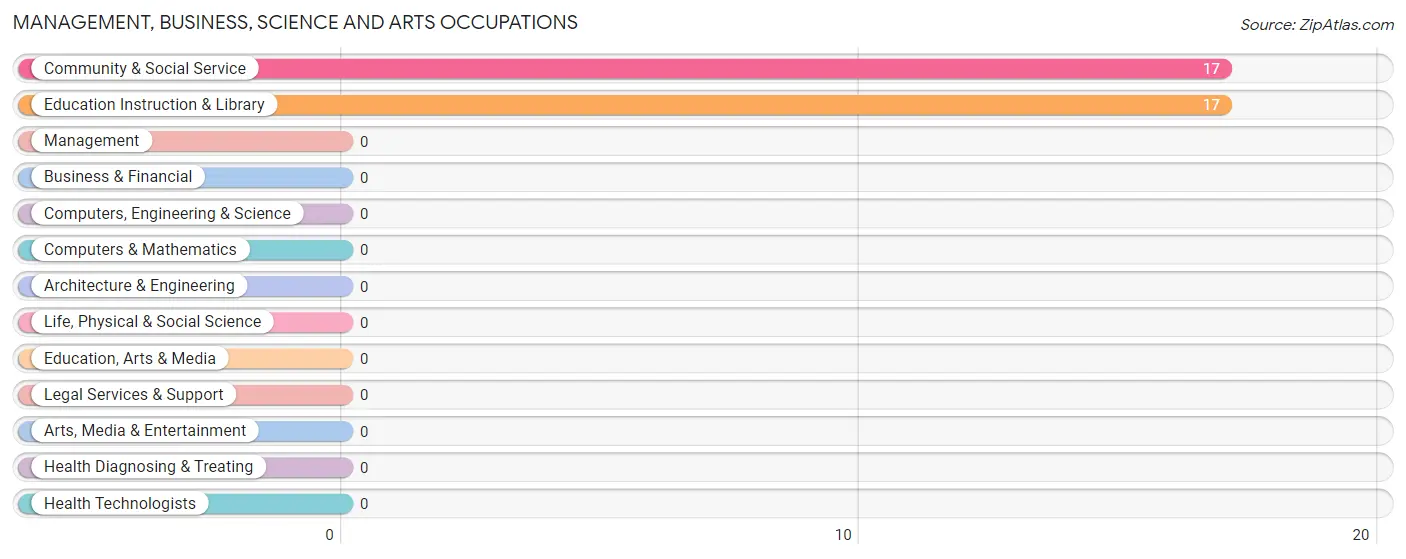
Management, Business, Science and Arts Occupations
The most common Management, Business, Science and Arts occupations in Silver City are Community & Social Service (17 | 5.4%), and Education Instruction & Library (17 | 5.4%).
Management, Business, Science and Arts Occupations by Sex
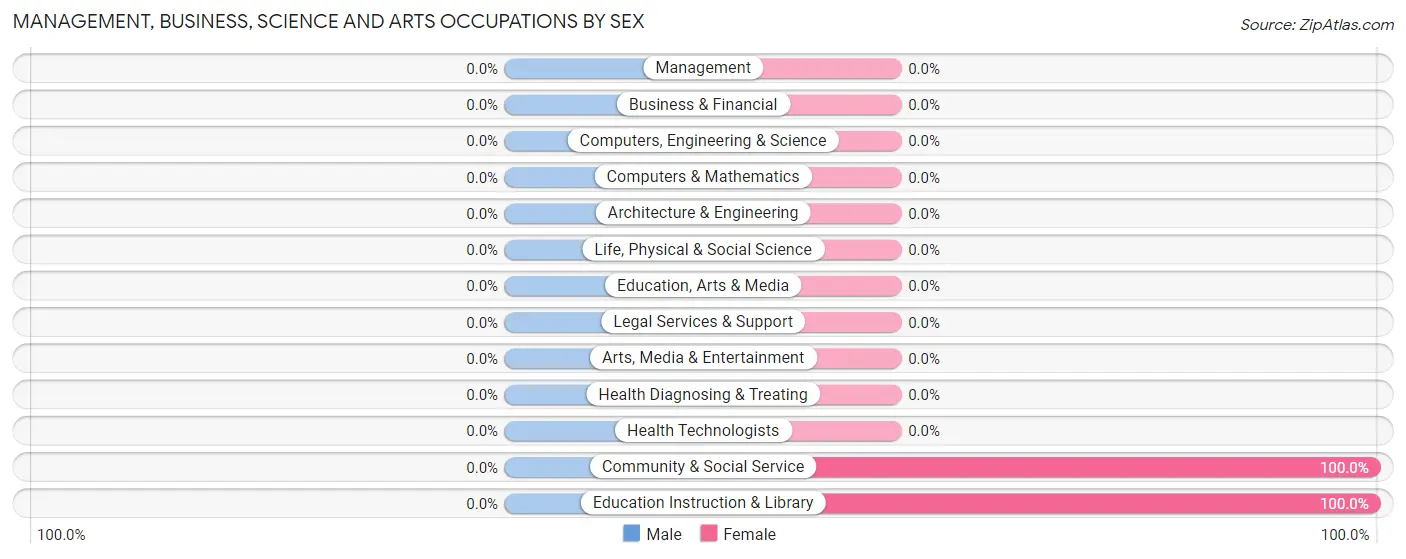
| Occupation | Male | Female |
| Management | 0 (0.0%) | 0 (0.0%) |
| Business & Financial | 0 (0.0%) | 0 (0.0%) |
| Computers, Engineering & Science | 0 (0.0%) | 0 (0.0%) |
| Computers & Mathematics | 0 (0.0%) | 0 (0.0%) |
| Architecture & Engineering | 0 (0.0%) | 0 (0.0%) |
| Life, Physical & Social Science | 0 (0.0%) | 0 (0.0%) |
| Community & Social Service | 0 (0.0%) | 17 (100.0%) |
| Education, Arts & Media | 0 (0.0%) | 0 (0.0%) |
| Legal Services & Support | 0 (0.0%) | 0 (0.0%) |
| Education Instruction & Library | 0 (0.0%) | 17 (100.0%) |
| Arts, Media & Entertainment | 0 (0.0%) | 0 (0.0%) |
| Health Diagnosing & Treating | 0 (0.0%) | 0 (0.0%) |
| Health Technologists | 0 (0.0%) | 0 (0.0%) |
| Total (Category) | 0 (0.0%) | 17 (100.0%) |
| Total (Overall) | 191 (61.0%) | 122 (39.0%) |
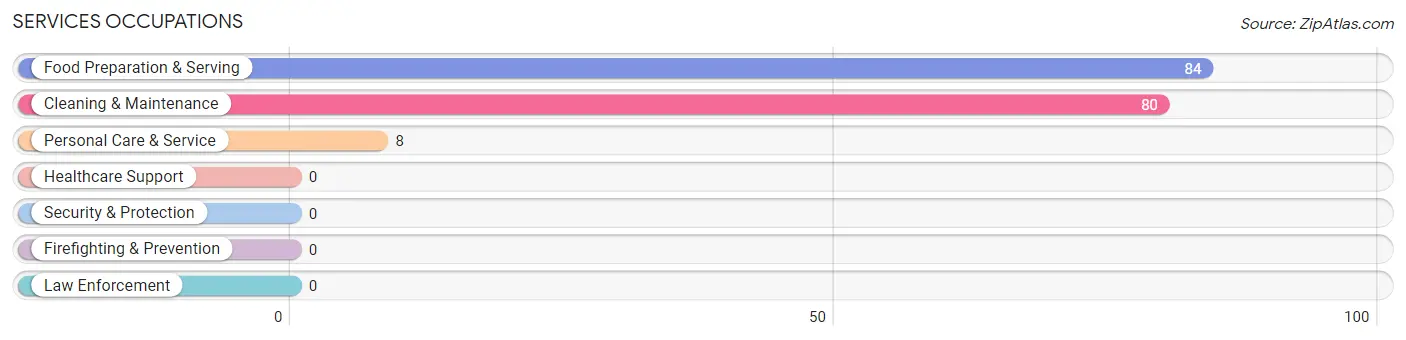
Services Occupations
The most common Services occupations in Silver City are Food Preparation & Serving (84 | 26.8%), Cleaning & Maintenance (80 | 25.6%), and Personal Care & Service (8 | 2.6%).
Services Occupations by Sex
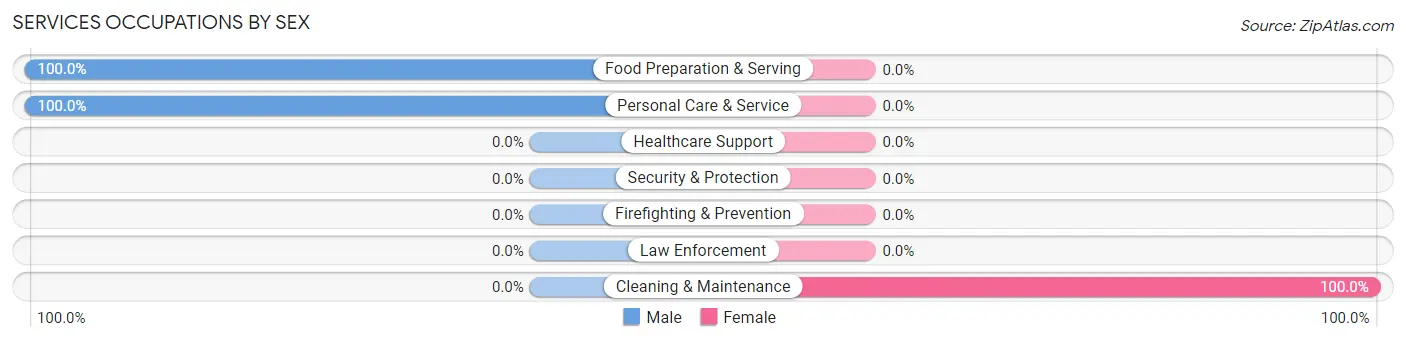
| Occupation | Male | Female |
| Healthcare Support | 0 (0.0%) | 0 (0.0%) |
| Security & Protection | 0 (0.0%) | 0 (0.0%) |
| Firefighting & Prevention | 0 (0.0%) | 0 (0.0%) |
| Law Enforcement | 0 (0.0%) | 0 (0.0%) |
| Food Preparation & Serving | 84 (100.0%) | 0 (0.0%) |
| Cleaning & Maintenance | 0 (0.0%) | 80 (100.0%) |
| Personal Care & Service | 8 (100.0%) | 0 (0.0%) |
| Total (Category) | 92 (53.5%) | 80 (46.5%) |
| Total (Overall) | 191 (61.0%) | 122 (39.0%) |
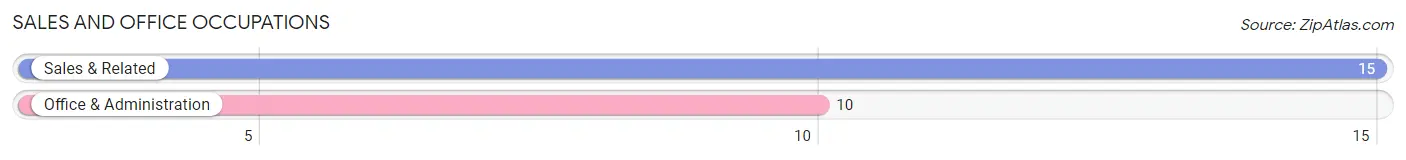
Sales and Office Occupations
The most common Sales and Office occupations in Silver City are Sales & Related (15 | 4.8%), and Office & Administration (10 | 3.2%).
Sales and Office Occupations by Sex
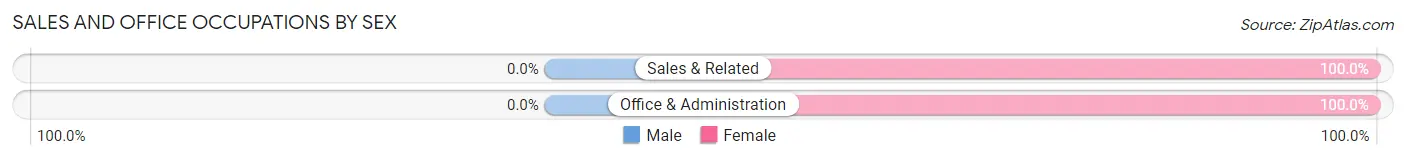
| Occupation | Male | Female |
| Sales & Related | 0 (0.0%) | 15 (100.0%) |
| Office & Administration | 0 (0.0%) | 10 (100.0%) |
| Total (Category) | 0 (0.0%) | 25 (100.0%) |
| Total (Overall) | 191 (61.0%) | 122 (39.0%) |
Natural Resources, Construction and Maintenance Occupations
Natural Resources, Construction and Maintenance Occupations by Sex
| Occupation | Male | Female |
| Farming, Fishing & Forestry | 0 (0.0%) | 0 (0.0%) |
| Construction & Extraction | 0 (0.0%) | 0 (0.0%) |
| Installation, Maintenance & Repair | 0 (0.0%) | 0 (0.0%) |
| Total (Category) | 0 (0.0%) | 0 (0.0%) |
| Total (Overall) | 191 (61.0%) | 122 (39.0%) |
Production, Transportation and Moving Occupations
The most common Production, Transportation and Moving occupations in Silver City are Material Moving (52 | 16.6%), and Transportation (47 | 15.0%).
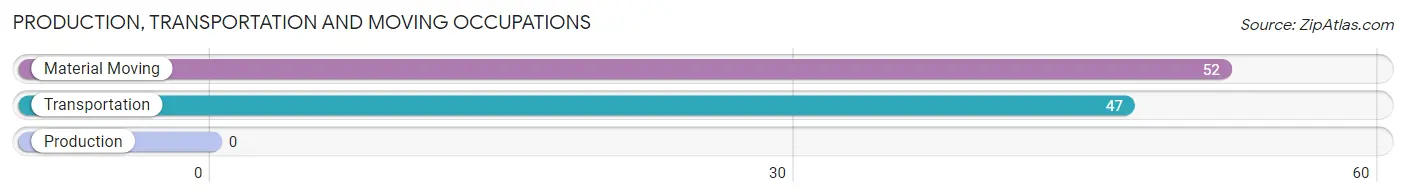
Production, Transportation and Moving Occupations by Sex
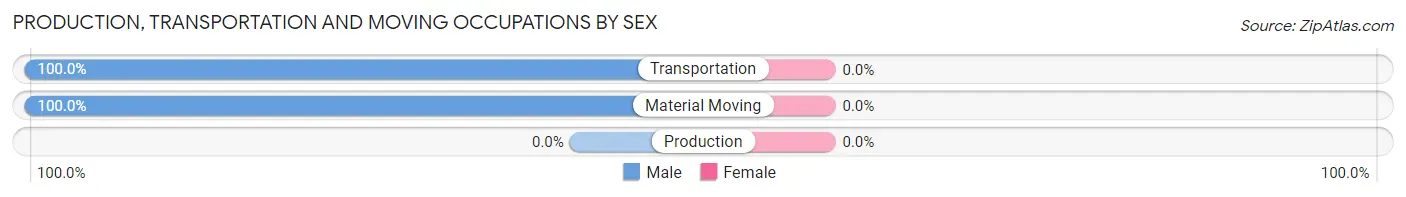
| Occupation | Male | Female |
| Production | 0 (0.0%) | 0 (0.0%) |
| Transportation | 47 (100.0%) | 0 (0.0%) |
| Material Moving | 52 (100.0%) | 0 (0.0%) |
| Total (Category) | 99 (100.0%) | 0 (0.0%) |
| Total (Overall) | 191 (61.0%) | 122 (39.0%) |
Employment Industries by Sex in Silver City
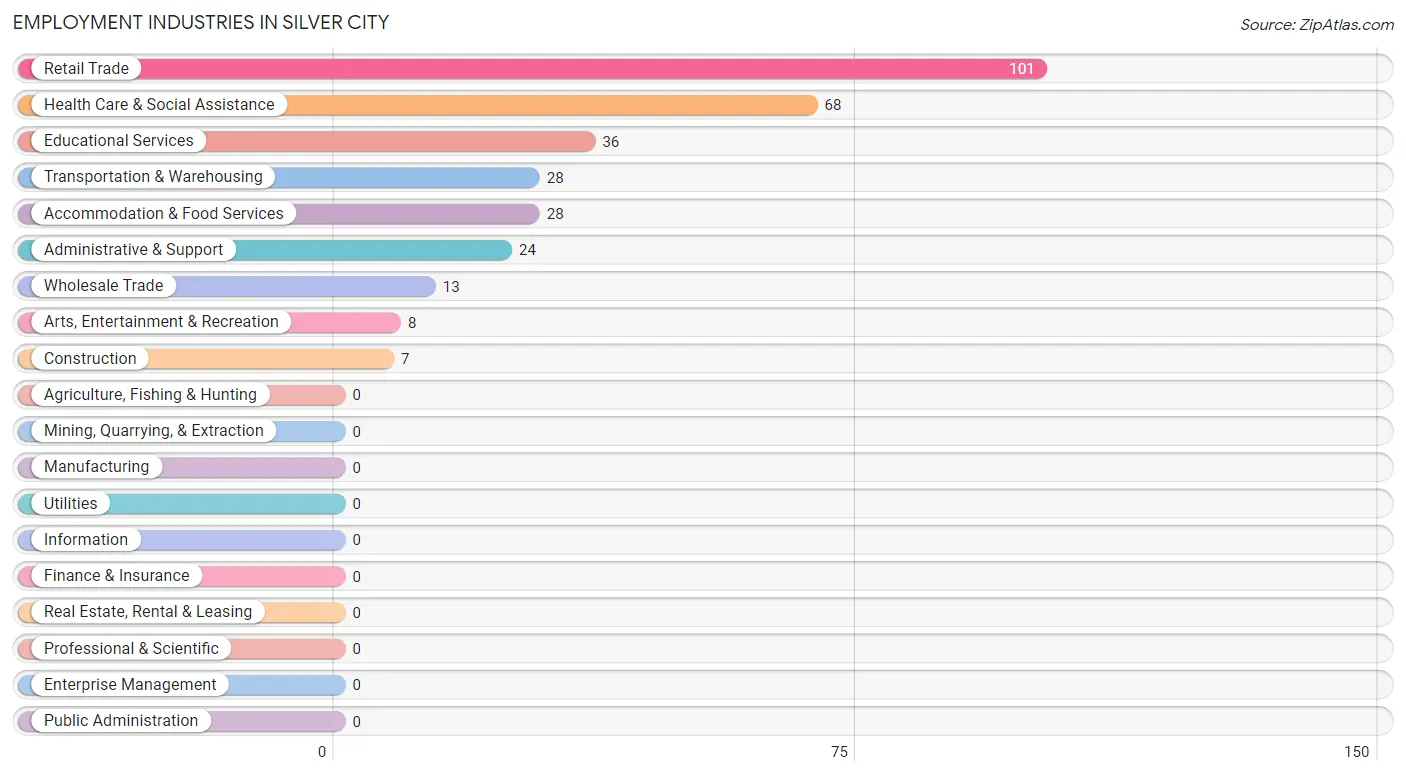
Employment Industries in Silver City
The major employment industries in Silver City include Retail Trade (101 | 32.3%), Health Care & Social Assistance (68 | 21.7%), Educational Services (36 | 11.5%), Transportation & Warehousing (28 | 8.9%), and Accommodation & Food Services (28 | 8.9%).
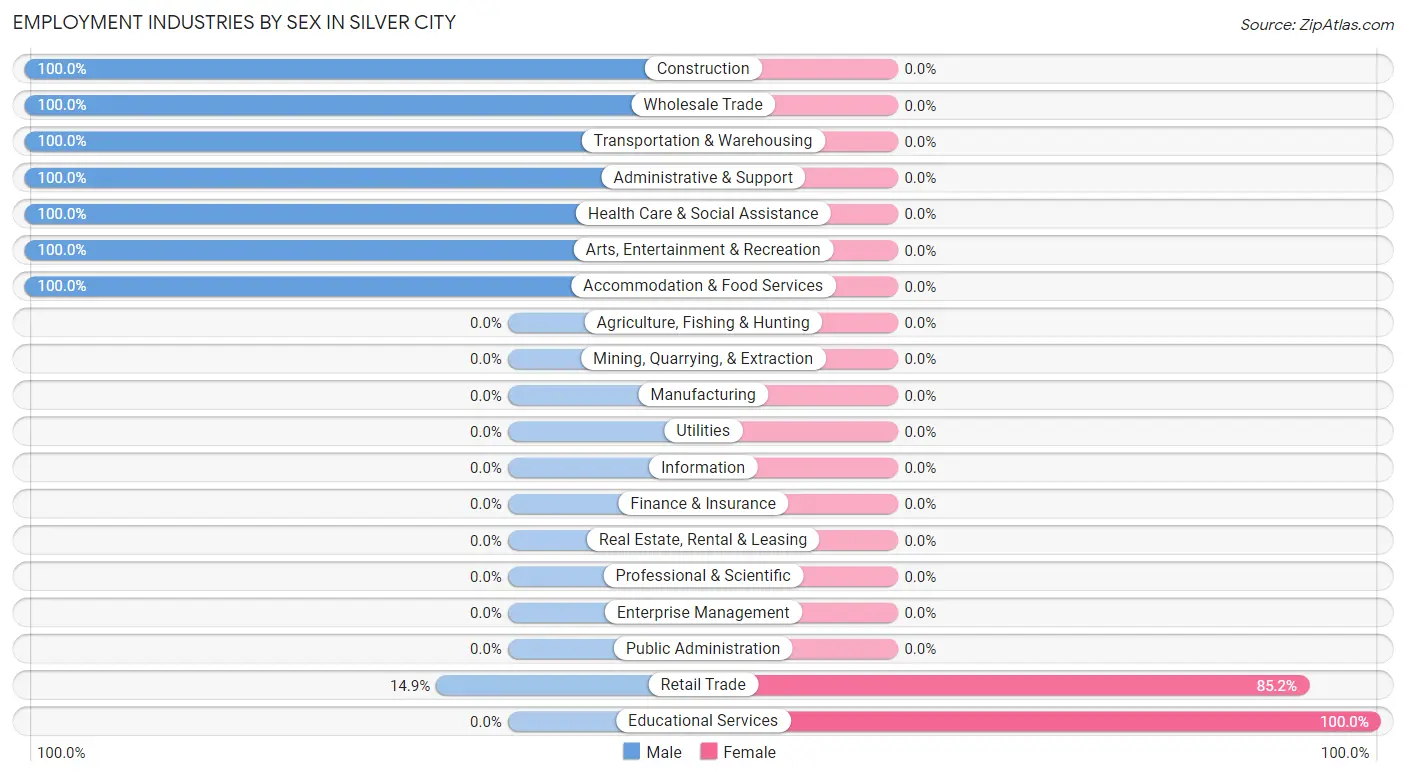
Employment Industries by Sex in Silver City
The Silver City industries that see more men than women are Construction (100.0%), Wholesale Trade (100.0%), and Transportation & Warehousing (100.0%), whereas the industries that tend to have a higher number of women are Educational Services (100.0%), and Retail Trade (85.2%).
| Industry | Male | Female |
| Agriculture, Fishing & Hunting | 0 (0.0%) | 0 (0.0%) |
| Mining, Quarrying, & Extraction | 0 (0.0%) | 0 (0.0%) |
| Construction | 7 (100.0%) | 0 (0.0%) |
| Manufacturing | 0 (0.0%) | 0 (0.0%) |
| Wholesale Trade | 13 (100.0%) | 0 (0.0%) |
| Retail Trade | 15 (14.8%) | 86 (85.2%) |
| Transportation & Warehousing | 28 (100.0%) | 0 (0.0%) |
| Utilities | 0 (0.0%) | 0 (0.0%) |
| Information | 0 (0.0%) | 0 (0.0%) |
| Finance & Insurance | 0 (0.0%) | 0 (0.0%) |
| Real Estate, Rental & Leasing | 0 (0.0%) | 0 (0.0%) |
| Professional & Scientific | 0 (0.0%) | 0 (0.0%) |
| Enterprise Management | 0 (0.0%) | 0 (0.0%) |
| Administrative & Support | 24 (100.0%) | 0 (0.0%) |
| Educational Services | 0 (0.0%) | 36 (100.0%) |
| Health Care & Social Assistance | 68 (100.0%) | 0 (0.0%) |
| Arts, Entertainment & Recreation | 8 (100.0%) | 0 (0.0%) |
| Accommodation & Food Services | 28 (100.0%) | 0 (0.0%) |
| Public Administration | 0 (0.0%) | 0 (0.0%) |
| Total | 191 (61.0%) | 122 (39.0%) |
Education in Silver City
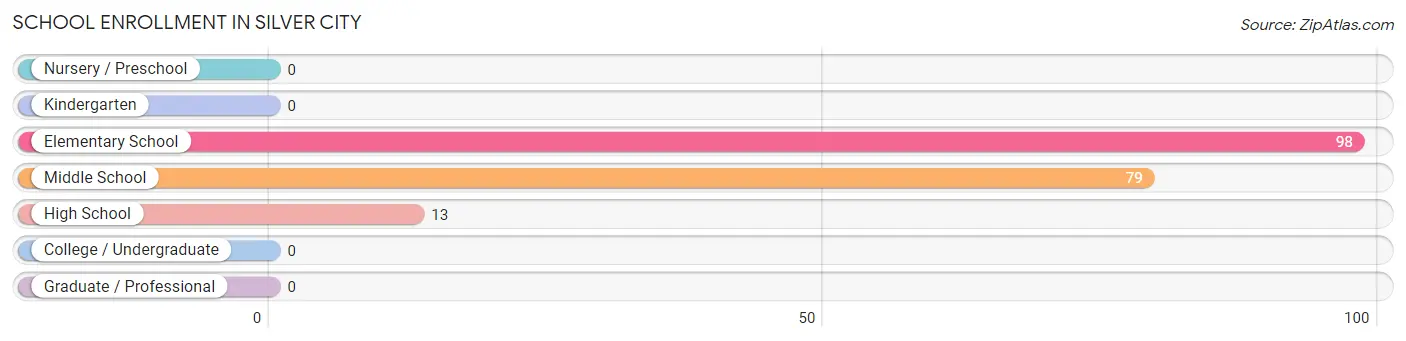
School Enrollment in Silver City
The most common levels of schooling among the 190 students in Silver City are elementary school (98 | 51.6%), middle school (79 | 41.6%), and high school (13 | 6.8%).
| School Level | # Students | % Students |
| Nursery / Preschool | 0 | 0.0% |
| Kindergarten | 0 | 0.0% |
| Elementary School | 98 | 51.6% |
| Middle School | 79 | 41.6% |
| High School | 13 | 6.8% |
| College / Undergraduate | 0 | 0.0% |
| Graduate / Professional | 0 | 0.0% |
| Total | 190 | 100.0% |
School Enrollment by Age by Funding Source in Silver City
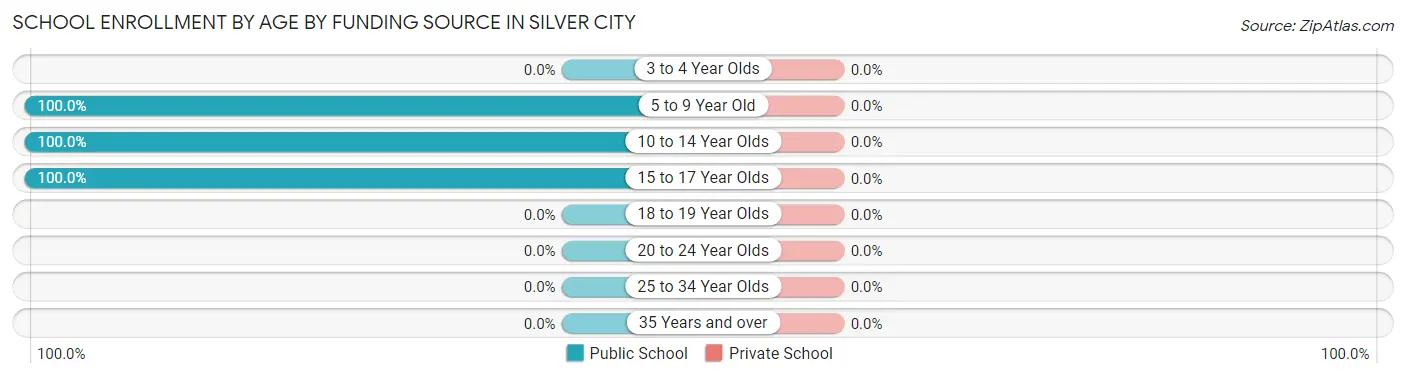
| Age Bracket | Public School | Private School |
| 3 to 4 Year Olds | 0 (0.0%) | 0 (0.0%) |
| 5 to 9 Year Old | 98 (100.0%) | 0 (0.0%) |
| 10 to 14 Year Olds | 79 (100.0%) | 0 (0.0%) |
| 15 to 17 Year Olds | 13 (100.0%) | 0 (0.0%) |
| 18 to 19 Year Olds | 0 (0.0%) | 0 (0.0%) |
| 20 to 24 Year Olds | 0 (0.0%) | 0 (0.0%) |
| 25 to 34 Year Olds | 0 (0.0%) | 0 (0.0%) |
| 35 Years and over | 0 (0.0%) | 0 (0.0%) |
| Total | 190 (100.0%) | 0 (0.0%) |
Educational Attainment by Field of Study in Silver City
Arts & humanities (24 | 60.0%), and business (16 | 40.0%) are the most common fields of study among 40 individuals in Silver City who have obtained a bachelor's degree or higher.
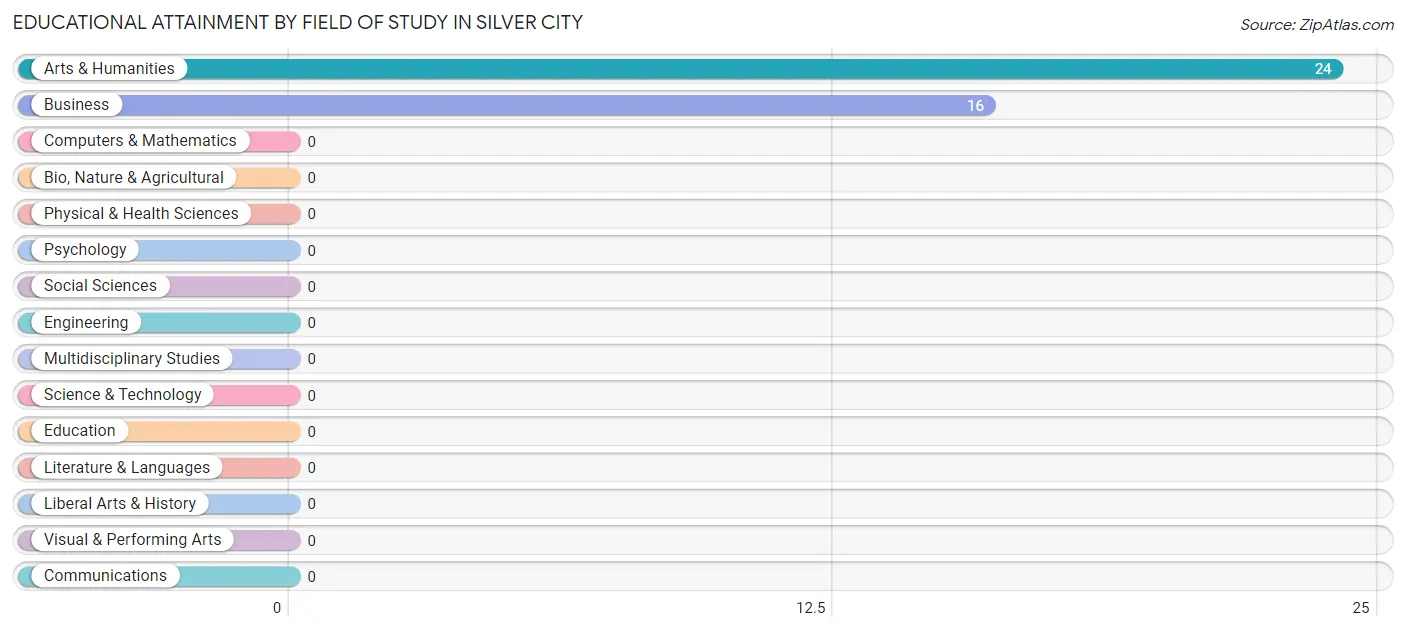
| Field of Study | # Graduates | % Graduates |
| Computers & Mathematics | 0 | 0.0% |
| Bio, Nature & Agricultural | 0 | 0.0% |
| Physical & Health Sciences | 0 | 0.0% |
| Psychology | 0 | 0.0% |
| Social Sciences | 0 | 0.0% |
| Engineering | 0 | 0.0% |
| Multidisciplinary Studies | 0 | 0.0% |
| Science & Technology | 0 | 0.0% |
| Business | 16 | 40.0% |
| Education | 0 | 0.0% |
| Literature & Languages | 0 | 0.0% |
| Liberal Arts & History | 0 | 0.0% |
| Visual & Performing Arts | 0 | 0.0% |
| Communications | 0 | 0.0% |
| Arts & Humanities | 24 | 60.0% |
| Total | 40 | 100.0% |
Transportation & Commute in Silver City
Vehicle Availability by Sex in Silver City
The most prevalent vehicle ownership categories in Silver City are males with 1 vehicle (166, accounting for 86.9%) and females with 1 vehicle (97, making up 136.1%).
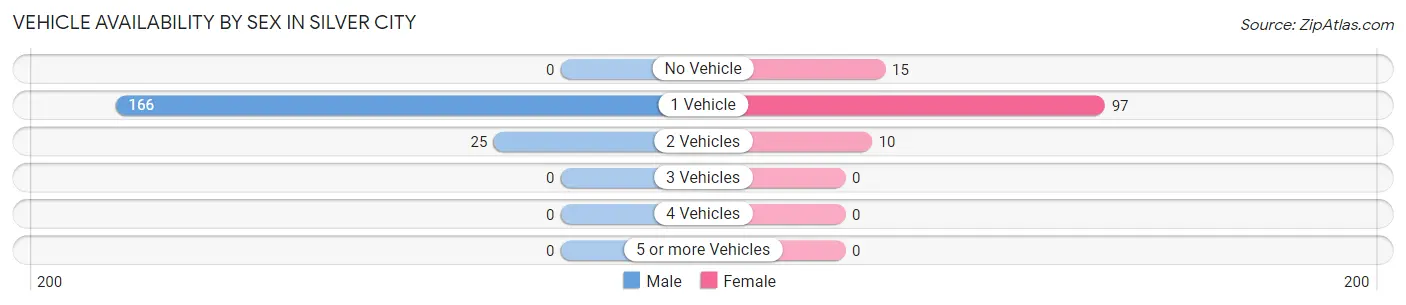
| Vehicles Available | Male | Female |
| No Vehicle | 0 (0.0%) | 15 (12.3%) |
| 1 Vehicle | 166 (86.9%) | 97 (79.5%) |
| 2 Vehicles | 25 (13.1%) | 10 (8.2%) |
| 3 Vehicles | 0 (0.0%) | 0 (0.0%) |
| 4 Vehicles | 0 (0.0%) | 0 (0.0%) |
| 5 or more Vehicles | 0 (0.0%) | 0 (0.0%) |
| Total | 191 (100.0%) | 122 (100.0%) |
Commute Time in Silver City
The most frequently occuring commute durations in Silver City are 20 to 24 minutes (157 commuters, 50.2%), 5 to 9 minutes (59 commuters, 18.9%), and 30 to 34 minutes (27 commuters, 8.6%).
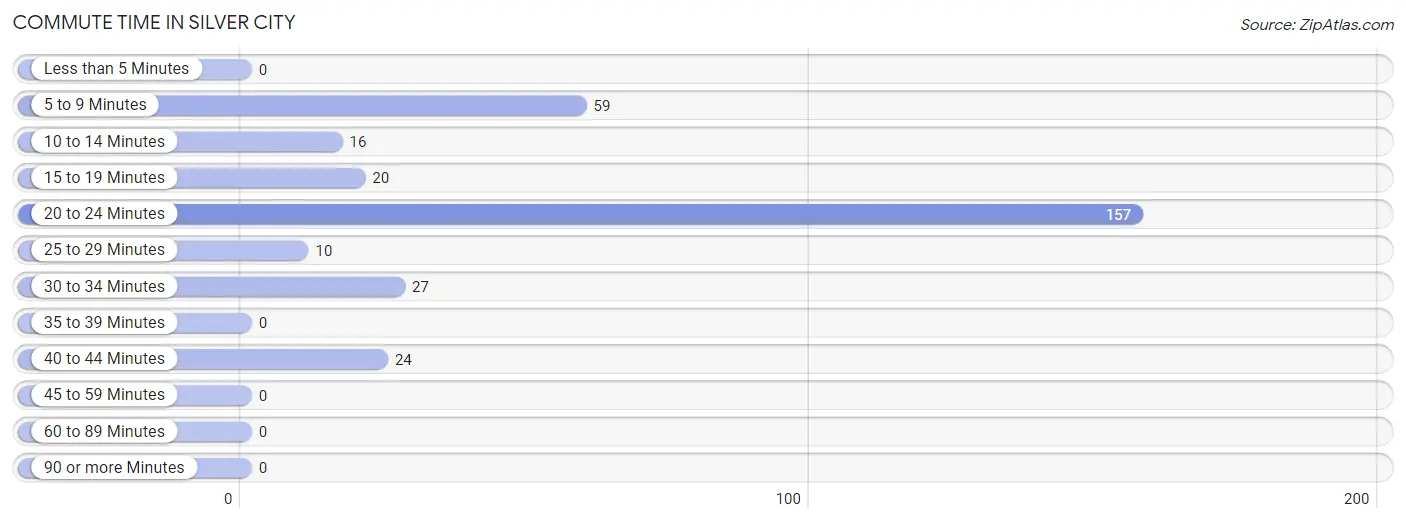
| Commute Time | # Commuters | % Commuters |
| Less than 5 Minutes | 0 | 0.0% |
| 5 to 9 Minutes | 59 | 18.9% |
| 10 to 14 Minutes | 16 | 5.1% |
| 15 to 19 Minutes | 20 | 6.4% |
| 20 to 24 Minutes | 157 | 50.2% |
| 25 to 29 Minutes | 10 | 3.2% |
| 30 to 34 Minutes | 27 | 8.6% |
| 35 to 39 Minutes | 0 | 0.0% |
| 40 to 44 Minutes | 24 | 7.7% |
| 45 to 59 Minutes | 0 | 0.0% |
| 60 to 89 Minutes | 0 | 0.0% |
| 90 or more Minutes | 0 | 0.0% |
Commute Time by Sex in Silver City
The most common commute times in Silver City are 20 to 24 minutes (96 commuters, 50.3%) for males and 20 to 24 minutes (61 commuters, 50.0%) for females.
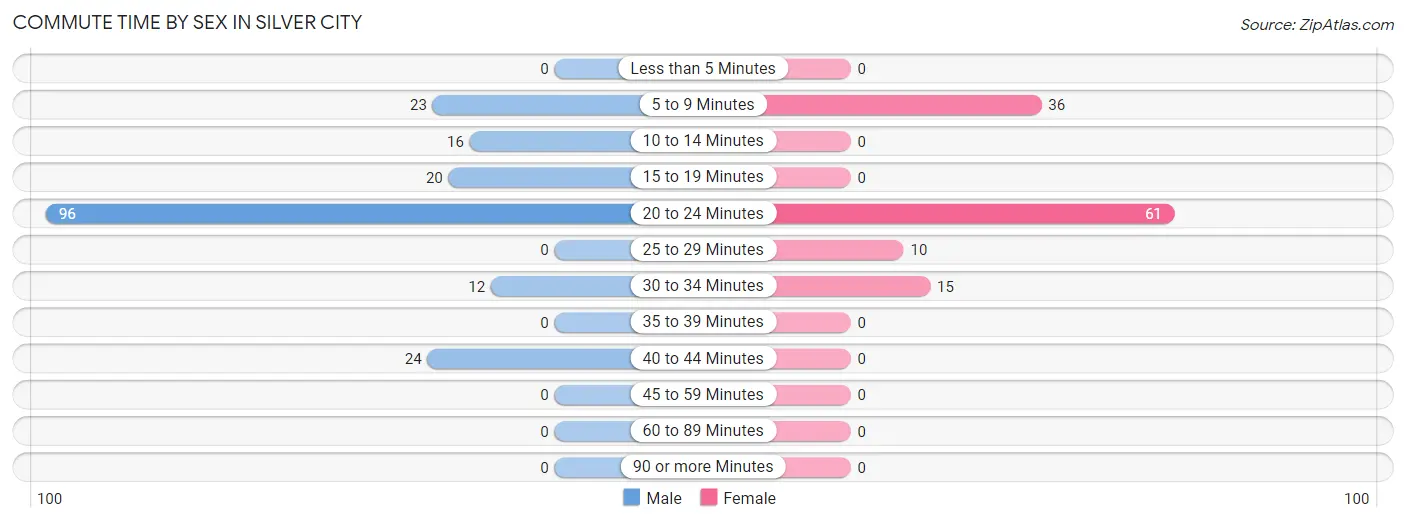
| Commute Time | Male | Female |
| Less than 5 Minutes | 0 (0.0%) | 0 (0.0%) |
| 5 to 9 Minutes | 23 (12.0%) | 36 (29.5%) |
| 10 to 14 Minutes | 16 (8.4%) | 0 (0.0%) |
| 15 to 19 Minutes | 20 (10.5%) | 0 (0.0%) |
| 20 to 24 Minutes | 96 (50.3%) | 61 (50.0%) |
| 25 to 29 Minutes | 0 (0.0%) | 10 (8.2%) |
| 30 to 34 Minutes | 12 (6.3%) | 15 (12.3%) |
| 35 to 39 Minutes | 0 (0.0%) | 0 (0.0%) |
| 40 to 44 Minutes | 24 (12.6%) | 0 (0.0%) |
| 45 to 59 Minutes | 0 (0.0%) | 0 (0.0%) |
| 60 to 89 Minutes | 0 (0.0%) | 0 (0.0%) |
| 90 or more Minutes | 0 (0.0%) | 0 (0.0%) |
Time of Departure to Work by Sex in Silver City
The most frequent times of departure to work in Silver City are 5:00 AM to 5:29 AM (123, 64.4%) for males and 12:00 AM to 4:59 AM (78, 63.9%) for females.
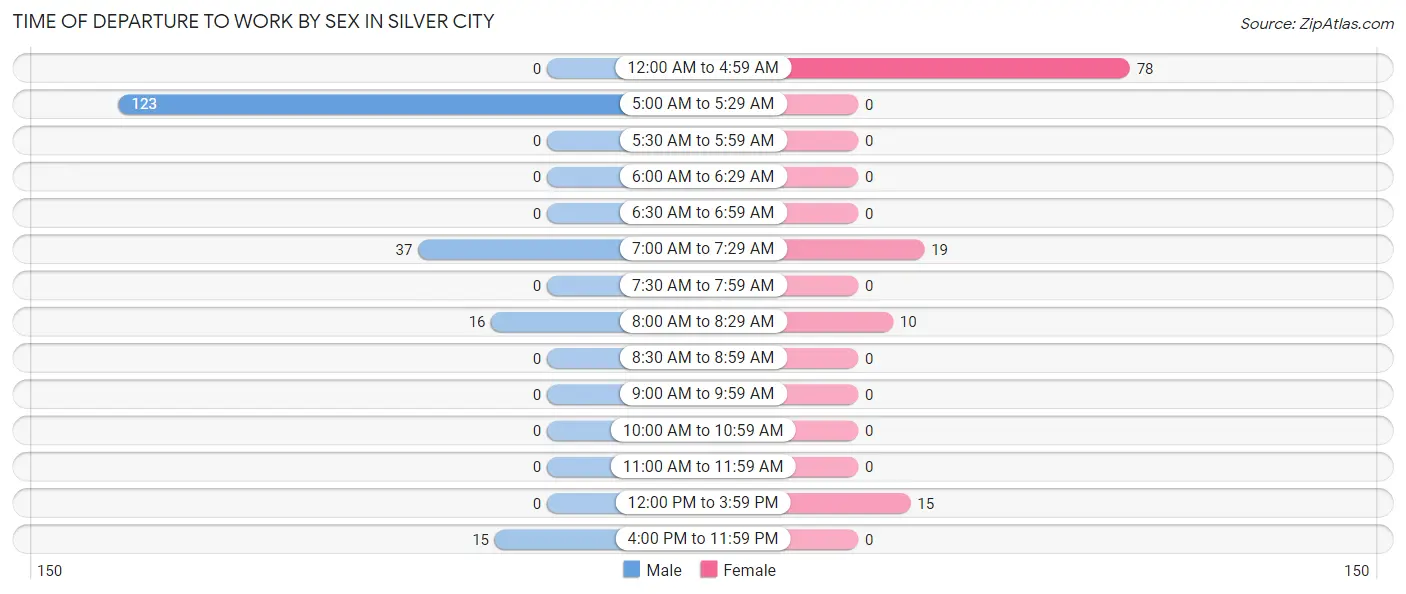
| Time of Departure | Male | Female |
| 12:00 AM to 4:59 AM | 0 (0.0%) | 78 (63.9%) |
| 5:00 AM to 5:29 AM | 123 (64.4%) | 0 (0.0%) |
| 5:30 AM to 5:59 AM | 0 (0.0%) | 0 (0.0%) |
| 6:00 AM to 6:29 AM | 0 (0.0%) | 0 (0.0%) |
| 6:30 AM to 6:59 AM | 0 (0.0%) | 0 (0.0%) |
| 7:00 AM to 7:29 AM | 37 (19.4%) | 19 (15.6%) |
| 7:30 AM to 7:59 AM | 0 (0.0%) | 0 (0.0%) |
| 8:00 AM to 8:29 AM | 16 (8.4%) | 10 (8.2%) |
| 8:30 AM to 8:59 AM | 0 (0.0%) | 0 (0.0%) |
| 9:00 AM to 9:59 AM | 0 (0.0%) | 0 (0.0%) |
| 10:00 AM to 10:59 AM | 0 (0.0%) | 0 (0.0%) |
| 11:00 AM to 11:59 AM | 0 (0.0%) | 0 (0.0%) |
| 12:00 PM to 3:59 PM | 0 (0.0%) | 15 (12.3%) |
| 4:00 PM to 11:59 PM | 15 (7.9%) | 0 (0.0%) |
| Total | 191 (100.0%) | 122 (100.0%) |
Housing Occupancy in Silver City
Occupancy by Ownership in Silver City
Of the total 374 dwellings in Silver City, owner-occupied units account for 207 (55.3%), while renter-occupied units make up 167 (44.7%).
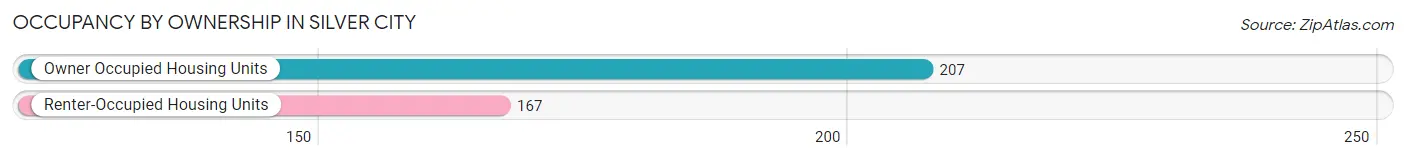
| Occupancy | # Housing Units | % Housing Units |
| Owner Occupied Housing Units | 207 | 55.3% |
| Renter-Occupied Housing Units | 167 | 44.7% |
| Total Occupied Housing Units | 374 | 100.0% |
Occupancy by Household Size in Silver City
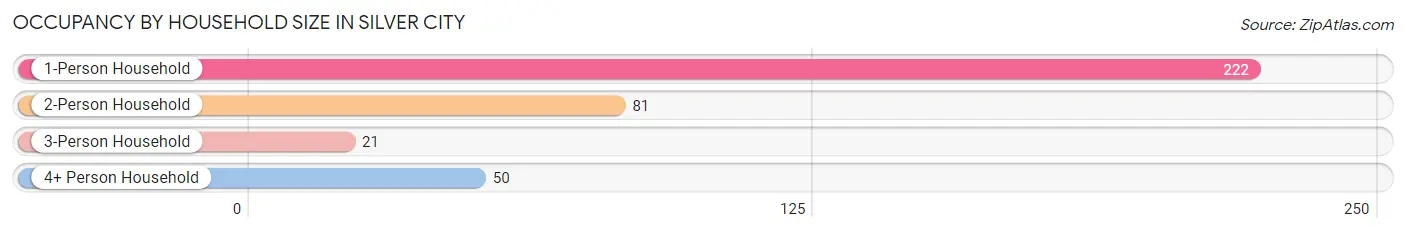
| Household Size | # Housing Units | % Housing Units |
| 1-Person Household | 222 | 59.4% |
| 2-Person Household | 81 | 21.7% |
| 3-Person Household | 21 | 5.6% |
| 4+ Person Household | 50 | 13.4% |
| Total Housing Units | 374 | 100.0% |
Occupancy by Ownership by Household Size in Silver City
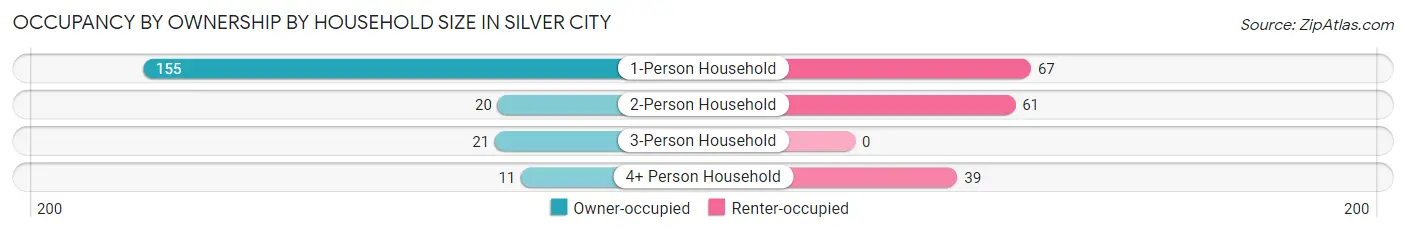
| Household Size | Owner-occupied | Renter-occupied |
| 1-Person Household | 155 (69.8%) | 67 (30.2%) |
| 2-Person Household | 20 (24.7%) | 61 (75.3%) |
| 3-Person Household | 21 (100.0%) | 0 (0.0%) |
| 4+ Person Household | 11 (22.0%) | 39 (78.0%) |
| Total Housing Units | 207 (55.3%) | 167 (44.7%) |
Occupancy by Educational Attainment in Silver City
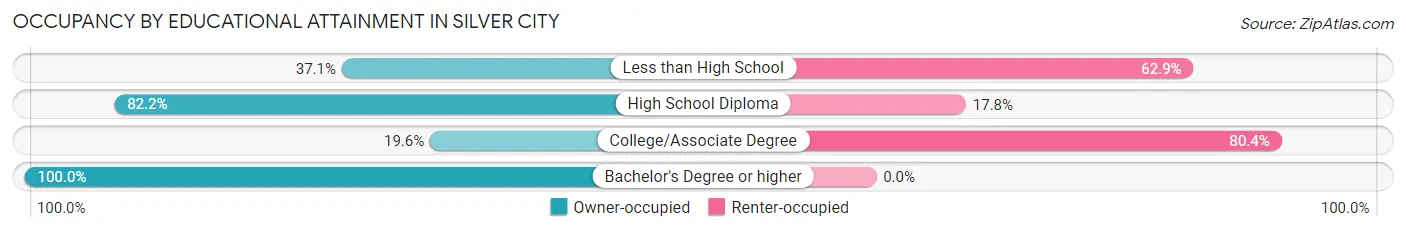
| Household Size | Owner-occupied | Renter-occupied |
| Less than High School | 36 (37.1%) | 61 (62.9%) |
| High School Diploma | 111 (82.2%) | 24 (17.8%) |
| College/Associate Degree | 20 (19.6%) | 82 (80.4%) |
| Bachelor's Degree or higher | 40 (100.0%) | 0 (0.0%) |
Occupancy by Age of Householder in Silver City
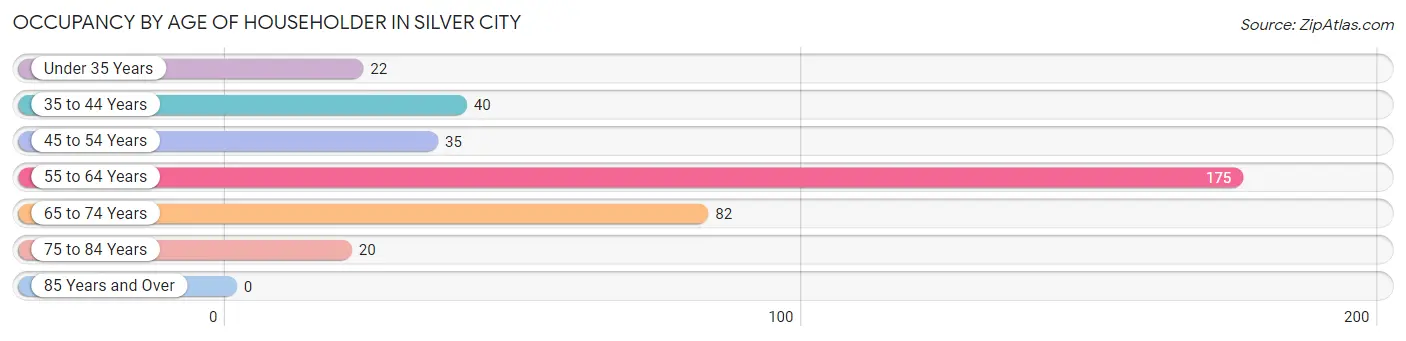
| Age Bracket | # Households | % Households |
| Under 35 Years | 22 | 5.9% |
| 35 to 44 Years | 40 | 10.7% |
| 45 to 54 Years | 35 | 9.4% |
| 55 to 64 Years | 175 | 46.8% |
| 65 to 74 Years | 82 | 21.9% |
| 75 to 84 Years | 20 | 5.3% |
| 85 Years and Over | 0 | 0.0% |
| Total | 374 | 100.0% |
Housing Finances in Silver City
Median Income by Occupancy in Silver City
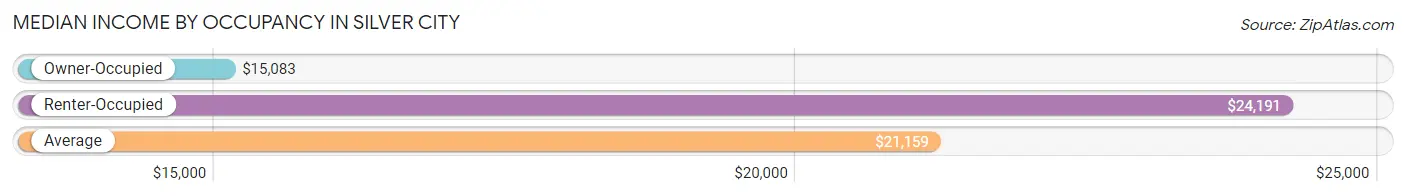
| Occupancy Type | # Households | Median Income |
| Owner-Occupied | 207 (55.3%) | $15,083 |
| Renter-Occupied | 167 (44.7%) | $24,191 |
| Average | 374 (100.0%) | $21,159 |
Occupancy by Householder Income Bracket in Silver City
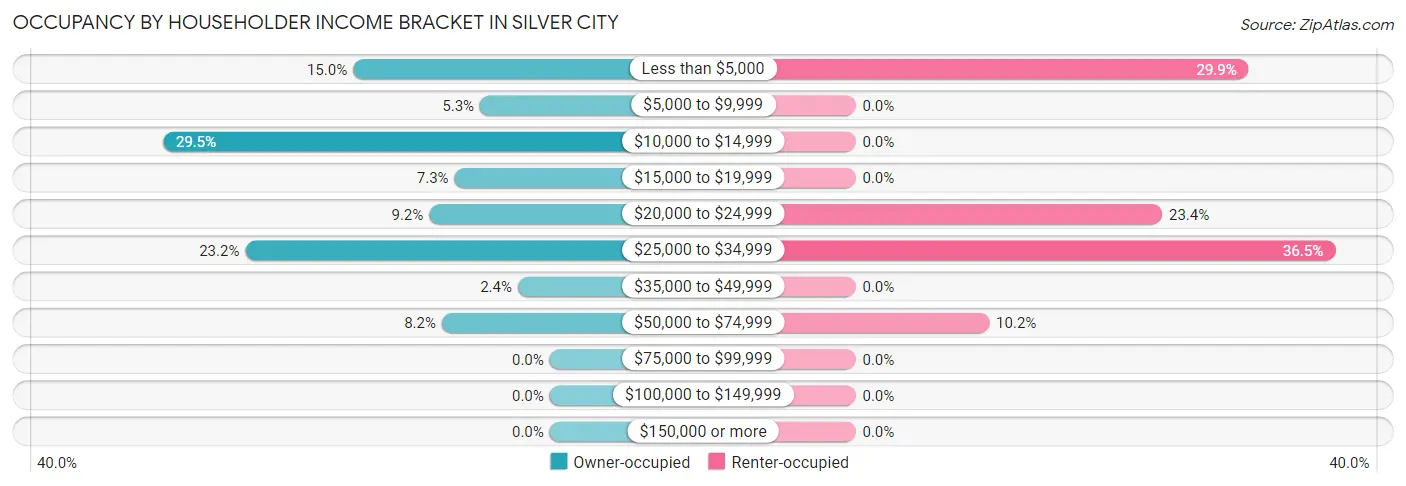
| Income Bracket | Owner-occupied | Renter-occupied |
| Less than $5,000 | 31 (15.0%) | 50 (29.9%) |
| $5,000 to $9,999 | 11 (5.3%) | 0 (0.0%) |
| $10,000 to $14,999 | 61 (29.5%) | 0 (0.0%) |
| $15,000 to $19,999 | 15 (7.2%) | 0 (0.0%) |
| $20,000 to $24,999 | 19 (9.2%) | 39 (23.4%) |
| $25,000 to $34,999 | 48 (23.2%) | 61 (36.5%) |
| $35,000 to $49,999 | 5 (2.4%) | 0 (0.0%) |
| $50,000 to $74,999 | 17 (8.2%) | 17 (10.2%) |
| $75,000 to $99,999 | 0 (0.0%) | 0 (0.0%) |
| $100,000 to $149,999 | 0 (0.0%) | 0 (0.0%) |
| $150,000 or more | 0 (0.0%) | 0 (0.0%) |
| Total | 207 (100.0%) | 167 (100.0%) |
Monthly Housing Cost Tiers in Silver City
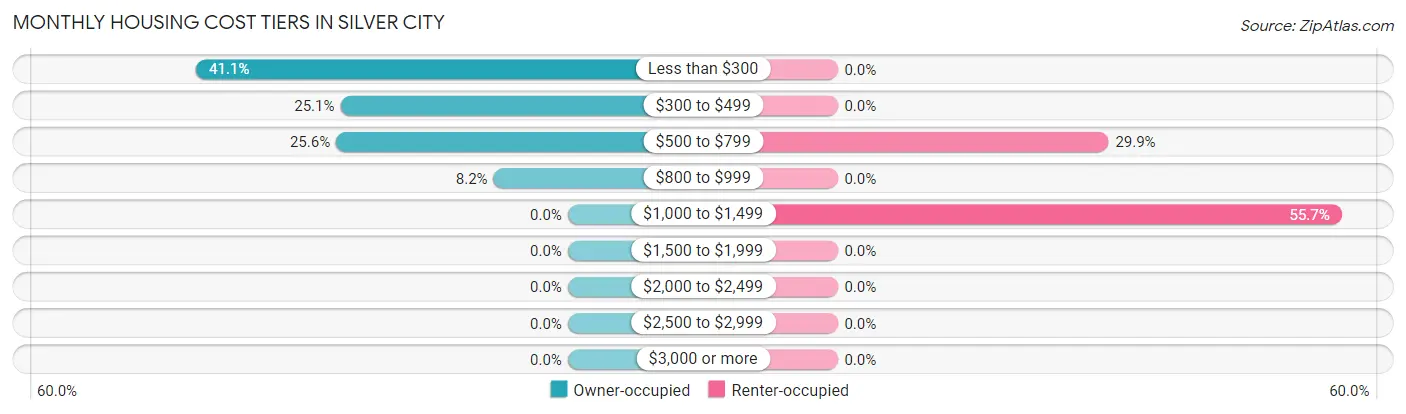
| Monthly Cost | Owner-occupied | Renter-occupied |
| Less than $300 | 85 (41.1%) | 0 (0.0%) |
| $300 to $499 | 52 (25.1%) | 0 (0.0%) |
| $500 to $799 | 53 (25.6%) | 50 (29.9%) |
| $800 to $999 | 17 (8.2%) | 0 (0.0%) |
| $1,000 to $1,499 | 0 (0.0%) | 93 (55.7%) |
| $1,500 to $1,999 | 0 (0.0%) | 0 (0.0%) |
| $2,000 to $2,499 | 0 (0.0%) | 0 (0.0%) |
| $2,500 to $2,999 | 0 (0.0%) | 0 (0.0%) |
| $3,000 or more | 0 (0.0%) | 0 (0.0%) |
| Total | 207 (100.0%) | 167 (100.0%) |
Physical Housing Characteristics in Silver City
Housing Structures in Silver City
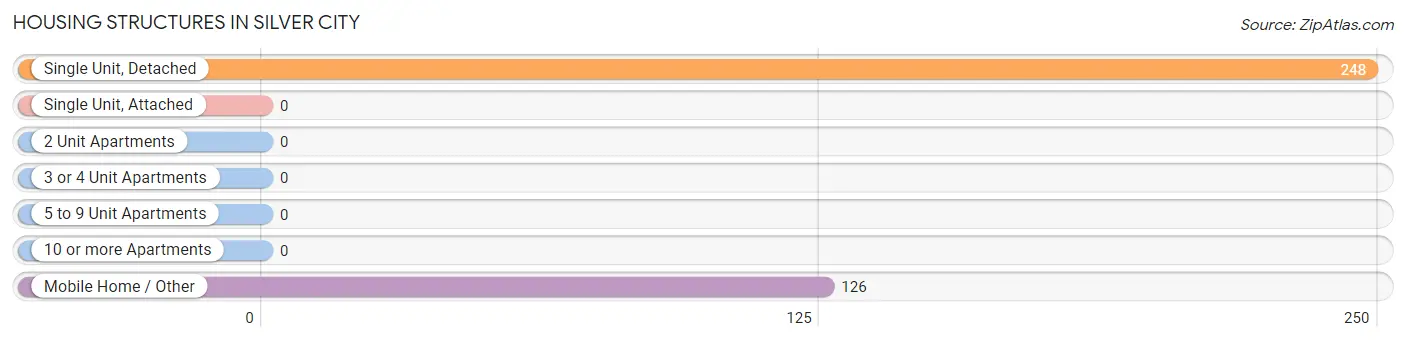
| Structure Type | # Housing Units | % Housing Units |
| Single Unit, Detached | 248 | 66.3% |
| Single Unit, Attached | 0 | 0.0% |
| 2 Unit Apartments | 0 | 0.0% |
| 3 or 4 Unit Apartments | 0 | 0.0% |
| 5 to 9 Unit Apartments | 0 | 0.0% |
| 10 or more Apartments | 0 | 0.0% |
| Mobile Home / Other | 126 | 33.7% |
| Total | 374 | 100.0% |
Housing Structures by Occupancy in Silver City
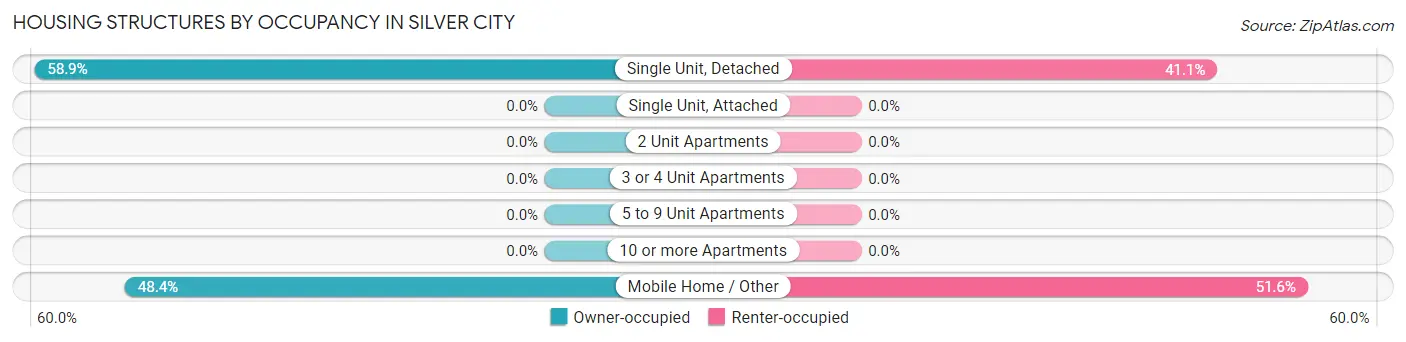
| Structure Type | Owner-occupied | Renter-occupied |
| Single Unit, Detached | 146 (58.9%) | 102 (41.1%) |
| Single Unit, Attached | 0 (0.0%) | 0 (0.0%) |
| 2 Unit Apartments | 0 (0.0%) | 0 (0.0%) |
| 3 or 4 Unit Apartments | 0 (0.0%) | 0 (0.0%) |
| 5 to 9 Unit Apartments | 0 (0.0%) | 0 (0.0%) |
| 10 or more Apartments | 0 (0.0%) | 0 (0.0%) |
| Mobile Home / Other | 61 (48.4%) | 65 (51.6%) |
| Total | 207 (55.3%) | 167 (44.7%) |
Housing Structures by Number of Rooms in Silver City
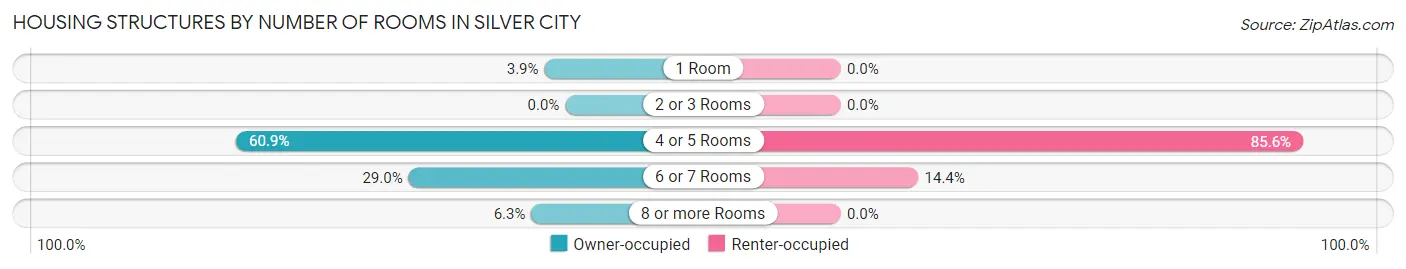
| Number of Rooms | Owner-occupied | Renter-occupied |
| 1 Room | 8 (3.9%) | 0 (0.0%) |
| 2 or 3 Rooms | 0 (0.0%) | 0 (0.0%) |
| 4 or 5 Rooms | 126 (60.9%) | 143 (85.6%) |
| 6 or 7 Rooms | 60 (29.0%) | 24 (14.4%) |
| 8 or more Rooms | 13 (6.3%) | 0 (0.0%) |
| Total | 207 (100.0%) | 167 (100.0%) |
Housing Structure by Heating Type in Silver City
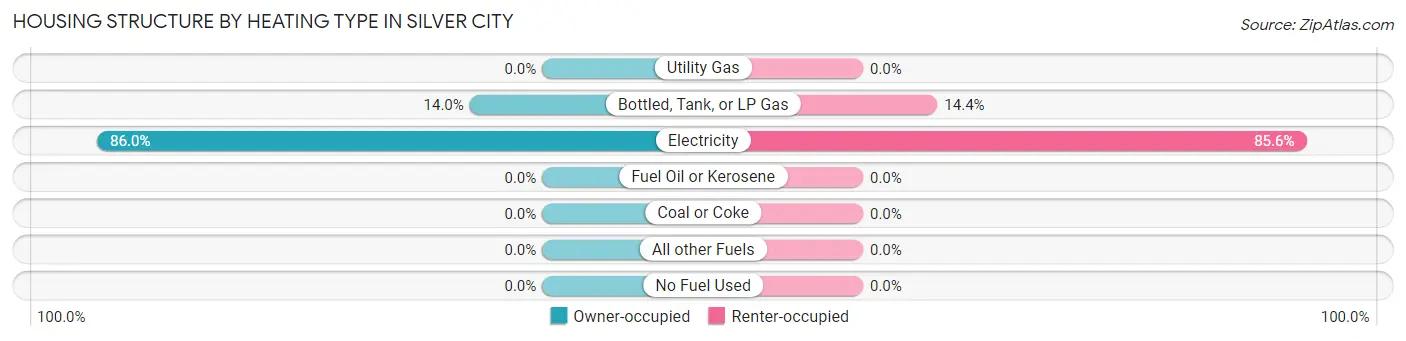
| Heating Type | Owner-occupied | Renter-occupied |
| Utility Gas | 0 (0.0%) | 0 (0.0%) |
| Bottled, Tank, or LP Gas | 29 (14.0%) | 24 (14.4%) |
| Electricity | 178 (86.0%) | 143 (85.6%) |
| Fuel Oil or Kerosene | 0 (0.0%) | 0 (0.0%) |
| Coal or Coke | 0 (0.0%) | 0 (0.0%) |
| All other Fuels | 0 (0.0%) | 0 (0.0%) |
| No Fuel Used | 0 (0.0%) | 0 (0.0%) |
| Total | 207 (100.0%) | 167 (100.0%) |
Household Vehicle Usage in Silver City
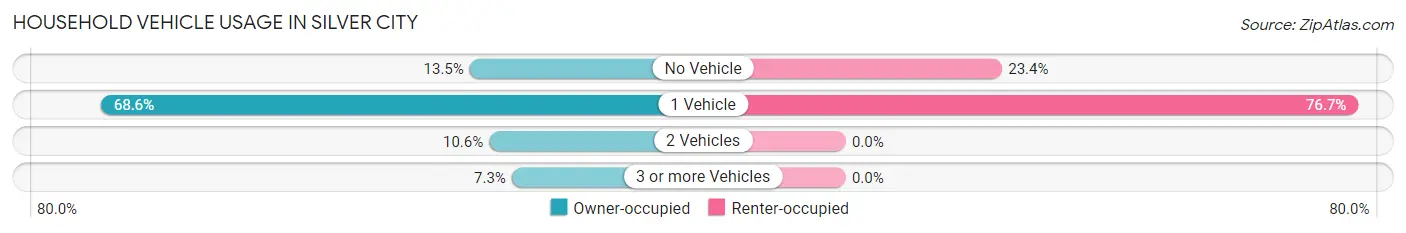
| Vehicles per Household | Owner-occupied | Renter-occupied |
| No Vehicle | 28 (13.5%) | 39 (23.4%) |
| 1 Vehicle | 142 (68.6%) | 128 (76.6%) |
| 2 Vehicles | 22 (10.6%) | 0 (0.0%) |
| 3 or more Vehicles | 15 (7.2%) | 0 (0.0%) |
| Total | 207 (100.0%) | 167 (100.0%) |
Real Estate & Mortgages in Silver City
Real Estate and Mortgage Overview in Silver City
| Characteristic | Without Mortgage | With Mortgage |
| Housing Units | 150 | 57 |
| Median Property Value | $110,000 | $0 |
| Median Household Income | $17,000 | $0 |
| Monthly Housing Costs | $289 | $0 |
| Real Estate Taxes | $654 | $0 |
Property Value by Mortgage Status in Silver City
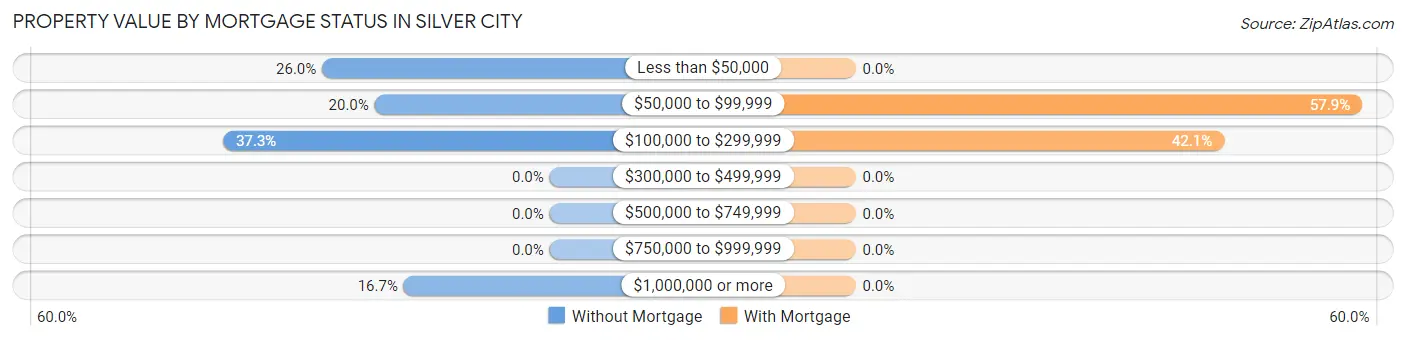
| Property Value | Without Mortgage | With Mortgage |
| Less than $50,000 | 39 (26.0%) | 0 (0.0%) |
| $50,000 to $99,999 | 30 (20.0%) | 33 (57.9%) |
| $100,000 to $299,999 | 56 (37.3%) | 24 (42.1%) |
| $300,000 to $499,999 | 0 (0.0%) | 0 (0.0%) |
| $500,000 to $749,999 | 0 (0.0%) | 0 (0.0%) |
| $750,000 to $999,999 | 0 (0.0%) | 0 (0.0%) |
| $1,000,000 or more | 25 (16.7%) | 0 (0.0%) |
| Total | 150 (100.0%) | 57 (100.0%) |
Household Income by Mortgage Status in Silver City
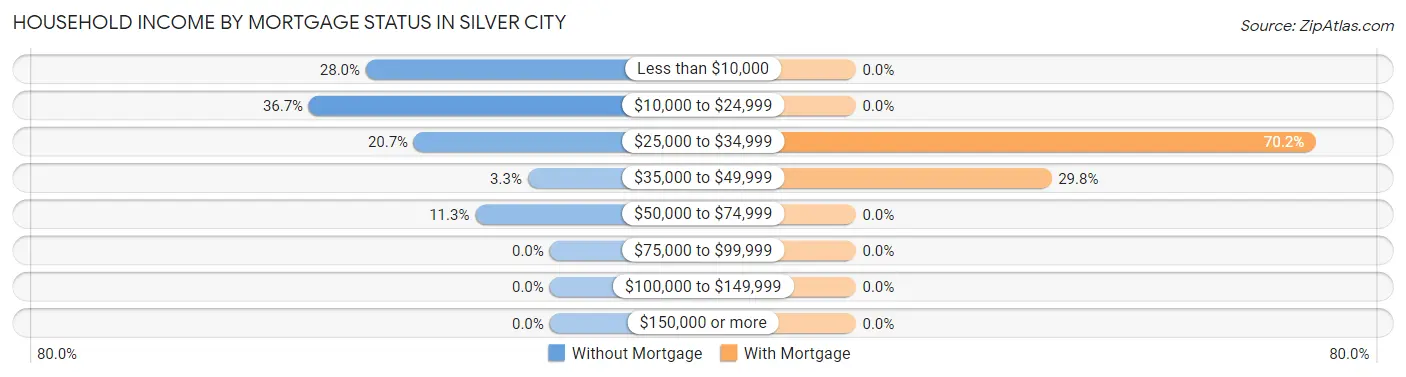
| Household Income | Without Mortgage | With Mortgage |
| Less than $10,000 | 42 (28.0%) | 0 (0.0%) |
| $10,000 to $24,999 | 55 (36.7%) | 0 (0.0%) |
| $25,000 to $34,999 | 31 (20.7%) | 40 (70.2%) |
| $35,000 to $49,999 | 5 (3.3%) | 17 (29.8%) |
| $50,000 to $74,999 | 17 (11.3%) | 0 (0.0%) |
| $75,000 to $99,999 | 0 (0.0%) | 0 (0.0%) |
| $100,000 to $149,999 | 0 (0.0%) | 0 (0.0%) |
| $150,000 or more | 0 (0.0%) | 0 (0.0%) |
| Total | 150 (100.0%) | 57 (100.0%) |
Property Value to Household Income Ratio in Silver City
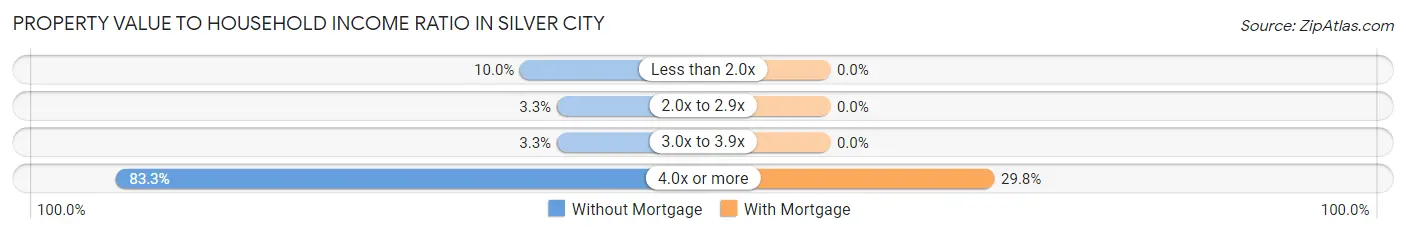
| Value-to-Income Ratio | Without Mortgage | With Mortgage |
| Less than 2.0x | 15 (10.0%) | 0 (0.0%) |
| 2.0x to 2.9x | 5 (3.3%) | 0 (0.0%) |
| 3.0x to 3.9x | 5 (3.3%) | 0 (0.0%) |
| 4.0x or more | 125 (83.3%) | 17 (29.8%) |
| Total | 150 (100.0%) | 57 (100.0%) |
Real Estate Taxes by Mortgage Status in Silver City
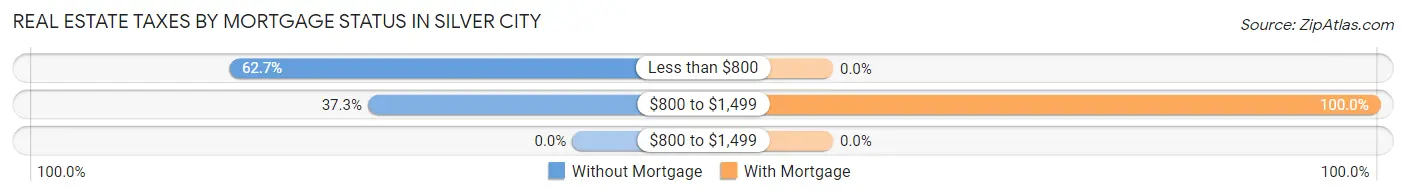
| Property Taxes | Without Mortgage | With Mortgage |
| Less than $800 | 94 (62.7%) | 0 (0.0%) |
| $800 to $1,499 | 56 (37.3%) | 57 (100.0%) |
| $800 to $1,499 | 0 (0.0%) | 0 (0.0%) |
| Total | 150 (100.0%) | 57 (100.0%) |
Health & Disability in Silver City
Health Insurance Coverage by Age in Silver City
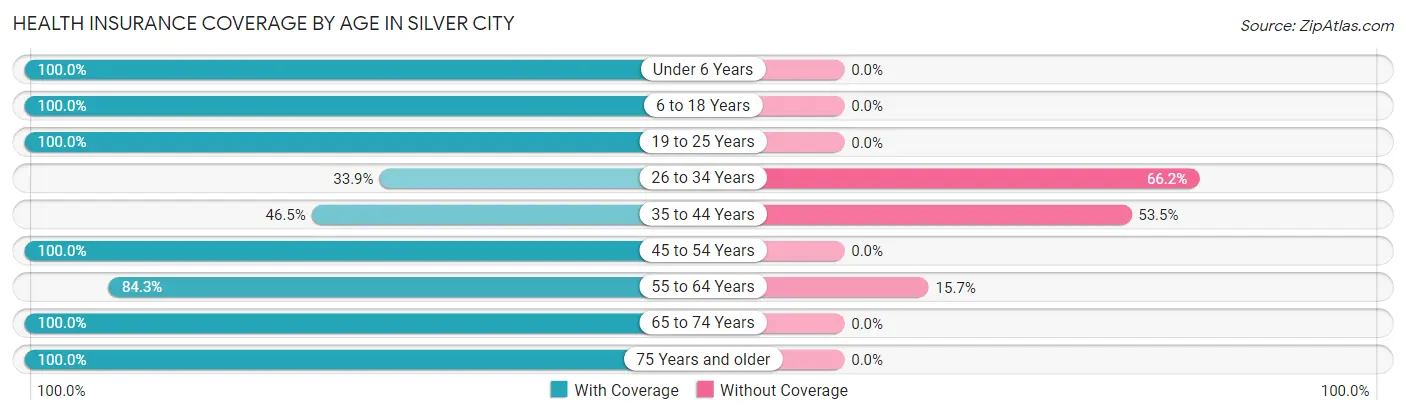
| Age Bracket | With Coverage | Without Coverage |
| Under 6 Years | 32 (100.0%) | 0 (0.0%) |
| 6 to 18 Years | 215 (100.0%) | 0 (0.0%) |
| 19 to 25 Years | 13 (100.0%) | 0 (0.0%) |
| 26 to 34 Years | 22 (33.9%) | 43 (66.1%) |
| 35 to 44 Years | 33 (46.5%) | 38 (53.5%) |
| 45 to 54 Years | 35 (100.0%) | 0 (0.0%) |
| 55 to 64 Years | 225 (84.3%) | 42 (15.7%) |
| 65 to 74 Years | 82 (100.0%) | 0 (0.0%) |
| 75 Years and older | 39 (100.0%) | 0 (0.0%) |
| Total | 696 (85.0%) | 123 (15.0%) |
Health Insurance Coverage by Citizenship Status in Silver City
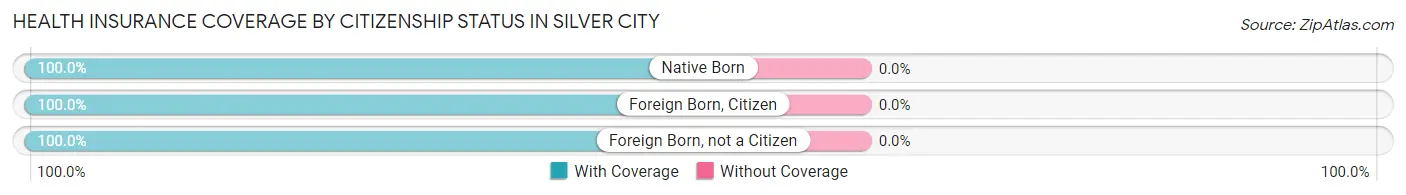
| Citizenship Status | With Coverage | Without Coverage |
| Native Born | 32 (100.0%) | 0 (0.0%) |
| Foreign Born, Citizen | 215 (100.0%) | 0 (0.0%) |
| Foreign Born, not a Citizen | 13 (100.0%) | 0 (0.0%) |
Health Insurance Coverage by Household Income in Silver City
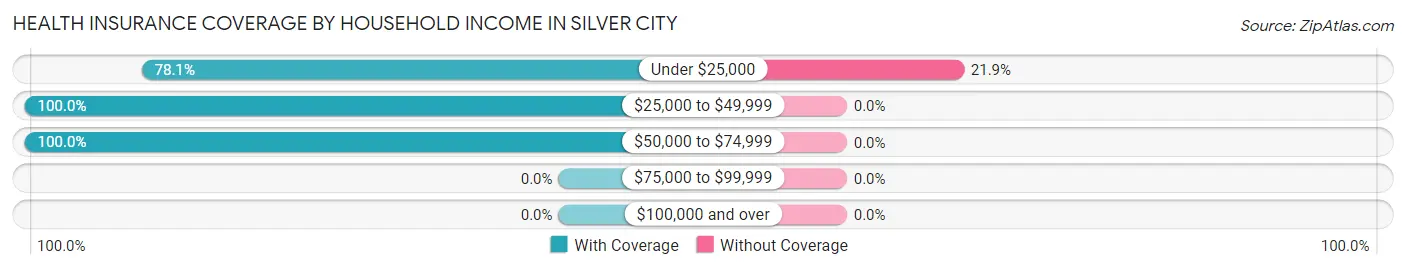
| Household Income | With Coverage | Without Coverage |
| Under $25,000 | 438 (78.1%) | 123 (21.9%) |
| $25,000 to $49,999 | 214 (100.0%) | 0 (0.0%) |
| $50,000 to $74,999 | 44 (100.0%) | 0 (0.0%) |
| $75,000 to $99,999 | 0 (0.0%) | 0 (0.0%) |
| $100,000 and over | 0 (0.0%) | 0 (0.0%) |
Public vs Private Health Insurance Coverage by Age in Silver City
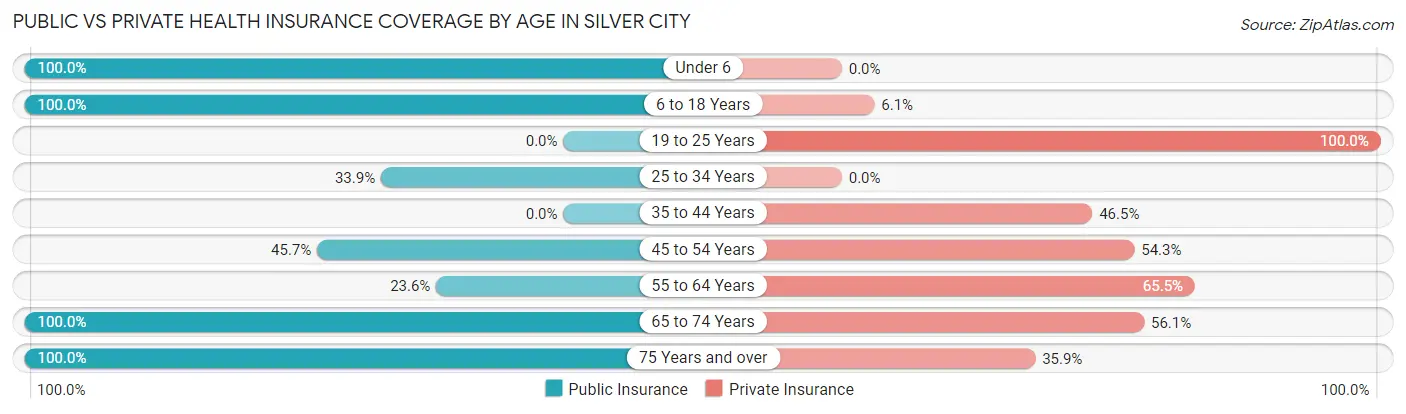
| Age Bracket | Public Insurance | Private Insurance |
| Under 6 | 32 (100.0%) | 0 (0.0%) |
| 6 to 18 Years | 215 (100.0%) | 13 (6.0%) |
| 19 to 25 Years | 0 (0.0%) | 13 (100.0%) |
| 25 to 34 Years | 22 (33.9%) | 0 (0.0%) |
| 35 to 44 Years | 0 (0.0%) | 33 (46.5%) |
| 45 to 54 Years | 16 (45.7%) | 19 (54.3%) |
| 55 to 64 Years | 63 (23.6%) | 175 (65.5%) |
| 65 to 74 Years | 82 (100.0%) | 46 (56.1%) |
| 75 Years and over | 39 (100.0%) | 14 (35.9%) |
| Total | 469 (57.3%) | 313 (38.2%) |
Disability Status by Sex by Age in Silver City
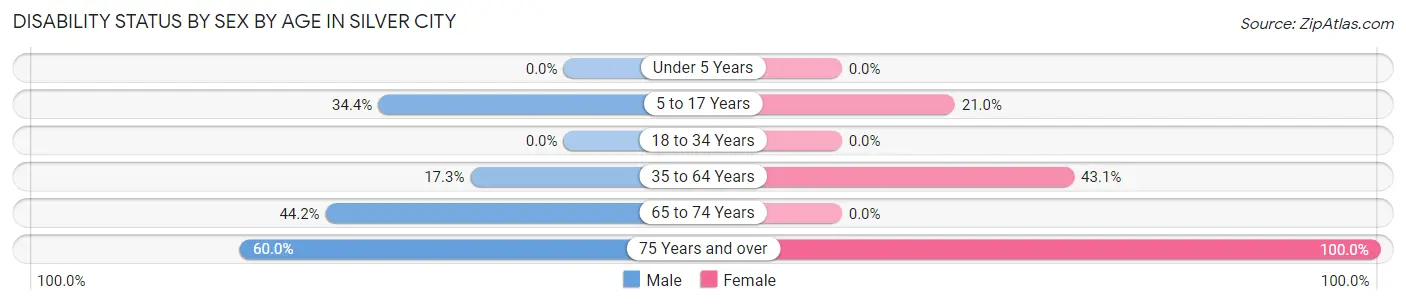
| Age Bracket | Male | Female |
| Under 5 Years | 0 (0.0%) | 0 (0.0%) |
| 5 to 17 Years | 44 (34.4%) | 13 (21.0%) |
| 18 to 34 Years | 0 (0.0%) | 0 (0.0%) |
| 35 to 64 Years | 28 (17.3%) | 91 (43.1%) |
| 65 to 74 Years | 34 (44.2%) | 0 (0.0%) |
| 75 Years and over | 15 (60.0%) | 14 (100.0%) |
Disability Class by Sex by Age in Silver City
Disability Class: Hearing Difficulty
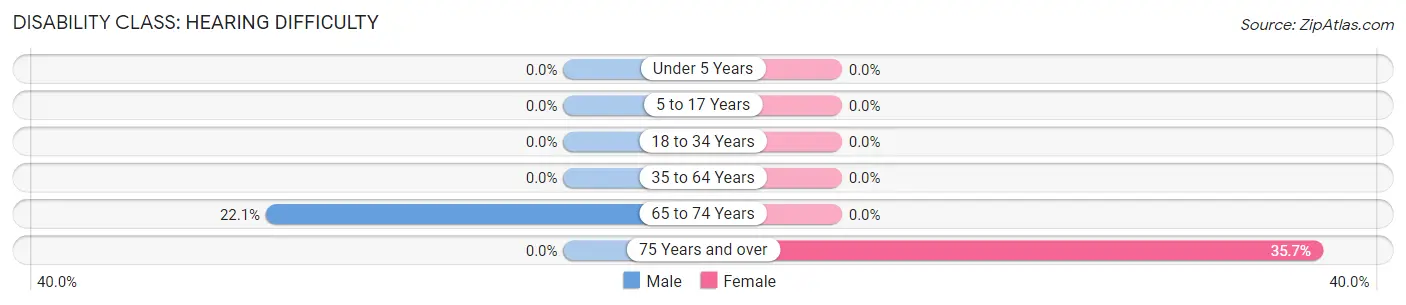
| Age Bracket | Male | Female |
| Under 5 Years | 0 (0.0%) | 0 (0.0%) |
| 5 to 17 Years | 0 (0.0%) | 0 (0.0%) |
| 18 to 34 Years | 0 (0.0%) | 0 (0.0%) |
| 35 to 64 Years | 0 (0.0%) | 0 (0.0%) |
| 65 to 74 Years | 17 (22.1%) | 0 (0.0%) |
| 75 Years and over | 0 (0.0%) | 5 (35.7%) |
Disability Class: Vision Difficulty
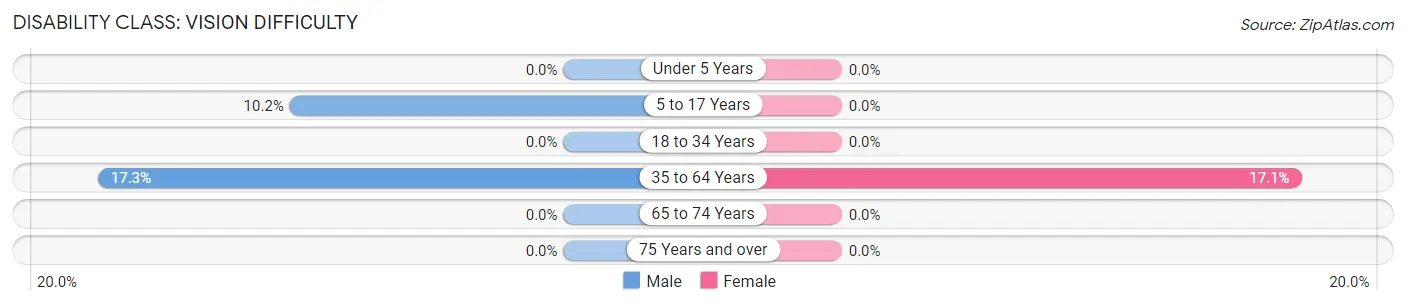
| Age Bracket | Male | Female |
| Under 5 Years | 0 (0.0%) | 0 (0.0%) |
| 5 to 17 Years | 13 (10.2%) | 0 (0.0%) |
| 18 to 34 Years | 0 (0.0%) | 0 (0.0%) |
| 35 to 64 Years | 28 (17.3%) | 36 (17.1%) |
| 65 to 74 Years | 0 (0.0%) | 0 (0.0%) |
| 75 Years and over | 0 (0.0%) | 0 (0.0%) |
Disability Class: Cognitive Difficulty
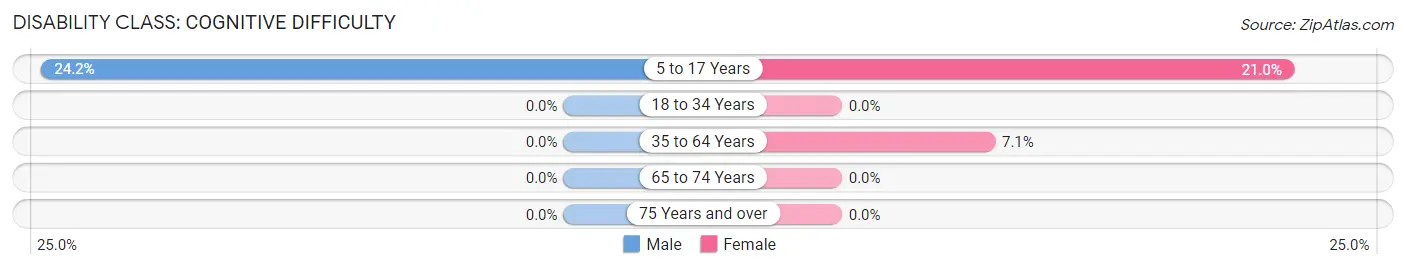
| Age Bracket | Male | Female |
| 5 to 17 Years | 31 (24.2%) | 13 (21.0%) |
| 18 to 34 Years | 0 (0.0%) | 0 (0.0%) |
| 35 to 64 Years | 0 (0.0%) | 15 (7.1%) |
| 65 to 74 Years | 0 (0.0%) | 0 (0.0%) |
| 75 Years and over | 0 (0.0%) | 0 (0.0%) |
Disability Class: Ambulatory Difficulty
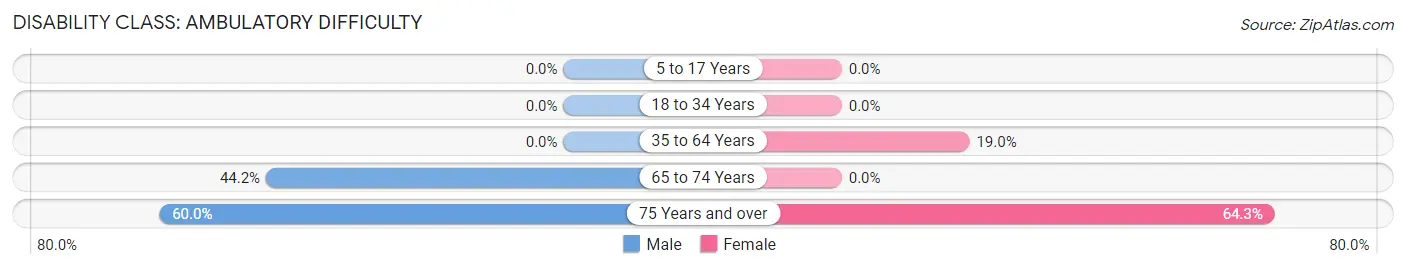
| Age Bracket | Male | Female |
| 5 to 17 Years | 0 (0.0%) | 0 (0.0%) |
| 18 to 34 Years | 0 (0.0%) | 0 (0.0%) |
| 35 to 64 Years | 0 (0.0%) | 40 (19.0%) |
| 65 to 74 Years | 34 (44.2%) | 0 (0.0%) |
| 75 Years and over | 15 (60.0%) | 9 (64.3%) |
Disability Class: Self-Care Difficulty
| Age Bracket | Male | Female |
| 5 to 17 Years | 0 (0.0%) | 0 (0.0%) |
| 18 to 34 Years | 0 (0.0%) | 0 (0.0%) |
| 35 to 64 Years | 0 (0.0%) | 0 (0.0%) |
| 65 to 74 Years | 0 (0.0%) | 0 (0.0%) |
| 75 Years and over | 0 (0.0%) | 0 (0.0%) |
Technology Access in Silver City
Computing Device Access in Silver City
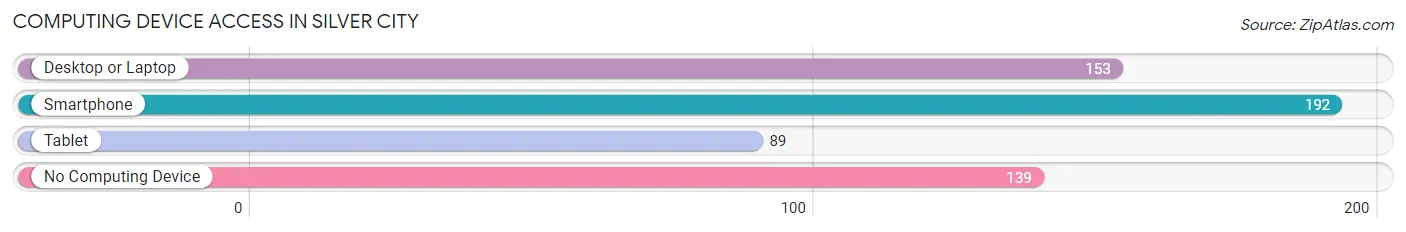
| Device Type | # Households | % Households |
| Desktop or Laptop | 153 | 40.9% |
| Smartphone | 192 | 51.3% |
| Tablet | 89 | 23.8% |
| No Computing Device | 139 | 37.2% |
| Total | 374 | 100.0% |
Internet Access in Silver City
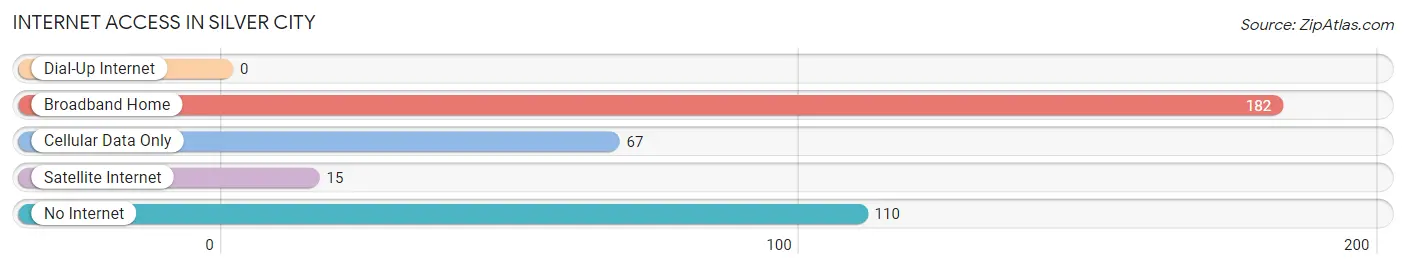
| Internet Type | # Households | % Households |
| Dial-Up Internet | 0 | 0.0% |
| Broadband Home | 182 | 48.7% |
| Cellular Data Only | 67 | 17.9% |
| Satellite Internet | 15 | 4.0% |
| No Internet | 110 | 29.4% |
| Total | 374 | 100.0% |
Silver City Summary
Silver City is a small town located in the western part of North Carolina, in the foothills of the Blue Ridge Mountains. It is situated in the Catawba County, and is part of the Hickory-Lenoir-Morganton Metropolitan Statistical Area. The town has a population of approximately 1,500 people, and is known for its small-town charm and friendly atmosphere.
History
Silver City was founded in 1883 by a group of settlers from the nearby town of Hickory. The town was named after the silver ore that was discovered in the area, and the settlers quickly began to mine the ore and build a small community. The town grew quickly, and by the early 1900s, it had become a bustling center of commerce and industry. The town was home to several factories, including a cotton mill, a furniture factory, and a shoe factory.
In the early 1900s, Silver City was also home to a thriving African-American community. The town was home to several churches, schools, and businesses that served the African-American population. The town was also home to a number of African-American-owned businesses, including a barber shop, a grocery store, and a restaurant.
Geography
Silver City is located in the foothills of the Blue Ridge Mountains, in the western part of North Carolina. The town is situated in the Catawba County, and is part of the Hickory-Lenoir-Morganton Metropolitan Statistical Area. The town is located at an elevation of 1,000 feet, and is surrounded by rolling hills and lush forests. The town is located near several major highways, including Interstate 40 and US Highway 321.
Economy
Silver City’s economy is largely based on tourism and agriculture. The town is home to several tourist attractions, including the Silver City Museum, the Silver City Historic District, and the Silver City Arts Center. The town is also home to several farms, which produce a variety of crops, including corn, soybeans, and tobacco.
Demographics
As of the 2010 census, Silver City had a population of 1,500 people. The town is predominantly white, with approximately 90% of the population identifying as Caucasian. The town is also home to a small African-American population, with approximately 5% of the population identifying as African-American. The town is also home to a small Hispanic population, with approximately 3% of the population identifying as Hispanic or Latino. The median household income in Silver City is approximately $35,000, and the median home value is approximately $125,000.
Common Questions
What is Per Capita Income in Silver City?
Per Capita income in Silver City is $10,579.
What is the Median Household income in Silver City?
Median Household Income in Silver City is $21,159.
What is Inequality or Gini Index in Silver City?
Inequality or Gini Index in Silver City is 0.42.
What is the Total Population of Silver City?
Total Population of Silver City is 819.
What is the Total Male Population of Silver City?
Total Male Population of Silver City is 486.
What is the Total Female Population of Silver City?
Total Female Population of Silver City is 333.
What is the Ratio of Males per 100 Females in Silver City?
There are 145.95 Males per 100 Females in Silver City.
What is the Ratio of Females per 100 Males in Silver City?
There are 68.52 Females per 100 Males in Silver City.
What is the Median Population Age in Silver City?
Median Population Age in Silver City is 47.8 Years.
What is the Average Family Size in Silver City
Average Family Size in Silver City is 4.7 People.
What is the Average Household Size in Silver City
Average Household Size in Silver City is 2.2 People.
How Large is the Labor Force in Silver City?
There are 332 People in the Labor Forcein in Silver City.
What is the Percentage of People in the Labor Force in Silver City?
55.6% of People are in the Labor Force in Silver City.
What is the Unemployment Rate in Silver City?
Unemployment Rate in Silver City is 5.7%.