Leggett, NC Map & Demographics
Leggett Map
Leggett Overview
$63,300
PER CAPITA INCOME
$52,500
AVG FAMILY INCOME
$48,438
AVG HOUSEHOLD INCOME
0.57
INEQUALITY / GINI INDEX
55
TOTAL POPULATION
21
MALE POPULATION
34
FEMALE POPULATION
61.76
MALES / 100 FEMALES
161.90
FEMALES / 100 MALES
59.5
MEDIAN AGE
3.4
AVG FAMILY SIZE
2.4
AVG HOUSEHOLD SIZE
17
LABOR FORCE [ PEOPLE ]
41.5%
PERCENT IN LABOR FORCE
Leggett Area Codes
Income in Leggett
Income Overview in Leggett
Per Capita Income in Leggett is $63,300, while median incomes of families and households are $52,500 and $48,438 respectively.
| Characteristic | Number | Measure |
| Per Capita Income | 55 | $63,300 |
| Median Family Income | 12 | $52,500 |
| Mean Family Income | 12 | $148,317 |
| Median Household Income | 23 | $48,438 |
| Mean Household Income | 23 | $97,096 |
| Income Deficit | 12 | $0 |
| Wage / Income Gap (%) | 55 | 0.00% |
| Wage / Income Gap ($) | 55 | 100.00¢ per $1 |
| Gini / Inequality Index | 55 | 0.57 |
Earnings by Sex in Leggett
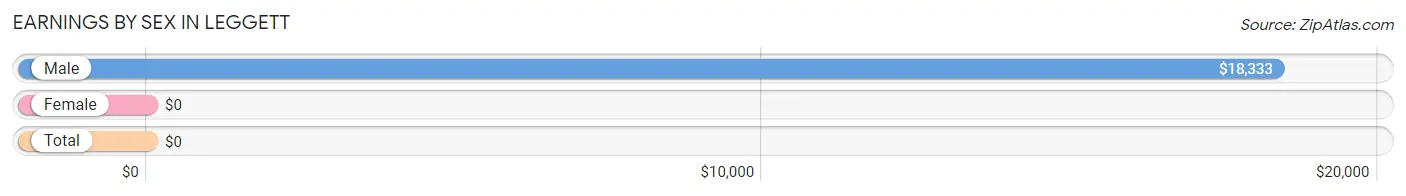
| Sex | Number | Average Earnings |
| Male | 10 (55.6%) | $18,333 |
| Female | 8 (44.4%) | $0 |
| Total | 18 (100.0%) | $0 |
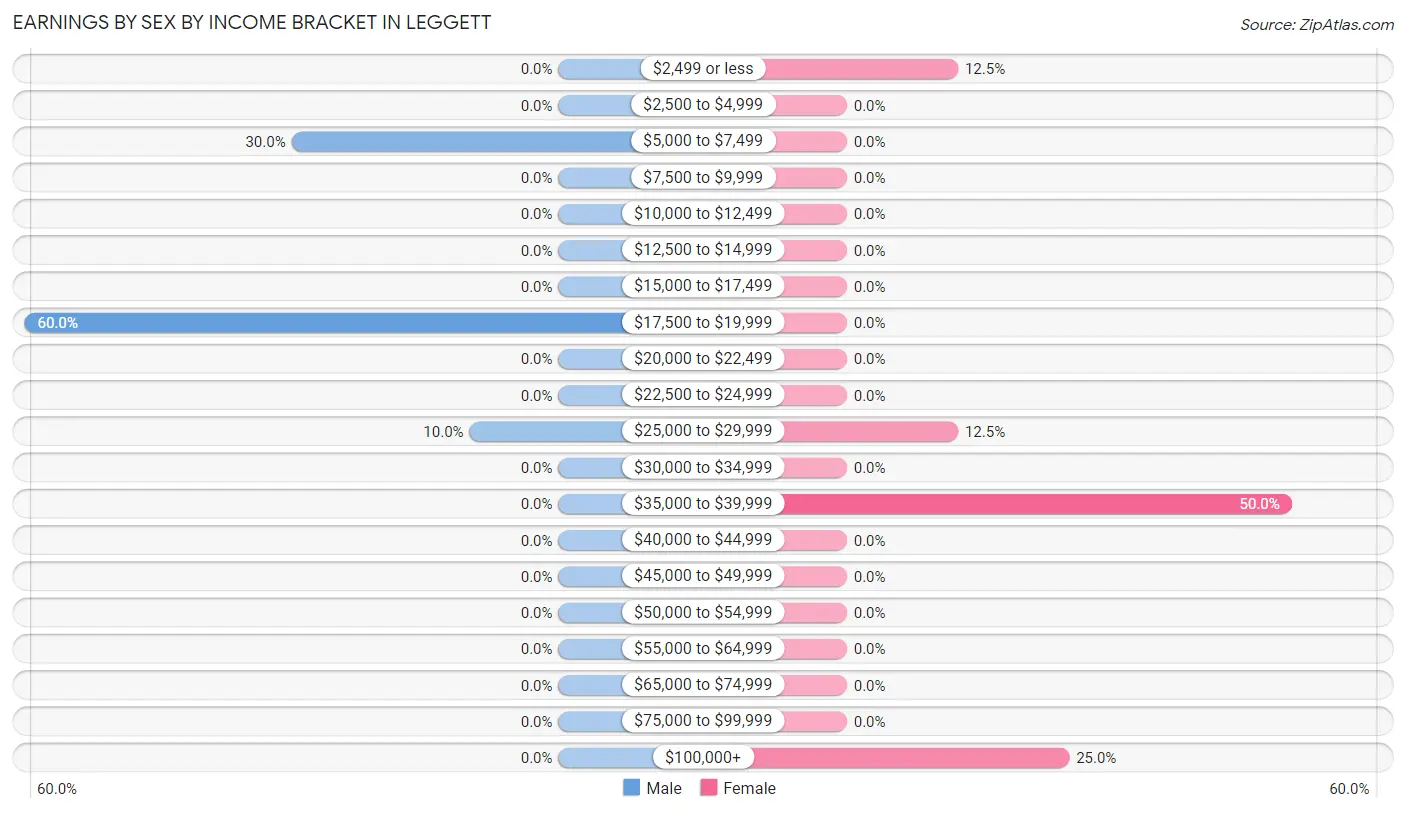
Earnings by Sex by Income Bracket in Leggett
The most common earnings brackets in Leggett are $17,500 to $19,999 for men (6 | 60.0%) and $35,000 to $39,999 for women (4 | 50.0%).
| Income | Male | Female |
| $2,499 or less | 0 (0.0%) | 1 (12.5%) |
| $2,500 to $4,999 | 0 (0.0%) | 0 (0.0%) |
| $5,000 to $7,499 | 3 (30.0%) | 0 (0.0%) |
| $7,500 to $9,999 | 0 (0.0%) | 0 (0.0%) |
| $10,000 to $12,499 | 0 (0.0%) | 0 (0.0%) |
| $12,500 to $14,999 | 0 (0.0%) | 0 (0.0%) |
| $15,000 to $17,499 | 0 (0.0%) | 0 (0.0%) |
| $17,500 to $19,999 | 6 (60.0%) | 0 (0.0%) |
| $20,000 to $22,499 | 0 (0.0%) | 0 (0.0%) |
| $22,500 to $24,999 | 0 (0.0%) | 0 (0.0%) |
| $25,000 to $29,999 | 1 (10.0%) | 1 (12.5%) |
| $30,000 to $34,999 | 0 (0.0%) | 0 (0.0%) |
| $35,000 to $39,999 | 0 (0.0%) | 4 (50.0%) |
| $40,000 to $44,999 | 0 (0.0%) | 0 (0.0%) |
| $45,000 to $49,999 | 0 (0.0%) | 0 (0.0%) |
| $50,000 to $54,999 | 0 (0.0%) | 0 (0.0%) |
| $55,000 to $64,999 | 0 (0.0%) | 0 (0.0%) |
| $65,000 to $74,999 | 0 (0.0%) | 0 (0.0%) |
| $75,000 to $99,999 | 0 (0.0%) | 0 (0.0%) |
| $100,000+ | 0 (0.0%) | 2 (25.0%) |
| Total | 10 (100.0%) | 8 (100.0%) |
Earnings by Sex by Educational Attainment in Leggett
| Educational Attainment | Male Income | Female Income |
| Less than High School | - | - |
| High School Diploma | - | - |
| College or Associate's Degree | - | - |
| Bachelor's Degree | - | - |
| Graduate Degree | - | - |
| Total | $18,333 | $0 |
Family Income in Leggett
Family Income Brackets in Leggett
According to the Leggett family income data, there are 8 families falling into the $50,000 to $74,999 income range, which is the most common income bracket and makes up 66.7% of all families.
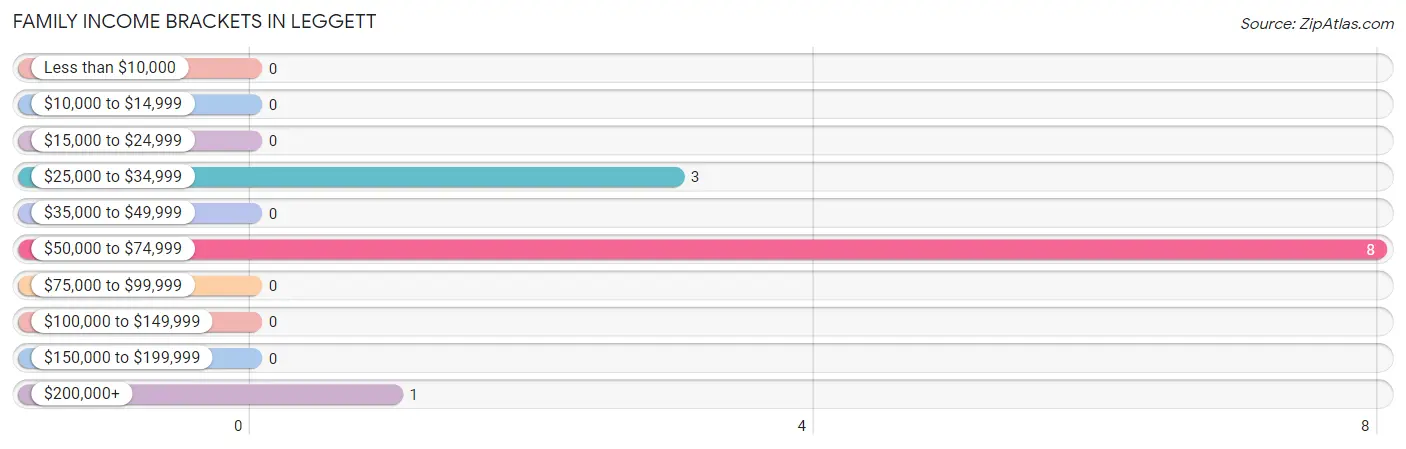
| Income Bracket | # Families | % Families |
| Less than $10,000 | 0 | 0.0% |
| $10,000 to $14,999 | 0 | 0.0% |
| $15,000 to $24,999 | 0 | 0.0% |
| $25,000 to $34,999 | 3 | 25.0% |
| $35,000 to $49,999 | 0 | 0.0% |
| $50,000 to $74,999 | 8 | 66.7% |
| $75,000 to $99,999 | 0 | 0.0% |
| $100,000 to $149,999 | 0 | 0.0% |
| $150,000 to $199,999 | 0 | 0.0% |
| $200,000+ | 1 | 8.3% |
Family Income by Famaliy Size in Leggett
| Income Bracket | # Families | Median Income |
| 2-Person Families | 5 (41.7%) | $0 |
| 3-Person Families | 3 (25.0%) | $0 |
| 4-Person Families | 4 (33.3%) | $0 |
| 5-Person Families | 0 (0.0%) | $0 |
| 6-Person Families | 0 (0.0%) | $0 |
| 7+ Person Families | 0 (0.0%) | $0 |
| Total | 12 (100.0%) | $52,500 |
Family Income by Number of Earners in Leggett
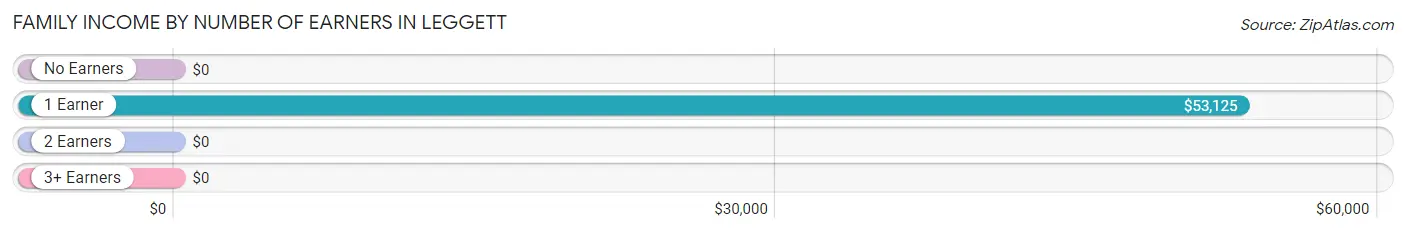
| Number of Earners | # Families | Median Income |
| No Earners | 3 (25.0%) | $0 |
| 1 Earner | 8 (66.7%) | $53,125 |
| 2 Earners | 1 (8.3%) | $0 |
| 3+ Earners | 0 (0.0%) | $0 |
| Total | 12 (100.0%) | $52,500 |
Household Income in Leggett
Household Income Brackets in Leggett
With 10 households falling in the category, the $35,000 to $49,999 income range is the most frequent in Leggett, accounting for 43.5% of all households.
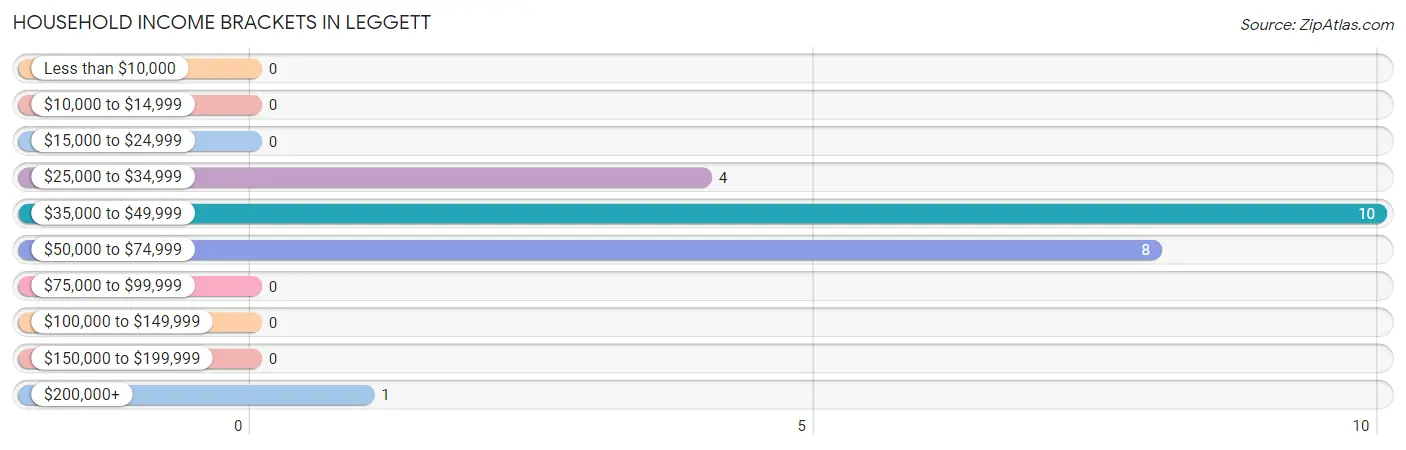
| Income Bracket | # Households | % Households |
| Less than $10,000 | 0 | 0.0% |
| $10,000 to $14,999 | 0 | 0.0% |
| $15,000 to $24,999 | 0 | 0.0% |
| $25,000 to $34,999 | 4 | 17.4% |
| $35,000 to $49,999 | 10 | 43.5% |
| $50,000 to $74,999 | 8 | 34.8% |
| $75,000 to $99,999 | 0 | 0.0% |
| $100,000 to $149,999 | 0 | 0.0% |
| $150,000 to $199,999 | 0 | 0.0% |
| $200,000+ | 1 | 4.3% |
Household Income by Householder Age in Leggett
The median household income in Leggett is $48,438, with the highest median household income of $39,375 found in the 65+ years age bracket for the primary householder. A total of 15 households (65.2%) fall into this category.
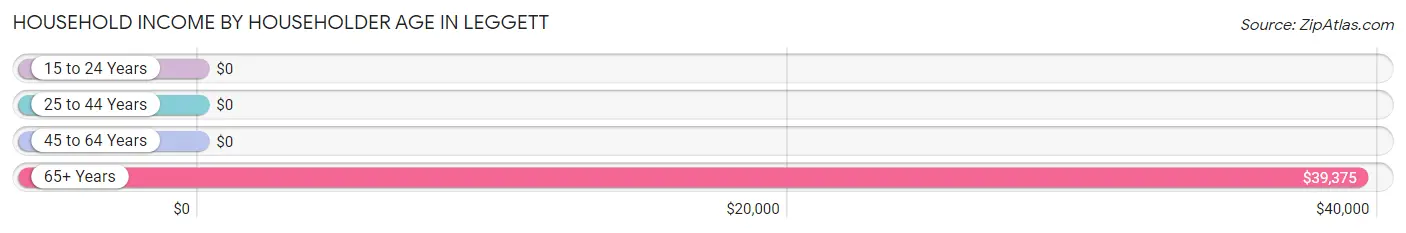
| Income Bracket | # Households | Median Income |
| 15 to 24 Years | 0 (0.0%) | $0 |
| 25 to 44 Years | 3 (13.0%) | $0 |
| 45 to 64 Years | 5 (21.7%) | $0 |
| 65+ Years | 15 (65.2%) | $39,375 |
| Total | 23 (100.0%) | $48,438 |
Poverty in Leggett
Income Below Poverty by Sex and Age in Leggett
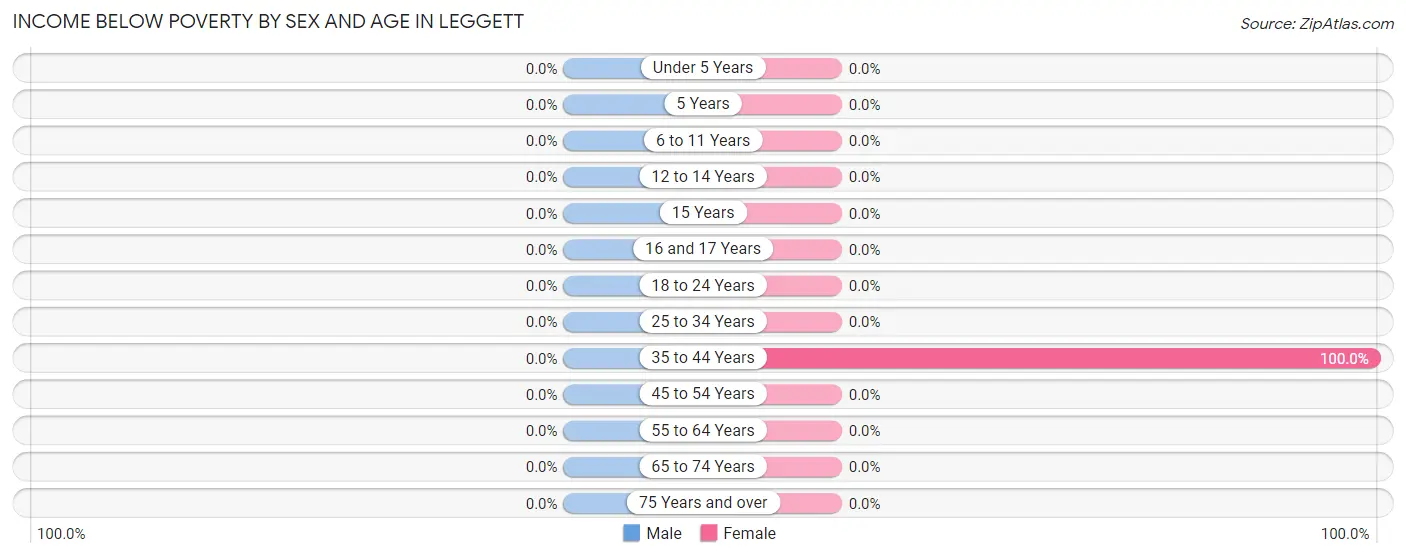
| Age Bracket | Male | Female |
| Under 5 Years | 0 (0.0%) | 0 (0.0%) |
| 5 Years | 0 (0.0%) | 0 (0.0%) |
| 6 to 11 Years | 0 (0.0%) | 0 (0.0%) |
| 12 to 14 Years | 0 (0.0%) | 0 (0.0%) |
| 15 Years | 0 (0.0%) | 0 (0.0%) |
| 16 and 17 Years | 0 (0.0%) | 0 (0.0%) |
| 18 to 24 Years | 0 (0.0%) | 0 (0.0%) |
| 25 to 34 Years | 0 (0.0%) | 0 (0.0%) |
| 35 to 44 Years | 0 (0.0%) | 3 (100.0%) |
| 45 to 54 Years | 0 (0.0%) | 0 (0.0%) |
| 55 to 64 Years | 0 (0.0%) | 0 (0.0%) |
| 65 to 74 Years | 0 (0.0%) | 0 (0.0%) |
| 75 Years and over | 0 (0.0%) | 0 (0.0%) |
| Total | 0 (0.0%) | 3 (8.8%) |
Income Above Poverty by Sex and Age in Leggett
According to the poverty statistics in Leggett, males aged 6 to 11 years and females aged under 5 years are the age groups that are most secure financially, with 100.0% of males and 100.0% of females in these age groups living above the poverty line.
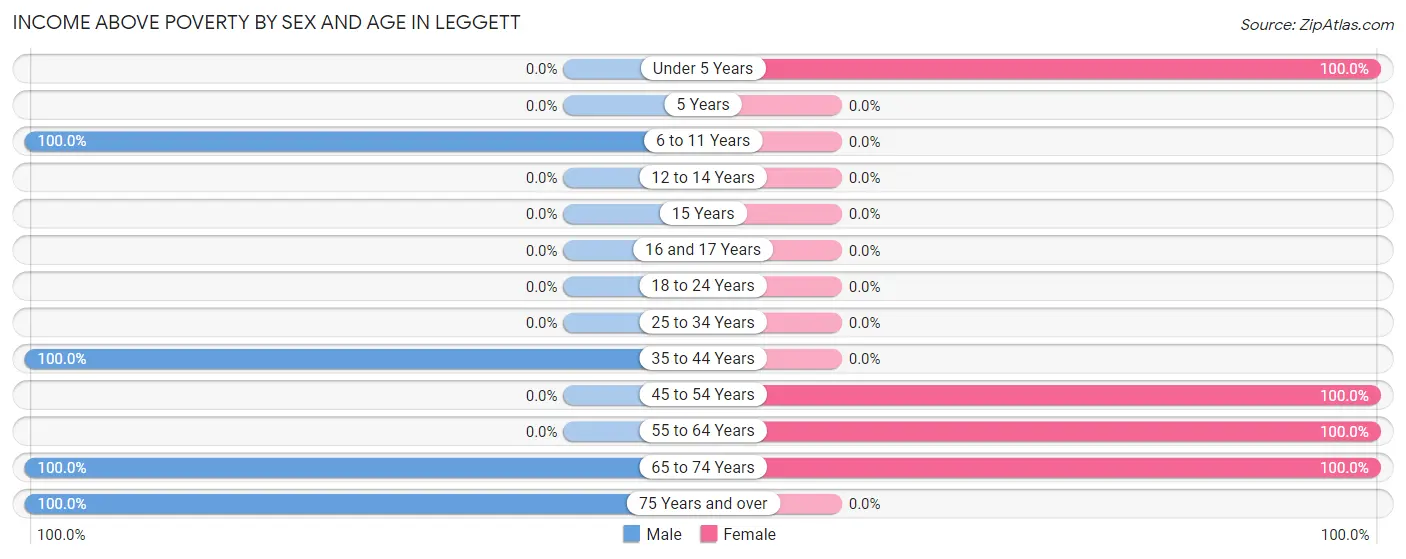
| Age Bracket | Male | Female |
| Under 5 Years | 0 (0.0%) | 11 (100.0%) |
| 5 Years | 0 (0.0%) | 0 (0.0%) |
| 6 to 11 Years | 3 (100.0%) | 0 (0.0%) |
| 12 to 14 Years | 0 (0.0%) | 0 (0.0%) |
| 15 Years | 0 (0.0%) | 0 (0.0%) |
| 16 and 17 Years | 0 (0.0%) | 0 (0.0%) |
| 18 to 24 Years | 0 (0.0%) | 0 (0.0%) |
| 25 to 34 Years | 0 (0.0%) | 0 (0.0%) |
| 35 to 44 Years | 6 (100.0%) | 0 (0.0%) |
| 45 to 54 Years | 0 (0.0%) | 4 (100.0%) |
| 55 to 64 Years | 0 (0.0%) | 1 (100.0%) |
| 65 to 74 Years | 11 (100.0%) | 15 (100.0%) |
| 75 Years and over | 1 (100.0%) | 0 (0.0%) |
| Total | 21 (100.0%) | 31 (91.2%) |
Income Below Poverty Among Married-Couple Families in Leggett
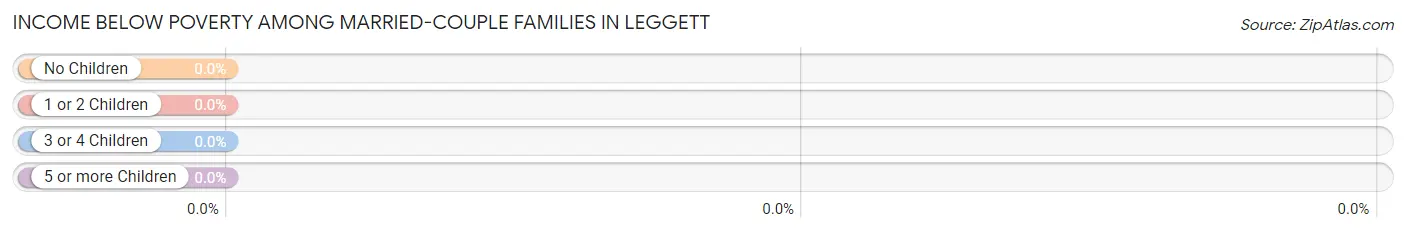
| Children | Above Poverty | Below Poverty |
| No Children | 5 (100.0%) | 0 (0.0%) |
| 1 or 2 Children | 0 (0.0%) | 0 (0.0%) |
| 3 or 4 Children | 0 (0.0%) | 0 (0.0%) |
| 5 or more Children | 0 (0.0%) | 0 (0.0%) |
| Total | 5 (100.0%) | 0 (0.0%) |
Income Below Poverty Among Single-Parent Households in Leggett
| Children | Single Father | Single Mother |
| No Children | 0 (0.0%) | 0 (0.0%) |
| 1 or 2 Children | 0 (0.0%) | 0 (0.0%) |
| 3 or 4 Children | 0 (0.0%) | 0 (0.0%) |
| 5 or more Children | 0 (0.0%) | 0 (0.0%) |
| Total | 0 (0.0%) | 0 (0.0%) |
Income Below Poverty Among Married-Couple vs Single-Parent Households in Leggett
| Children | Married-Couple Families | Single-Parent Households |
| No Children | 0 (0.0%) | 0 (0.0%) |
| 1 or 2 Children | 0 (0.0%) | 0 (0.0%) |
| 3 or 4 Children | 0 (0.0%) | 0 (0.0%) |
| 5 or more Children | 0 (0.0%) | 0 (0.0%) |
| Total | 0 (0.0%) | 0 (0.0%) |
Race in Leggett
The most populous races in Leggett are Black / African American (47 | 85.5%), and White / Caucasian (8 | 14.5%).
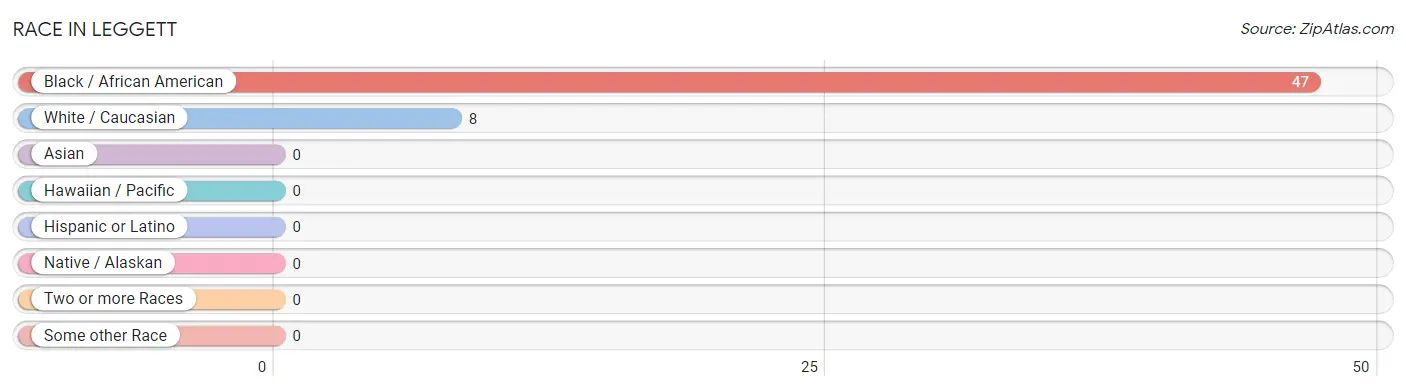
| Race | # Population | % Population |
| Asian | 0 | 0.0% |
| Black / African American | 47 | 85.5% |
| Hawaiian / Pacific | 0 | 0.0% |
| Hispanic or Latino | 0 | 0.0% |
| Native / Alaskan | 0 | 0.0% |
| White / Caucasian | 8 | 14.5% |
| Two or more Races | 0 | 0.0% |
| Some other Race | 0 | 0.0% |
| Total | 55 | 100.0% |
Ancestry in Leggett
The most populous ancestries reported in Leggett are American (7 | 12.7%), and English (1 | 1.8%), together accounting for 14.5% of all Leggett residents.
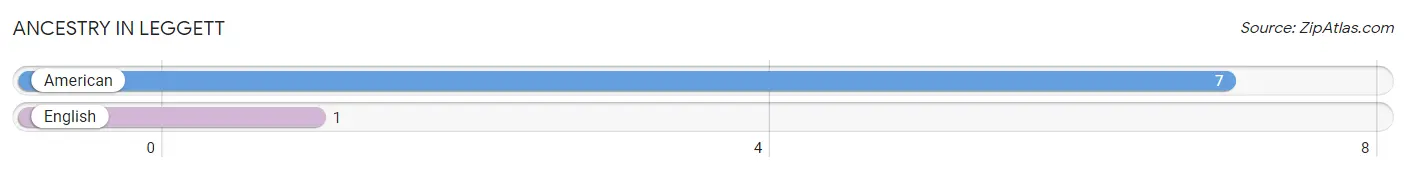
| Ancestry | # Population | % Population |
| American | 7 | 12.7% |
| English | 1 | 1.8% | View All 2 Rows |
Immigrants in Leggett

| Immigration Origin | # Population | % Population | View All 0 Rows |
Sex and Age in Leggett
Sex and Age in Leggett
The most populous age groups in Leggett are 35 to 39 Years (6 | 28.6%) for men and 70 to 74 Years (12 | 35.3%) for women.
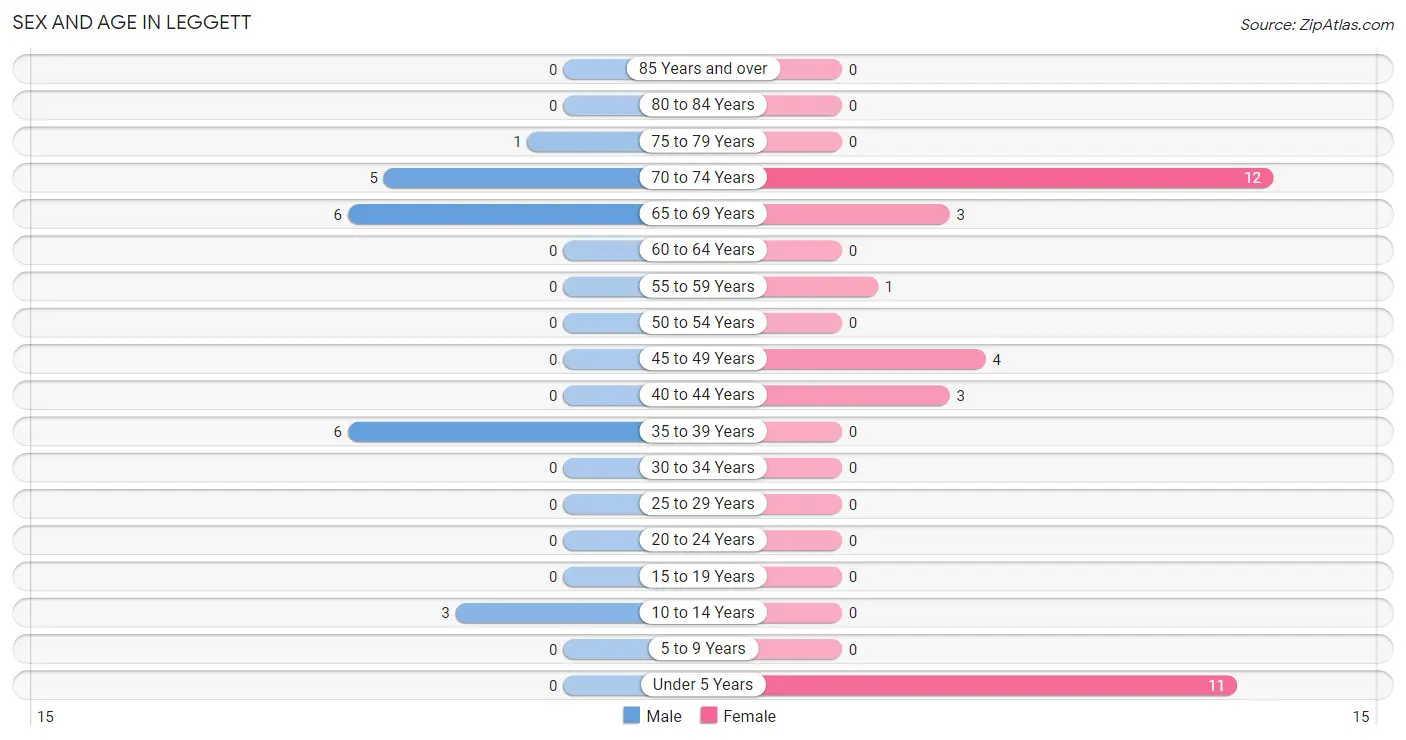
| Age Bracket | Male | Female |
| Under 5 Years | 0 (0.0%) | 11 (32.4%) |
| 5 to 9 Years | 0 (0.0%) | 0 (0.0%) |
| 10 to 14 Years | 3 (14.3%) | 0 (0.0%) |
| 15 to 19 Years | 0 (0.0%) | 0 (0.0%) |
| 20 to 24 Years | 0 (0.0%) | 0 (0.0%) |
| 25 to 29 Years | 0 (0.0%) | 0 (0.0%) |
| 30 to 34 Years | 0 (0.0%) | 0 (0.0%) |
| 35 to 39 Years | 6 (28.6%) | 0 (0.0%) |
| 40 to 44 Years | 0 (0.0%) | 3 (8.8%) |
| 45 to 49 Years | 0 (0.0%) | 4 (11.8%) |
| 50 to 54 Years | 0 (0.0%) | 0 (0.0%) |
| 55 to 59 Years | 0 (0.0%) | 1 (2.9%) |
| 60 to 64 Years | 0 (0.0%) | 0 (0.0%) |
| 65 to 69 Years | 6 (28.6%) | 3 (8.8%) |
| 70 to 74 Years | 5 (23.8%) | 12 (35.3%) |
| 75 to 79 Years | 1 (4.8%) | 0 (0.0%) |
| 80 to 84 Years | 0 (0.0%) | 0 (0.0%) |
| 85 Years and over | 0 (0.0%) | 0 (0.0%) |
| Total | 21 (100.0%) | 34 (100.0%) |
Families and Households in Leggett
Median Family Size in Leggett
The median family size in Leggett is 3.42 persons per family, with single female/mother families (4 | 33.3%) accounting for the largest median family size of 5 persons per family. On the other hand, married-couple families (5 | 41.7%) represent the smallest median family size with 2.40 persons per family.
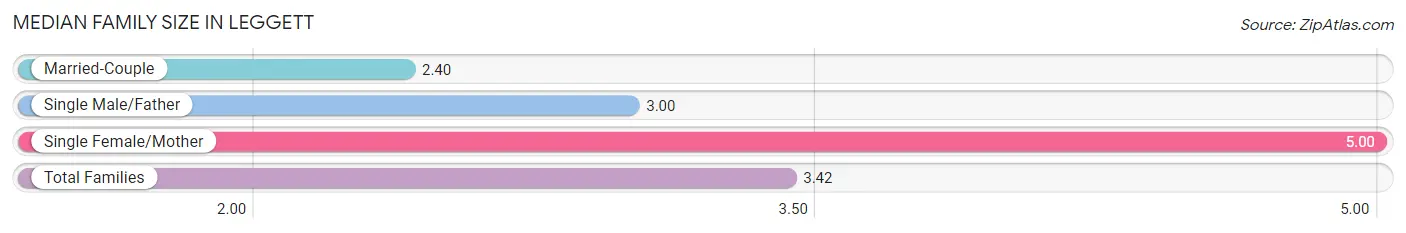
| Family Type | # Families | Family Size |
| Married-Couple | 5 (41.7%) | 2.40 |
| Single Male/Father | 3 (25.0%) | 3.00 |
| Single Female/Mother | 4 (33.3%) | 5.00 |
| Total Families | 12 (100.0%) | 3.42 |
Median Household Size in Leggett
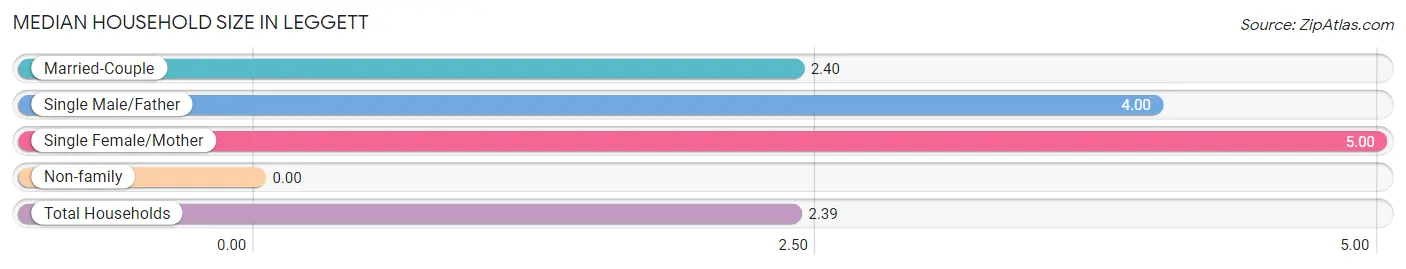
| Household Type | # Households | Household Size |
| Married-Couple | 5 (21.7%) | 2.40 |
| Single Male/Father | 3 (13.0%) | 4.00 |
| Single Female/Mother | 4 (17.4%) | 5.00 |
| Non-family | 11 (47.8%) | - |
| Total Households | 23 (100.0%) | 2.39 |
Household Size by Marriage Status in Leggett
Out of a total of 23 households in Leggett, 12 (52.2%) are family households, while 11 (47.8%) are nonfamily households. The most numerous type of family households are 4-person households, comprising 7, and the most common type of nonfamily households are 1-person households, comprising 11.
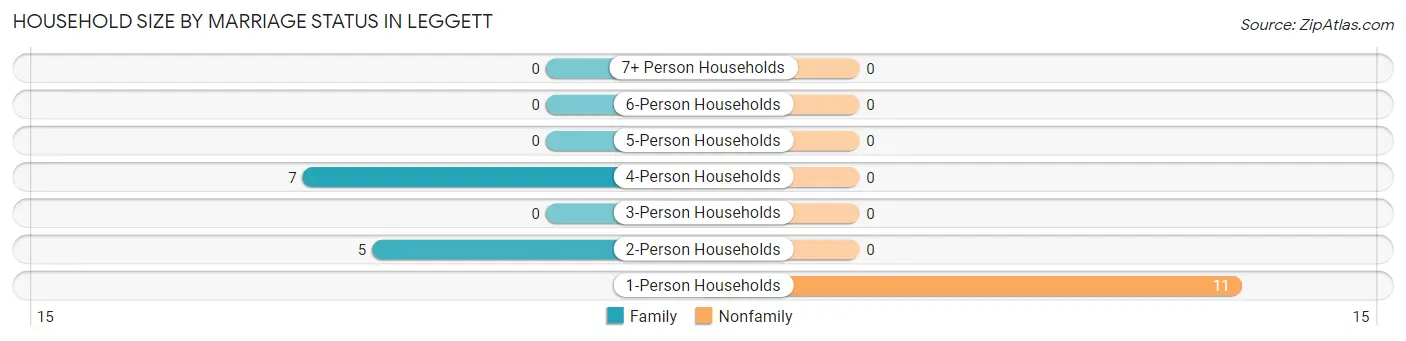
| Household Size | Family Households | Nonfamily Households |
| 1-Person Households | - | 11 (47.8%) |
| 2-Person Households | 5 (21.7%) | 0 (0.0%) |
| 3-Person Households | 0 (0.0%) | 0 (0.0%) |
| 4-Person Households | 7 (30.4%) | 0 (0.0%) |
| 5-Person Households | 0 (0.0%) | 0 (0.0%) |
| 6-Person Households | 0 (0.0%) | 0 (0.0%) |
| 7+ Person Households | 0 (0.0%) | 0 (0.0%) |
| Total | 12 (52.2%) | 11 (47.8%) |
Female Fertility in Leggett
Fertility by Age in Leggett
| Age Bracket | Women with Births | Births / 1,000 Women |
| 15 to 19 years | 0 (0.0%) | 0.0 |
| 20 to 34 years | 0 (0.0%) | 0.0 |
| 35 to 50 years | 0 (0.0%) | 0.0 |
| Total | 0 (0.0%) | 0.0 |
Fertility by Age by Marriage Status in Leggett
| Age Bracket | Married | Unmarried |
| 15 to 19 years | 0 (0.0%) | 0 (0.0%) |
| 20 to 34 years | 0 (0.0%) | 0 (0.0%) |
| 35 to 50 years | 0 (0.0%) | 0 (0.0%) |
| Total | 0 (0.0%) | 0 (0.0%) |
Fertility by Education in Leggett
| Educational Attainment | Women with Births | Births / 1,000 Women |
| Less than High School | 0 (0.0%) | 0.0 |
| High School Diploma | 0 (0.0%) | 0.0 |
| College or Associate's Degree | 0 (0.0%) | 0.0 |
| Bachelor's Degree | 0 (0.0%) | 0.0 |
| Graduate Degree | 0 (0.0%) | 0.0 |
| Total | 0 (0.0%) | 0.0 |
Fertility by Education by Marriage Status in Leggett
| Educational Attainment | Married | Unmarried |
| Less than High School | 0 (0.0%) | 0 (0.0%) |
| High School Diploma | 0 (0.0%) | 0 (0.0%) |
| College or Associate's Degree | 0 (0.0%) | 0 (0.0%) |
| Bachelor's Degree | 0 (0.0%) | 0 (0.0%) |
| Graduate Degree | 0 (0.0%) | 0 (0.0%) |
| Total | 0 (0.0%) | 0 (0.0%) |
Employment Characteristics in Leggett
Employment by Class of Employer in Leggett
Among the 17 employed individuals in Leggett, private company employees (9 | 52.9%), local government employees (6 | 35.3%), and self-employed (incorporated) (2 | 11.8%) make up the most common classes of employment.
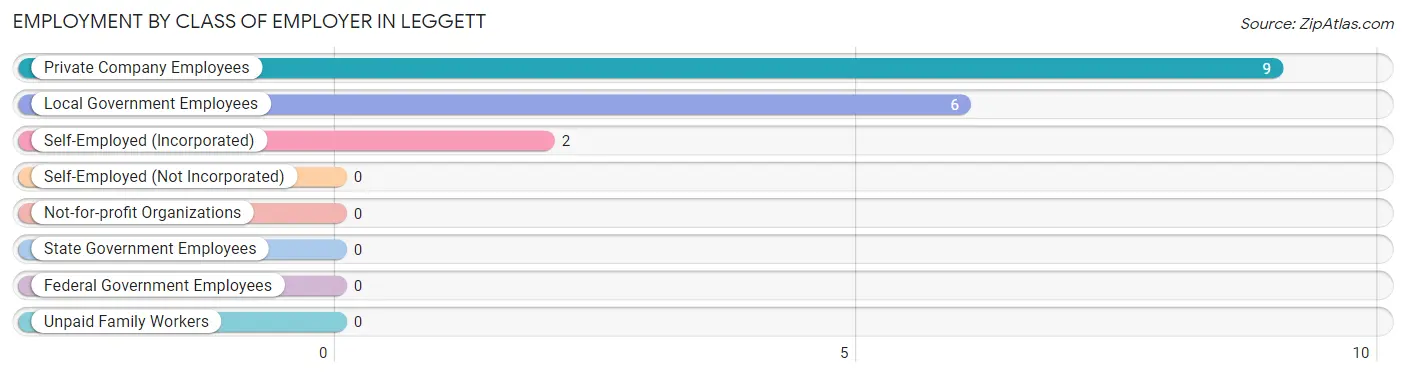
| Employer Class | # Employees | % Employees |
| Private Company Employees | 9 | 52.9% |
| Self-Employed (Incorporated) | 2 | 11.8% |
| Self-Employed (Not Incorporated) | 0 | 0.0% |
| Not-for-profit Organizations | 0 | 0.0% |
| Local Government Employees | 6 | 35.3% |
| State Government Employees | 0 | 0.0% |
| Federal Government Employees | 0 | 0.0% |
| Unpaid Family Workers | 0 | 0.0% |
| Total | 17 | 100.0% |
Employment Status by Age in Leggett
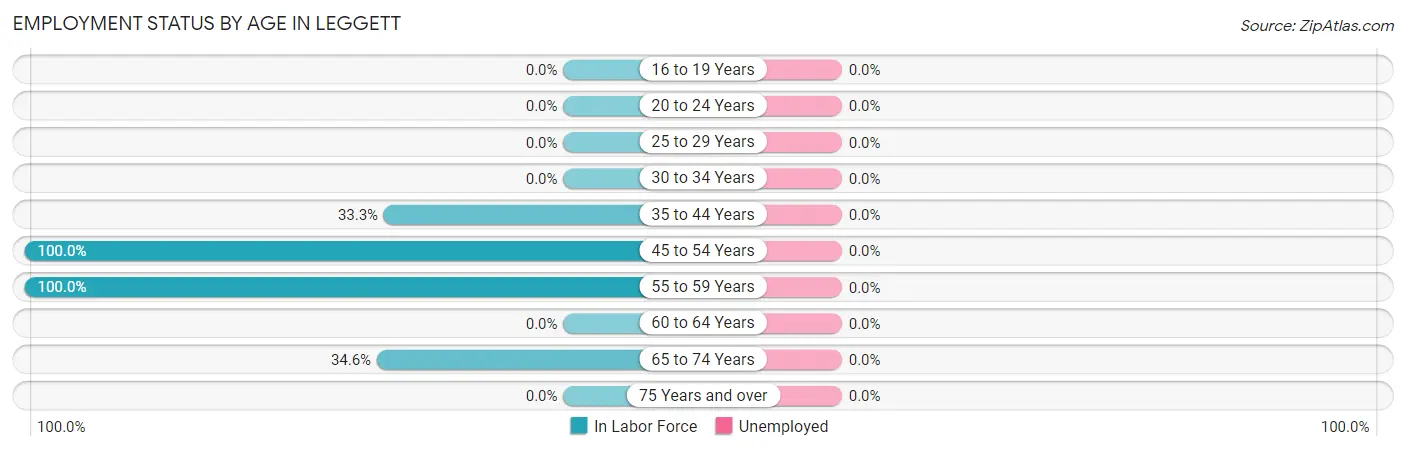
| Age Bracket | In Labor Force | Unemployed |
| 16 to 19 Years | 0 (0.0%) | 0 (0.0%) |
| 20 to 24 Years | 0 (0.0%) | 0 (0.0%) |
| 25 to 29 Years | 0 (0.0%) | 0 (0.0%) |
| 30 to 34 Years | 0 (0.0%) | 0 (0.0%) |
| 35 to 44 Years | 3 (33.3%) | 0 (0.0%) |
| 45 to 54 Years | 4 (100.0%) | 0 (0.0%) |
| 55 to 59 Years | 1 (100.0%) | 0 (0.0%) |
| 60 to 64 Years | 0 (0.0%) | 0 (0.0%) |
| 65 to 74 Years | 9 (34.6%) | 0 (0.0%) |
| 75 Years and over | 0 (0.0%) | 0 (0.0%) |
| Total | 17 (41.5%) | 0 (0.0%) |
Employment Status by Educational Attainment in Leggett
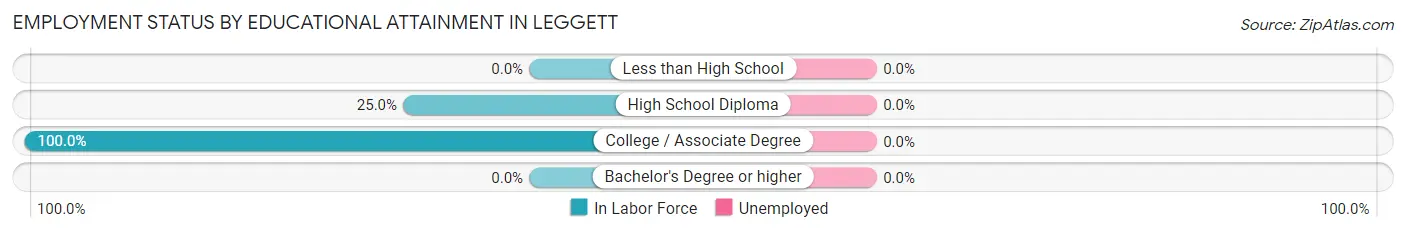
| Educational Attainment | In Labor Force | Unemployed |
| Less than High School | 0 (0.0%) | 0 (0.0%) |
| High School Diploma | 1 (25.0%) | 0 (0.0%) |
| College / Associate Degree | 7 (100.0%) | 0 (0.0%) |
| Bachelor's Degree or higher | 0 (0.0%) | 0 (0.0%) |
| Total | 8 (57.1%) | 0 (0.0%) |
Employment Occupations by Sex in Leggett
Management, Business, Science and Arts Occupations
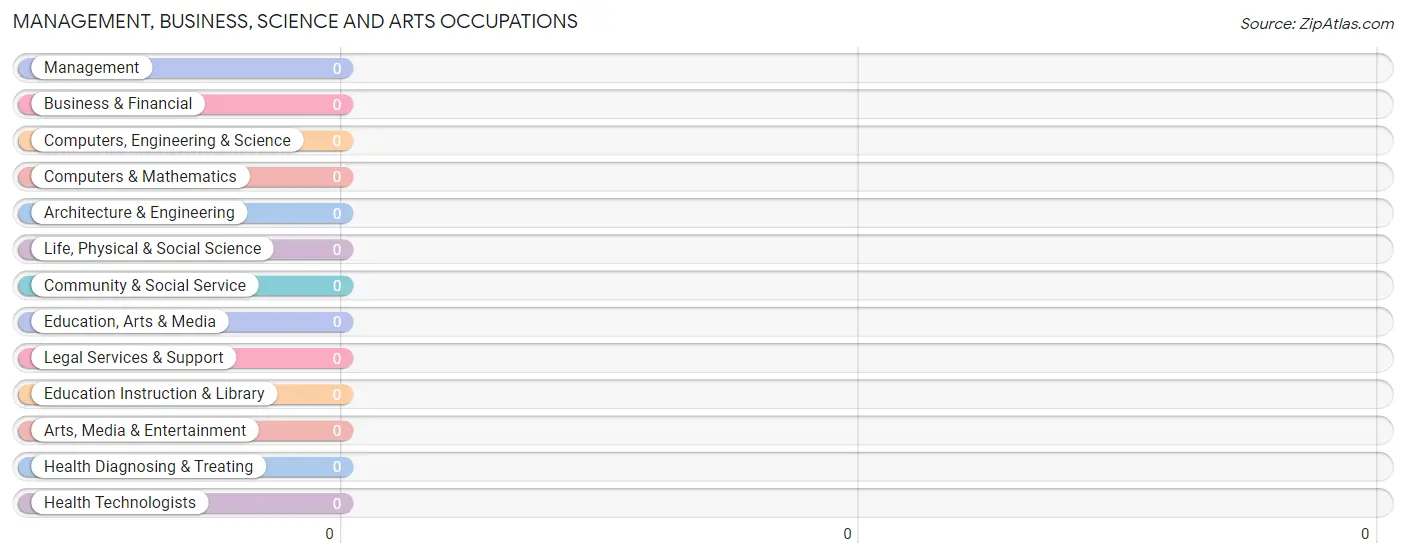
Management, Business, Science and Arts Occupations by Sex
| Occupation | Male | Female |
| Management | 0 (0.0%) | 0 (0.0%) |
| Business & Financial | 0 (0.0%) | 0 (0.0%) |
| Computers, Engineering & Science | 0 (0.0%) | 0 (0.0%) |
| Computers & Mathematics | 0 (0.0%) | 0 (0.0%) |
| Architecture & Engineering | 0 (0.0%) | 0 (0.0%) |
| Life, Physical & Social Science | 0 (0.0%) | 0 (0.0%) |
| Community & Social Service | 0 (0.0%) | 0 (0.0%) |
| Education, Arts & Media | 0 (0.0%) | 0 (0.0%) |
| Legal Services & Support | 0 (0.0%) | 0 (0.0%) |
| Education Instruction & Library | 0 (0.0%) | 0 (0.0%) |
| Arts, Media & Entertainment | 0 (0.0%) | 0 (0.0%) |
| Health Diagnosing & Treating | 0 (0.0%) | 0 (0.0%) |
| Health Technologists | 0 (0.0%) | 0 (0.0%) |
| Total (Category) | 0 (0.0%) | 0 (0.0%) |
| Total (Overall) | 9 (52.9%) | 8 (47.1%) |
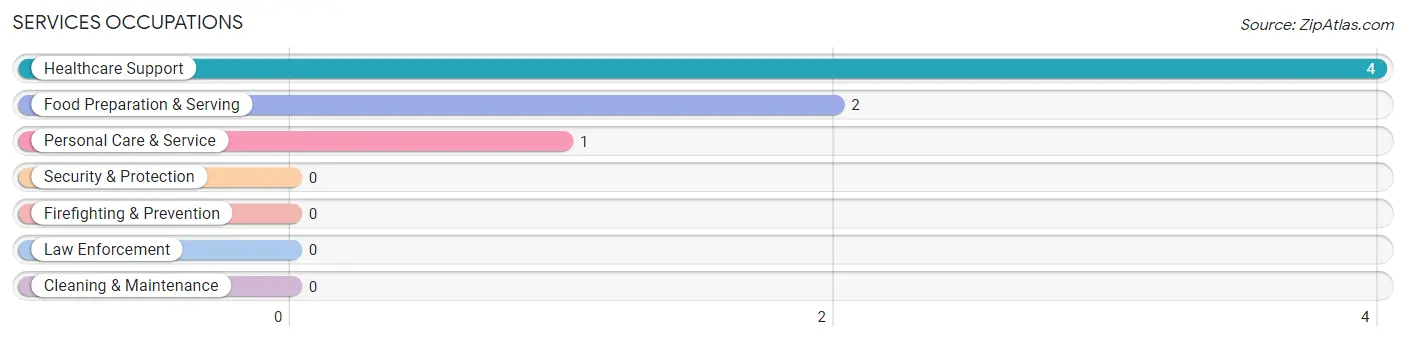
Services Occupations
The most common Services occupations in Leggett are Healthcare Support (4 | 23.5%), Food Preparation & Serving (2 | 11.8%), and Personal Care & Service (1 | 5.9%).
Services Occupations by Sex
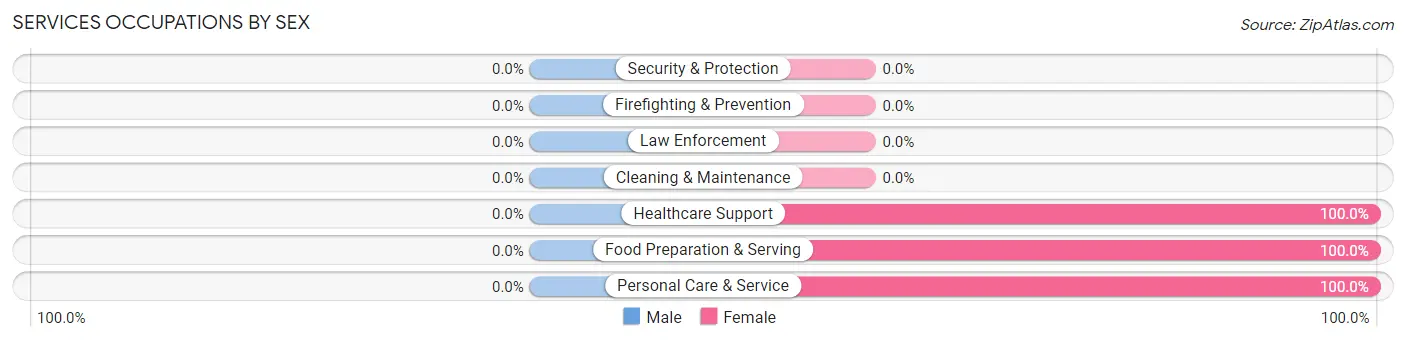
| Occupation | Male | Female |
| Healthcare Support | 0 (0.0%) | 4 (100.0%) |
| Security & Protection | 0 (0.0%) | 0 (0.0%) |
| Firefighting & Prevention | 0 (0.0%) | 0 (0.0%) |
| Law Enforcement | 0 (0.0%) | 0 (0.0%) |
| Food Preparation & Serving | 0 (0.0%) | 2 (100.0%) |
| Cleaning & Maintenance | 0 (0.0%) | 0 (0.0%) |
| Personal Care & Service | 0 (0.0%) | 1 (100.0%) |
| Total (Category) | 0 (0.0%) | 7 (100.0%) |
| Total (Overall) | 9 (52.9%) | 8 (47.1%) |
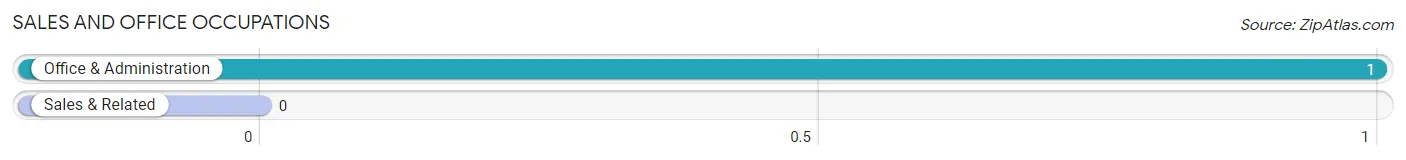
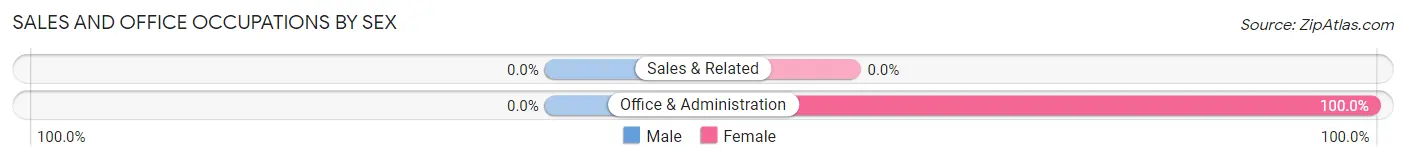
Sales and Office Occupations
The most common Sales and Office occupations in Leggett are , and Office & Administration (1 | 5.9%).
Sales and Office Occupations by Sex
| Occupation | Male | Female |
| Sales & Related | 0 (0.0%) | 0 (0.0%) |
| Office & Administration | 0 (0.0%) | 1 (100.0%) |
| Total (Category) | 0 (0.0%) | 1 (100.0%) |
| Total (Overall) | 9 (52.9%) | 8 (47.1%) |
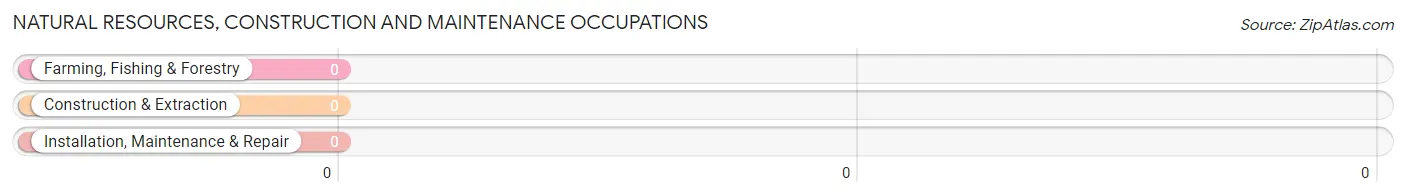
Natural Resources, Construction and Maintenance Occupations
Natural Resources, Construction and Maintenance Occupations by Sex
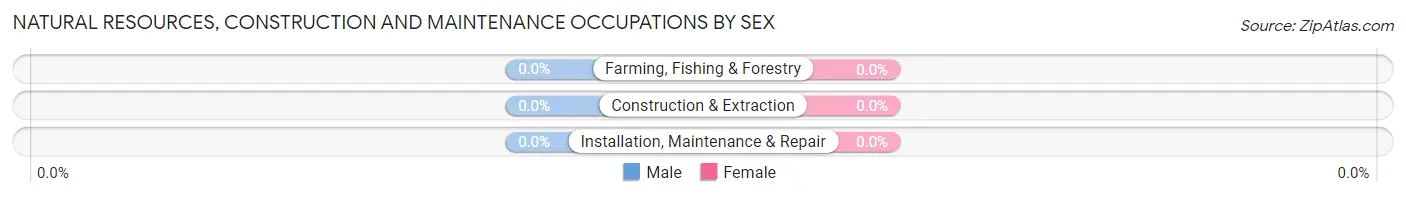
| Occupation | Male | Female |
| Farming, Fishing & Forestry | 0 (0.0%) | 0 (0.0%) |
| Construction & Extraction | 0 (0.0%) | 0 (0.0%) |
| Installation, Maintenance & Repair | 0 (0.0%) | 0 (0.0%) |
| Total (Category) | 0 (0.0%) | 0 (0.0%) |
| Total (Overall) | 9 (52.9%) | 8 (47.1%) |
Production, Transportation and Moving Occupations
The most common Production, Transportation and Moving occupations in Leggett are , and Production (9 | 52.9%).
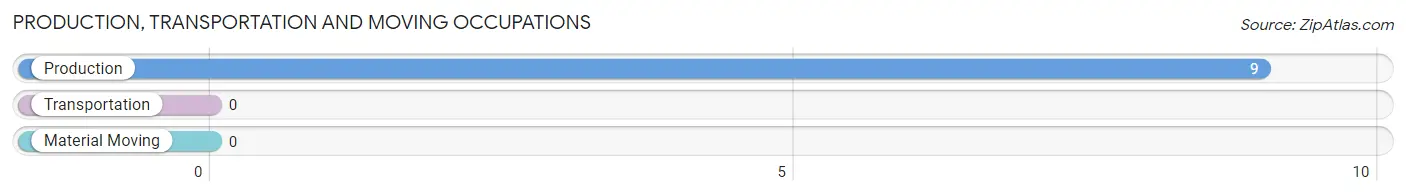
Production, Transportation and Moving Occupations by Sex
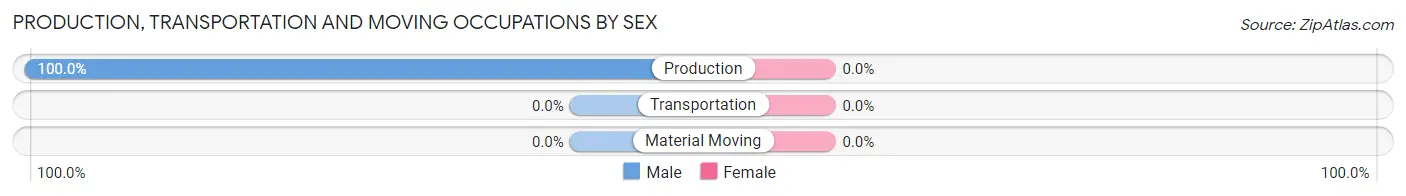
| Occupation | Male | Female |
| Production | 9 (100.0%) | 0 (0.0%) |
| Transportation | 0 (0.0%) | 0 (0.0%) |
| Material Moving | 0 (0.0%) | 0 (0.0%) |
| Total (Category) | 9 (100.0%) | 0 (0.0%) |
| Total (Overall) | 9 (52.9%) | 8 (47.1%) |
Employment Industries by Sex in Leggett
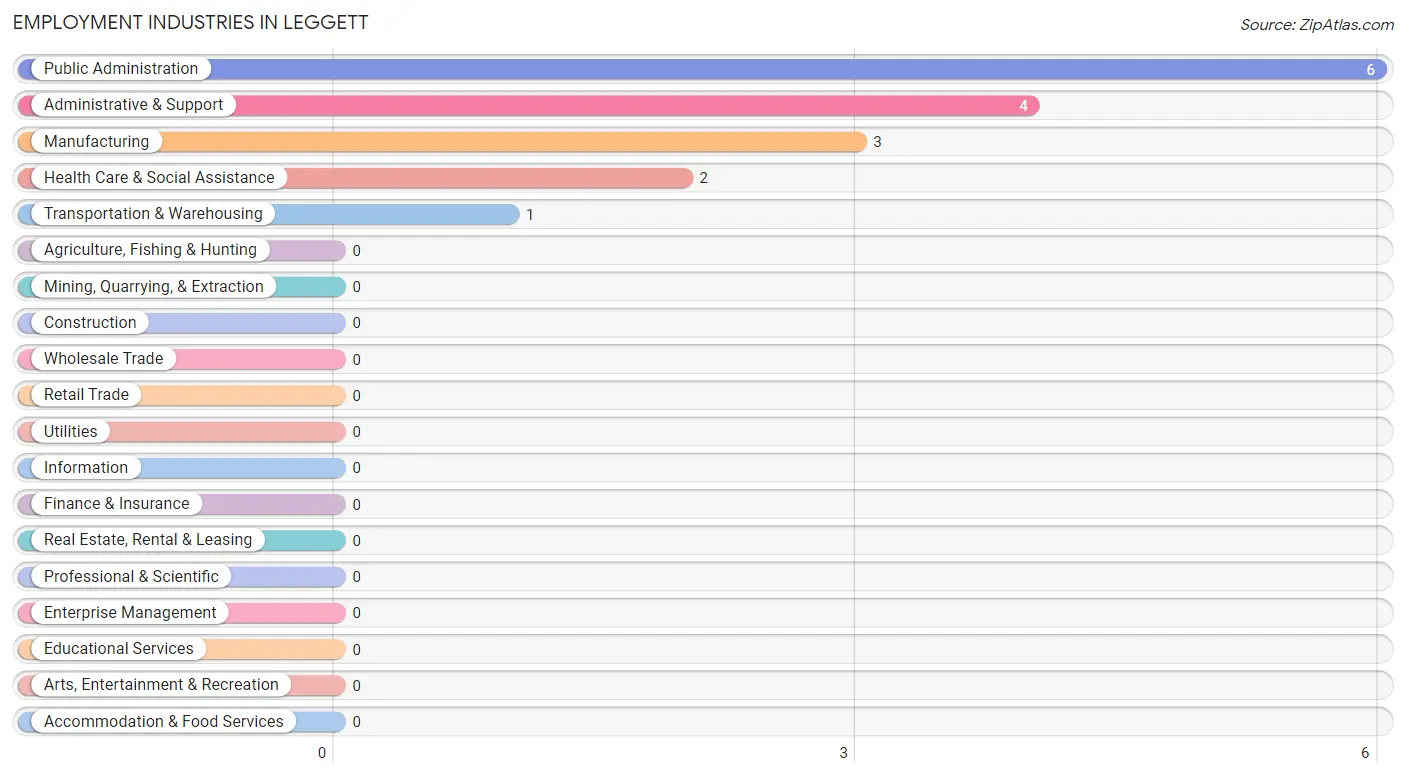
Employment Industries in Leggett
The major employment industries in Leggett include Public Administration (6 | 35.3%), Administrative & Support (4 | 23.5%), Manufacturing (3 | 17.6%), Health Care & Social Assistance (2 | 11.8%), and Transportation & Warehousing (1 | 5.9%).
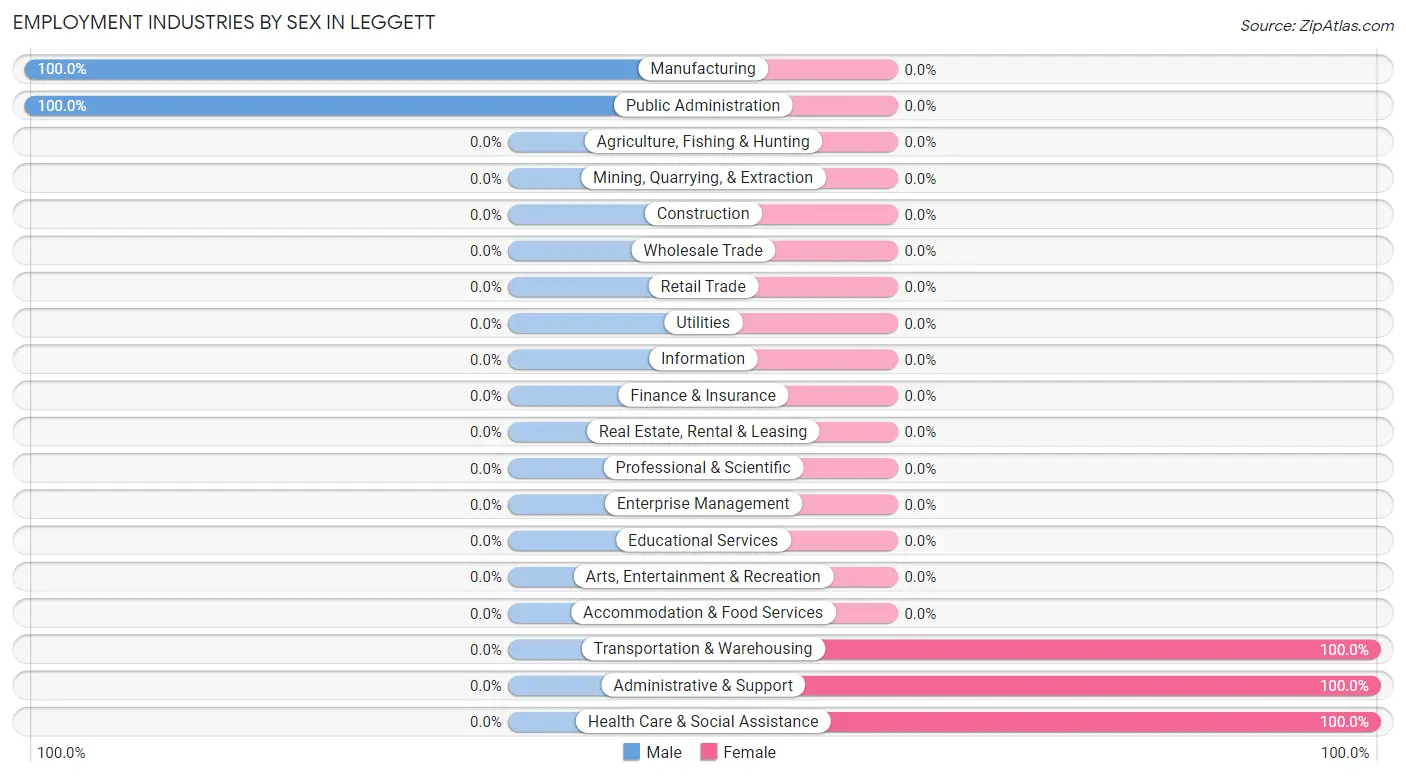
Employment Industries by Sex in Leggett
The Leggett industries that see more men than women are Manufacturing (100.0%), and Public Administration (100.0%), whereas the industries that tend to have a higher number of women are Transportation & Warehousing (100.0%), Administrative & Support (100.0%), and Health Care & Social Assistance (100.0%).
| Industry | Male | Female |
| Agriculture, Fishing & Hunting | 0 (0.0%) | 0 (0.0%) |
| Mining, Quarrying, & Extraction | 0 (0.0%) | 0 (0.0%) |
| Construction | 0 (0.0%) | 0 (0.0%) |
| Manufacturing | 3 (100.0%) | 0 (0.0%) |
| Wholesale Trade | 0 (0.0%) | 0 (0.0%) |
| Retail Trade | 0 (0.0%) | 0 (0.0%) |
| Transportation & Warehousing | 0 (0.0%) | 1 (100.0%) |
| Utilities | 0 (0.0%) | 0 (0.0%) |
| Information | 0 (0.0%) | 0 (0.0%) |
| Finance & Insurance | 0 (0.0%) | 0 (0.0%) |
| Real Estate, Rental & Leasing | 0 (0.0%) | 0 (0.0%) |
| Professional & Scientific | 0 (0.0%) | 0 (0.0%) |
| Enterprise Management | 0 (0.0%) | 0 (0.0%) |
| Administrative & Support | 0 (0.0%) | 4 (100.0%) |
| Educational Services | 0 (0.0%) | 0 (0.0%) |
| Health Care & Social Assistance | 0 (0.0%) | 2 (100.0%) |
| Arts, Entertainment & Recreation | 0 (0.0%) | 0 (0.0%) |
| Accommodation & Food Services | 0 (0.0%) | 0 (0.0%) |
| Public Administration | 6 (100.0%) | 0 (0.0%) |
| Total | 9 (52.9%) | 8 (47.1%) |
Education in Leggett
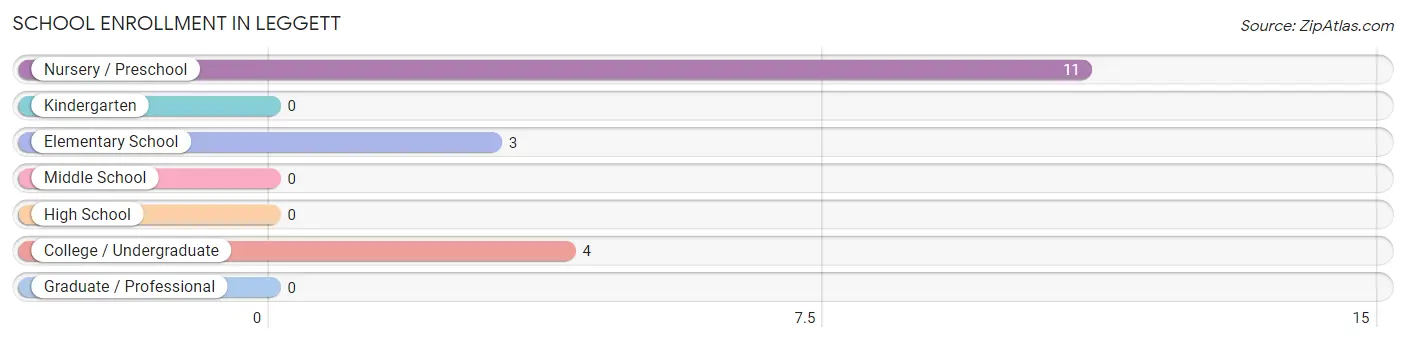
School Enrollment in Leggett
The most common levels of schooling among the 18 students in Leggett are nursery / preschool (11 | 61.1%), college / undergraduate (4 | 22.2%), and elementary school (3 | 16.7%).
| School Level | # Students | % Students |
| Nursery / Preschool | 11 | 61.1% |
| Kindergarten | 0 | 0.0% |
| Elementary School | 3 | 16.7% |
| Middle School | 0 | 0.0% |
| High School | 0 | 0.0% |
| College / Undergraduate | 4 | 22.2% |
| Graduate / Professional | 0 | 0.0% |
| Total | 18 | 100.0% |
School Enrollment by Age by Funding Source in Leggett
Out of a total of 18 students who are enrolled in schools in Leggett, 4 (22.2%) attend a private institution, while the remaining 14 (77.8%) are enrolled in public schools. The age group of 35 years and over has the highest likelihood of being enrolled in private schools, with 4 (100.0% in the age bracket) enrolled. Conversely, the age group of 3 to 4 year olds has the lowest likelihood of being enrolled in a private school, with 11 (100.0% in the age bracket) attending a public institution.
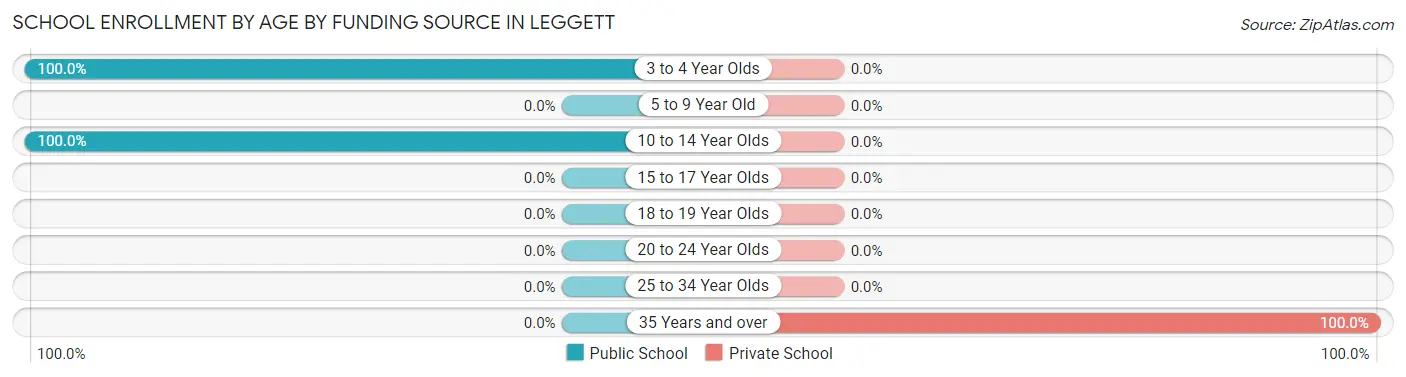
| Age Bracket | Public School | Private School |
| 3 to 4 Year Olds | 11 (100.0%) | 0 (0.0%) |
| 5 to 9 Year Old | 0 (0.0%) | 0 (0.0%) |
| 10 to 14 Year Olds | 3 (100.0%) | 0 (0.0%) |
| 15 to 17 Year Olds | 0 (0.0%) | 0 (0.0%) |
| 18 to 19 Year Olds | 0 (0.0%) | 0 (0.0%) |
| 20 to 24 Year Olds | 0 (0.0%) | 0 (0.0%) |
| 25 to 34 Year Olds | 0 (0.0%) | 0 (0.0%) |
| 35 Years and over | 0 (0.0%) | 4 (100.0%) |
| Total | 14 (77.8%) | 4 (22.2%) |
Educational Attainment by Field of Study in Leggett
| Field of Study | # Graduates | % Graduates |
| Computers & Mathematics | 0 | 0.0% |
| Bio, Nature & Agricultural | 0 | 0.0% |
| Physical & Health Sciences | 0 | 0.0% |
| Psychology | 0 | 0.0% |
| Social Sciences | 0 | 0.0% |
| Engineering | 0 | 0.0% |
| Multidisciplinary Studies | 0 | 0.0% |
| Science & Technology | 0 | 0.0% |
| Business | 0 | 0.0% |
| Education | 0 | 0.0% |
| Literature & Languages | 0 | 0.0% |
| Liberal Arts & History | 0 | 0.0% |
| Visual & Performing Arts | 0 | 0.0% |
| Communications | 0 | 0.0% |
| Arts & Humanities | 0 | 0.0% |
| Total | 0 | 0.0% |
Transportation & Commute in Leggett
Vehicle Availability by Sex in Leggett
The most prevalent vehicle ownership categories in Leggett are males with 3 vehicles (6, accounting for 66.7%) and females with 3 vehicles (3, making up 75.0%).
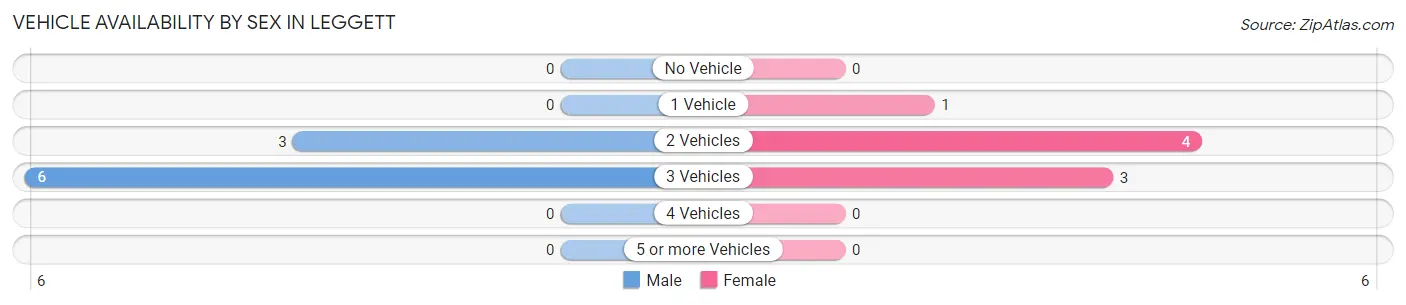
| Vehicles Available | Male | Female |
| No Vehicle | 0 (0.0%) | 0 (0.0%) |
| 1 Vehicle | 0 (0.0%) | 1 (12.5%) |
| 2 Vehicles | 3 (33.3%) | 4 (50.0%) |
| 3 Vehicles | 6 (66.7%) | 3 (37.5%) |
| 4 Vehicles | 0 (0.0%) | 0 (0.0%) |
| 5 or more Vehicles | 0 (0.0%) | 0 (0.0%) |
| Total | 9 (100.0%) | 8 (100.0%) |
Commute Time in Leggett
The most frequently occuring commute durations in Leggett are 15 to 19 minutes (6 commuters, 37.5%), 10 to 14 minutes (4 commuters, 25.0%), and 30 to 34 minutes (4 commuters, 25.0%).
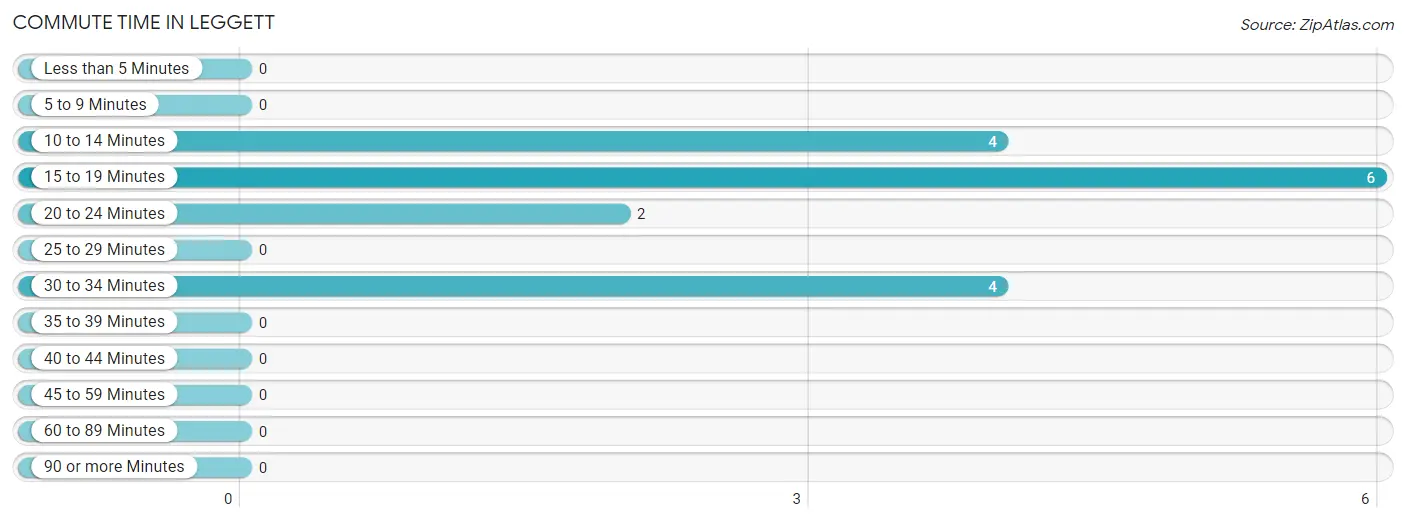
| Commute Time | # Commuters | % Commuters |
| Less than 5 Minutes | 0 | 0.0% |
| 5 to 9 Minutes | 0 | 0.0% |
| 10 to 14 Minutes | 4 | 25.0% |
| 15 to 19 Minutes | 6 | 37.5% |
| 20 to 24 Minutes | 2 | 12.5% |
| 25 to 29 Minutes | 0 | 0.0% |
| 30 to 34 Minutes | 4 | 25.0% |
| 35 to 39 Minutes | 0 | 0.0% |
| 40 to 44 Minutes | 0 | 0.0% |
| 45 to 59 Minutes | 0 | 0.0% |
| 60 to 89 Minutes | 0 | 0.0% |
| 90 or more Minutes | 0 | 0.0% |
Commute Time by Sex in Leggett
The most common commute times in Leggett are 15 to 19 minutes (6 commuters, 66.7%) for males and 10 to 14 minutes (4 commuters, 57.1%) for females.
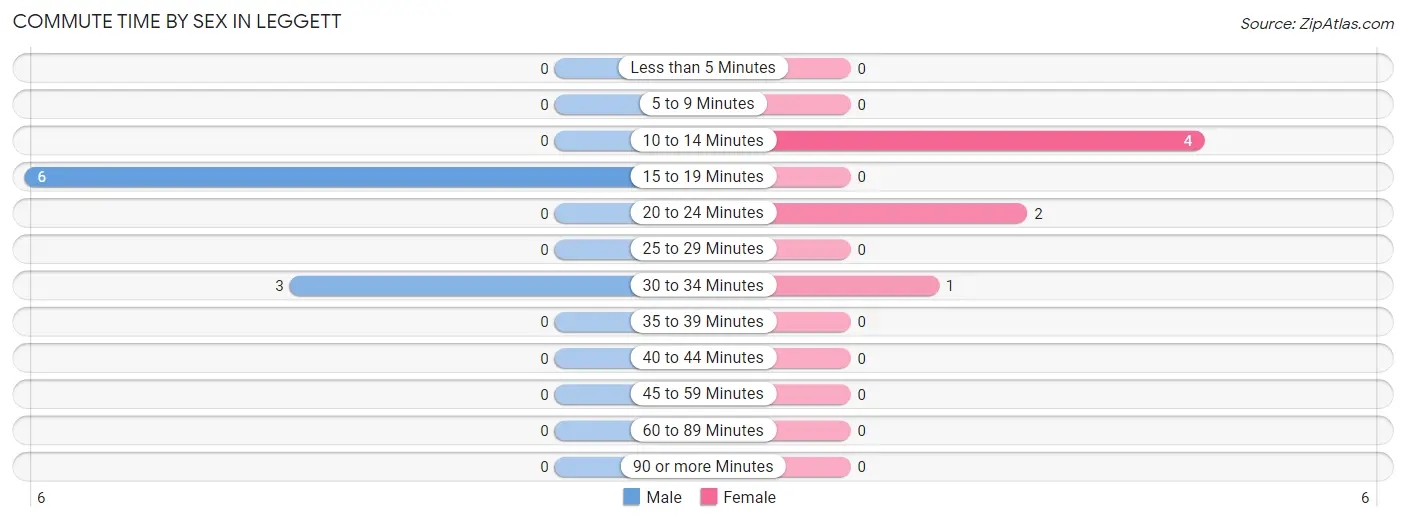
| Commute Time | Male | Female |
| Less than 5 Minutes | 0 (0.0%) | 0 (0.0%) |
| 5 to 9 Minutes | 0 (0.0%) | 0 (0.0%) |
| 10 to 14 Minutes | 0 (0.0%) | 4 (57.1%) |
| 15 to 19 Minutes | 6 (66.7%) | 0 (0.0%) |
| 20 to 24 Minutes | 0 (0.0%) | 2 (28.6%) |
| 25 to 29 Minutes | 0 (0.0%) | 0 (0.0%) |
| 30 to 34 Minutes | 3 (33.3%) | 1 (14.3%) |
| 35 to 39 Minutes | 0 (0.0%) | 0 (0.0%) |
| 40 to 44 Minutes | 0 (0.0%) | 0 (0.0%) |
| 45 to 59 Minutes | 0 (0.0%) | 0 (0.0%) |
| 60 to 89 Minutes | 0 (0.0%) | 0 (0.0%) |
| 90 or more Minutes | 0 (0.0%) | 0 (0.0%) |
Time of Departure to Work by Sex in Leggett
The most frequent times of departure to work in Leggett are 7:00 AM to 7:29 AM (6, 66.7%) for males and 4:00 PM to 11:59 PM (4, 57.1%) for females.

| Time of Departure | Male | Female |
| 12:00 AM to 4:59 AM | 0 (0.0%) | 0 (0.0%) |
| 5:00 AM to 5:29 AM | 0 (0.0%) | 0 (0.0%) |
| 5:30 AM to 5:59 AM | 0 (0.0%) | 0 (0.0%) |
| 6:00 AM to 6:29 AM | 0 (0.0%) | 0 (0.0%) |
| 6:30 AM to 6:59 AM | 0 (0.0%) | 0 (0.0%) |
| 7:00 AM to 7:29 AM | 6 (66.7%) | 1 (14.3%) |
| 7:30 AM to 7:59 AM | 0 (0.0%) | 0 (0.0%) |
| 8:00 AM to 8:29 AM | 0 (0.0%) | 2 (28.6%) |
| 8:30 AM to 8:59 AM | 0 (0.0%) | 0 (0.0%) |
| 9:00 AM to 9:59 AM | 0 (0.0%) | 0 (0.0%) |
| 10:00 AM to 10:59 AM | 0 (0.0%) | 0 (0.0%) |
| 11:00 AM to 11:59 AM | 0 (0.0%) | 0 (0.0%) |
| 12:00 PM to 3:59 PM | 3 (33.3%) | 0 (0.0%) |
| 4:00 PM to 11:59 PM | 0 (0.0%) | 4 (57.1%) |
| Total | 9 (100.0%) | 7 (100.0%) |
Housing Occupancy in Leggett
Occupancy by Ownership in Leggett
Of the total 23 dwellings in Leggett, owner-occupied units account for 19 (82.6%), while renter-occupied units make up 4 (17.4%).
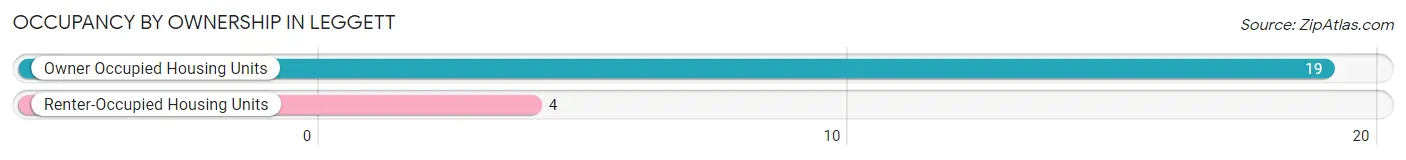
| Occupancy | # Housing Units | % Housing Units |
| Owner Occupied Housing Units | 19 | 82.6% |
| Renter-Occupied Housing Units | 4 | 17.4% |
| Total Occupied Housing Units | 23 | 100.0% |
Occupancy by Household Size in Leggett
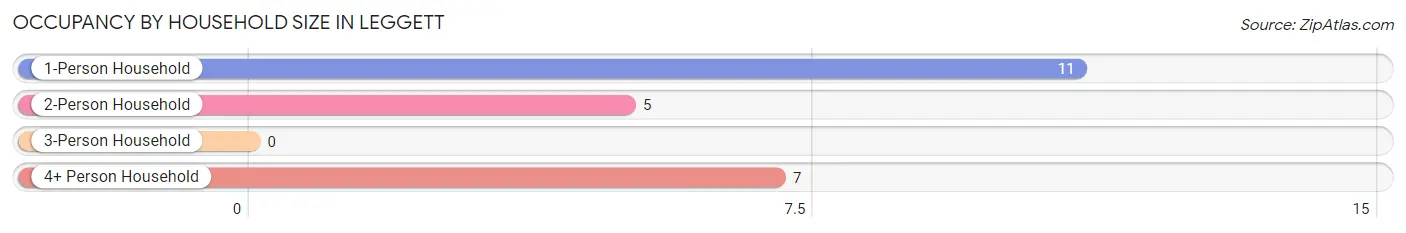
| Household Size | # Housing Units | % Housing Units |
| 1-Person Household | 11 | 47.8% |
| 2-Person Household | 5 | 21.7% |
| 3-Person Household | 0 | 0.0% |
| 4+ Person Household | 7 | 30.4% |
| Total Housing Units | 23 | 100.0% |
Occupancy by Ownership by Household Size in Leggett
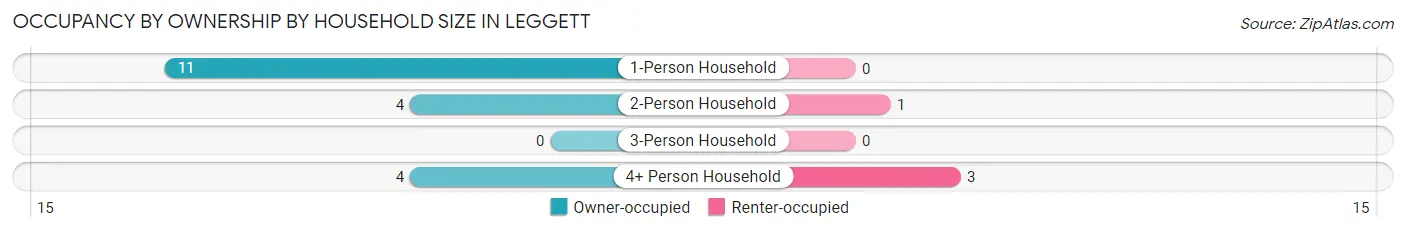
| Household Size | Owner-occupied | Renter-occupied |
| 1-Person Household | 11 (100.0%) | 0 (0.0%) |
| 2-Person Household | 4 (80.0%) | 1 (20.0%) |
| 3-Person Household | 0 (0.0%) | 0 (0.0%) |
| 4+ Person Household | 4 (57.1%) | 3 (42.9%) |
| Total Housing Units | 19 (82.6%) | 4 (17.4%) |
Occupancy by Educational Attainment in Leggett
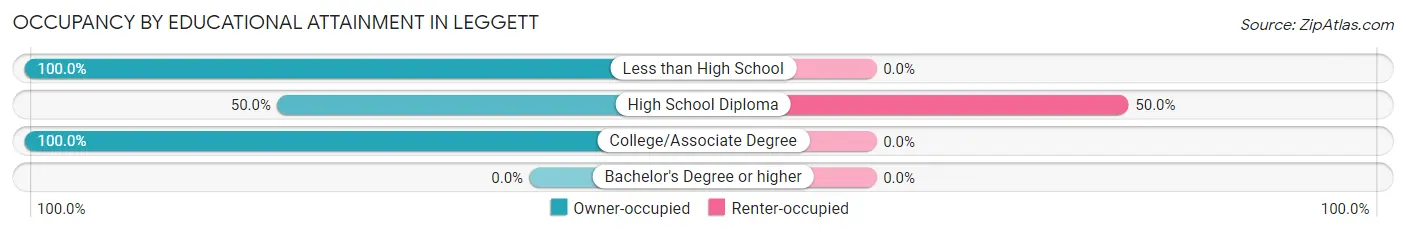
| Household Size | Owner-occupied | Renter-occupied |
| Less than High School | 10 (100.0%) | 0 (0.0%) |
| High School Diploma | 4 (50.0%) | 4 (50.0%) |
| College/Associate Degree | 5 (100.0%) | 0 (0.0%) |
| Bachelor's Degree or higher | 0 (0.0%) | 0 (0.0%) |
Occupancy by Age of Householder in Leggett
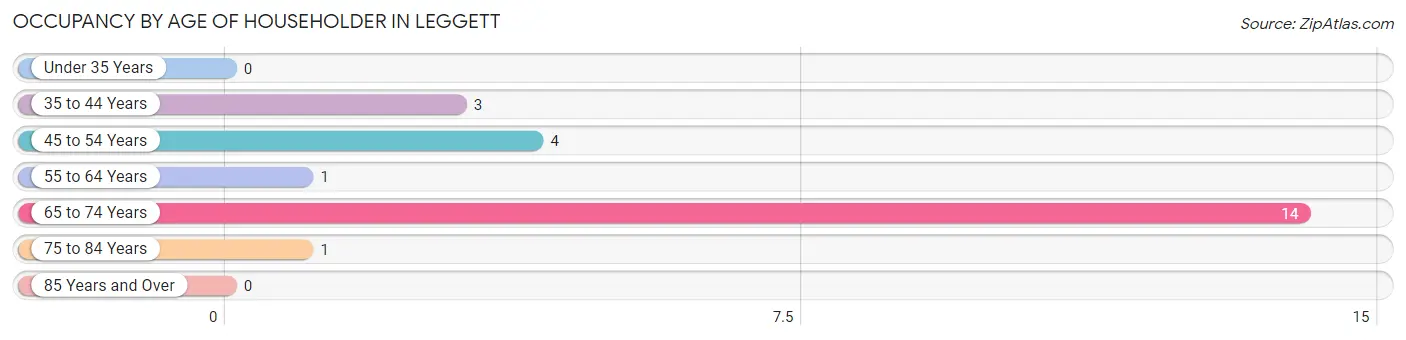
| Age Bracket | # Households | % Households |
| Under 35 Years | 0 | 0.0% |
| 35 to 44 Years | 3 | 13.0% |
| 45 to 54 Years | 4 | 17.4% |
| 55 to 64 Years | 1 | 4.3% |
| 65 to 74 Years | 14 | 60.9% |
| 75 to 84 Years | 1 | 4.3% |
| 85 Years and Over | 0 | 0.0% |
| Total | 23 | 100.0% |
Housing Finances in Leggett
Median Income by Occupancy in Leggett
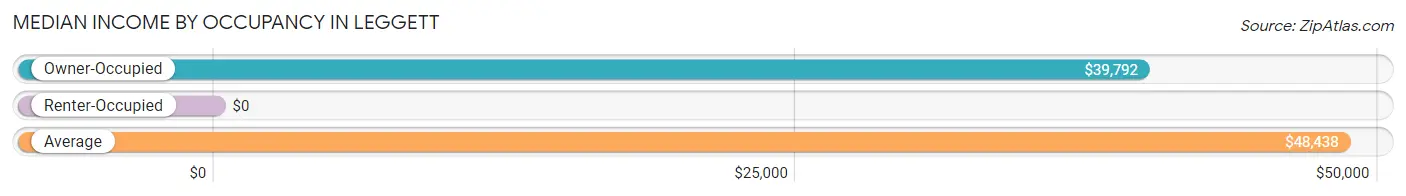
| Occupancy Type | # Households | Median Income |
| Owner-Occupied | 19 (82.6%) | $39,792 |
| Renter-Occupied | 4 (17.4%) | $0 |
| Average | 23 (100.0%) | $48,438 |
Occupancy by Householder Income Bracket in Leggett
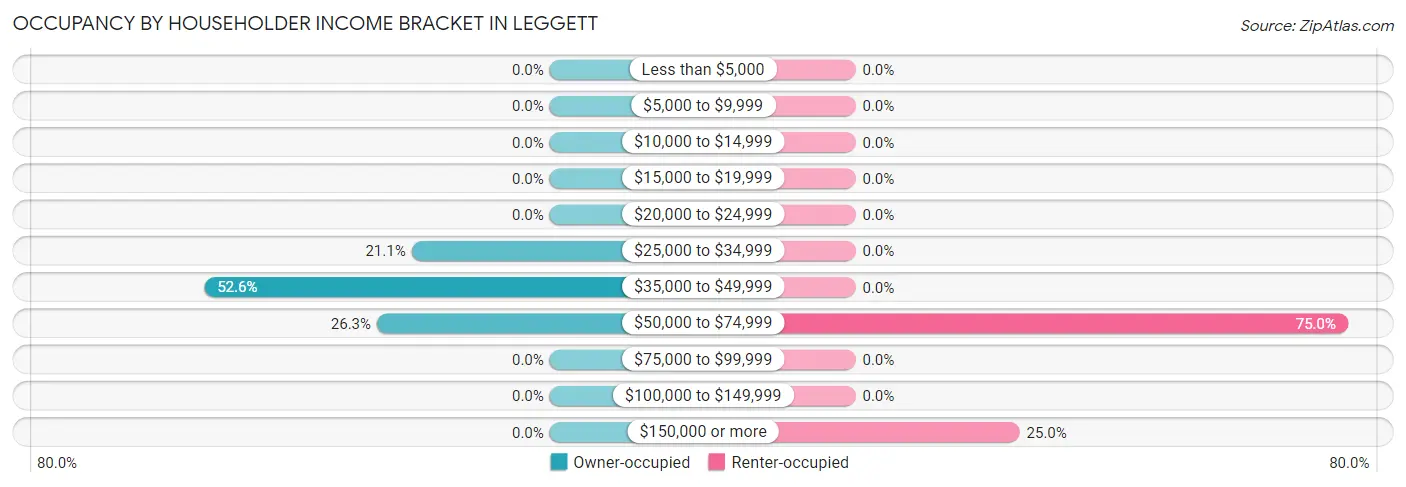
| Income Bracket | Owner-occupied | Renter-occupied |
| Less than $5,000 | 0 (0.0%) | 0 (0.0%) |
| $5,000 to $9,999 | 0 (0.0%) | 0 (0.0%) |
| $10,000 to $14,999 | 0 (0.0%) | 0 (0.0%) |
| $15,000 to $19,999 | 0 (0.0%) | 0 (0.0%) |
| $20,000 to $24,999 | 0 (0.0%) | 0 (0.0%) |
| $25,000 to $34,999 | 4 (21.0%) | 0 (0.0%) |
| $35,000 to $49,999 | 10 (52.6%) | 0 (0.0%) |
| $50,000 to $74,999 | 5 (26.3%) | 3 (75.0%) |
| $75,000 to $99,999 | 0 (0.0%) | 0 (0.0%) |
| $100,000 to $149,999 | 0 (0.0%) | 0 (0.0%) |
| $150,000 or more | 0 (0.0%) | 1 (25.0%) |
| Total | 19 (100.0%) | 4 (100.0%) |
Monthly Housing Cost Tiers in Leggett
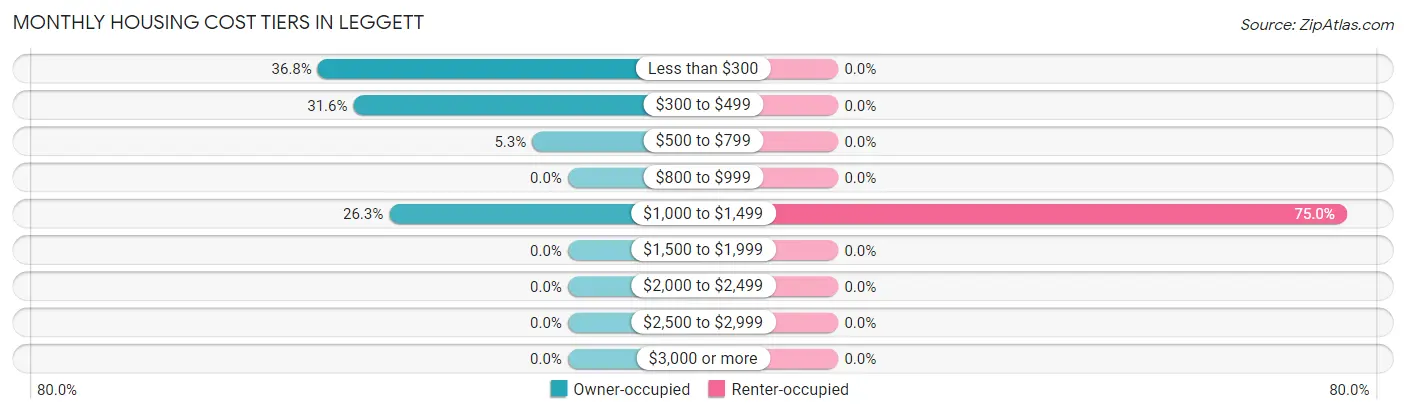
| Monthly Cost | Owner-occupied | Renter-occupied |
| Less than $300 | 7 (36.8%) | 0 (0.0%) |
| $300 to $499 | 6 (31.6%) | 0 (0.0%) |
| $500 to $799 | 1 (5.3%) | 0 (0.0%) |
| $800 to $999 | 0 (0.0%) | 0 (0.0%) |
| $1,000 to $1,499 | 5 (26.3%) | 3 (75.0%) |
| $1,500 to $1,999 | 0 (0.0%) | 0 (0.0%) |
| $2,000 to $2,499 | 0 (0.0%) | 0 (0.0%) |
| $2,500 to $2,999 | 0 (0.0%) | 0 (0.0%) |
| $3,000 or more | 0 (0.0%) | 0 (0.0%) |
| Total | 19 (100.0%) | 4 (100.0%) |
Physical Housing Characteristics in Leggett
Housing Structures in Leggett
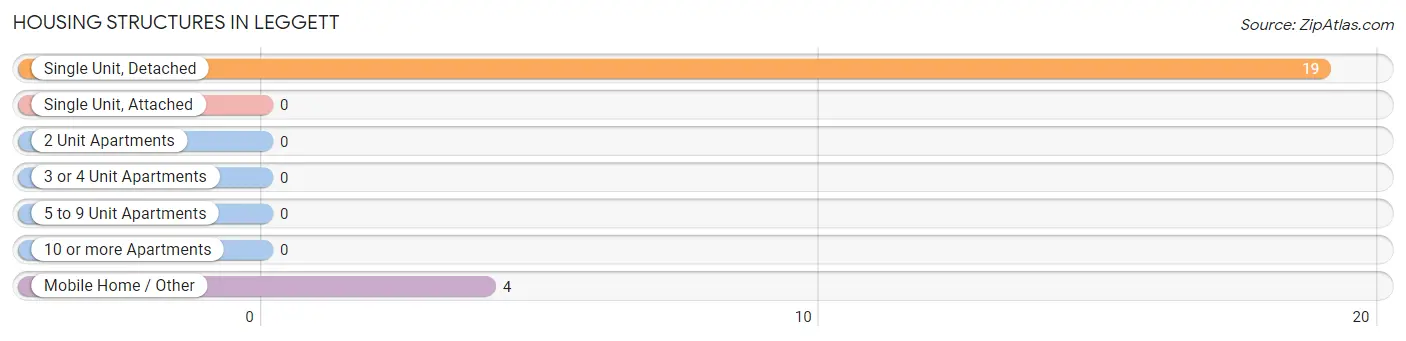
| Structure Type | # Housing Units | % Housing Units |
| Single Unit, Detached | 19 | 82.6% |
| Single Unit, Attached | 0 | 0.0% |
| 2 Unit Apartments | 0 | 0.0% |
| 3 or 4 Unit Apartments | 0 | 0.0% |
| 5 to 9 Unit Apartments | 0 | 0.0% |
| 10 or more Apartments | 0 | 0.0% |
| Mobile Home / Other | 4 | 17.4% |
| Total | 23 | 100.0% |
Housing Structures by Occupancy in Leggett
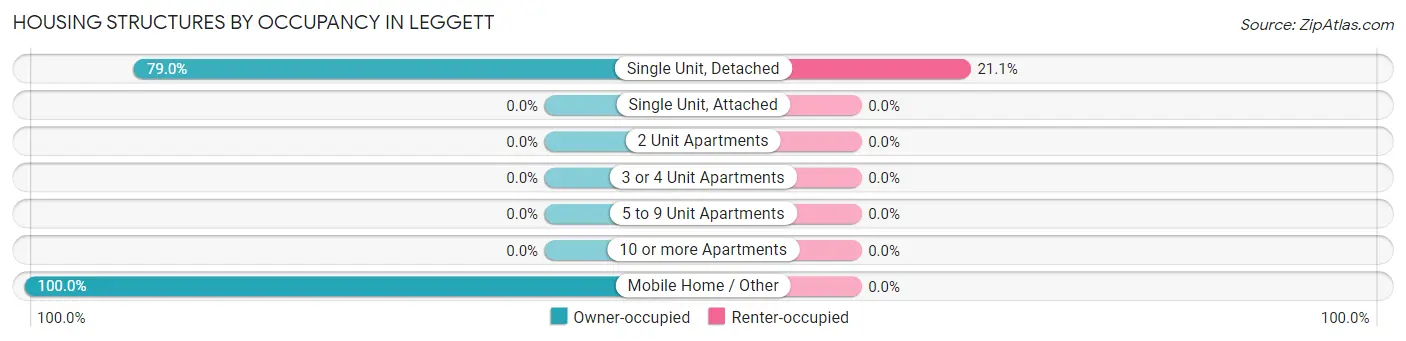
| Structure Type | Owner-occupied | Renter-occupied |
| Single Unit, Detached | 15 (78.9%) | 4 (21.0%) |
| Single Unit, Attached | 0 (0.0%) | 0 (0.0%) |
| 2 Unit Apartments | 0 (0.0%) | 0 (0.0%) |
| 3 or 4 Unit Apartments | 0 (0.0%) | 0 (0.0%) |
| 5 to 9 Unit Apartments | 0 (0.0%) | 0 (0.0%) |
| 10 or more Apartments | 0 (0.0%) | 0 (0.0%) |
| Mobile Home / Other | 4 (100.0%) | 0 (0.0%) |
| Total | 19 (82.6%) | 4 (17.4%) |
Housing Structures by Number of Rooms in Leggett
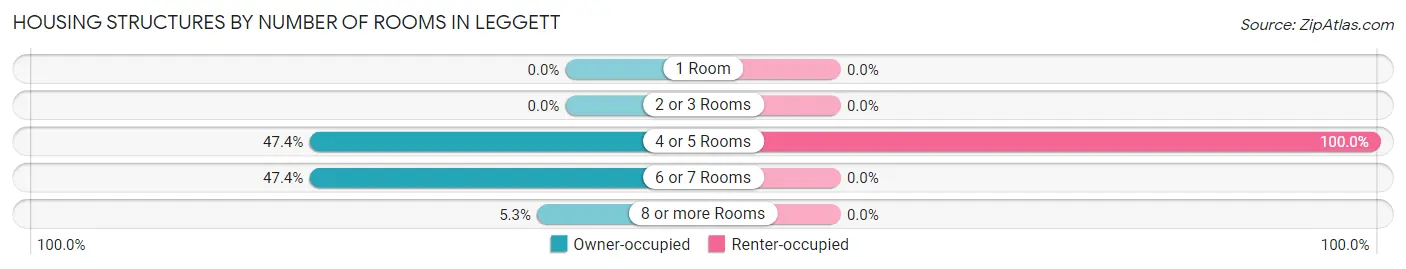
| Number of Rooms | Owner-occupied | Renter-occupied |
| 1 Room | 0 (0.0%) | 0 (0.0%) |
| 2 or 3 Rooms | 0 (0.0%) | 0 (0.0%) |
| 4 or 5 Rooms | 9 (47.4%) | 4 (100.0%) |
| 6 or 7 Rooms | 9 (47.4%) | 0 (0.0%) |
| 8 or more Rooms | 1 (5.3%) | 0 (0.0%) |
| Total | 19 (100.0%) | 4 (100.0%) |
Housing Structure by Heating Type in Leggett
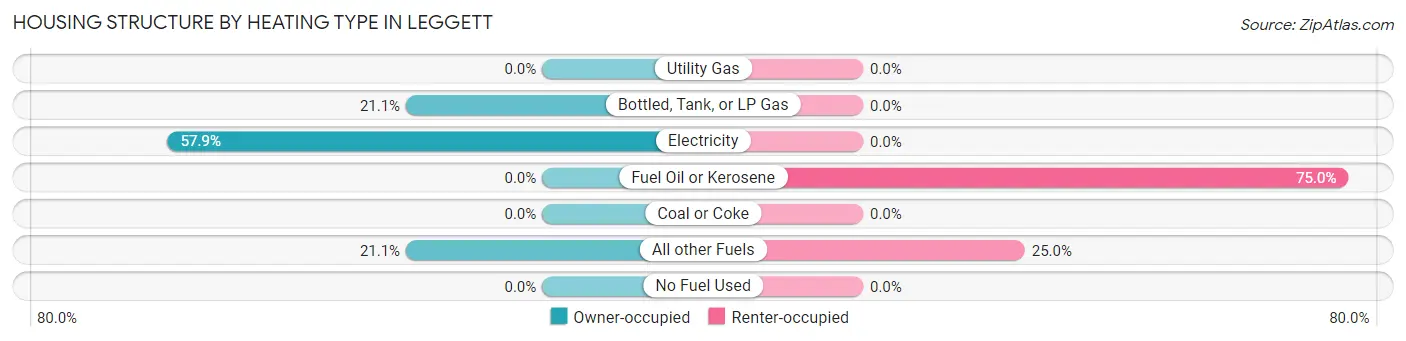
| Heating Type | Owner-occupied | Renter-occupied |
| Utility Gas | 0 (0.0%) | 0 (0.0%) |
| Bottled, Tank, or LP Gas | 4 (21.0%) | 0 (0.0%) |
| Electricity | 11 (57.9%) | 0 (0.0%) |
| Fuel Oil or Kerosene | 0 (0.0%) | 3 (75.0%) |
| Coal or Coke | 0 (0.0%) | 0 (0.0%) |
| All other Fuels | 4 (21.0%) | 1 (25.0%) |
| No Fuel Used | 0 (0.0%) | 0 (0.0%) |
| Total | 19 (100.0%) | 4 (100.0%) |
Household Vehicle Usage in Leggett
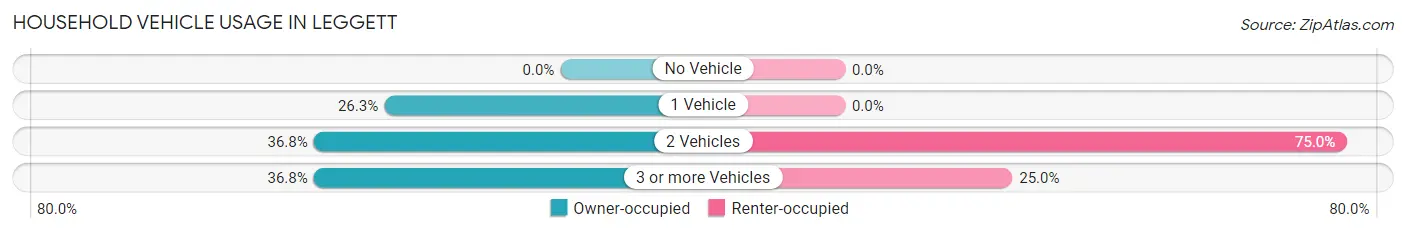
| Vehicles per Household | Owner-occupied | Renter-occupied |
| No Vehicle | 0 (0.0%) | 0 (0.0%) |
| 1 Vehicle | 5 (26.3%) | 0 (0.0%) |
| 2 Vehicles | 7 (36.8%) | 3 (75.0%) |
| 3 or more Vehicles | 7 (36.8%) | 1 (25.0%) |
| Total | 19 (100.0%) | 4 (100.0%) |
Real Estate & Mortgages in Leggett
Real Estate and Mortgage Overview in Leggett
| Characteristic | Without Mortgage | With Mortgage |
| Housing Units | 8 | 11 |
| Median Property Value | - | - |
| Median Household Income | $53,125 | $0 |
| Monthly Housing Costs | $263 | $0 |
| Real Estate Taxes | - | - |
Property Value by Mortgage Status in Leggett
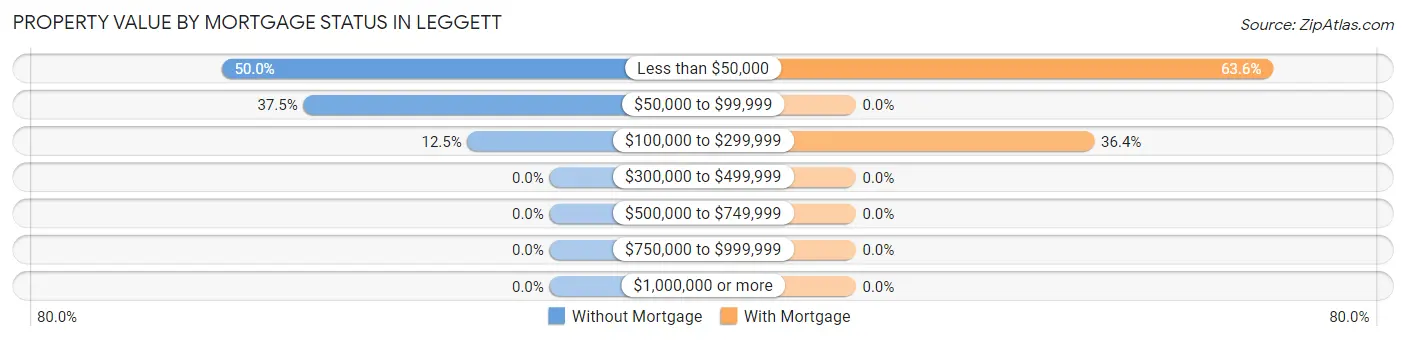
| Property Value | Without Mortgage | With Mortgage |
| Less than $50,000 | 4 (50.0%) | 7 (63.6%) |
| $50,000 to $99,999 | 3 (37.5%) | 0 (0.0%) |
| $100,000 to $299,999 | 1 (12.5%) | 4 (36.4%) |
| $300,000 to $499,999 | 0 (0.0%) | 0 (0.0%) |
| $500,000 to $749,999 | 0 (0.0%) | 0 (0.0%) |
| $750,000 to $999,999 | 0 (0.0%) | 0 (0.0%) |
| $1,000,000 or more | 0 (0.0%) | 0 (0.0%) |
| Total | 8 (100.0%) | 11 (100.0%) |
Household Income by Mortgage Status in Leggett
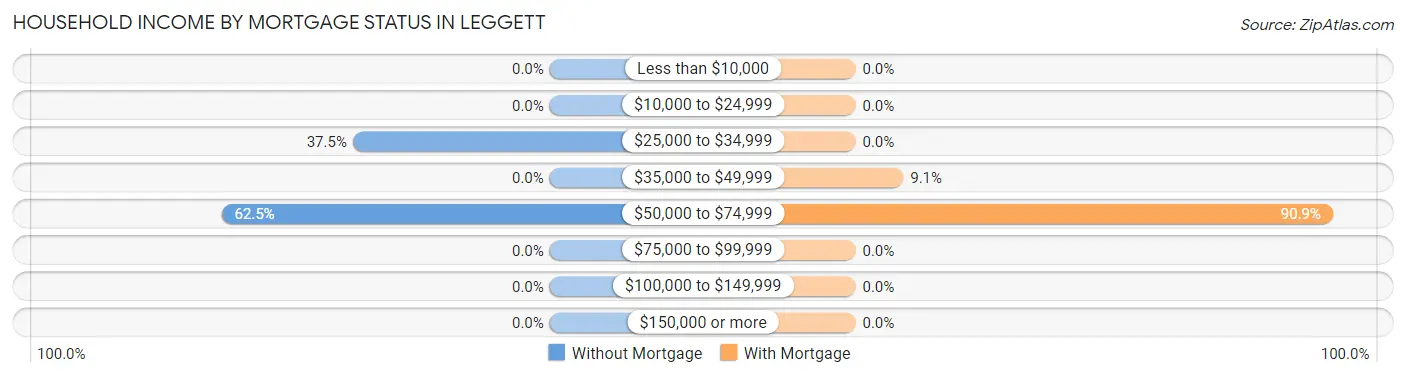
| Household Income | Without Mortgage | With Mortgage |
| Less than $10,000 | 0 (0.0%) | 0 (0.0%) |
| $10,000 to $24,999 | 0 (0.0%) | 0 (0.0%) |
| $25,000 to $34,999 | 3 (37.5%) | 0 (0.0%) |
| $35,000 to $49,999 | 0 (0.0%) | 1 (9.1%) |
| $50,000 to $74,999 | 5 (62.5%) | 10 (90.9%) |
| $75,000 to $99,999 | 0 (0.0%) | 0 (0.0%) |
| $100,000 to $149,999 | 0 (0.0%) | 0 (0.0%) |
| $150,000 or more | 0 (0.0%) | 0 (0.0%) |
| Total | 8 (100.0%) | 11 (100.0%) |
Property Value to Household Income Ratio in Leggett
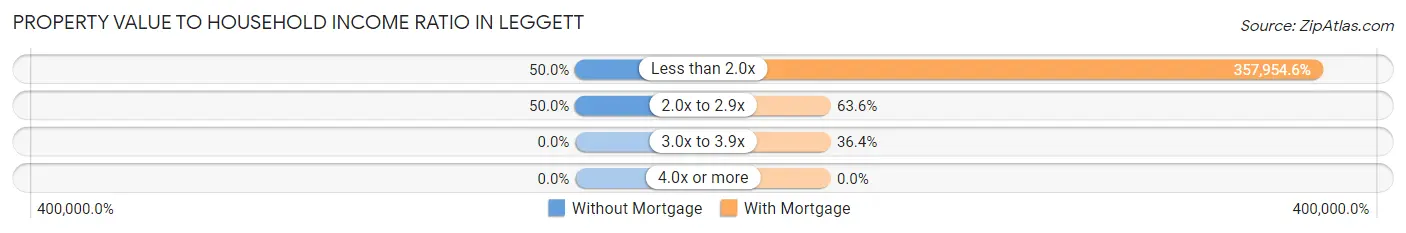
| Value-to-Income Ratio | Without Mortgage | With Mortgage |
| Less than 2.0x | 4 (50.0%) | 39,375 (357,954.6%) |
| 2.0x to 2.9x | 4 (50.0%) | 7 (63.6%) |
| 3.0x to 3.9x | 0 (0.0%) | 4 (36.4%) |
| 4.0x or more | 0 (0.0%) | 0 (0.0%) |
| Total | 8 (100.0%) | 11 (100.0%) |
Real Estate Taxes by Mortgage Status in Leggett
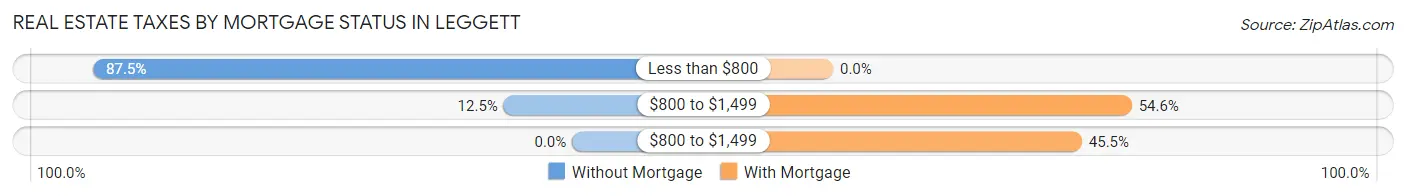
| Property Taxes | Without Mortgage | With Mortgage |
| Less than $800 | 7 (87.5%) | 0 (0.0%) |
| $800 to $1,499 | 1 (12.5%) | 6 (54.5%) |
| $800 to $1,499 | 0 (0.0%) | 5 (45.5%) |
| Total | 8 (100.0%) | 11 (100.0%) |
Health & Disability in Leggett
Health Insurance Coverage by Age in Leggett
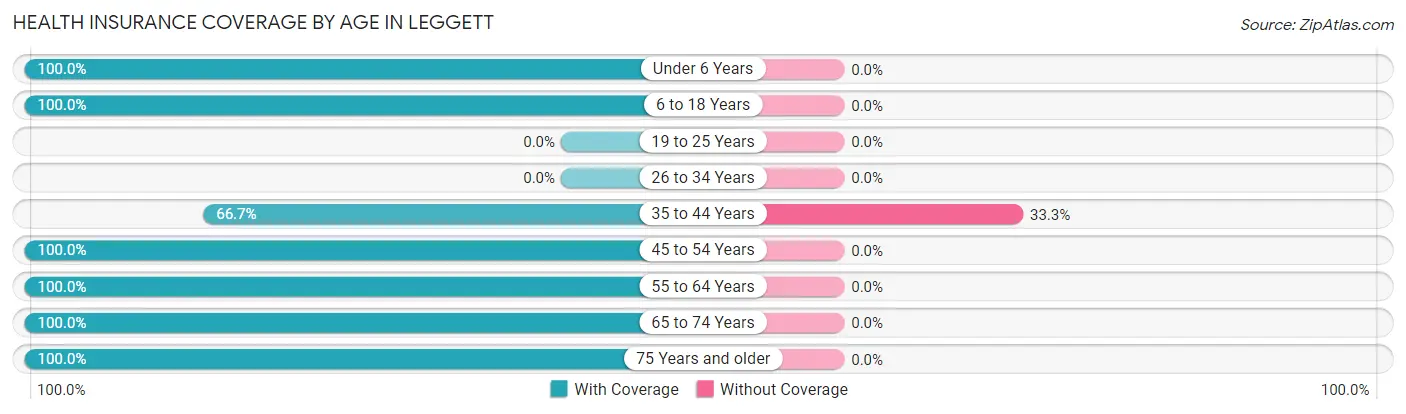
| Age Bracket | With Coverage | Without Coverage |
| Under 6 Years | 11 (100.0%) | 0 (0.0%) |
| 6 to 18 Years | 3 (100.0%) | 0 (0.0%) |
| 19 to 25 Years | 0 (0.0%) | 0 (0.0%) |
| 26 to 34 Years | 0 (0.0%) | 0 (0.0%) |
| 35 to 44 Years | 6 (66.7%) | 3 (33.3%) |
| 45 to 54 Years | 4 (100.0%) | 0 (0.0%) |
| 55 to 64 Years | 1 (100.0%) | 0 (0.0%) |
| 65 to 74 Years | 26 (100.0%) | 0 (0.0%) |
| 75 Years and older | 1 (100.0%) | 0 (0.0%) |
| Total | 52 (94.6%) | 3 (5.4%) |
Health Insurance Coverage by Citizenship Status in Leggett
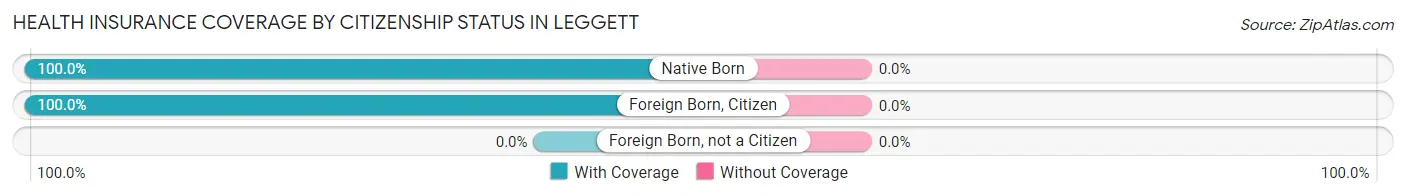
| Citizenship Status | With Coverage | Without Coverage |
| Native Born | 11 (100.0%) | 0 (0.0%) |
| Foreign Born, Citizen | 3 (100.0%) | 0 (0.0%) |
| Foreign Born, not a Citizen | 0 (0.0%) | 0 (0.0%) |
Health Insurance Coverage by Household Income in Leggett
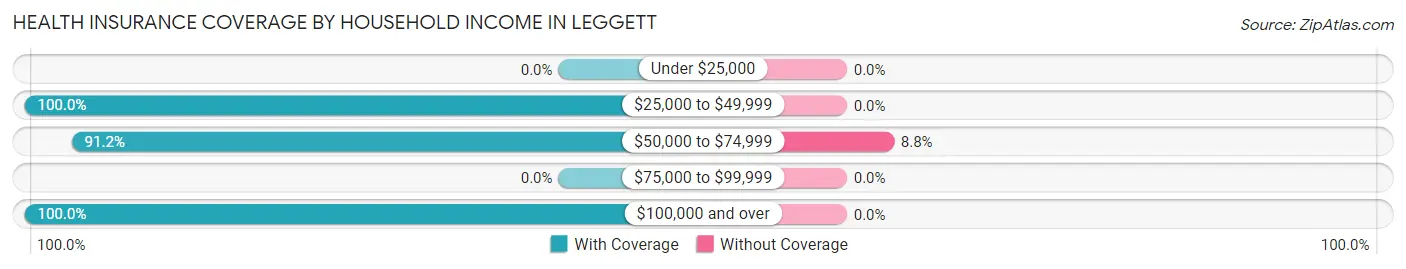
| Household Income | With Coverage | Without Coverage |
| Under $25,000 | 0 (0.0%) | 0 (0.0%) |
| $25,000 to $49,999 | 18 (100.0%) | 0 (0.0%) |
| $50,000 to $74,999 | 31 (91.2%) | 3 (8.8%) |
| $75,000 to $99,999 | 0 (0.0%) | 0 (0.0%) |
| $100,000 and over | 3 (100.0%) | 0 (0.0%) |
Public vs Private Health Insurance Coverage by Age in Leggett
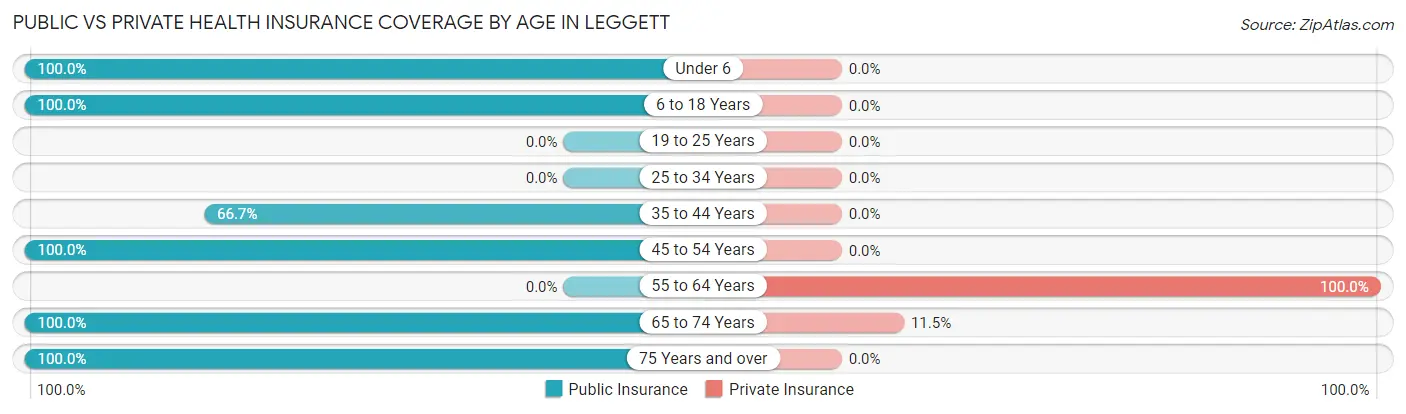
| Age Bracket | Public Insurance | Private Insurance |
| Under 6 | 11 (100.0%) | 0 (0.0%) |
| 6 to 18 Years | 3 (100.0%) | 0 (0.0%) |
| 19 to 25 Years | 0 (0.0%) | 0 (0.0%) |
| 25 to 34 Years | 0 (0.0%) | 0 (0.0%) |
| 35 to 44 Years | 6 (66.7%) | 0 (0.0%) |
| 45 to 54 Years | 4 (100.0%) | 0 (0.0%) |
| 55 to 64 Years | 0 (0.0%) | 1 (100.0%) |
| 65 to 74 Years | 26 (100.0%) | 3 (11.5%) |
| 75 Years and over | 1 (100.0%) | 0 (0.0%) |
| Total | 51 (92.7%) | 4 (7.3%) |
Disability Status by Sex by Age in Leggett
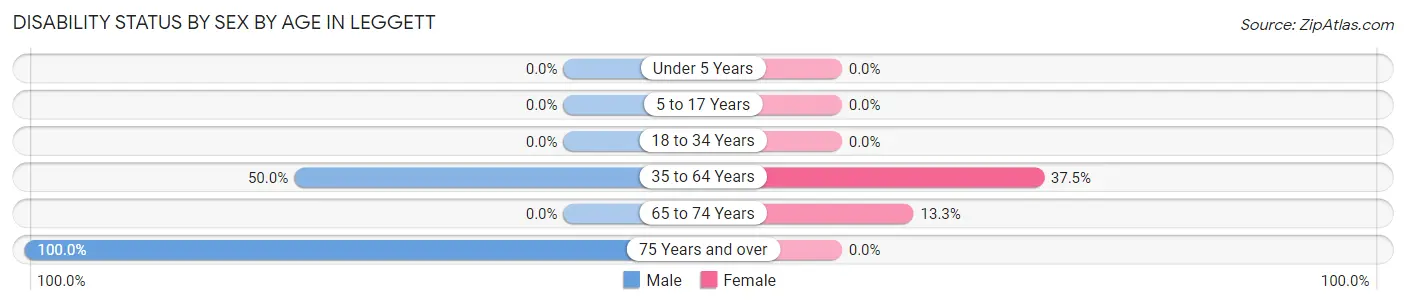
| Age Bracket | Male | Female |
| Under 5 Years | 0 (0.0%) | 0 (0.0%) |
| 5 to 17 Years | 0 (0.0%) | 0 (0.0%) |
| 18 to 34 Years | 0 (0.0%) | 0 (0.0%) |
| 35 to 64 Years | 3 (50.0%) | 3 (37.5%) |
| 65 to 74 Years | 0 (0.0%) | 2 (13.3%) |
| 75 Years and over | 1 (100.0%) | 0 (0.0%) |
Disability Class by Sex by Age in Leggett
Disability Class: Hearing Difficulty
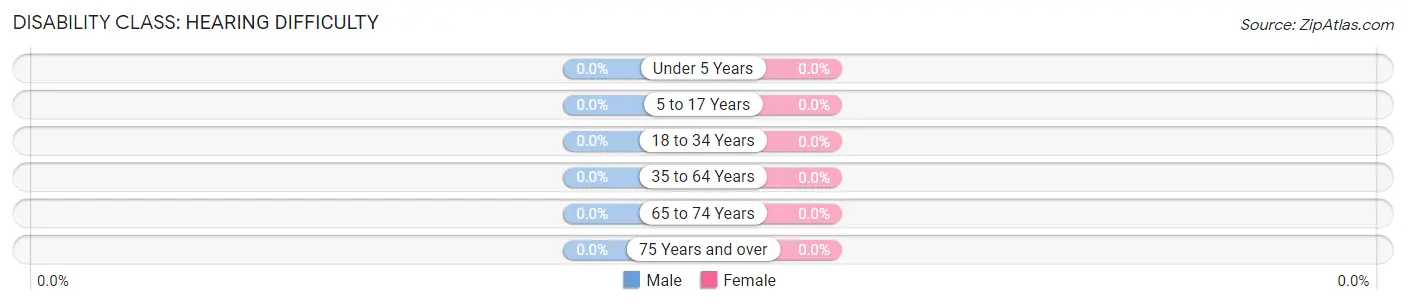
| Age Bracket | Male | Female |
| Under 5 Years | 0 (0.0%) | 0 (0.0%) |
| 5 to 17 Years | 0 (0.0%) | 0 (0.0%) |
| 18 to 34 Years | 0 (0.0%) | 0 (0.0%) |
| 35 to 64 Years | 0 (0.0%) | 0 (0.0%) |
| 65 to 74 Years | 0 (0.0%) | 0 (0.0%) |
| 75 Years and over | 0 (0.0%) | 0 (0.0%) |
Disability Class: Vision Difficulty
| Age Bracket | Male | Female |
| Under 5 Years | 0 (0.0%) | 0 (0.0%) |
| 5 to 17 Years | 0 (0.0%) | 0 (0.0%) |
| 18 to 34 Years | 0 (0.0%) | 0 (0.0%) |
| 35 to 64 Years | 0 (0.0%) | 0 (0.0%) |
| 65 to 74 Years | 0 (0.0%) | 0 (0.0%) |
| 75 Years and over | 0 (0.0%) | 0 (0.0%) |
Disability Class: Cognitive Difficulty
| Age Bracket | Male | Female |
| 5 to 17 Years | 0 (0.0%) | 0 (0.0%) |
| 18 to 34 Years | 0 (0.0%) | 0 (0.0%) |
| 35 to 64 Years | 0 (0.0%) | 0 (0.0%) |
| 65 to 74 Years | 0 (0.0%) | 0 (0.0%) |
| 75 Years and over | 0 (0.0%) | 0 (0.0%) |
Disability Class: Ambulatory Difficulty
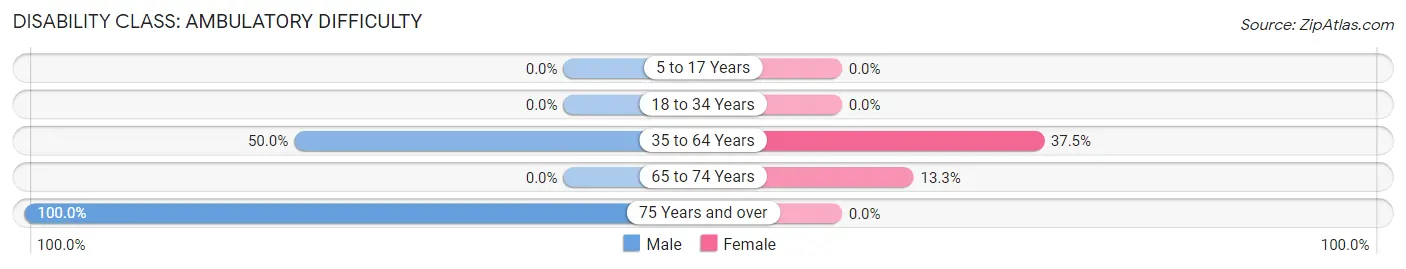
| Age Bracket | Male | Female |
| 5 to 17 Years | 0 (0.0%) | 0 (0.0%) |
| 18 to 34 Years | 0 (0.0%) | 0 (0.0%) |
| 35 to 64 Years | 3 (50.0%) | 3 (37.5%) |
| 65 to 74 Years | 0 (0.0%) | 2 (13.3%) |
| 75 Years and over | 1 (100.0%) | 0 (0.0%) |
Disability Class: Self-Care Difficulty
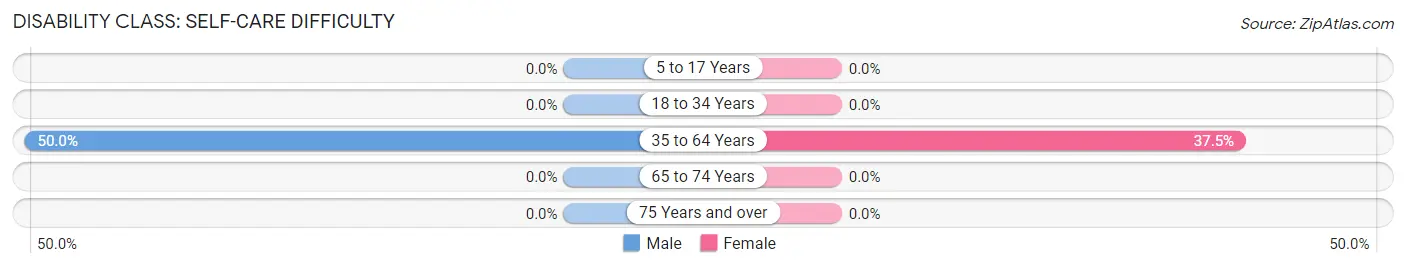
| Age Bracket | Male | Female |
| 5 to 17 Years | 0 (0.0%) | 0 (0.0%) |
| 18 to 34 Years | 0 (0.0%) | 0 (0.0%) |
| 35 to 64 Years | 3 (50.0%) | 3 (37.5%) |
| 65 to 74 Years | 0 (0.0%) | 0 (0.0%) |
| 75 Years and over | 0 (0.0%) | 0 (0.0%) |
Technology Access in Leggett
Computing Device Access in Leggett
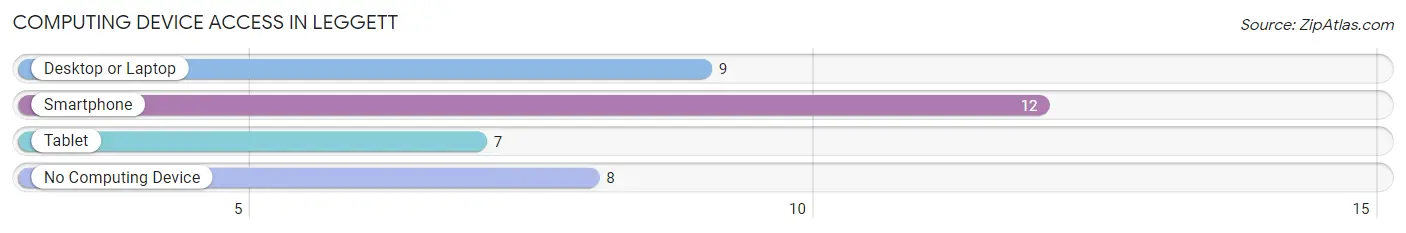
| Device Type | # Households | % Households |
| Desktop or Laptop | 9 | 39.1% |
| Smartphone | 12 | 52.2% |
| Tablet | 7 | 30.4% |
| No Computing Device | 8 | 34.8% |
| Total | 23 | 100.0% |
Internet Access in Leggett
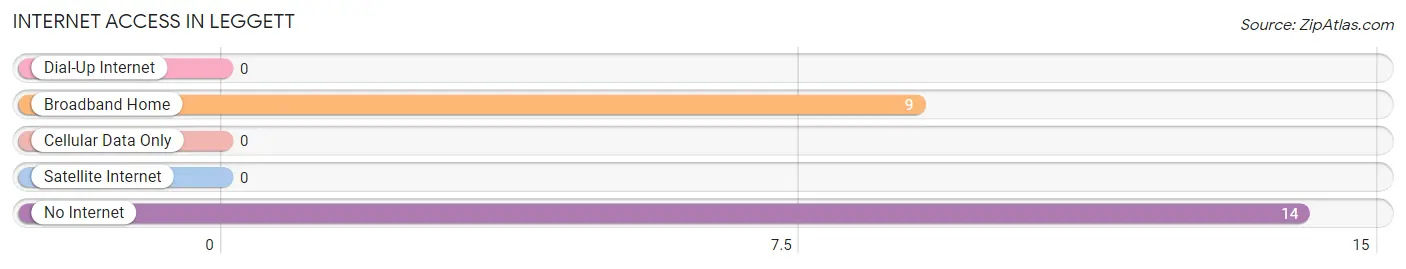
| Internet Type | # Households | % Households |
| Dial-Up Internet | 0 | 0.0% |
| Broadband Home | 9 | 39.1% |
| Cellular Data Only | 0 | 0.0% |
| Satellite Internet | 0 | 0.0% |
| No Internet | 14 | 60.9% |
| Total | 23 | 100.0% |
Leggett Summary
Leggett, North Carolina is a small town located in the northeastern corner of the state, in the county of Edgecombe. It is situated on the banks of the Tar River, and is part of the Rocky Mount metropolitan area. The town has a population of approximately 1,500 people, and is known for its rural charm and friendly atmosphere.
History
Leggett was founded in 1872 by William Leggett, a former Confederate soldier. He purchased the land from the local Native American tribes and named the town after himself. The town was incorporated in 1887, and the first post office was established in 1891.
Leggett was a small farming community for many years, but in the early 1900s, the town began to grow and develop. The first bank was established in 1906, and the first school was built in 1908. The town also had a cotton mill, a sawmill, and a gristmill.
In the 1950s, the town began to decline as the local economy shifted away from agriculture. The cotton mill closed in the 1960s, and the sawmill and gristmill closed in the 1970s. The town was hit hard by the Great Recession of 2008, and many businesses closed or moved away.
Geography
Leggett is located in the northeastern corner of North Carolina, in the county of Edgecombe. It is situated on the banks of the Tar River, and is part of the Rocky Mount metropolitan area. The town is located about 30 miles east of Raleigh, the state capital.
The town is surrounded by rolling hills and forests, and is home to several small lakes and streams. The climate is mild, with hot summers and cool winters. The average annual temperature is around 70 degrees Fahrenheit.
Economy
Leggett’s economy is largely based on agriculture and tourism. The town is home to several small farms, and the local farmers’ markets are popular with visitors. The town also has several small businesses, including restaurants, shops, and a few manufacturing companies.
The town is also home to several historic sites, including the Leggett House, a 19th-century plantation house, and the Leggett Cemetery, which is the final resting place of many of the town’s earliest settlers.
Demographics
As of the 2010 census, the population of Leggett was 1,500. The racial makeup of the town was 79.2% White, 17.2% African American, 0.7% Native American, 0.3% Asian, and 2.6% from other races. The median household income was $31,250, and the median age was 39.
Leggett is a small, rural town with a friendly atmosphere and a strong sense of community. The town is home to several churches, and the local schools are highly rated. The town is also home to several parks and recreational areas, making it a great place to live and visit.
Common Questions
What is Per Capita Income in Leggett?
Per Capita income in Leggett is $63,300.
What is the Median Family Income in Leggett?
Median Family Income in Leggett is $52,500.
What is the Median Household income in Leggett?
Median Household Income in Leggett is $48,438.
What is Inequality or Gini Index in Leggett?
Inequality or Gini Index in Leggett is 0.57.
What is the Total Population of Leggett?
Total Population of Leggett is 55.
What is the Total Male Population of Leggett?
Total Male Population of Leggett is 21.
What is the Total Female Population of Leggett?
Total Female Population of Leggett is 34.
What is the Ratio of Males per 100 Females in Leggett?
There are 61.76 Males per 100 Females in Leggett.
What is the Ratio of Females per 100 Males in Leggett?
There are 161.90 Females per 100 Males in Leggett.
What is the Median Population Age in Leggett?
Median Population Age in Leggett is 59.5 Years.
What is the Average Family Size in Leggett
Average Family Size in Leggett is 3.4 People.
What is the Average Household Size in Leggett
Average Household Size in Leggett is 2.4 People.
How Large is the Labor Force in Leggett?
There are 17 People in the Labor Forcein in Leggett.
What is the Percentage of People in the Labor Force in Leggett?
41.5% of People are in the Labor Force in Leggett.