Zip Codes with the Highest Percentage of Population Employed in Food Preparation & Serving in Statesville, NC
RELATED REPORTS & OPTIONS
Food Preparation & Serving
Statesville
Compare Zip Codes
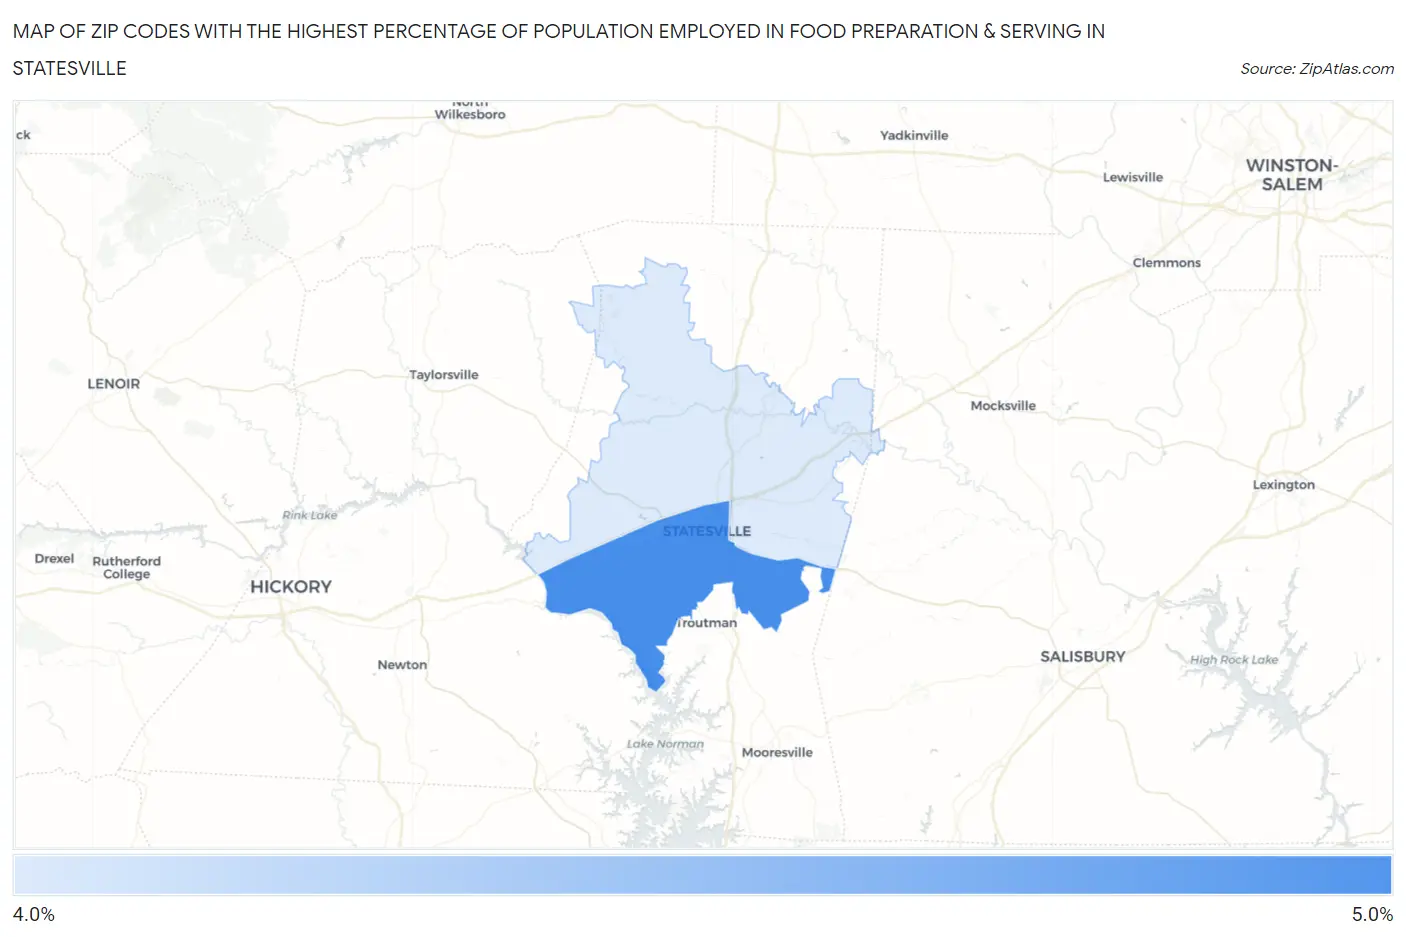
Map of Zip Codes with the Highest Percentage of Population Employed in Food Preparation & Serving in Statesville
4.4%
4.8%
Zip Codes with the Highest Percentage of Population Employed in Food Preparation & Serving in Statesville, NC
| Zip Code | % Employed | vs State | vs National | |
| 1. | 28677 | 4.8% | 5.3%(-0.518)#385 | 5.3%(-0.514)#13,857 |
| 2. | 28625 | 4.4% | 5.3%(-0.890)#428 | 5.3%(-0.886)#15,417 |
1
Common Questions
What are the Top Zip Codes with the Highest Percentage of Population Employed in Food Preparation & Serving in Statesville, NC?
Top Zip Codes with the Highest Percentage of Population Employed in Food Preparation & Serving in Statesville, NC are:
What zip code has the Highest Percentage of Population Employed in Food Preparation & Serving in Statesville, NC?
28677 has the Highest Percentage of Population Employed in Food Preparation & Serving in Statesville, NC with 4.8%.
What is the Percentage of Population Employed in Food Preparation & Serving in Statesville, NC?
Percentage of Population Employed in Food Preparation & Serving in Statesville is 5.3%.
What is the Percentage of Population Employed in Food Preparation & Serving in North Carolina?
Percentage of Population Employed in Food Preparation & Serving in North Carolina is 5.3%.
What is the Percentage of Population Employed in Food Preparation & Serving in the United States?
Percentage of Population Employed in Food Preparation & Serving in the United States is 5.3%.