Asheville, NC Map & Demographics
Asheville Map
Asheville Overview
$40,899
PER CAPITA INCOME
$87,626
AVG FAMILY INCOME
$63,810
AVG HOUSEHOLD INCOME
11.4%
WAGE / INCOME GAP [ % ]
88.6¢/ $1
WAGE / INCOME GAP [ $ ]
$8,216
FAMILY INCOME DEFICIT
0.49
INEQUALITY / GINI INDEX
93,695
TOTAL POPULATION
45,056
MALE POPULATION
48,639
FEMALE POPULATION
92.63
MALES / 100 FEMALES
107.95
FEMALES / 100 MALES
40.5
MEDIAN AGE
3.1
AVG FAMILY SIZE
2.4
AVG HOUSEHOLD SIZE
50,503
LABOR FORCE [ PEOPLE ]
63.4%
PERCENT IN LABOR FORCE
4.1%
UNEMPLOYMENT RATE
Asheville Area Codes
Income in Asheville
Income Overview in Asheville
Per Capita Income in Asheville is $40,899, while median incomes of families and households are $87,626 and $63,810 respectively.
| Characteristic | Number | Measure |
| Per Capita Income | 93,695 | $40,899 |
| Median Family Income | 18,166 | $87,626 |
| Mean Family Income | 18,166 | $119,757 |
| Median Household Income | 38,229 | $63,810 |
| Mean Household Income | 38,229 | $90,595 |
| Income Deficit | 18,166 | $8,216 |
| Wage / Income Gap (%) | 93,695 | 11.44% |
| Wage / Income Gap ($) | 93,695 | 88.56¢ per $1 |
| Gini / Inequality Index | 93,695 | 0.49 |
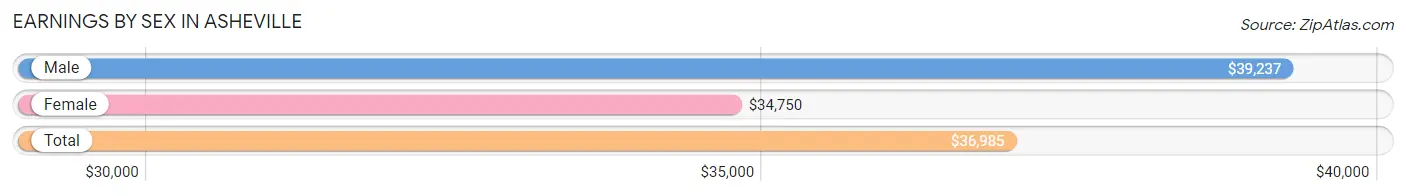
Earnings by Sex in Asheville
Average Earnings in Asheville are $36,985, $39,237 for men and $34,750 for women, a difference of 11.4%.
| Sex | Number | Average Earnings |
| Male | 26,163 (49.8%) | $39,237 |
| Female | 26,341 (50.2%) | $34,750 |
| Total | 52,504 (100.0%) | $36,985 |
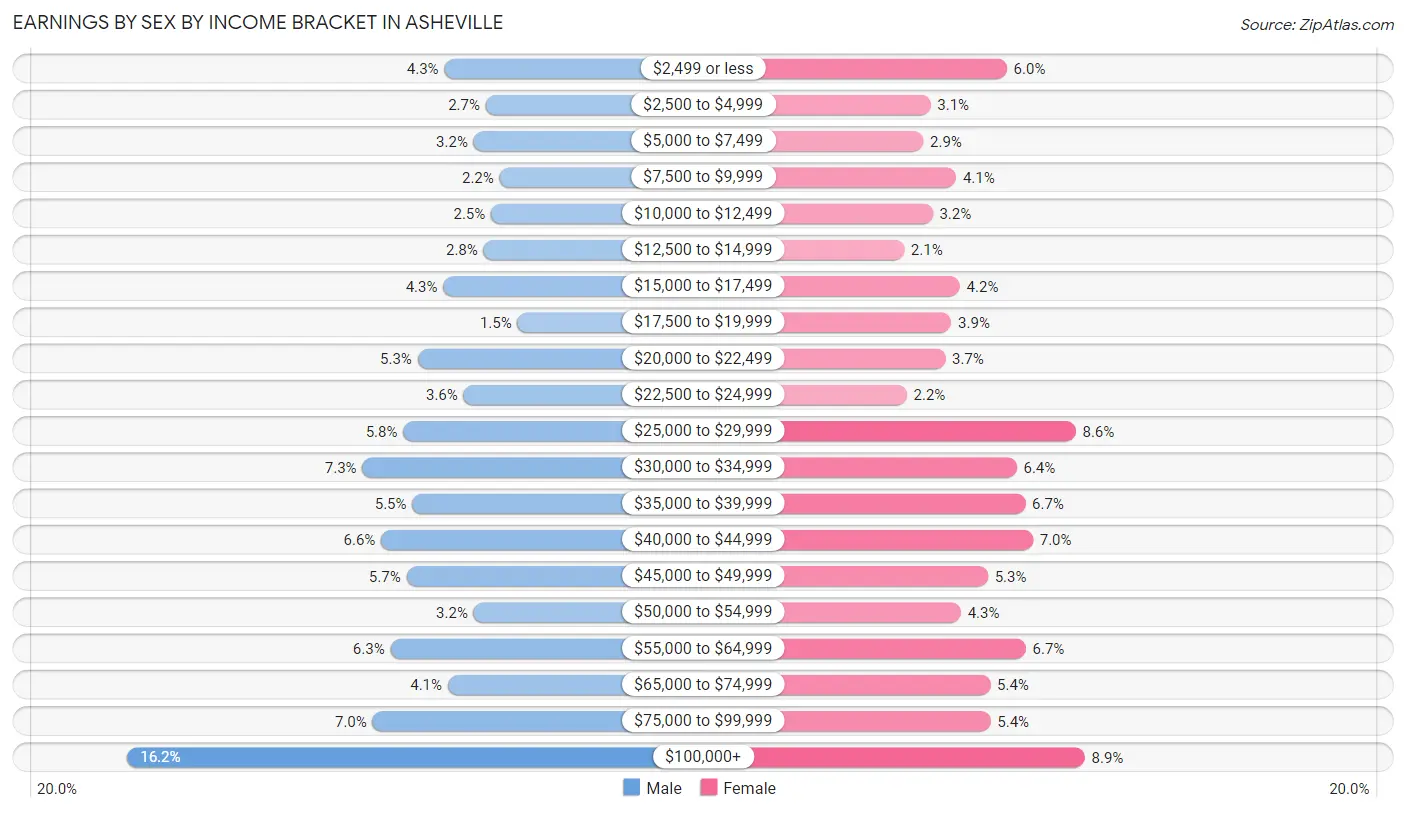
Earnings by Sex by Income Bracket in Asheville
The most common earnings brackets in Asheville are $100,000+ for men (4,226 | 16.2%) and $100,000+ for women (2,347 | 8.9%).
| Income | Male | Female |
| $2,499 or less | 1,117 (4.3%) | 1,578 (6.0%) |
| $2,500 to $4,999 | 712 (2.7%) | 825 (3.1%) |
| $5,000 to $7,499 | 829 (3.2%) | 754 (2.9%) |
| $7,500 to $9,999 | 576 (2.2%) | 1,078 (4.1%) |
| $10,000 to $12,499 | 658 (2.5%) | 846 (3.2%) |
| $12,500 to $14,999 | 733 (2.8%) | 563 (2.1%) |
| $15,000 to $17,499 | 1,128 (4.3%) | 1,115 (4.2%) |
| $17,500 to $19,999 | 399 (1.5%) | 1,031 (3.9%) |
| $20,000 to $22,499 | 1,378 (5.3%) | 969 (3.7%) |
| $22,500 to $24,999 | 928 (3.5%) | 591 (2.2%) |
| $25,000 to $29,999 | 1,519 (5.8%) | 2,257 (8.6%) |
| $30,000 to $34,999 | 1,921 (7.3%) | 1,676 (6.4%) |
| $35,000 to $39,999 | 1,432 (5.5%) | 1,760 (6.7%) |
| $40,000 to $44,999 | 1,738 (6.6%) | 1,837 (7.0%) |
| $45,000 to $49,999 | 1,489 (5.7%) | 1,392 (5.3%) |
| $50,000 to $54,999 | 830 (3.2%) | 1,125 (4.3%) |
| $55,000 to $64,999 | 1,645 (6.3%) | 1,765 (6.7%) |
| $65,000 to $74,999 | 1,084 (4.1%) | 1,414 (5.4%) |
| $75,000 to $99,999 | 1,821 (7.0%) | 1,418 (5.4%) |
| $100,000+ | 4,226 (16.2%) | 2,347 (8.9%) |
| Total | 26,163 (100.0%) | 26,341 (100.0%) |
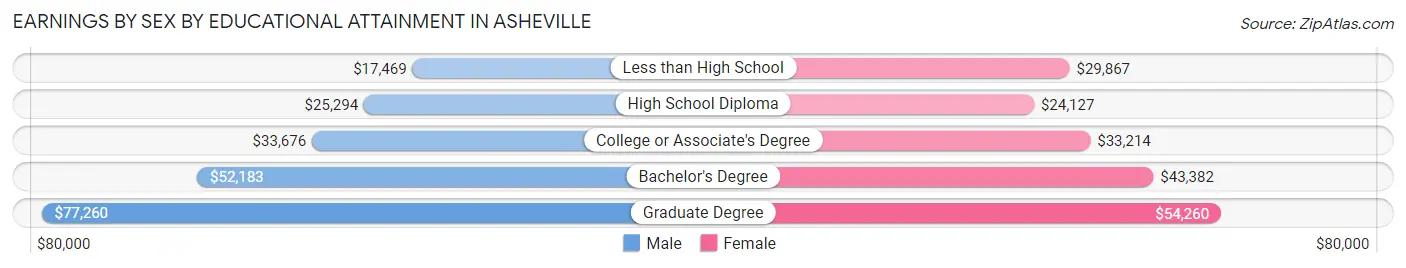
Earnings by Sex by Educational Attainment in Asheville
Average earnings in Asheville are $41,961 for men and $39,441 for women, a difference of 6.0%. Men with an educational attainment of graduate degree enjoy the highest average annual earnings of $77,260, while those with less than high school education earn the least with $17,469. Women with an educational attainment of graduate degree earn the most with the average annual earnings of $54,260, while those with high school diploma education have the smallest earnings of $24,127.
| Educational Attainment | Male Income | Female Income |
| Less than High School | $17,469 | $29,867 |
| High School Diploma | $25,294 | $24,127 |
| College or Associate's Degree | $33,676 | $33,214 |
| Bachelor's Degree | $52,183 | $43,382 |
| Graduate Degree | $77,260 | $54,260 |
| Total | $41,961 | $39,441 |
Family Income in Asheville
Family Income Brackets in Asheville
According to the Asheville family income data, there are 3,488 families falling into the $100,000 to $149,999 income range, which is the most common income bracket and makes up 19.2% of all families. Conversely, the $10,000 to $14,999 income bracket is the least frequent group with only 254 families (1.4%) belonging to this category.
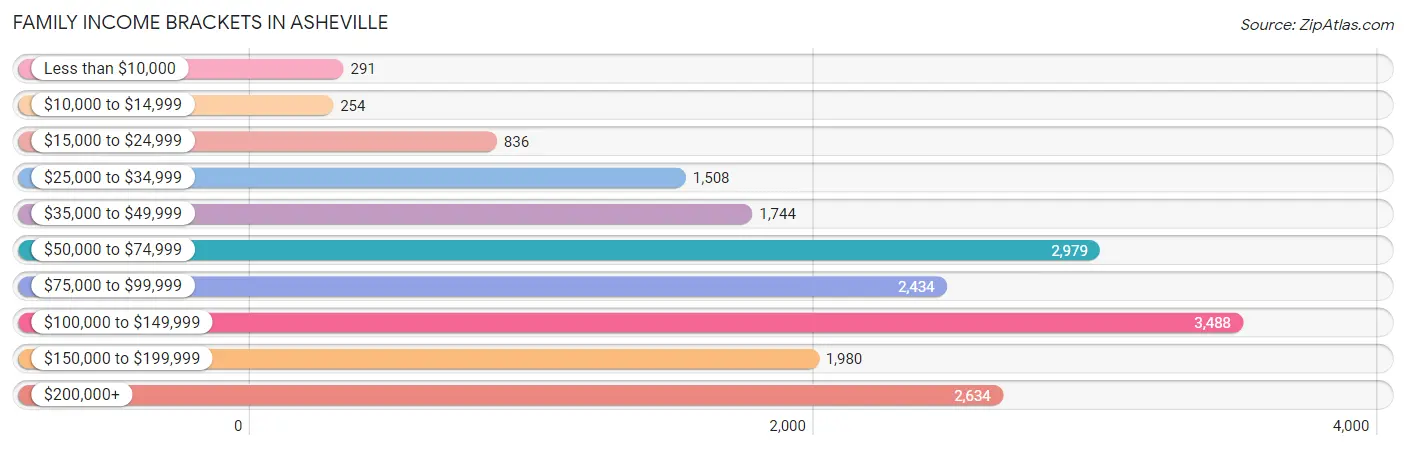
| Income Bracket | # Families | % Families |
| Less than $10,000 | 291 | 1.6% |
| $10,000 to $14,999 | 254 | 1.4% |
| $15,000 to $24,999 | 836 | 4.6% |
| $25,000 to $34,999 | 1,508 | 8.3% |
| $35,000 to $49,999 | 1,744 | 9.6% |
| $50,000 to $74,999 | 2,979 | 16.4% |
| $75,000 to $99,999 | 2,434 | 13.4% |
| $100,000 to $149,999 | 3,488 | 19.2% |
| $150,000 to $199,999 | 1,980 | 10.9% |
| $200,000+ | 2,634 | 14.5% |
Family Income by Famaliy Size in Asheville
4-person families (2,942 | 16.2%) account for the highest median family income in Asheville with $102,500 per family, while 2-person families (10,116 | 55.7%) have the highest median income of $42,930 per family member.
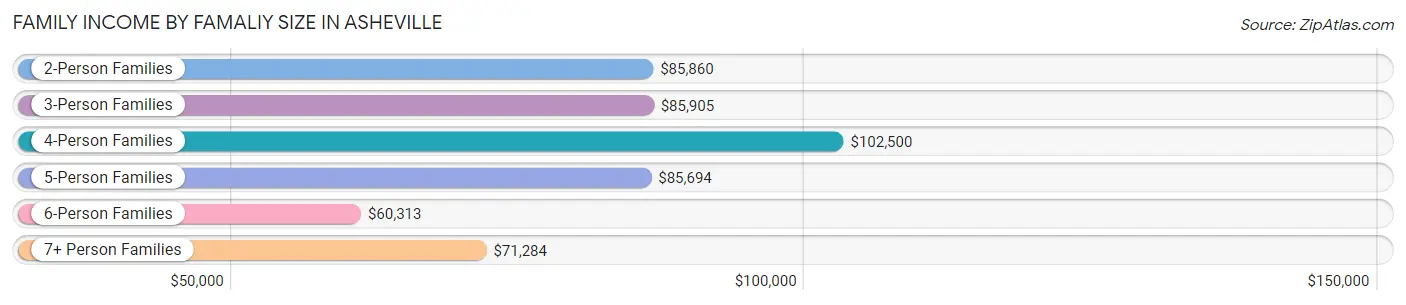
| Income Bracket | # Families | Median Income |
| 2-Person Families | 10,116 (55.7%) | $85,860 |
| 3-Person Families | 4,045 (22.3%) | $85,905 |
| 4-Person Families | 2,942 (16.2%) | $102,500 |
| 5-Person Families | 794 (4.4%) | $85,694 |
| 6-Person Families | 181 (1.0%) | $60,313 |
| 7+ Person Families | 88 (0.5%) | $71,284 |
| Total | 18,166 (100.0%) | $87,626 |
Family Income by Number of Earners in Asheville
The median family income in Asheville is $87,626, with families comprising 3+ earners (1,153) having the highest median family income of $127,813, while families with 1 earner (5,889) have the lowest median family income of $58,242, accounting for 6.4% and 32.4% of families, respectively.
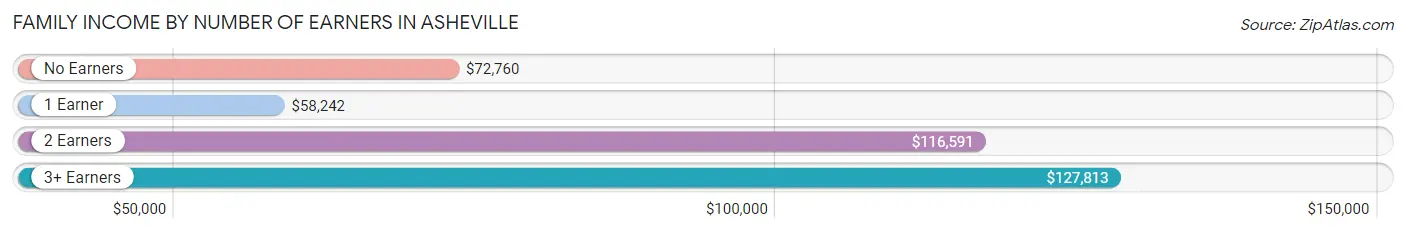
| Number of Earners | # Families | Median Income |
| No Earners | 3,272 (18.0%) | $72,760 |
| 1 Earner | 5,889 (32.4%) | $58,242 |
| 2 Earners | 7,852 (43.2%) | $116,591 |
| 3+ Earners | 1,153 (6.4%) | $127,813 |
| Total | 18,166 (100.0%) | $87,626 |
Household Income in Asheville
Household Income Brackets in Asheville
With 6,728 households falling in the category, the $50,000 to $74,999 income range is the most frequent in Asheville, accounting for 17.6% of all households. In contrast, only 1,873 households (4.9%) fall into the $10,000 to $14,999 income bracket, making it the least populous group.
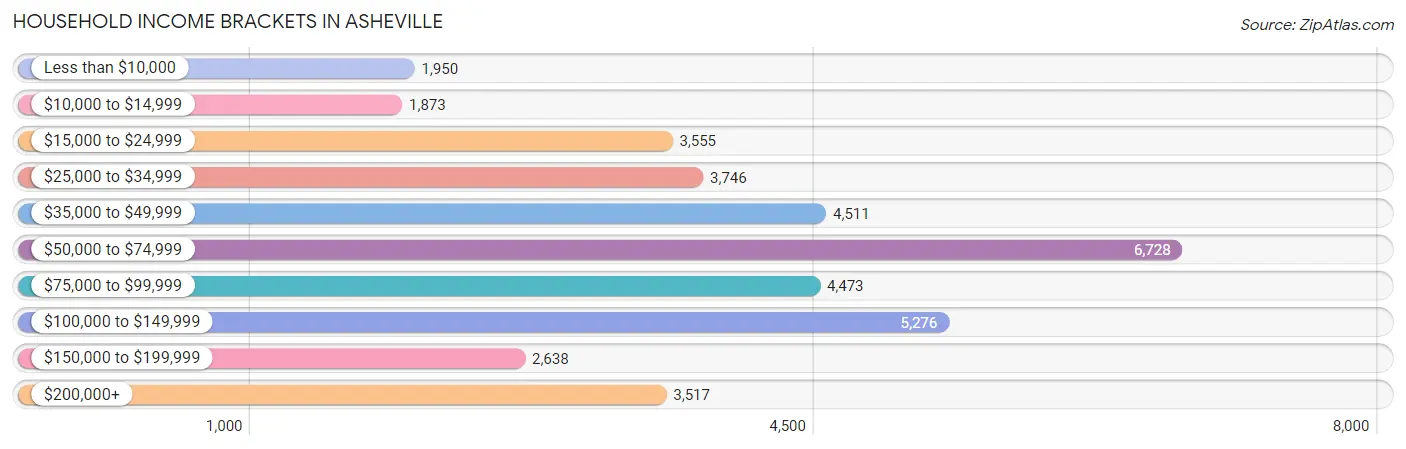
| Income Bracket | # Households | % Households |
| Less than $10,000 | 1,950 | 5.1% |
| $10,000 to $14,999 | 1,873 | 4.9% |
| $15,000 to $24,999 | 3,555 | 9.3% |
| $25,000 to $34,999 | 3,746 | 9.8% |
| $35,000 to $49,999 | 4,511 | 11.8% |
| $50,000 to $74,999 | 6,728 | 17.6% |
| $75,000 to $99,999 | 4,473 | 11.7% |
| $100,000 to $149,999 | 5,276 | 13.8% |
| $150,000 to $199,999 | 2,638 | 6.9% |
| $200,000+ | 3,517 | 9.2% |
Household Income by Householder Age in Asheville
The median household income in Asheville is $63,810, with the highest median household income of $71,114 found in the 45 to 64 years age bracket for the primary householder. A total of 11,988 households (31.4%) fall into this category. Meanwhile, the 15 to 24 years age bracket for the primary householder has the lowest median household income of $37,716, with 1,228 households (3.2%) in this group.
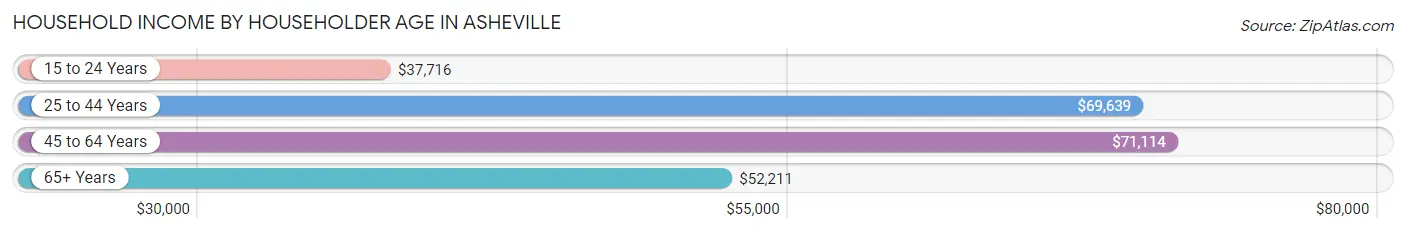
| Income Bracket | # Households | Median Income |
| 15 to 24 Years | 1,228 (3.2%) | $37,716 |
| 25 to 44 Years | 13,265 (34.7%) | $69,639 |
| 45 to 64 Years | 11,988 (31.4%) | $71,114 |
| 65+ Years | 11,748 (30.7%) | $52,211 |
| Total | 38,229 (100.0%) | $63,810 |
Poverty in Asheville
Income Below Poverty by Sex and Age in Asheville
With 12.1% poverty level for males and 14.4% for females among the residents of Asheville, 18 to 24 year old males and 18 to 24 year old females are the most vulnerable to poverty, with 638 males (26.7%) and 1,009 females (31.4%) in their respective age groups living below the poverty level.
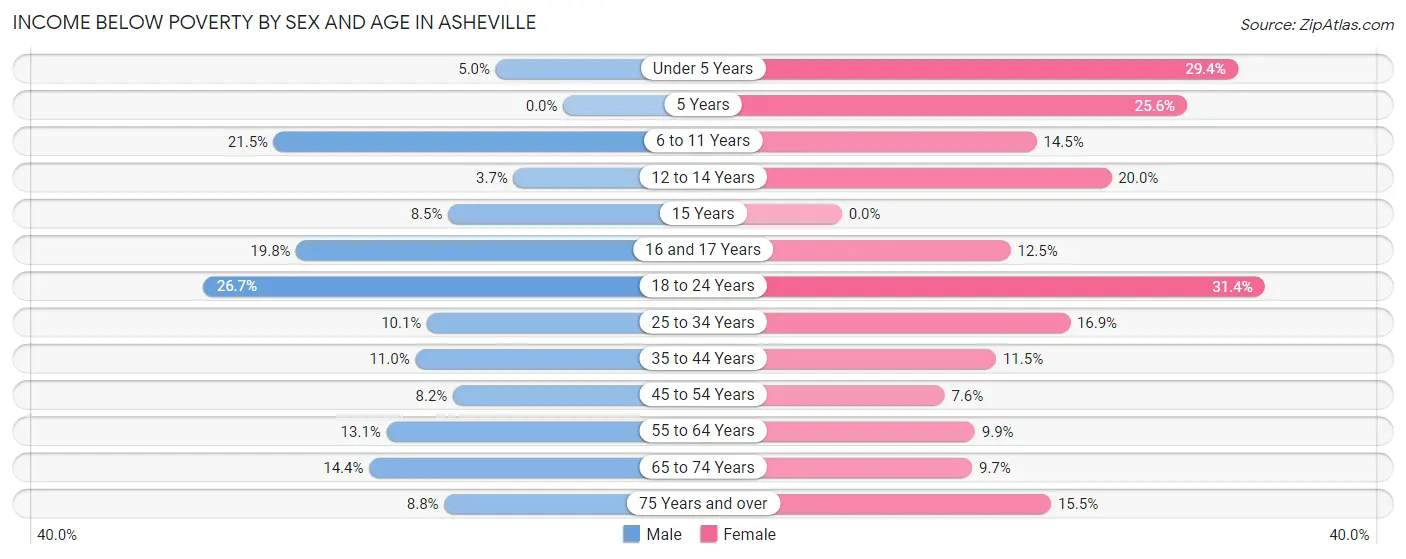
| Age Bracket | Male | Female |
| Under 5 Years | 104 (5.0%) | 578 (29.4%) |
| 5 Years | 0 (0.0%) | 124 (25.6%) |
| 6 to 11 Years | 711 (21.5%) | 329 (14.5%) |
| 12 to 14 Years | 47 (3.7%) | 193 (20.0%) |
| 15 Years | 49 (8.5%) | 0 (0.0%) |
| 16 and 17 Years | 151 (19.8%) | 104 (12.5%) |
| 18 to 24 Years | 638 (26.7%) | 1,009 (31.4%) |
| 25 to 34 Years | 838 (10.1%) | 1,387 (16.9%) |
| 35 to 44 Years | 731 (11.0%) | 763 (11.5%) |
| 45 to 54 Years | 470 (8.2%) | 485 (7.6%) |
| 55 to 64 Years | 650 (13.1%) | 538 (9.9%) |
| 65 to 74 Years | 660 (14.4%) | 519 (9.7%) |
| 75 Years and over | 239 (8.8%) | 725 (15.5%) |
| Total | 5,288 (12.1%) | 6,754 (14.4%) |
Income Above Poverty by Sex and Age in Asheville
According to the poverty statistics in Asheville, males aged 5 years and females aged 15 years are the age groups that are most secure financially, with 100.0% of males and 100.0% of females in these age groups living above the poverty line.
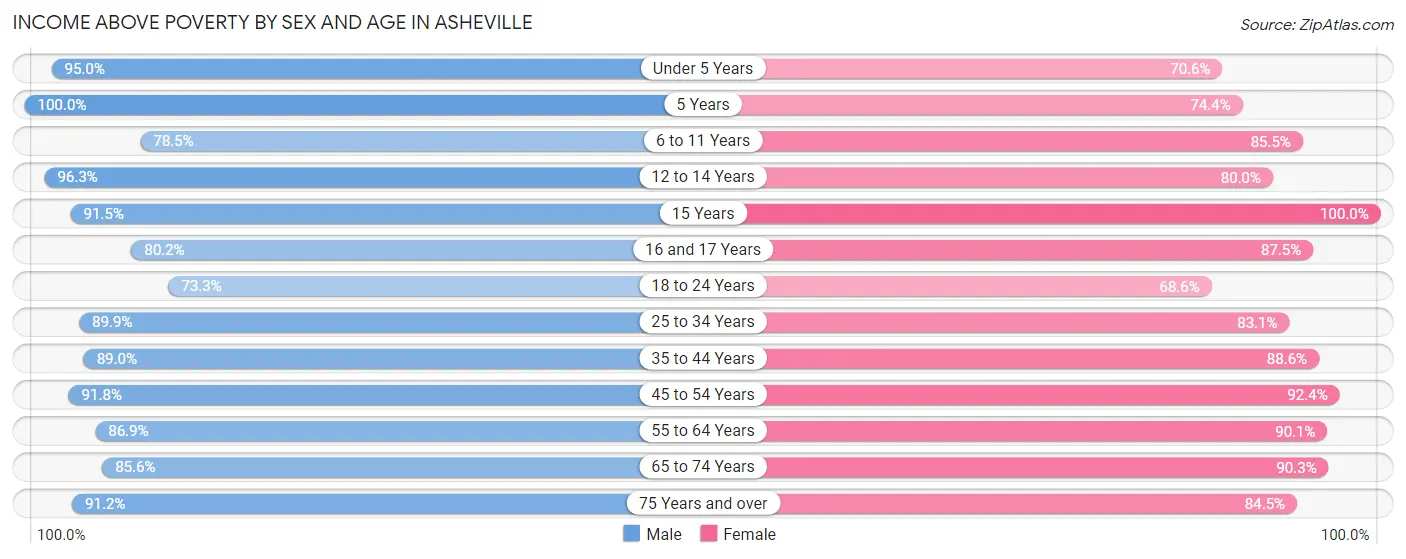
| Age Bracket | Male | Female |
| Under 5 Years | 1,972 (95.0%) | 1,389 (70.6%) |
| 5 Years | 242 (100.0%) | 360 (74.4%) |
| 6 to 11 Years | 2,597 (78.5%) | 1,947 (85.5%) |
| 12 to 14 Years | 1,225 (96.3%) | 772 (80.0%) |
| 15 Years | 525 (91.5%) | 436 (100.0%) |
| 16 and 17 Years | 611 (80.2%) | 726 (87.5%) |
| 18 to 24 Years | 1,752 (73.3%) | 2,206 (68.6%) |
| 25 to 34 Years | 7,451 (89.9%) | 6,800 (83.1%) |
| 35 to 44 Years | 5,929 (89.0%) | 5,899 (88.5%) |
| 45 to 54 Years | 5,279 (91.8%) | 5,868 (92.4%) |
| 55 to 64 Years | 4,305 (86.9%) | 4,907 (90.1%) |
| 65 to 74 Years | 3,919 (85.6%) | 4,850 (90.3%) |
| 75 Years and over | 2,468 (91.2%) | 3,944 (84.5%) |
| Total | 38,275 (87.9%) | 40,104 (85.6%) |
Income Below Poverty Among Married-Couple Families in Asheville
The poverty statistics for married-couple families in Asheville show that 3.5% or 483 of the total 13,653 families live below the poverty line. Families with 3 or 4 children have the highest poverty rate of 14.8%, comprising of 73 families. On the other hand, families with 5 or more children have the lowest poverty rate of 0.0%, which includes 0 families.
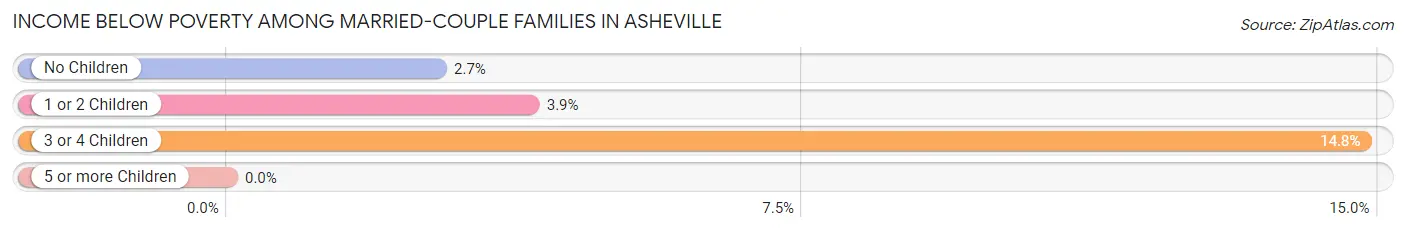
| Children | Above Poverty | Below Poverty |
| No Children | 8,617 (97.3%) | 242 (2.7%) |
| 1 or 2 Children | 4,096 (96.1%) | 168 (3.9%) |
| 3 or 4 Children | 420 (85.2%) | 73 (14.8%) |
| 5 or more Children | 37 (100.0%) | 0 (0.0%) |
| Total | 13,170 (96.5%) | 483 (3.5%) |
Income Below Poverty Among Single-Parent Households in Asheville
According to the poverty data in Asheville, 3.9% or 36 single-father households and 22.5% or 807 single-mother households are living below the poverty line. Among single-father households, those with 3 or 4 children have the highest poverty rate, with 12 households (14.1%) experiencing poverty. Likewise, among single-mother households, those with 5 or more children have the highest poverty rate, with 25 households (100.0%) falling below the poverty line.
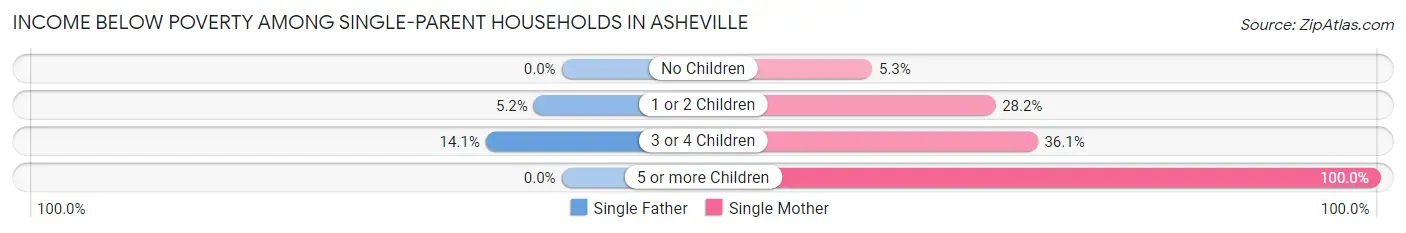
| Children | Single Father | Single Mother |
| No Children | 0 (0.0%) | 56 (5.3%) |
| 1 or 2 Children | 24 (5.2%) | 639 (28.2%) |
| 3 or 4 Children | 12 (14.1%) | 87 (36.1%) |
| 5 or more Children | 0 (0.0%) | 25 (100.0%) |
| Total | 36 (3.9%) | 807 (22.5%) |
Income Below Poverty Among Married-Couple vs Single-Parent Households in Asheville
The poverty data for Asheville shows that 483 of the married-couple family households (3.5%) and 843 of the single-parent households (18.7%) are living below the poverty level. Within the married-couple family households, those with 3 or 4 children have the highest poverty rate, with 73 households (14.8%) falling below the poverty line. Among the single-parent households, those with 5 or more children have the highest poverty rate, with 25 household (100.0%) living below poverty.
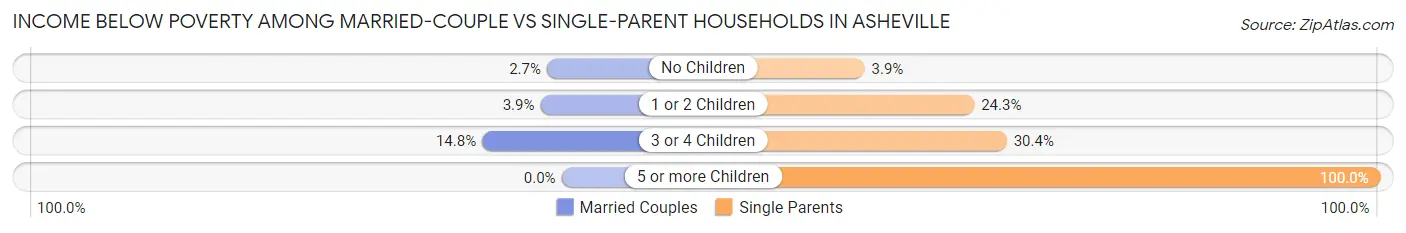
| Children | Married-Couple Families | Single-Parent Households |
| No Children | 242 (2.7%) | 56 (3.9%) |
| 1 or 2 Children | 168 (3.9%) | 663 (24.3%) |
| 3 or 4 Children | 73 (14.8%) | 99 (30.4%) |
| 5 or more Children | 0 (0.0%) | 25 (100.0%) |
| Total | 483 (3.5%) | 843 (18.7%) |
Race in Asheville
The most populous races in Asheville are White / Caucasian (75,784 | 80.9%), Black / African American (9,735 | 10.4%), and Hispanic or Latino (5,771 | 6.2%).
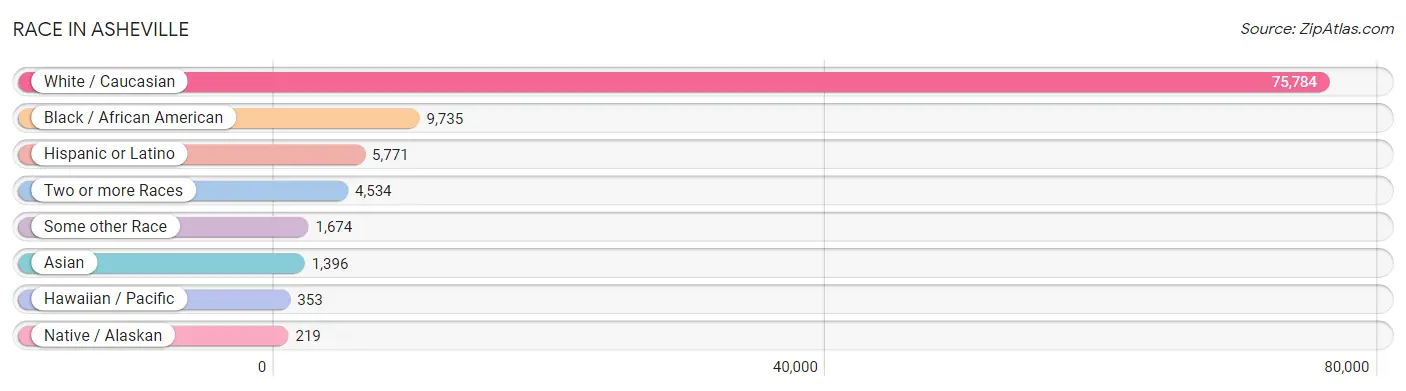
| Race | # Population | % Population |
| Asian | 1,396 | 1.5% |
| Black / African American | 9,735 | 10.4% |
| Hawaiian / Pacific | 353 | 0.4% |
| Hispanic or Latino | 5,771 | 6.2% |
| Native / Alaskan | 219 | 0.2% |
| White / Caucasian | 75,784 | 80.9% |
| Two or more Races | 4,534 | 4.8% |
| Some other Race | 1,674 | 1.8% |
| Total | 93,695 | 100.0% |
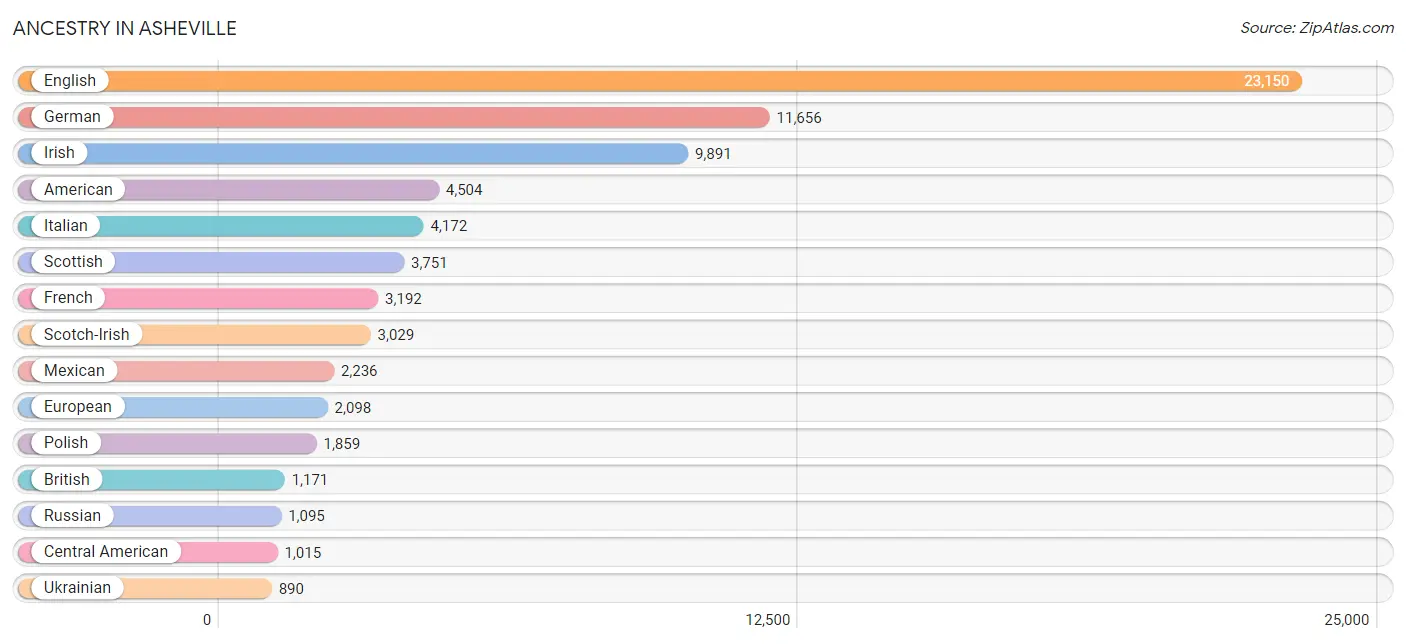
Ancestry in Asheville
The most populous ancestries reported in Asheville are English (23,150 | 24.7%), German (11,656 | 12.4%), Irish (9,891 | 10.6%), American (4,504 | 4.8%), and Italian (4,172 | 4.4%), together accounting for 57.0% of all Asheville residents.
| Ancestry | # Population | % Population |
| African | 91 | 0.1% |
| Albanian | 37 | 0.0% |
| American | 4,504 | 4.8% |
| Apache | 14 | 0.0% |
| Arab | 441 | 0.5% |
| Argentinean | 150 | 0.2% |
| Armenian | 67 | 0.1% |
| Austrian | 456 | 0.5% |
| Barbadian | 5 | 0.0% |
| Belgian | 62 | 0.1% |
| Bhutanese | 364 | 0.4% |
| Blackfeet | 6 | 0.0% |
| Brazilian | 56 | 0.1% |
| British | 1,171 | 1.3% |
| Bulgarian | 3 | 0.0% |
| Burmese | 574 | 0.6% |
| Canadian | 28 | 0.0% |
| Carpatho Rusyn | 38 | 0.0% |
| Celtic | 21 | 0.0% |
| Central American | 1,015 | 1.1% |
| Central American Indian | 9 | 0.0% |
| Cherokee | 337 | 0.4% |
| Choctaw | 14 | 0.0% |
| Colombian | 138 | 0.2% |
| Costa Rican | 44 | 0.1% |
| Creek | 35 | 0.0% |
| Croatian | 51 | 0.1% |
| Cuban | 488 | 0.5% |
| Czech | 413 | 0.4% |
| Czechoslovakian | 59 | 0.1% |
| Danish | 261 | 0.3% |
| Dominican | 342 | 0.4% |
| Dutch | 666 | 0.7% |
| Eastern European | 398 | 0.4% |
| Ecuadorian | 96 | 0.1% |
| Egyptian | 35 | 0.0% |
| English | 23,150 | 24.7% |
| Ethiopian | 9 | 0.0% |
| European | 2,098 | 2.2% |
| Fijian | 283 | 0.3% |
| Filipino | 6 | 0.0% |
| Finnish | 55 | 0.1% |
| French | 3,192 | 3.4% |
| French Canadian | 335 | 0.4% |
| German | 11,656 | 12.4% |
| German Russian | 18 | 0.0% |
| Greek | 869 | 0.9% |
| Guamanian / Chamorro | 147 | 0.2% |
| Guatemalan | 405 | 0.4% |
| Haitian | 15 | 0.0% |
| Honduran | 346 | 0.4% |
| Hungarian | 363 | 0.4% |
| Icelander | 57 | 0.1% |
| Indian (Asian) | 315 | 0.3% |
| Inupiat | 2 | 0.0% |
| Iranian | 10 | 0.0% |
| Irish | 9,891 | 10.6% |
| Iroquois | 2 | 0.0% |
| Israeli | 31 | 0.0% |
| Italian | 4,172 | 4.4% |
| Jamaican | 302 | 0.3% |
| Japanese | 20 | 0.0% |
| Jordanian | 76 | 0.1% |
| Korean | 229 | 0.2% |
| Laotian | 14 | 0.0% |
| Lebanese | 246 | 0.3% |
| Lithuanian | 267 | 0.3% |
| Lumbee | 144 | 0.2% |
| Mexican | 2,236 | 2.4% |
| Mexican American Indian | 39 | 0.0% |
| Native Hawaiian | 115 | 0.1% |
| Navajo | 11 | 0.0% |
| Nicaraguan | 71 | 0.1% |
| Nigerian | 36 | 0.0% |
| Northern European | 147 | 0.2% |
| Norwegian | 828 | 0.9% |
| Pakistani | 32 | 0.0% |
| Palestinian | 53 | 0.1% |
| Pennsylvania German | 15 | 0.0% |
| Peruvian | 26 | 0.0% |
| Polish | 1,859 | 2.0% |
| Portuguese | 257 | 0.3% |
| Puerto Rican | 719 | 0.8% |
| Romanian | 517 | 0.5% |
| Russian | 1,095 | 1.2% |
| Salvadoran | 149 | 0.2% |
| Samoan | 26 | 0.0% |
| Scandinavian | 260 | 0.3% |
| Scotch-Irish | 3,029 | 3.2% |
| Scottish | 3,751 | 4.0% |
| Serbian | 25 | 0.0% |
| Slavic | 315 | 0.3% |
| Slovak | 72 | 0.1% |
| Slovene | 16 | 0.0% |
| South African | 43 | 0.1% |
| South American | 658 | 0.7% |
| Spaniard | 138 | 0.2% |
| Spanish | 68 | 0.1% |
| Sri Lankan | 46 | 0.1% |
| Subsaharan African | 210 | 0.2% |
| Swedish | 608 | 0.6% |
| Swiss | 218 | 0.2% |
| Syrian | 9 | 0.0% |
| Thai | 481 | 0.5% |
| Turkish | 22 | 0.0% |
| U.S. Virgin Islander | 24 | 0.0% |
| Ukrainian | 890 | 0.9% |
| Venezuelan | 248 | 0.3% |
| Welsh | 801 | 0.9% |
| West Indian | 8 | 0.0% |
| Yugoslavian | 22 | 0.0% | View All 111 Rows |
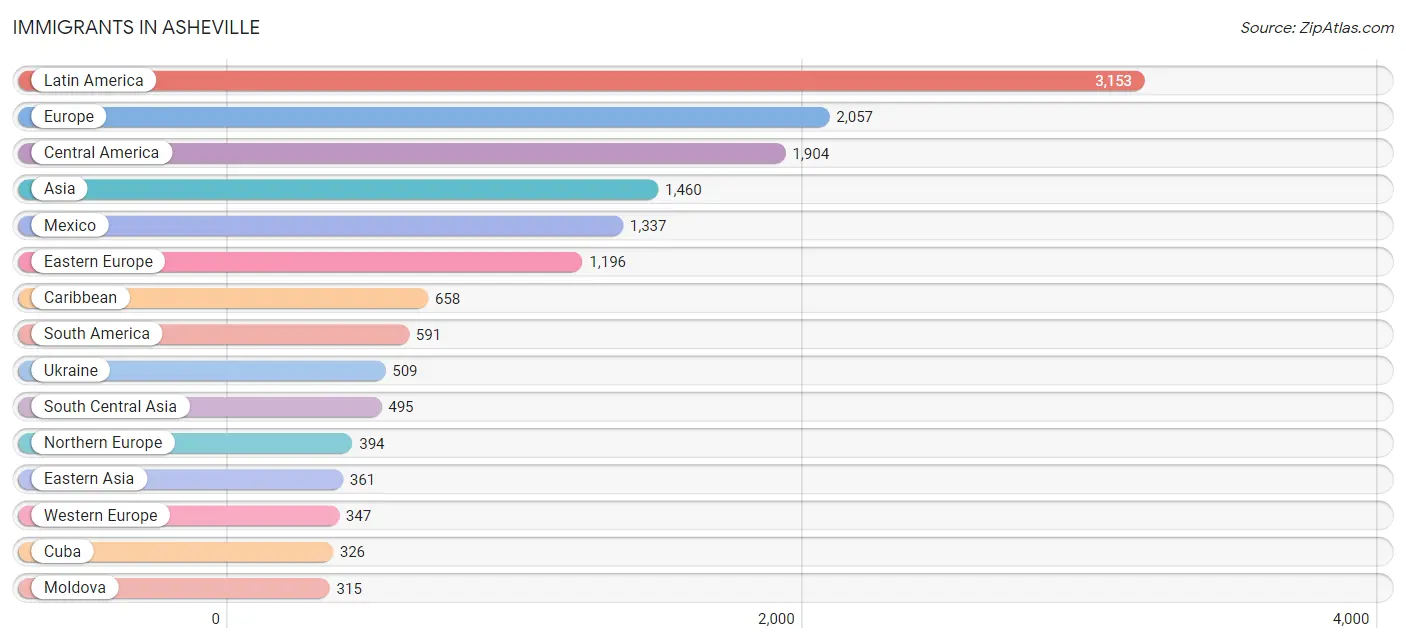
Immigrants in Asheville
The most numerous immigrant groups reported in Asheville came from Latin America (3,153 | 3.4%), Europe (2,057 | 2.2%), Central America (1,904 | 2.0%), Asia (1,460 | 1.6%), and Mexico (1,337 | 1.4%), together accounting for 10.6% of all Asheville residents.
| Immigration Origin | # Population | % Population |
| Africa | 183 | 0.2% |
| Argentina | 62 | 0.1% |
| Asia | 1,460 | 1.6% |
| Belarus | 34 | 0.0% |
| Belgium | 30 | 0.0% |
| Brazil | 192 | 0.2% |
| Bulgaria | 3 | 0.0% |
| Cambodia | 20 | 0.0% |
| Canada | 262 | 0.3% |
| Caribbean | 658 | 0.7% |
| Central America | 1,904 | 2.0% |
| Chile | 11 | 0.0% |
| China | 207 | 0.2% |
| Colombia | 110 | 0.1% |
| Costa Rica | 20 | 0.0% |
| Croatia | 16 | 0.0% |
| Cuba | 326 | 0.4% |
| Czechoslovakia | 9 | 0.0% |
| Dominican Republic | 160 | 0.2% |
| Eastern Africa | 23 | 0.0% |
| Eastern Asia | 361 | 0.4% |
| Eastern Europe | 1,196 | 1.3% |
| Ecuador | 27 | 0.0% |
| El Salvador | 72 | 0.1% |
| England | 57 | 0.1% |
| Ethiopia | 9 | 0.0% |
| Europe | 2,057 | 2.2% |
| Fiji | 8 | 0.0% |
| France | 86 | 0.1% |
| Germany | 224 | 0.2% |
| Ghana | 5 | 0.0% |
| Greece | 3 | 0.0% |
| Guatemala | 123 | 0.1% |
| Honduras | 311 | 0.3% |
| Hong Kong | 17 | 0.0% |
| Hungary | 94 | 0.1% |
| India | 170 | 0.2% |
| Indonesia | 14 | 0.0% |
| Iran | 10 | 0.0% |
| Ireland | 26 | 0.0% |
| Italy | 74 | 0.1% |
| Jamaica | 172 | 0.2% |
| Japan | 75 | 0.1% |
| Jordan | 35 | 0.0% |
| Kazakhstan | 43 | 0.1% |
| Korea | 79 | 0.1% |
| Kuwait | 87 | 0.1% |
| Latin America | 3,153 | 3.4% |
| Lebanon | 48 | 0.1% |
| Mexico | 1,337 | 1.4% |
| Moldova | 315 | 0.3% |
| Nicaragua | 41 | 0.0% |
| Nigeria | 36 | 0.0% |
| Northern Africa | 21 | 0.0% |
| Northern Europe | 394 | 0.4% |
| Oceania | 34 | 0.0% |
| Pakistan | 39 | 0.0% |
| Philippines | 219 | 0.2% |
| Poland | 15 | 0.0% |
| Romania | 67 | 0.1% |
| Russia | 58 | 0.1% |
| Saudi Arabia | 40 | 0.0% |
| Scotland | 43 | 0.1% |
| Singapore | 8 | 0.0% |
| South Africa | 91 | 0.1% |
| South America | 591 | 0.6% |
| South Central Asia | 495 | 0.5% |
| South Eastern Asia | 314 | 0.3% |
| Southern Europe | 120 | 0.1% |
| Spain | 43 | 0.1% |
| Sweden | 44 | 0.1% |
| Switzerland | 7 | 0.0% |
| Thailand | 4 | 0.0% |
| Turkey | 22 | 0.0% |
| Ukraine | 509 | 0.5% |
| Uzbekistan | 233 | 0.3% |
| Venezuela | 189 | 0.2% |
| Vietnam | 49 | 0.1% |
| Western Africa | 41 | 0.0% |
| Western Asia | 290 | 0.3% |
| Western Europe | 347 | 0.4% |
| Zimbabwe | 14 | 0.0% | View All 82 Rows |
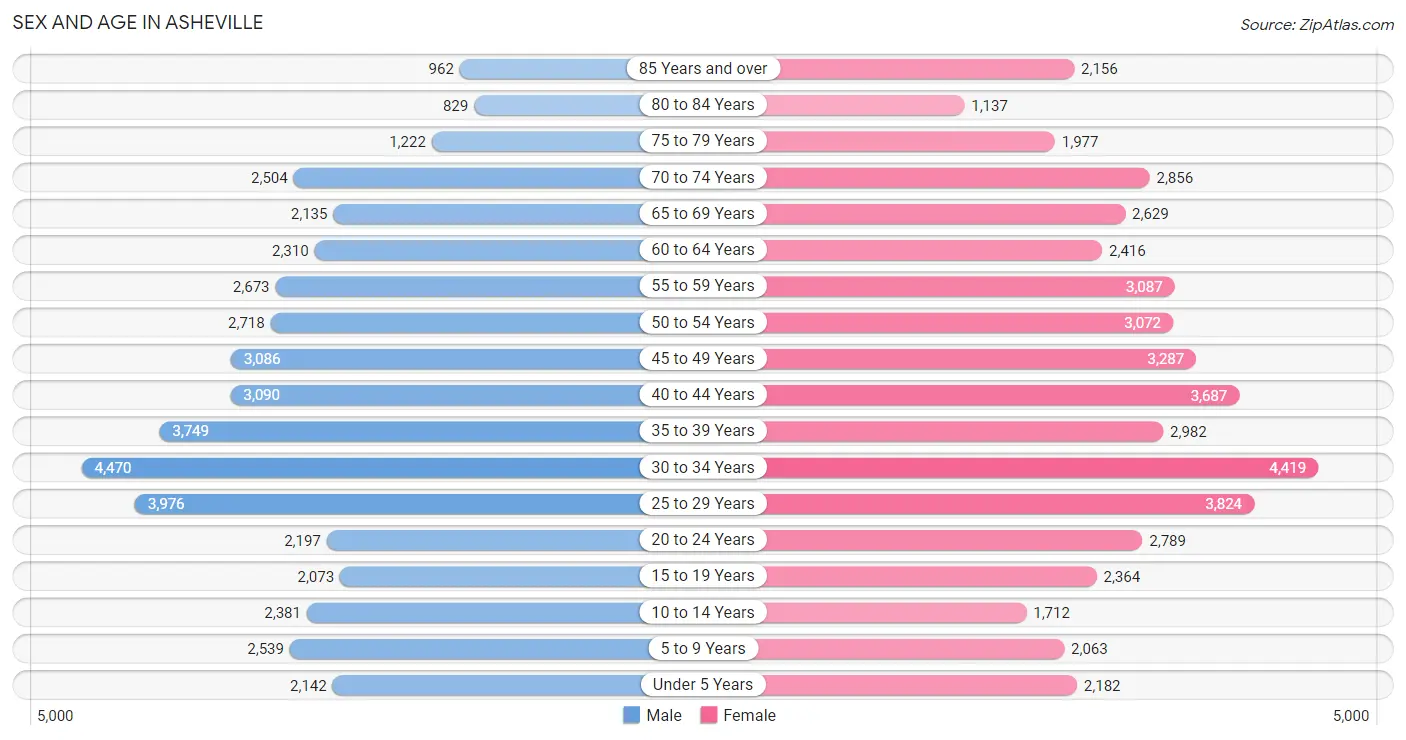
Sex and Age in Asheville
Sex and Age in Asheville
The most populous age groups in Asheville are 30 to 34 Years (4,470 | 9.9%) for men and 30 to 34 Years (4,419 | 9.1%) for women.
| Age Bracket | Male | Female |
| Under 5 Years | 2,142 (4.8%) | 2,182 (4.5%) |
| 5 to 9 Years | 2,539 (5.6%) | 2,063 (4.2%) |
| 10 to 14 Years | 2,381 (5.3%) | 1,712 (3.5%) |
| 15 to 19 Years | 2,073 (4.6%) | 2,364 (4.9%) |
| 20 to 24 Years | 2,197 (4.9%) | 2,789 (5.7%) |
| 25 to 29 Years | 3,976 (8.8%) | 3,824 (7.9%) |
| 30 to 34 Years | 4,470 (9.9%) | 4,419 (9.1%) |
| 35 to 39 Years | 3,749 (8.3%) | 2,982 (6.1%) |
| 40 to 44 Years | 3,090 (6.9%) | 3,687 (7.6%) |
| 45 to 49 Years | 3,086 (6.9%) | 3,287 (6.8%) |
| 50 to 54 Years | 2,718 (6.0%) | 3,072 (6.3%) |
| 55 to 59 Years | 2,673 (5.9%) | 3,087 (6.4%) |
| 60 to 64 Years | 2,310 (5.1%) | 2,416 (5.0%) |
| 65 to 69 Years | 2,135 (4.7%) | 2,629 (5.4%) |
| 70 to 74 Years | 2,504 (5.6%) | 2,856 (5.9%) |
| 75 to 79 Years | 1,222 (2.7%) | 1,977 (4.1%) |
| 80 to 84 Years | 829 (1.8%) | 1,137 (2.3%) |
| 85 Years and over | 962 (2.1%) | 2,156 (4.4%) |
| Total | 45,056 (100.0%) | 48,639 (100.0%) |
Families and Households in Asheville
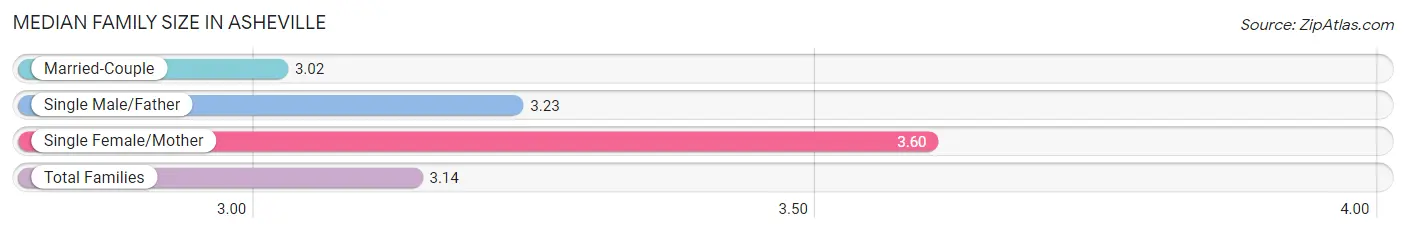
Median Family Size in Asheville
The median family size in Asheville is 3.14 persons per family, with single female/mother families (3,590 | 19.8%) accounting for the largest median family size of 3.6 persons per family. On the other hand, married-couple families (13,653 | 75.2%) represent the smallest median family size with 3.02 persons per family.
| Family Type | # Families | Family Size |
| Married-Couple | 13,653 (75.2%) | 3.02 |
| Single Male/Father | 923 (5.1%) | 3.23 |
| Single Female/Mother | 3,590 (19.8%) | 3.60 |
| Total Families | 18,166 (100.0%) | 3.14 |
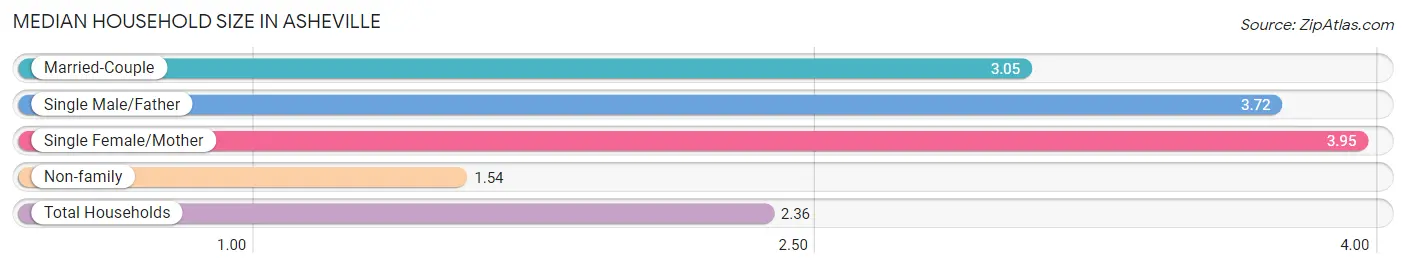
Median Household Size in Asheville
The median household size in Asheville is 2.36 persons per household, with single female/mother households (3,590 | 9.4%) accounting for the largest median household size of 3.95 persons per household. non-family households (20,063 | 52.5%) represent the smallest median household size with 1.54 persons per household.
| Household Type | # Households | Household Size |
| Married-Couple | 13,653 (35.7%) | 3.05 |
| Single Male/Father | 923 (2.4%) | 3.72 |
| Single Female/Mother | 3,590 (9.4%) | 3.95 |
| Non-family | 20,063 (52.5%) | 1.54 |
| Total Households | 38,229 (100.0%) | 2.36 |
Household Size by Marriage Status in Asheville
Out of a total of 38,229 households in Asheville, 18,166 (47.5%) are family households, while 20,063 (52.5%) are nonfamily households. The most numerous type of family households are 2-person households, comprising 9,478, and the most common type of nonfamily households are 1-person households, comprising 15,145.
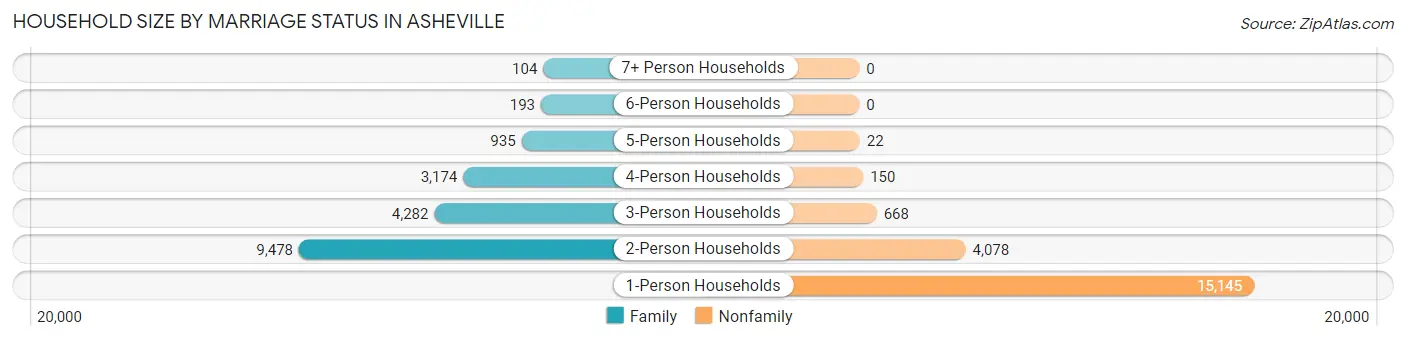
| Household Size | Family Households | Nonfamily Households |
| 1-Person Households | - | 15,145 (39.6%) |
| 2-Person Households | 9,478 (24.8%) | 4,078 (10.7%) |
| 3-Person Households | 4,282 (11.2%) | 668 (1.8%) |
| 4-Person Households | 3,174 (8.3%) | 150 (0.4%) |
| 5-Person Households | 935 (2.5%) | 22 (0.1%) |
| 6-Person Households | 193 (0.5%) | 0 (0.0%) |
| 7+ Person Households | 104 (0.3%) | 0 (0.0%) |
| Total | 18,166 (47.5%) | 20,063 (52.5%) |
Female Fertility in Asheville
Fertility by Age in Asheville
Average fertility rate in Asheville is 39.0 births per 1,000 women. Women in the age bracket of 20 to 34 years have the highest fertility rate with 60.0 births per 1,000 women. Women in the age bracket of 20 to 34 years acount for 71.3% of all women with births.
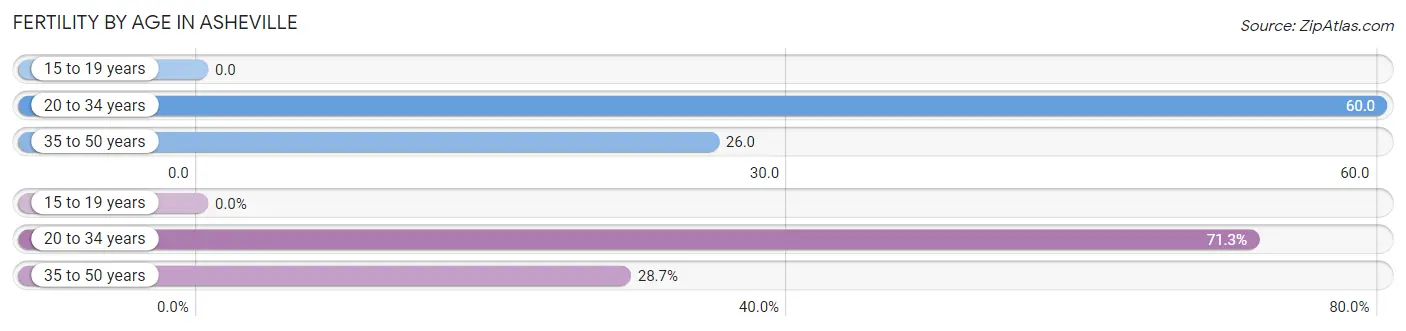
| Age Bracket | Women with Births | Births / 1,000 Women |
| 15 to 19 years | 0 (0.0%) | 0.0 |
| 20 to 34 years | 661 (71.3%) | 60.0 |
| 35 to 50 years | 266 (28.7%) | 26.0 |
| Total | 927 (100.0%) | 39.0 |
Fertility by Age by Marriage Status in Asheville
56.5% of women with births (927) in Asheville are married. The highest percentage of unmarried women with births falls into 20 to 34 years age bracket with 58.3% of them unmarried at the time of birth, while the lowest percentage of unmarried women with births belong to 35 to 50 years age bracket with 6.8% of them unmarried.
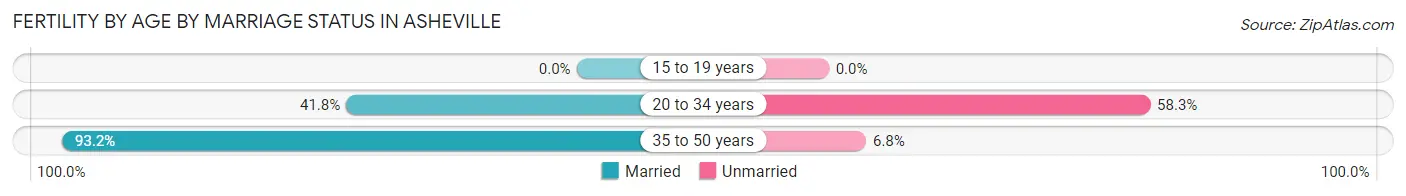
| Age Bracket | Married | Unmarried |
| 15 to 19 years | 0 (0.0%) | 0 (0.0%) |
| 20 to 34 years | 276 (41.7%) | 385 (58.3%) |
| 35 to 50 years | 248 (93.2%) | 18 (6.8%) |
| Total | 524 (56.5%) | 403 (43.5%) |
Fertility by Education in Asheville
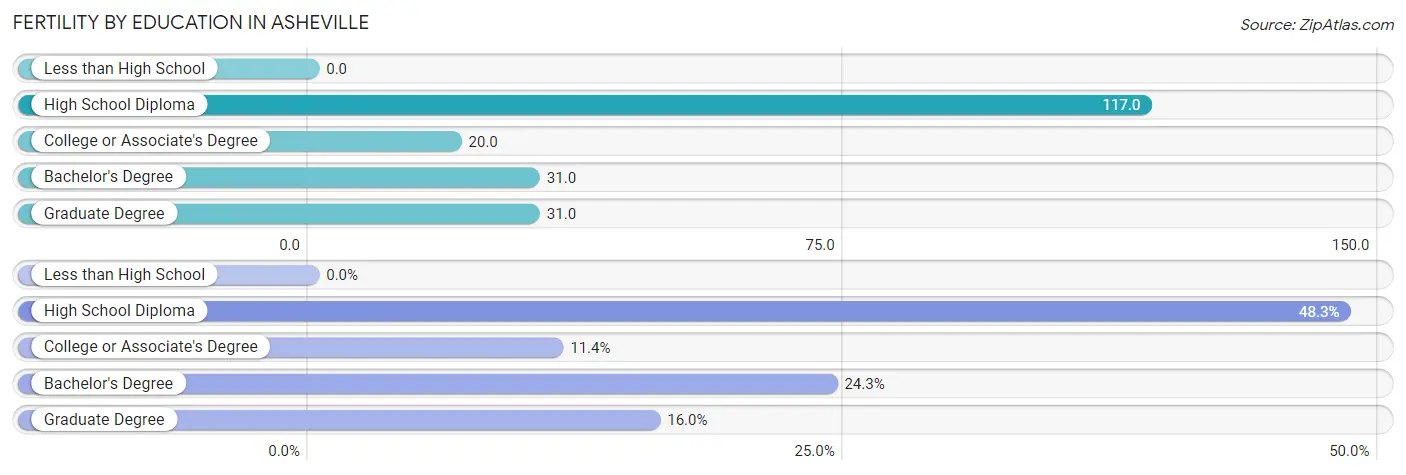
| Educational Attainment | Women with Births | Births / 1,000 Women |
| Less than High School | 0 (0.0%) | 0.0 |
| High School Diploma | 448 (48.3%) | 117.0 |
| College or Associate's Degree | 106 (11.4%) | 20.0 |
| Bachelor's Degree | 225 (24.3%) | 31.0 |
| Graduate Degree | 148 (16.0%) | 31.0 |
| Total | 927 (100.0%) | 39.0 |
Fertility by Education by Marriage Status in Asheville
43.5% of women with births in Asheville are unmarried. Women with the educational attainment of bachelor's degree are most likely to be married with 100.0% of them married at childbirth, while women with the educational attainment of high school diploma are least likely to be married with 77.7% of them unmarried at childbirth.
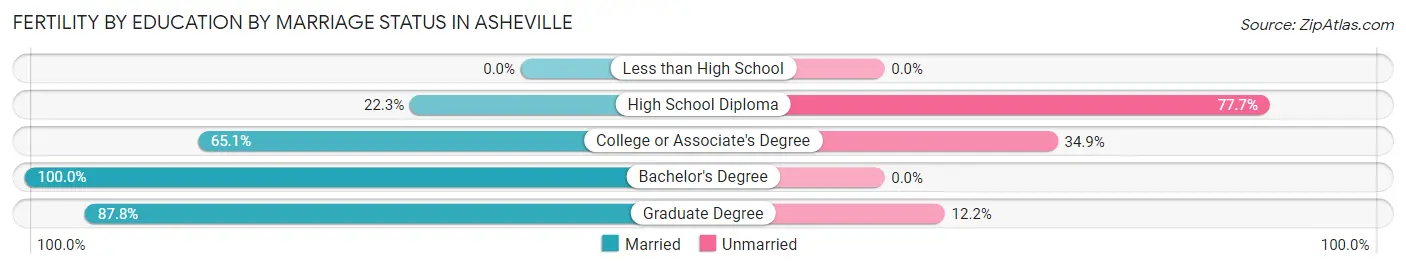
| Educational Attainment | Married | Unmarried |
| Less than High School | 0 (0.0%) | 0 (0.0%) |
| High School Diploma | 100 (22.3%) | 348 (77.7%) |
| College or Associate's Degree | 69 (65.1%) | 37 (34.9%) |
| Bachelor's Degree | 225 (100.0%) | 0 (0.0%) |
| Graduate Degree | 130 (87.8%) | 18 (12.2%) |
| Total | 524 (56.5%) | 403 (43.5%) |
Employment Characteristics in Asheville
Employment by Class of Employer in Asheville
Among the 47,758 employed individuals in Asheville, private company employees (32,074 | 67.2%), self-employed (not incorporated) (3,947 | 8.3%), and not-for-profit organizations (3,430 | 7.2%) make up the most common classes of employment.
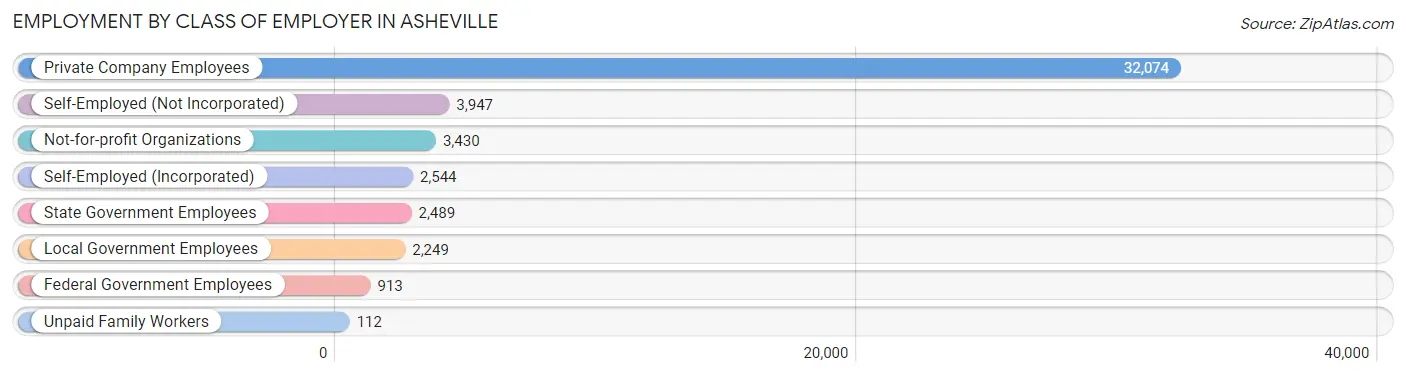
| Employer Class | # Employees | % Employees |
| Private Company Employees | 32,074 | 67.2% |
| Self-Employed (Incorporated) | 2,544 | 5.3% |
| Self-Employed (Not Incorporated) | 3,947 | 8.3% |
| Not-for-profit Organizations | 3,430 | 7.2% |
| Local Government Employees | 2,249 | 4.7% |
| State Government Employees | 2,489 | 5.2% |
| Federal Government Employees | 913 | 1.9% |
| Unpaid Family Workers | 112 | 0.2% |
| Total | 47,758 | 100.0% |
Employment Status by Age in Asheville
According to the labor force statistics for Asheville, out of the total population over 16 years of age (79,658), 63.4% or 50,503 individuals are in the labor force, with 4.1% or 2,071 of them unemployed. The age group with the highest labor force participation rate is 30 to 34 years, with 88.8% or 7,893 individuals in the labor force. Within the labor force, the 16 to 19 years age range has the highest percentage of unemployed individuals, with 18.7% or 309 of them being unemployed.
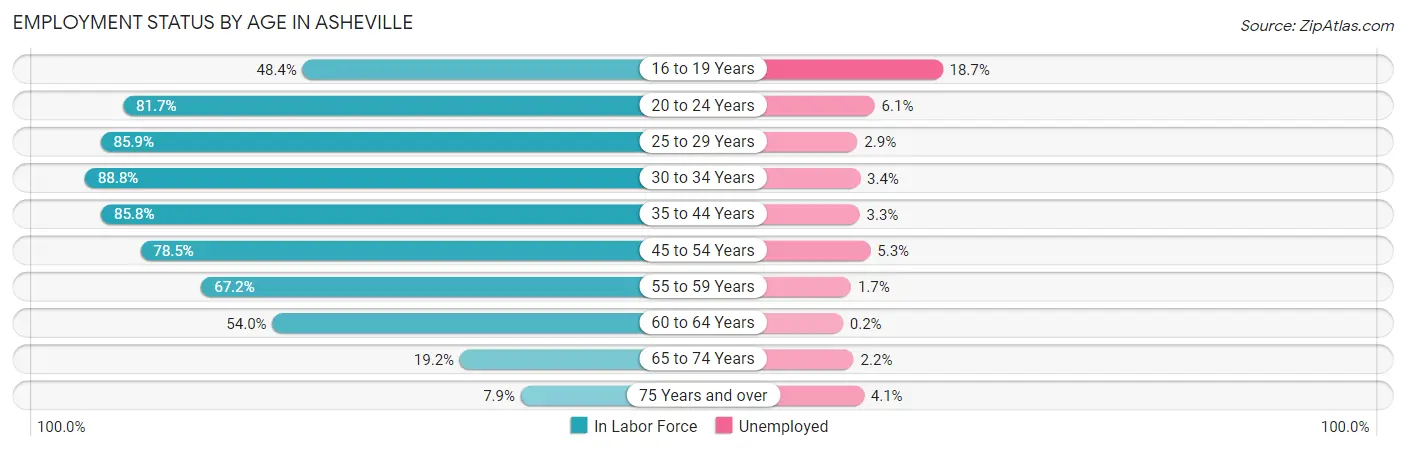
| Age Bracket | In Labor Force | Unemployed |
| 16 to 19 Years | 1,655 (48.4%) | 309 (18.7%) |
| 20 to 24 Years | 4,074 (81.7%) | 249 (6.1%) |
| 25 to 29 Years | 6,700 (85.9%) | 194 (2.9%) |
| 30 to 34 Years | 7,893 (88.8%) | 268 (3.4%) |
| 35 to 44 Years | 11,590 (85.8%) | 382 (3.3%) |
| 45 to 54 Years | 9,548 (78.5%) | 506 (5.3%) |
| 55 to 59 Years | 3,871 (67.2%) | 66 (1.7%) |
| 60 to 64 Years | 2,552 (54.0%) | 5 (0.2%) |
| 65 to 74 Years | 1,944 (19.2%) | 43 (2.2%) |
| 75 Years and over | 654 (7.9%) | 27 (4.1%) |
| Total | 50,503 (63.4%) | 2,071 (4.1%) |
Employment Status by Educational Attainment in Asheville
According to labor force statistics for Asheville, 79.8% of individuals (42,171) out of the total population between 25 and 64 years of age (52,846) are in the labor force, with 3.4% or 1,434 of them being unemployed. The group with the highest labor force participation rate are those with the educational attainment of bachelor's degree or higher, with 87.8% or 24,094 individuals in the labor force. Within the labor force, individuals with high school diploma education have the highest percentage of unemployment, with 8.4% or 493 of them being unemployed.
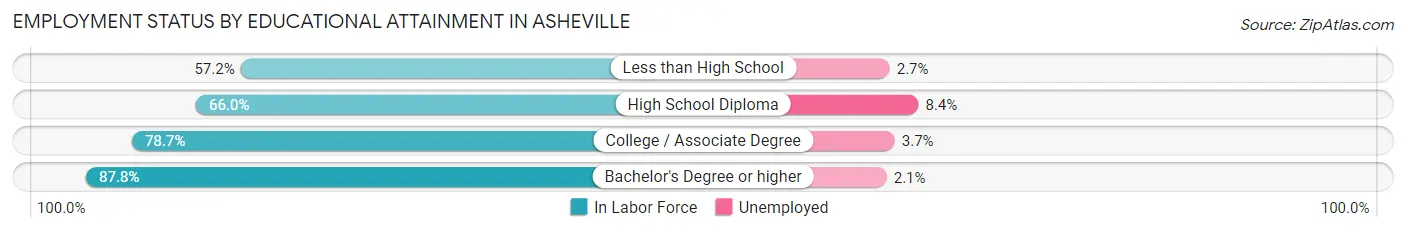
| Educational Attainment | In Labor Force | Unemployed |
| Less than High School | 2,099 (57.2%) | 99 (2.7%) |
| High School Diploma | 5,867 (66.0%) | 747 (8.4%) |
| College / Associate Degree | 10,109 (78.7%) | 475 (3.7%) |
| Bachelor's Degree or higher | 24,094 (87.8%) | 576 (2.1%) |
| Total | 42,171 (79.8%) | 1,797 (3.4%) |
Employment Occupations by Sex in Asheville
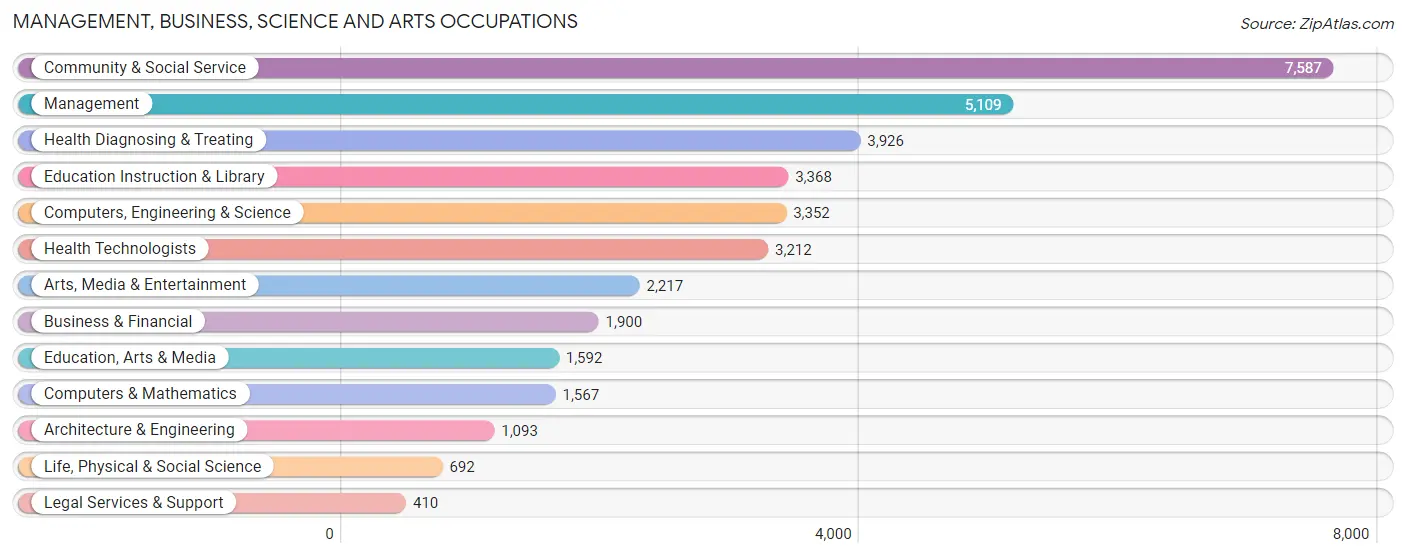
Management, Business, Science and Arts Occupations
The most common Management, Business, Science and Arts occupations in Asheville are Community & Social Service (7,587 | 15.7%), Management (5,109 | 10.6%), Health Diagnosing & Treating (3,926 | 8.1%), Education Instruction & Library (3,368 | 7.0%), and Computers, Engineering & Science (3,352 | 6.9%).
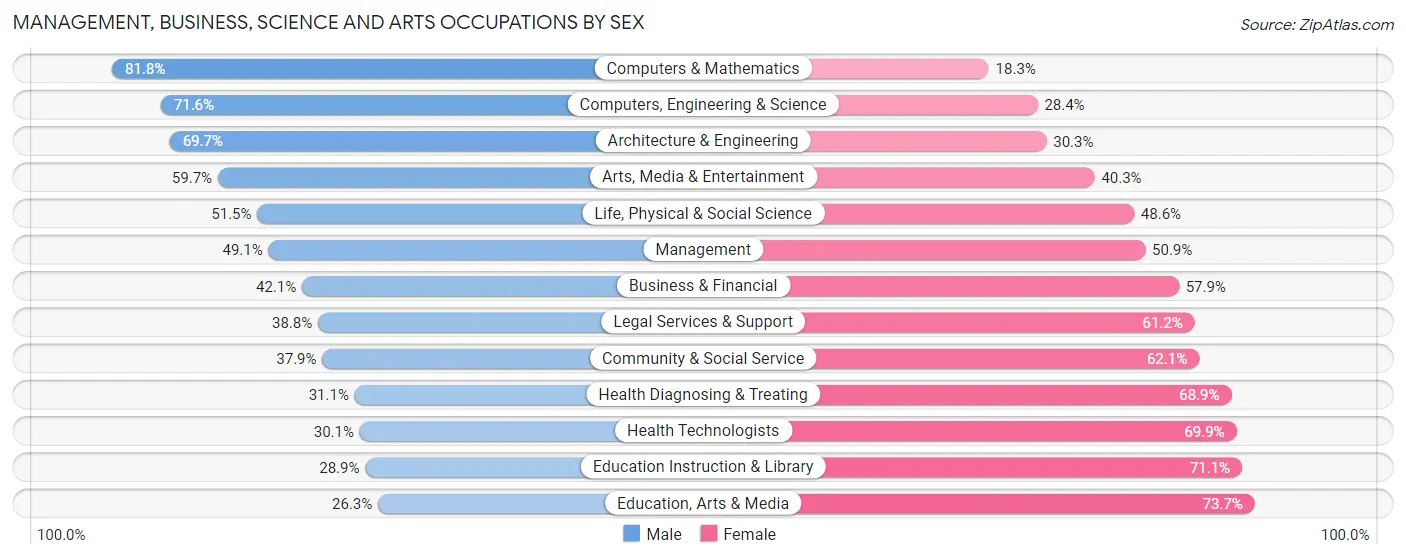
Management, Business, Science and Arts Occupations by Sex
Within the Management, Business, Science and Arts occupations in Asheville, the most male-oriented occupations are Computers & Mathematics (81.8%), Computers, Engineering & Science (71.6%), and Architecture & Engineering (69.7%), while the most female-oriented occupations are Education, Arts & Media (73.7%), Education Instruction & Library (71.1%), and Health Technologists (69.9%).
| Occupation | Male | Female |
| Management | 2,509 (49.1%) | 2,600 (50.9%) |
| Business & Financial | 800 (42.1%) | 1,100 (57.9%) |
| Computers, Engineering & Science | 2,399 (71.6%) | 953 (28.4%) |
| Computers & Mathematics | 1,281 (81.8%) | 286 (18.2%) |
| Architecture & Engineering | 762 (69.7%) | 331 (30.3%) |
| Life, Physical & Social Science | 356 (51.4%) | 336 (48.5%) |
| Community & Social Service | 2,874 (37.9%) | 4,713 (62.1%) |
| Education, Arts & Media | 418 (26.3%) | 1,174 (73.7%) |
| Legal Services & Support | 159 (38.8%) | 251 (61.2%) |
| Education Instruction & Library | 974 (28.9%) | 2,394 (71.1%) |
| Arts, Media & Entertainment | 1,323 (59.7%) | 894 (40.3%) |
| Health Diagnosing & Treating | 1,222 (31.1%) | 2,704 (68.9%) |
| Health Technologists | 966 (30.1%) | 2,246 (69.9%) |
| Total (Category) | 9,804 (44.8%) | 12,070 (55.2%) |
| Total (Overall) | 24,018 (49.7%) | 24,320 (50.3%) |
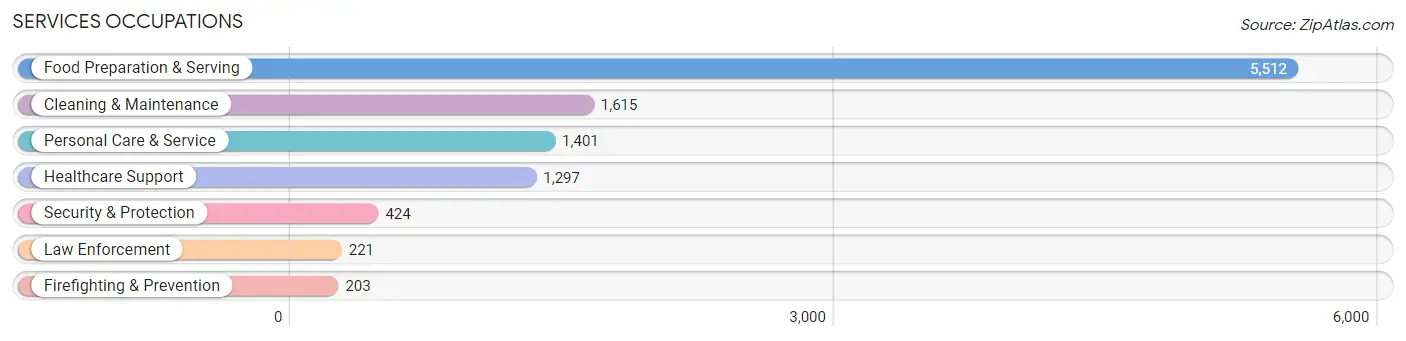
Services Occupations
The most common Services occupations in Asheville are Food Preparation & Serving (5,512 | 11.4%), Cleaning & Maintenance (1,615 | 3.3%), Personal Care & Service (1,401 | 2.9%), Healthcare Support (1,297 | 2.7%), and Security & Protection (424 | 0.9%).
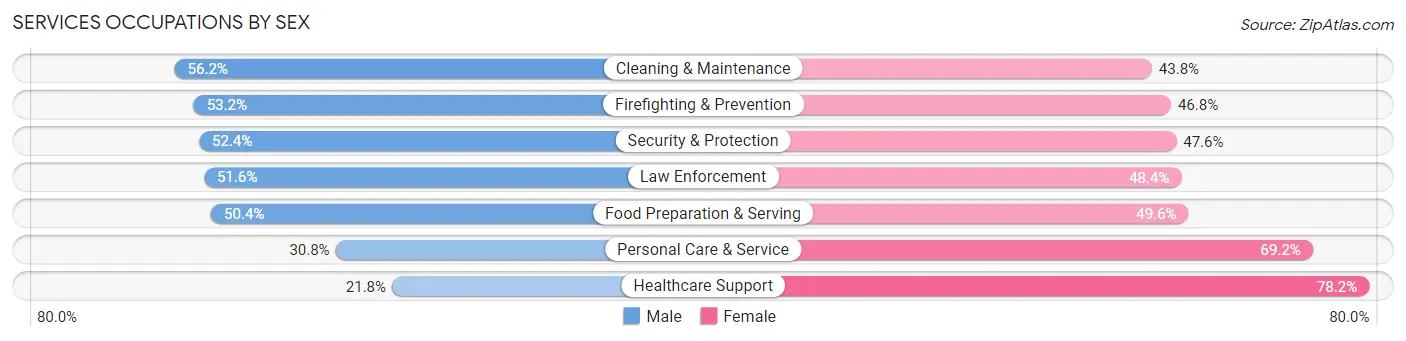
Services Occupations by Sex
Within the Services occupations in Asheville, the most male-oriented occupations are Cleaning & Maintenance (56.2%), Firefighting & Prevention (53.2%), and Security & Protection (52.4%), while the most female-oriented occupations are Healthcare Support (78.2%), Personal Care & Service (69.2%), and Food Preparation & Serving (49.6%).
| Occupation | Male | Female |
| Healthcare Support | 283 (21.8%) | 1,014 (78.2%) |
| Security & Protection | 222 (52.4%) | 202 (47.6%) |
| Firefighting & Prevention | 108 (53.2%) | 95 (46.8%) |
| Law Enforcement | 114 (51.6%) | 107 (48.4%) |
| Food Preparation & Serving | 2,780 (50.4%) | 2,732 (49.6%) |
| Cleaning & Maintenance | 908 (56.2%) | 707 (43.8%) |
| Personal Care & Service | 431 (30.8%) | 970 (69.2%) |
| Total (Category) | 4,624 (45.1%) | 5,625 (54.9%) |
| Total (Overall) | 24,018 (49.7%) | 24,320 (50.3%) |
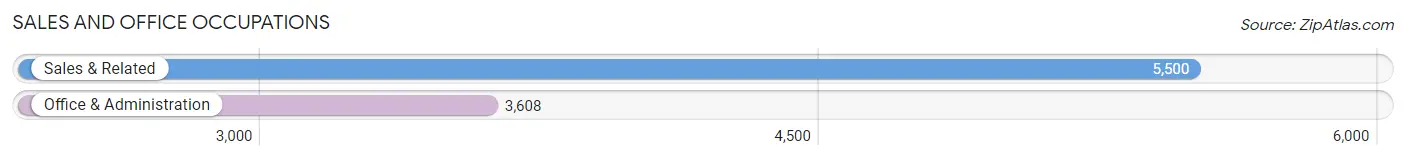
Sales and Office Occupations
The most common Sales and Office occupations in Asheville are Sales & Related (5,500 | 11.4%), and Office & Administration (3,608 | 7.5%).
Sales and Office Occupations by Sex
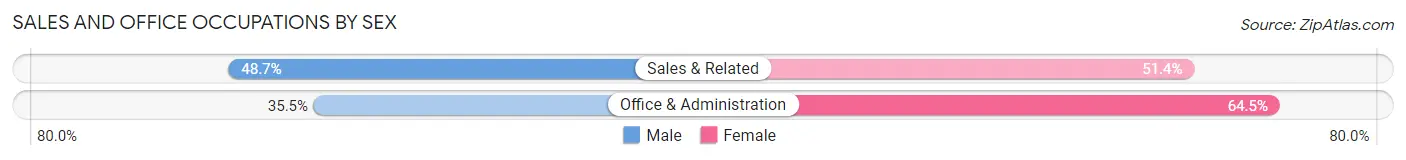
| Occupation | Male | Female |
| Sales & Related | 2,676 (48.6%) | 2,824 (51.3%) |
| Office & Administration | 1,281 (35.5%) | 2,327 (64.5%) |
| Total (Category) | 3,957 (43.4%) | 5,151 (56.6%) |
| Total (Overall) | 24,018 (49.7%) | 24,320 (50.3%) |
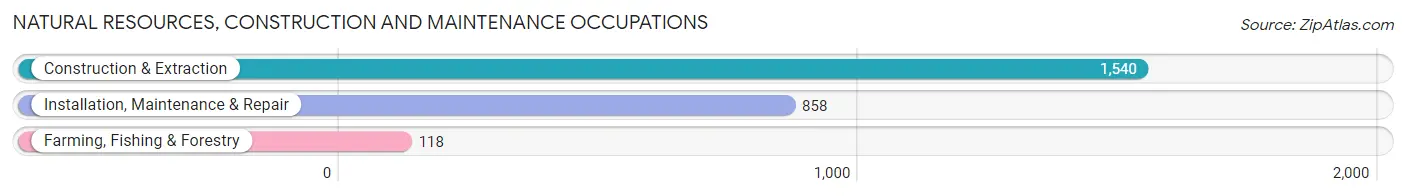
Natural Resources, Construction and Maintenance Occupations
The most common Natural Resources, Construction and Maintenance occupations in Asheville are Construction & Extraction (1,540 | 3.2%), Installation, Maintenance & Repair (858 | 1.8%), and Farming, Fishing & Forestry (118 | 0.2%).
Natural Resources, Construction and Maintenance Occupations by Sex
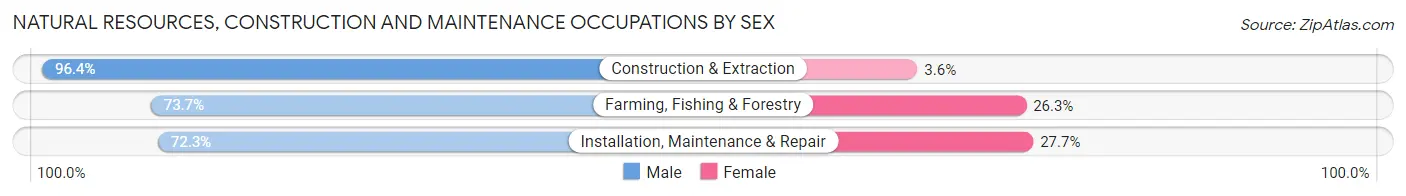
| Occupation | Male | Female |
| Farming, Fishing & Forestry | 87 (73.7%) | 31 (26.3%) |
| Construction & Extraction | 1,484 (96.4%) | 56 (3.6%) |
| Installation, Maintenance & Repair | 620 (72.3%) | 238 (27.7%) |
| Total (Category) | 2,191 (87.1%) | 325 (12.9%) |
| Total (Overall) | 24,018 (49.7%) | 24,320 (50.3%) |
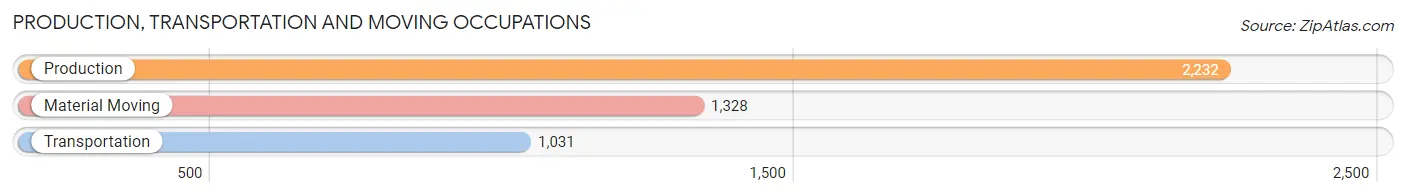
Production, Transportation and Moving Occupations
The most common Production, Transportation and Moving occupations in Asheville are Production (2,232 | 4.6%), Material Moving (1,328 | 2.8%), and Transportation (1,031 | 2.1%).
Production, Transportation and Moving Occupations by Sex
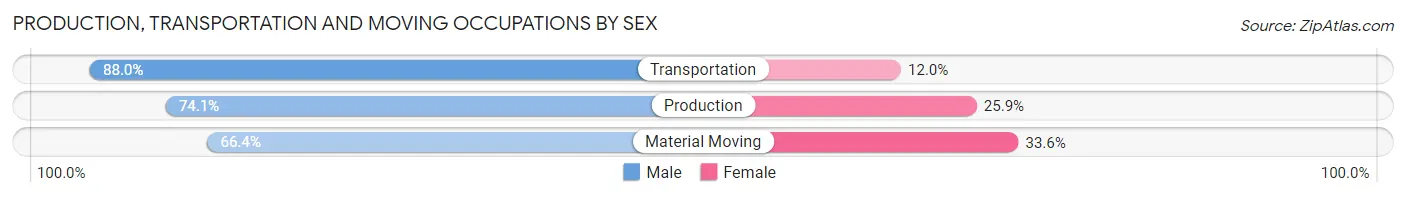
| Occupation | Male | Female |
| Production | 1,653 (74.1%) | 579 (25.9%) |
| Transportation | 907 (88.0%) | 124 (12.0%) |
| Material Moving | 882 (66.4%) | 446 (33.6%) |
| Total (Category) | 3,442 (75.0%) | 1,149 (25.0%) |
| Total (Overall) | 24,018 (49.7%) | 24,320 (50.3%) |
Employment Industries by Sex in Asheville
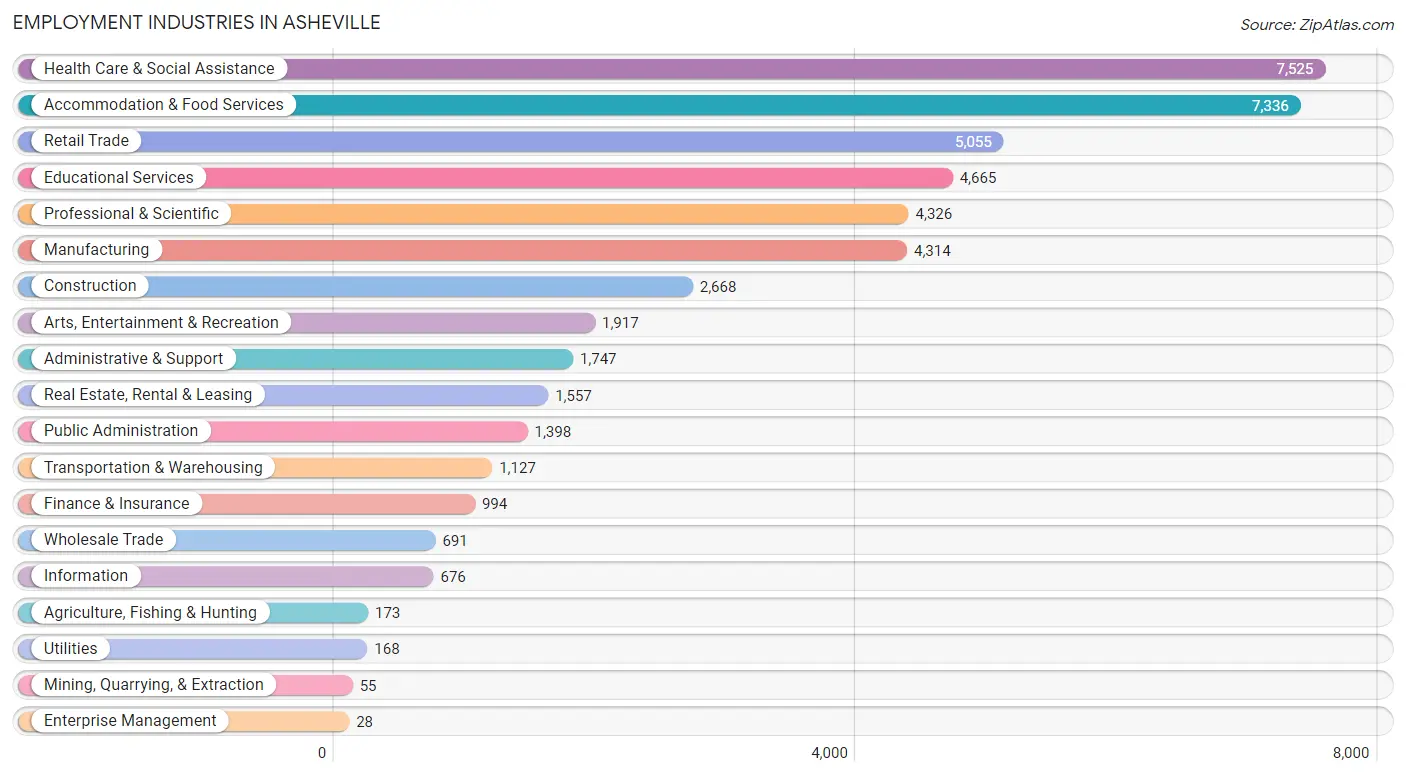
Employment Industries in Asheville
The major employment industries in Asheville include Health Care & Social Assistance (7,525 | 15.6%), Accommodation & Food Services (7,336 | 15.2%), Retail Trade (5,055 | 10.5%), Educational Services (4,665 | 9.7%), and Professional & Scientific (4,326 | 8.9%).
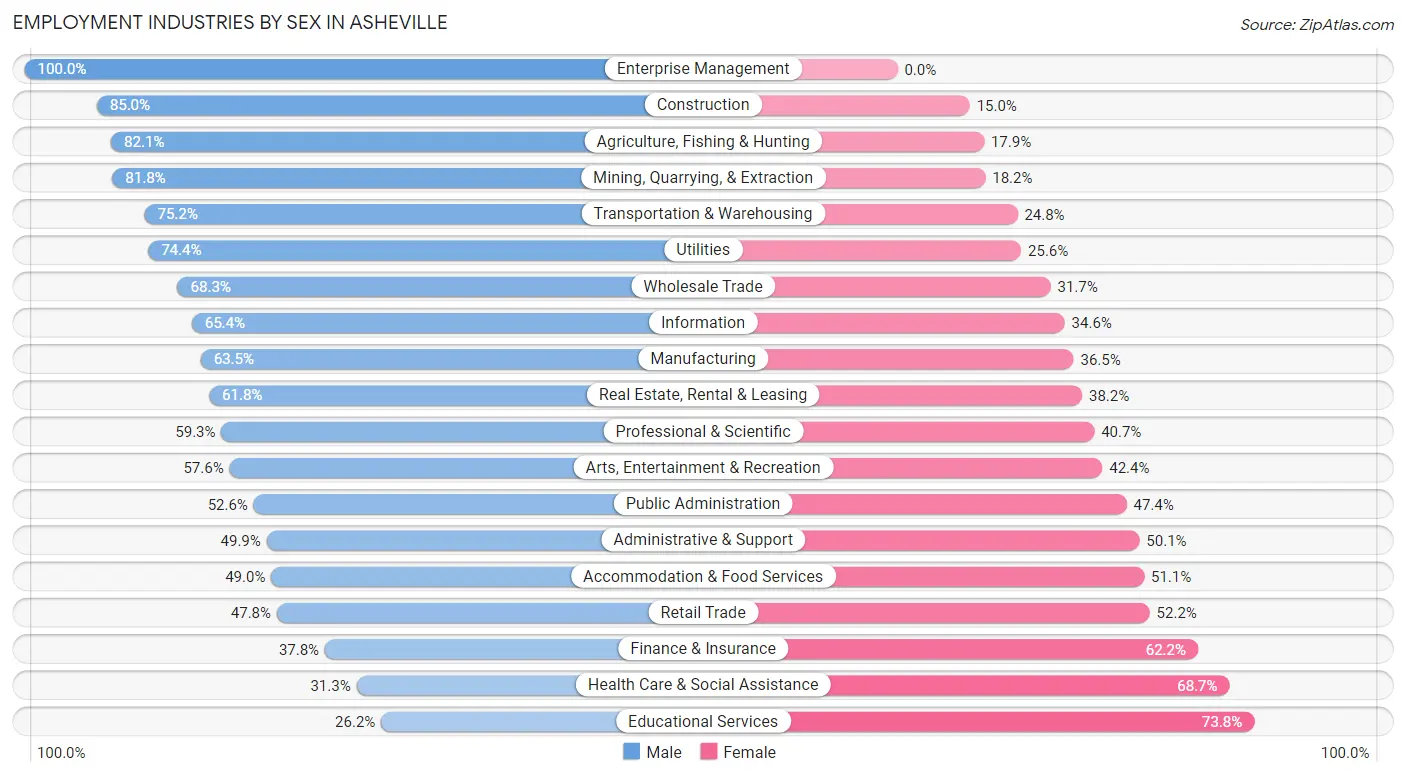
Employment Industries by Sex in Asheville
The Asheville industries that see more men than women are Enterprise Management (100.0%), Construction (85.0%), and Agriculture, Fishing & Hunting (82.1%), whereas the industries that tend to have a higher number of women are Educational Services (73.8%), Health Care & Social Assistance (68.7%), and Finance & Insurance (62.2%).
| Industry | Male | Female |
| Agriculture, Fishing & Hunting | 142 (82.1%) | 31 (17.9%) |
| Mining, Quarrying, & Extraction | 45 (81.8%) | 10 (18.2%) |
| Construction | 2,269 (85.0%) | 399 (15.0%) |
| Manufacturing | 2,741 (63.5%) | 1,573 (36.5%) |
| Wholesale Trade | 472 (68.3%) | 219 (31.7%) |
| Retail Trade | 2,416 (47.8%) | 2,639 (52.2%) |
| Transportation & Warehousing | 847 (75.2%) | 280 (24.8%) |
| Utilities | 125 (74.4%) | 43 (25.6%) |
| Information | 442 (65.4%) | 234 (34.6%) |
| Finance & Insurance | 376 (37.8%) | 618 (62.2%) |
| Real Estate, Rental & Leasing | 962 (61.8%) | 595 (38.2%) |
| Professional & Scientific | 2,564 (59.3%) | 1,762 (40.7%) |
| Enterprise Management | 28 (100.0%) | 0 (0.0%) |
| Administrative & Support | 872 (49.9%) | 875 (50.1%) |
| Educational Services | 1,222 (26.2%) | 3,443 (73.8%) |
| Health Care & Social Assistance | 2,355 (31.3%) | 5,170 (68.7%) |
| Arts, Entertainment & Recreation | 1,104 (57.6%) | 813 (42.4%) |
| Accommodation & Food Services | 3,591 (48.9%) | 3,745 (51.0%) |
| Public Administration | 735 (52.6%) | 663 (47.4%) |
| Total | 24,018 (49.7%) | 24,320 (50.3%) |
Education in Asheville
School Enrollment in Asheville
The most common levels of schooling among the 17,635 students in Asheville are college / undergraduate (4,253 | 24.1%), elementary school (3,748 | 21.2%), and high school (3,283 | 18.6%).
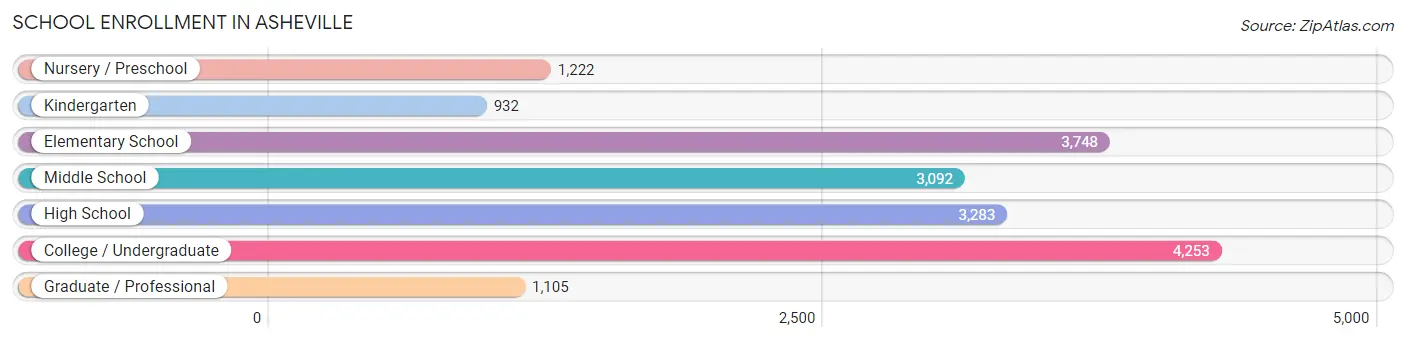
| School Level | # Students | % Students |
| Nursery / Preschool | 1,222 | 6.9% |
| Kindergarten | 932 | 5.3% |
| Elementary School | 3,748 | 21.2% |
| Middle School | 3,092 | 17.5% |
| High School | 3,283 | 18.6% |
| College / Undergraduate | 4,253 | 24.1% |
| Graduate / Professional | 1,105 | 6.3% |
| Total | 17,635 | 100.0% |
School Enrollment by Age by Funding Source in Asheville
Out of a total of 17,635 students who are enrolled in schools in Asheville, 2,822 (16.0%) attend a private institution, while the remaining 14,813 (84.0%) are enrolled in public schools. The age group of 3 to 4 year olds has the highest likelihood of being enrolled in private schools, with 435 (48.7% in the age bracket) enrolled. Conversely, the age group of 5 to 9 year old has the lowest likelihood of being enrolled in a private school, with 3,948 (88.3% in the age bracket) attending a public institution.
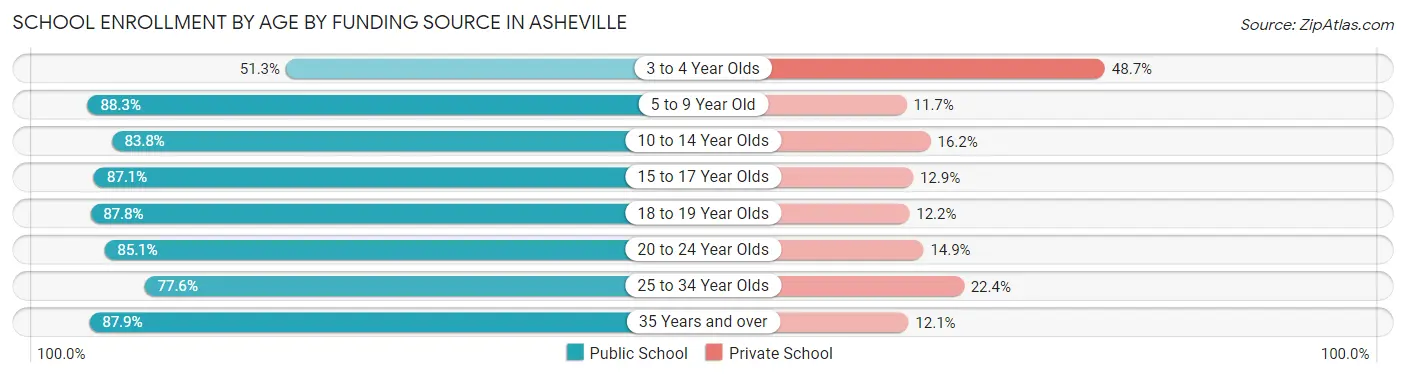
| Age Bracket | Public School | Private School |
| 3 to 4 Year Olds | 459 (51.3%) | 435 (48.7%) |
| 5 to 9 Year Old | 3,948 (88.3%) | 524 (11.7%) |
| 10 to 14 Year Olds | 3,289 (83.8%) | 635 (16.2%) |
| 15 to 17 Year Olds | 2,254 (87.1%) | 334 (12.9%) |
| 18 to 19 Year Olds | 1,286 (87.8%) | 179 (12.2%) |
| 20 to 24 Year Olds | 1,467 (85.1%) | 256 (14.9%) |
| 25 to 34 Year Olds | 1,177 (77.6%) | 339 (22.4%) |
| 35 Years and over | 926 (87.9%) | 127 (12.1%) |
| Total | 14,813 (84.0%) | 2,822 (16.0%) |
Educational Attainment by Field of Study in Asheville
Business (5,025 | 12.7%), education (3,922 | 9.9%), visual & performing arts (3,466 | 8.7%), social sciences (3,450 | 8.7%), and psychology (3,270 | 8.2%) are the most common fields of study among 39,731 individuals in Asheville who have obtained a bachelor's degree or higher.
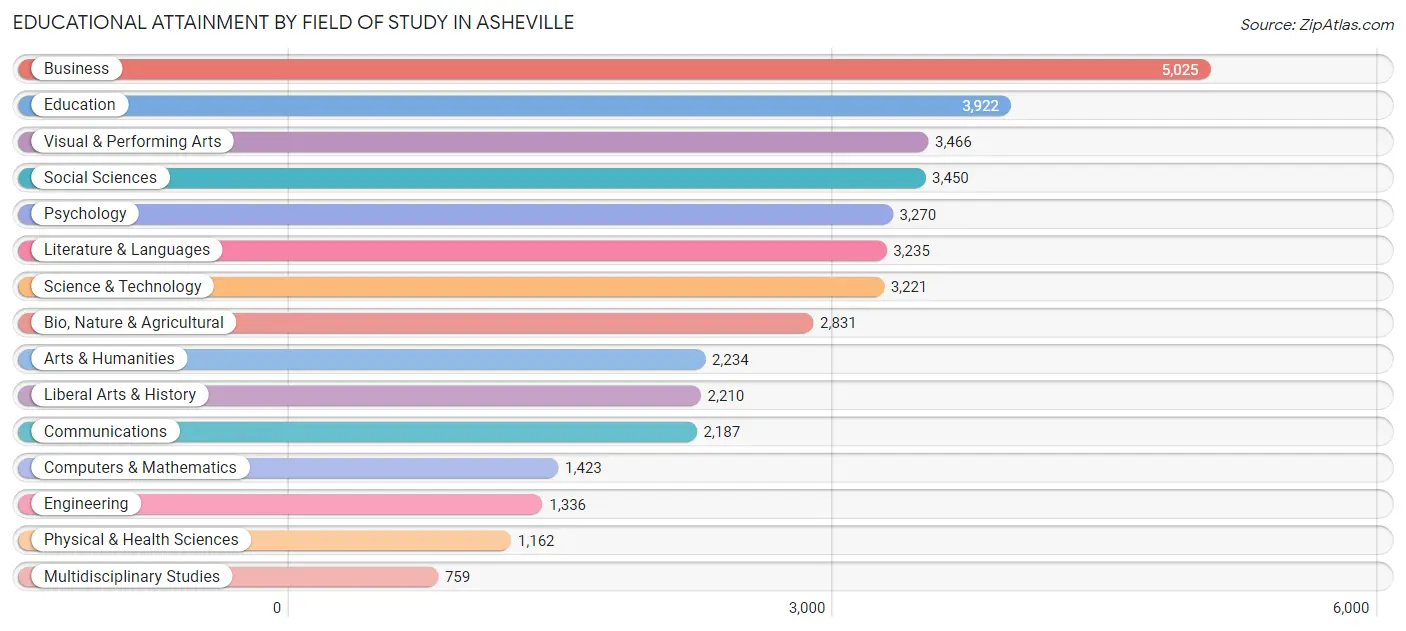
| Field of Study | # Graduates | % Graduates |
| Computers & Mathematics | 1,423 | 3.6% |
| Bio, Nature & Agricultural | 2,831 | 7.1% |
| Physical & Health Sciences | 1,162 | 2.9% |
| Psychology | 3,270 | 8.2% |
| Social Sciences | 3,450 | 8.7% |
| Engineering | 1,336 | 3.4% |
| Multidisciplinary Studies | 759 | 1.9% |
| Science & Technology | 3,221 | 8.1% |
| Business | 5,025 | 12.7% |
| Education | 3,922 | 9.9% |
| Literature & Languages | 3,235 | 8.1% |
| Liberal Arts & History | 2,210 | 5.6% |
| Visual & Performing Arts | 3,466 | 8.7% |
| Communications | 2,187 | 5.5% |
| Arts & Humanities | 2,234 | 5.6% |
| Total | 39,731 | 100.0% |
Transportation & Commute in Asheville
Vehicle Availability by Sex in Asheville
The most prevalent vehicle ownership categories in Asheville are males with 2 vehicles (11,685, accounting for 49.8%) and females with 2 vehicles (9,981, making up 49.2%).
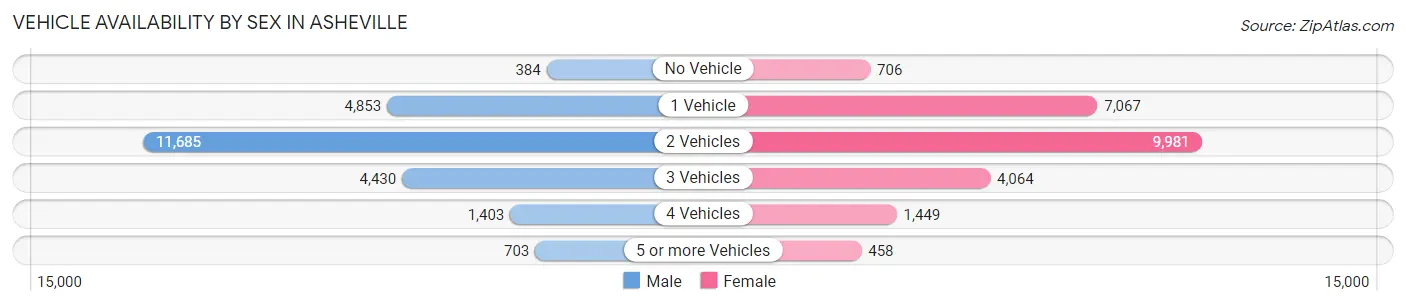
| Vehicles Available | Male | Female |
| No Vehicle | 384 (1.6%) | 706 (3.0%) |
| 1 Vehicle | 4,853 (20.7%) | 7,067 (29.8%) |
| 2 Vehicles | 11,685 (49.8%) | 9,981 (42.1%) |
| 3 Vehicles | 4,430 (18.9%) | 4,064 (17.1%) |
| 4 Vehicles | 1,403 (6.0%) | 1,449 (6.1%) |
| 5 or more Vehicles | 703 (3.0%) | 458 (1.9%) |
| Total | 23,458 (100.0%) | 23,725 (100.0%) |
Commute Time in Asheville
The most frequently occuring commute durations in Asheville are 15 to 19 minutes (9,893 commuters, 24.8%), 20 to 24 minutes (9,398 commuters, 23.6%), and 10 to 14 minutes (8,525 commuters, 21.4%).
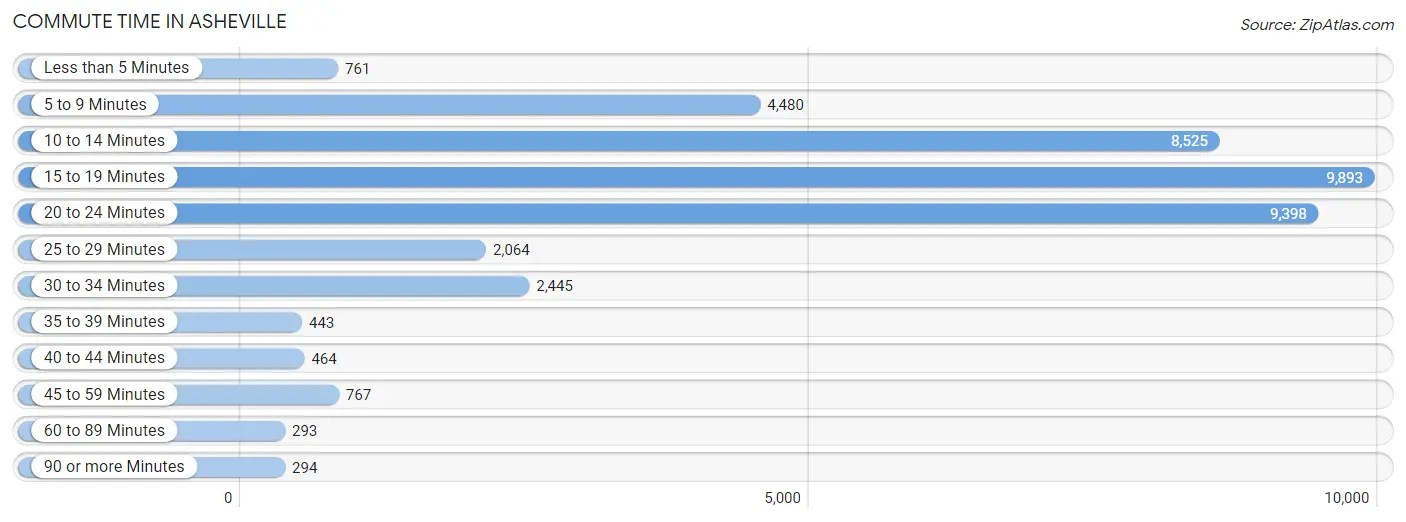
| Commute Time | # Commuters | % Commuters |
| Less than 5 Minutes | 761 | 1.9% |
| 5 to 9 Minutes | 4,480 | 11.3% |
| 10 to 14 Minutes | 8,525 | 21.4% |
| 15 to 19 Minutes | 9,893 | 24.8% |
| 20 to 24 Minutes | 9,398 | 23.6% |
| 25 to 29 Minutes | 2,064 | 5.2% |
| 30 to 34 Minutes | 2,445 | 6.1% |
| 35 to 39 Minutes | 443 | 1.1% |
| 40 to 44 Minutes | 464 | 1.2% |
| 45 to 59 Minutes | 767 | 1.9% |
| 60 to 89 Minutes | 293 | 0.7% |
| 90 or more Minutes | 294 | 0.7% |
Commute Time by Sex in Asheville
The most common commute times in Asheville are 20 to 24 minutes (4,783 commuters, 24.5%) for males and 15 to 19 minutes (5,521 commuters, 27.2%) for females.
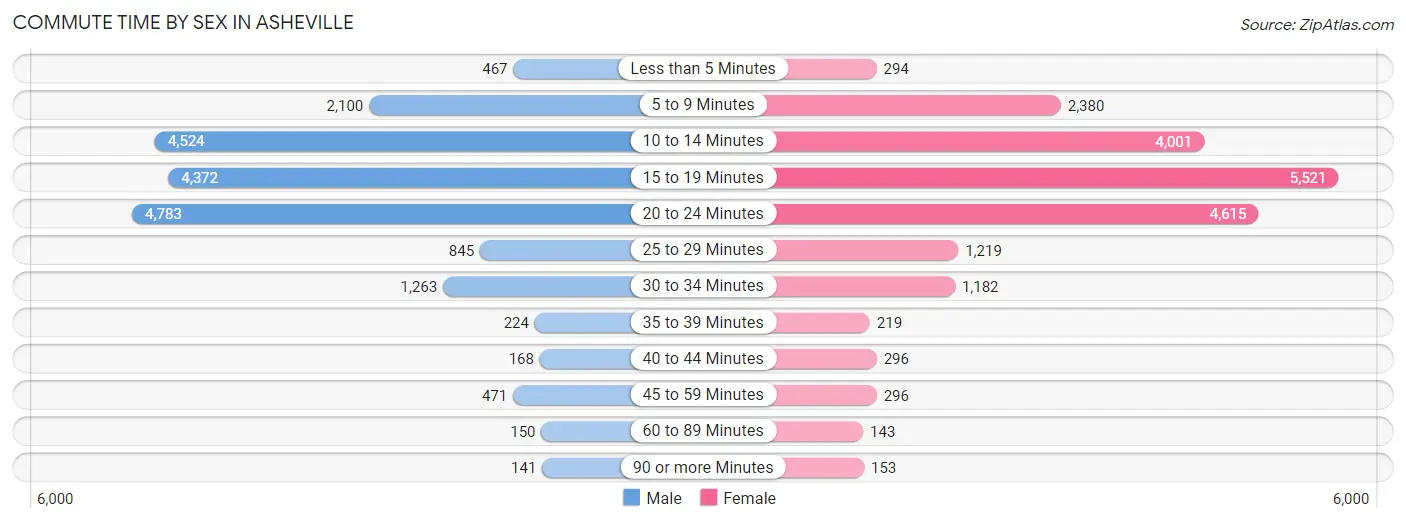
| Commute Time | Male | Female |
| Less than 5 Minutes | 467 (2.4%) | 294 (1.5%) |
| 5 to 9 Minutes | 2,100 (10.8%) | 2,380 (11.7%) |
| 10 to 14 Minutes | 4,524 (23.2%) | 4,001 (19.7%) |
| 15 to 19 Minutes | 4,372 (22.4%) | 5,521 (27.2%) |
| 20 to 24 Minutes | 4,783 (24.5%) | 4,615 (22.7%) |
| 25 to 29 Minutes | 845 (4.3%) | 1,219 (6.0%) |
| 30 to 34 Minutes | 1,263 (6.5%) | 1,182 (5.8%) |
| 35 to 39 Minutes | 224 (1.1%) | 219 (1.1%) |
| 40 to 44 Minutes | 168 (0.9%) | 296 (1.5%) |
| 45 to 59 Minutes | 471 (2.4%) | 296 (1.5%) |
| 60 to 89 Minutes | 150 (0.8%) | 143 (0.7%) |
| 90 or more Minutes | 141 (0.7%) | 153 (0.7%) |
Time of Departure to Work by Sex in Asheville
The most frequent times of departure to work in Asheville are 7:30 AM to 7:59 AM (3,028, 15.5%) for males and 8:00 AM to 8:29 AM (2,860, 14.1%) for females.
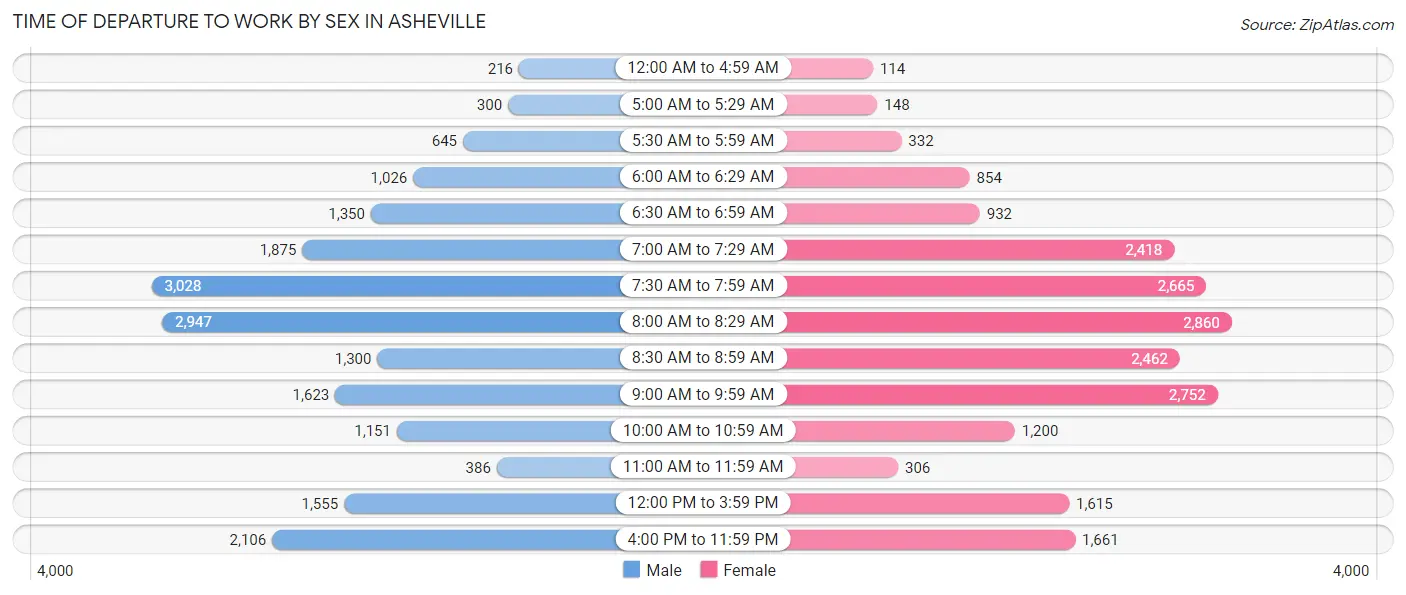
| Time of Departure | Male | Female |
| 12:00 AM to 4:59 AM | 216 (1.1%) | 114 (0.6%) |
| 5:00 AM to 5:29 AM | 300 (1.5%) | 148 (0.7%) |
| 5:30 AM to 5:59 AM | 645 (3.3%) | 332 (1.6%) |
| 6:00 AM to 6:29 AM | 1,026 (5.3%) | 854 (4.2%) |
| 6:30 AM to 6:59 AM | 1,350 (6.9%) | 932 (4.6%) |
| 7:00 AM to 7:29 AM | 1,875 (9.6%) | 2,418 (11.9%) |
| 7:30 AM to 7:59 AM | 3,028 (15.5%) | 2,665 (13.1%) |
| 8:00 AM to 8:29 AM | 2,947 (15.1%) | 2,860 (14.1%) |
| 8:30 AM to 8:59 AM | 1,300 (6.7%) | 2,462 (12.1%) |
| 9:00 AM to 9:59 AM | 1,623 (8.3%) | 2,752 (13.5%) |
| 10:00 AM to 10:59 AM | 1,151 (5.9%) | 1,200 (5.9%) |
| 11:00 AM to 11:59 AM | 386 (2.0%) | 306 (1.5%) |
| 12:00 PM to 3:59 PM | 1,555 (8.0%) | 1,615 (8.0%) |
| 4:00 PM to 11:59 PM | 2,106 (10.8%) | 1,661 (8.2%) |
| Total | 19,508 (100.0%) | 20,319 (100.0%) |
Housing Occupancy in Asheville
Occupancy by Ownership in Asheville
Of the total 38,229 dwellings in Asheville, owner-occupied units account for 19,111 (50.0%), while renter-occupied units make up 19,118 (50.0%).
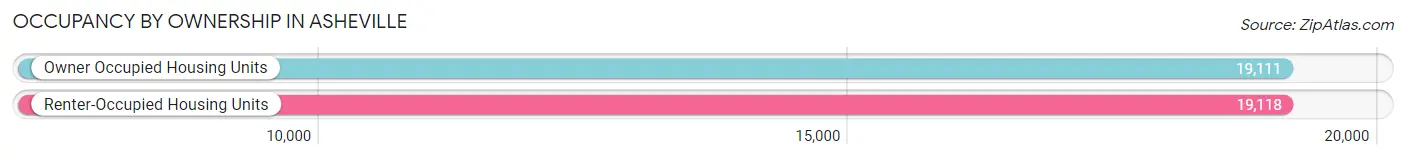
| Occupancy | # Housing Units | % Housing Units |
| Owner Occupied Housing Units | 19,111 | 50.0% |
| Renter-Occupied Housing Units | 19,118 | 50.0% |
| Total Occupied Housing Units | 38,229 | 100.0% |
Occupancy by Household Size in Asheville
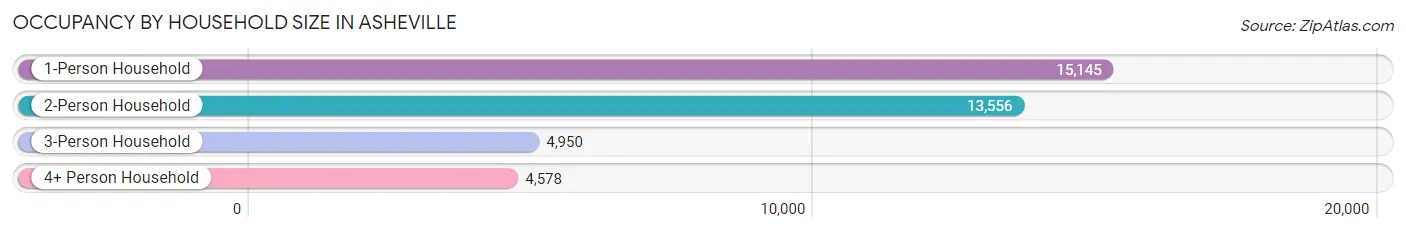
| Household Size | # Housing Units | % Housing Units |
| 1-Person Household | 15,145 | 39.6% |
| 2-Person Household | 13,556 | 35.5% |
| 3-Person Household | 4,950 | 13.0% |
| 4+ Person Household | 4,578 | 12.0% |
| Total Housing Units | 38,229 | 100.0% |
Occupancy by Ownership by Household Size in Asheville
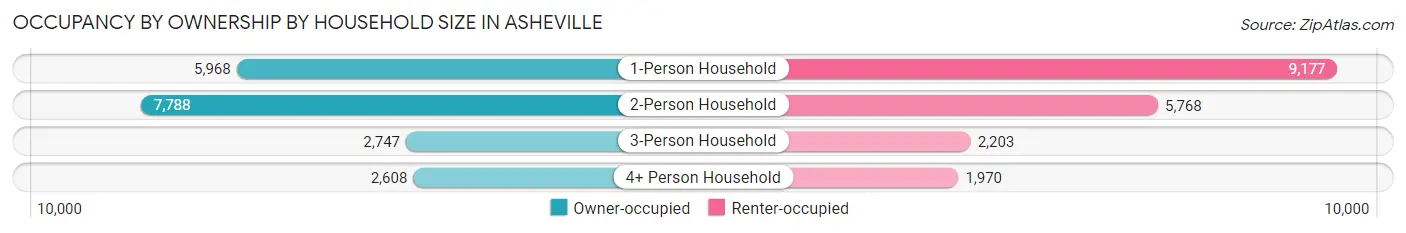
| Household Size | Owner-occupied | Renter-occupied |
| 1-Person Household | 5,968 (39.4%) | 9,177 (60.6%) |
| 2-Person Household | 7,788 (57.5%) | 5,768 (42.5%) |
| 3-Person Household | 2,747 (55.5%) | 2,203 (44.5%) |
| 4+ Person Household | 2,608 (57.0%) | 1,970 (43.0%) |
| Total Housing Units | 19,111 (50.0%) | 19,118 (50.0%) |
Occupancy by Educational Attainment in Asheville
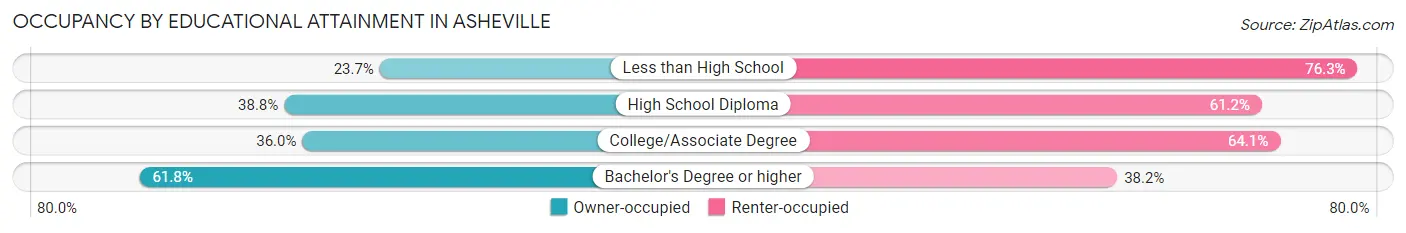
| Household Size | Owner-occupied | Renter-occupied |
| Less than High School | 450 (23.7%) | 1,450 (76.3%) |
| High School Diploma | 2,284 (38.8%) | 3,596 (61.2%) |
| College/Associate Degree | 3,386 (35.9%) | 6,033 (64.0%) |
| Bachelor's Degree or higher | 12,991 (61.8%) | 8,039 (38.2%) |
Occupancy by Age of Householder in Asheville
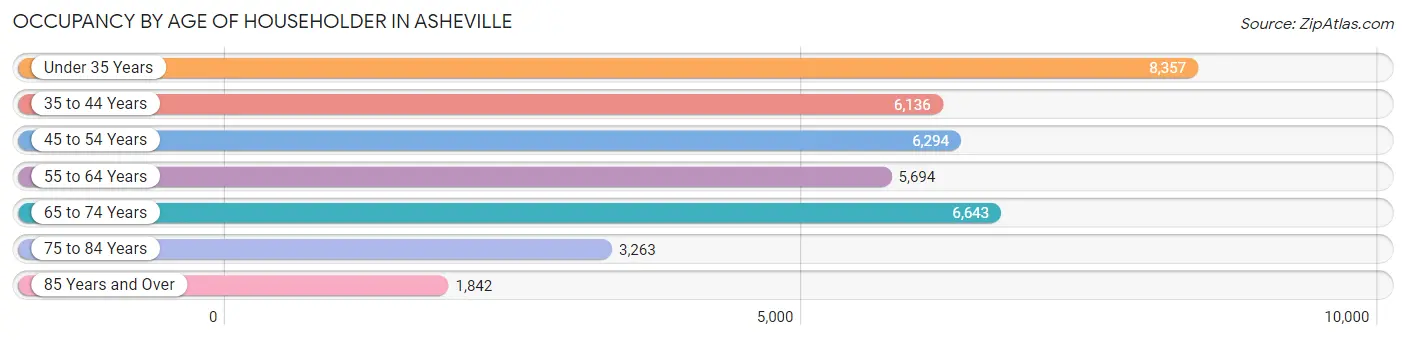
| Age Bracket | # Households | % Households |
| Under 35 Years | 8,357 | 21.9% |
| 35 to 44 Years | 6,136 | 16.1% |
| 45 to 54 Years | 6,294 | 16.5% |
| 55 to 64 Years | 5,694 | 14.9% |
| 65 to 74 Years | 6,643 | 17.4% |
| 75 to 84 Years | 3,263 | 8.5% |
| 85 Years and Over | 1,842 | 4.8% |
| Total | 38,229 | 100.0% |
Housing Finances in Asheville
Median Income by Occupancy in Asheville
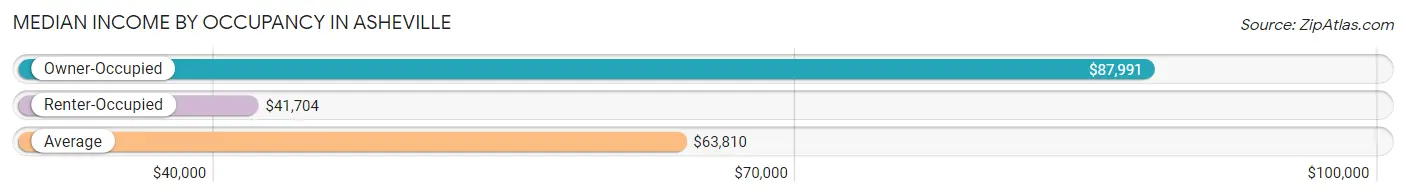
| Occupancy Type | # Households | Median Income |
| Owner-Occupied | 19,111 (50.0%) | $87,991 |
| Renter-Occupied | 19,118 (50.0%) | $41,704 |
| Average | 38,229 (100.0%) | $63,810 |
Occupancy by Householder Income Bracket in Asheville
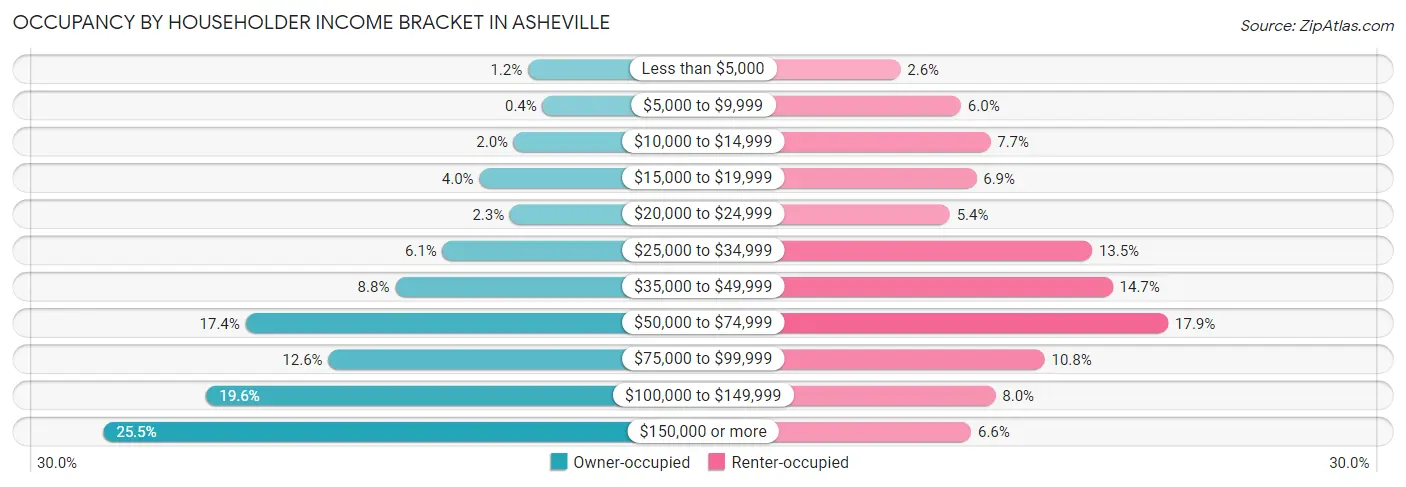
| Income Bracket | Owner-occupied | Renter-occupied |
| Less than $5,000 | 236 (1.2%) | 489 (2.6%) |
| $5,000 to $9,999 | 77 (0.4%) | 1,151 (6.0%) |
| $10,000 to $14,999 | 390 (2.0%) | 1,472 (7.7%) |
| $15,000 to $19,999 | 766 (4.0%) | 1,320 (6.9%) |
| $20,000 to $24,999 | 432 (2.3%) | 1,028 (5.4%) |
| $25,000 to $34,999 | 1,168 (6.1%) | 2,583 (13.5%) |
| $35,000 to $49,999 | 1,686 (8.8%) | 2,809 (14.7%) |
| $50,000 to $74,999 | 3,320 (17.4%) | 3,414 (17.9%) |
| $75,000 to $99,999 | 2,415 (12.6%) | 2,064 (10.8%) |
| $100,000 to $149,999 | 3,748 (19.6%) | 1,527 (8.0%) |
| $150,000 or more | 4,873 (25.5%) | 1,261 (6.6%) |
| Total | 19,111 (100.0%) | 19,118 (100.0%) |
Monthly Housing Cost Tiers in Asheville
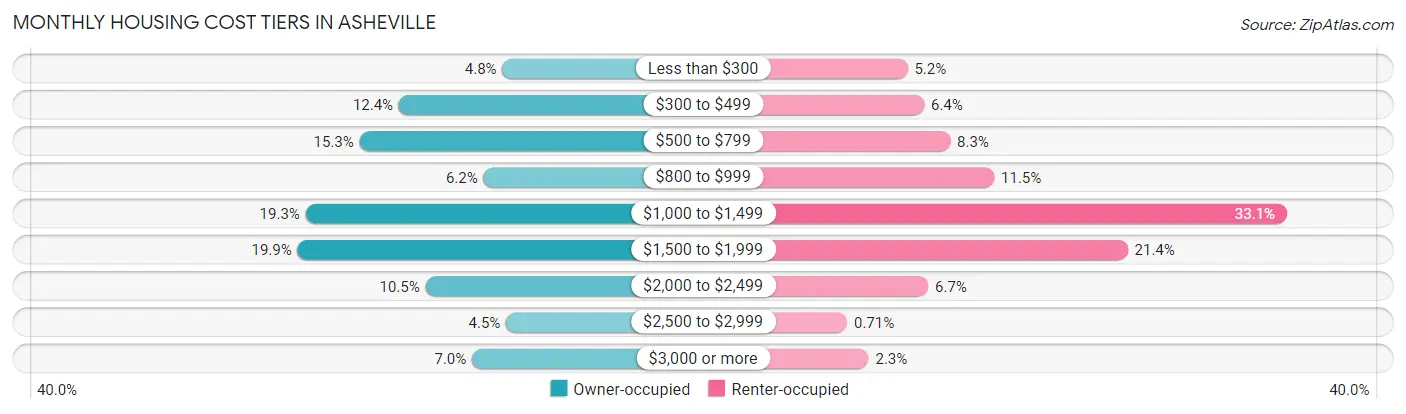
| Monthly Cost | Owner-occupied | Renter-occupied |
| Less than $300 | 919 (4.8%) | 986 (5.2%) |
| $300 to $499 | 2,376 (12.4%) | 1,220 (6.4%) |
| $500 to $799 | 2,929 (15.3%) | 1,586 (8.3%) |
| $800 to $999 | 1,184 (6.2%) | 2,207 (11.5%) |
| $1,000 to $1,499 | 3,688 (19.3%) | 6,328 (33.1%) |
| $1,500 to $1,999 | 3,804 (19.9%) | 4,085 (21.4%) |
| $2,000 to $2,499 | 2,000 (10.5%) | 1,277 (6.7%) |
| $2,500 to $2,999 | 866 (4.5%) | 136 (0.7%) |
| $3,000 or more | 1,345 (7.0%) | 437 (2.3%) |
| Total | 19,111 (100.0%) | 19,118 (100.0%) |
Physical Housing Characteristics in Asheville
Housing Structures in Asheville
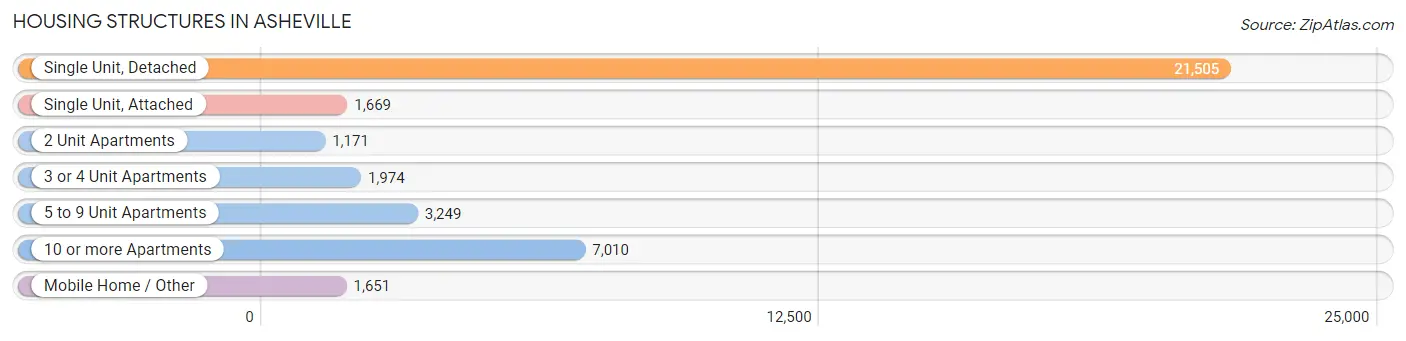
| Structure Type | # Housing Units | % Housing Units |
| Single Unit, Detached | 21,505 | 56.2% |
| Single Unit, Attached | 1,669 | 4.4% |
| 2 Unit Apartments | 1,171 | 3.1% |
| 3 or 4 Unit Apartments | 1,974 | 5.2% |
| 5 to 9 Unit Apartments | 3,249 | 8.5% |
| 10 or more Apartments | 7,010 | 18.3% |
| Mobile Home / Other | 1,651 | 4.3% |
| Total | 38,229 | 100.0% |
Housing Structures by Occupancy in Asheville
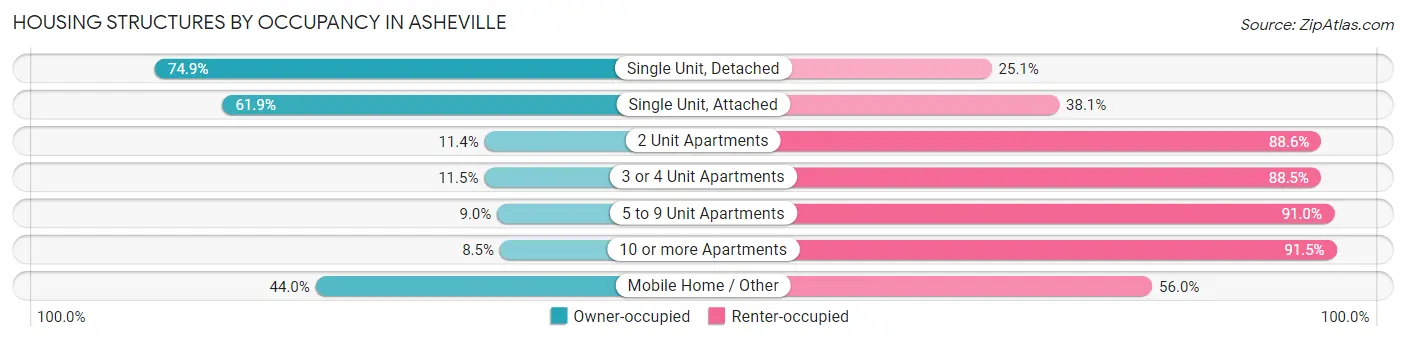
| Structure Type | Owner-occupied | Renter-occupied |
| Single Unit, Detached | 16,102 (74.9%) | 5,403 (25.1%) |
| Single Unit, Attached | 1,033 (61.9%) | 636 (38.1%) |
| 2 Unit Apartments | 134 (11.4%) | 1,037 (88.6%) |
| 3 or 4 Unit Apartments | 227 (11.5%) | 1,747 (88.5%) |
| 5 to 9 Unit Apartments | 293 (9.0%) | 2,956 (91.0%) |
| 10 or more Apartments | 596 (8.5%) | 6,414 (91.5%) |
| Mobile Home / Other | 726 (44.0%) | 925 (56.0%) |
| Total | 19,111 (50.0%) | 19,118 (50.0%) |
Housing Structures by Number of Rooms in Asheville
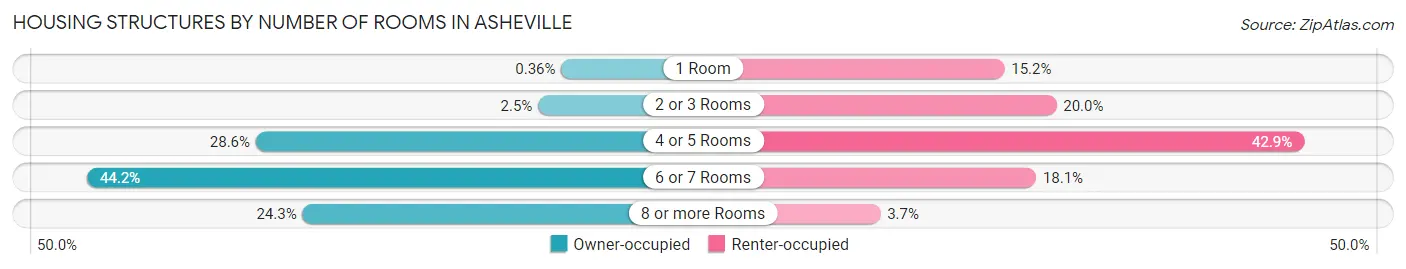
| Number of Rooms | Owner-occupied | Renter-occupied |
| 1 Room | 69 (0.4%) | 2,906 (15.2%) |
| 2 or 3 Rooms | 478 (2.5%) | 3,826 (20.0%) |
| 4 or 5 Rooms | 5,468 (28.6%) | 8,206 (42.9%) |
| 6 or 7 Rooms | 8,452 (44.2%) | 3,467 (18.1%) |
| 8 or more Rooms | 4,644 (24.3%) | 713 (3.7%) |
| Total | 19,111 (100.0%) | 19,118 (100.0%) |
Housing Structure by Heating Type in Asheville
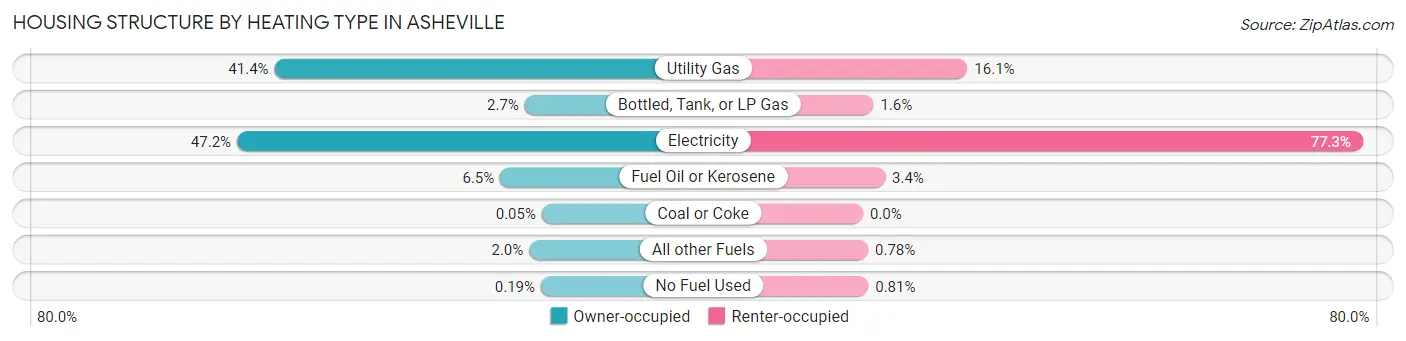
| Heating Type | Owner-occupied | Renter-occupied |
| Utility Gas | 7,909 (41.4%) | 3,083 (16.1%) |
| Bottled, Tank, or LP Gas | 514 (2.7%) | 310 (1.6%) |
| Electricity | 9,017 (47.2%) | 14,768 (77.2%) |
| Fuel Oil or Kerosene | 1,240 (6.5%) | 652 (3.4%) |
| Coal or Coke | 9 (0.1%) | 0 (0.0%) |
| All other Fuels | 386 (2.0%) | 150 (0.8%) |
| No Fuel Used | 36 (0.2%) | 155 (0.8%) |
| Total | 19,111 (100.0%) | 19,118 (100.0%) |
Household Vehicle Usage in Asheville
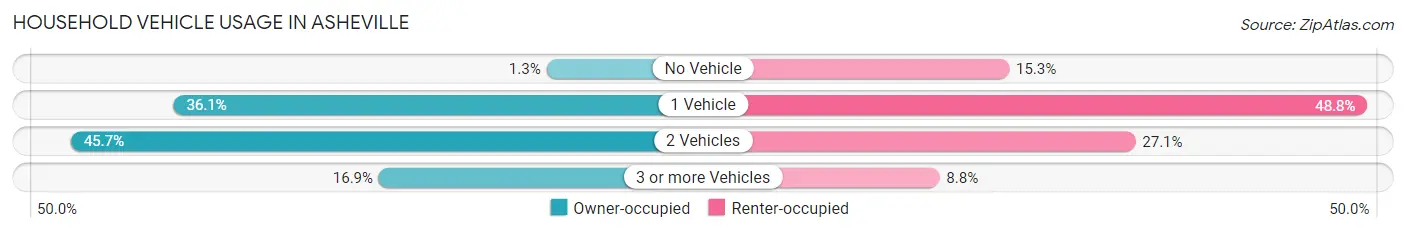
| Vehicles per Household | Owner-occupied | Renter-occupied |
| No Vehicle | 244 (1.3%) | 2,928 (15.3%) |
| 1 Vehicle | 6,900 (36.1%) | 9,321 (48.8%) |
| 2 Vehicles | 8,731 (45.7%) | 5,182 (27.1%) |
| 3 or more Vehicles | 3,236 (16.9%) | 1,687 (8.8%) |
| Total | 19,111 (100.0%) | 19,118 (100.0%) |
Real Estate & Mortgages in Asheville
Real Estate and Mortgage Overview in Asheville
| Characteristic | Without Mortgage | With Mortgage |
| Housing Units | 7,655 | 11,456 |
| Median Property Value | $350,400 | $391,900 |
| Median Household Income | $62,534 | $3,603 |
| Monthly Housing Costs | $555 | $1,331 |
| Real Estate Taxes | $2,523 | $82 |
Property Value by Mortgage Status in Asheville
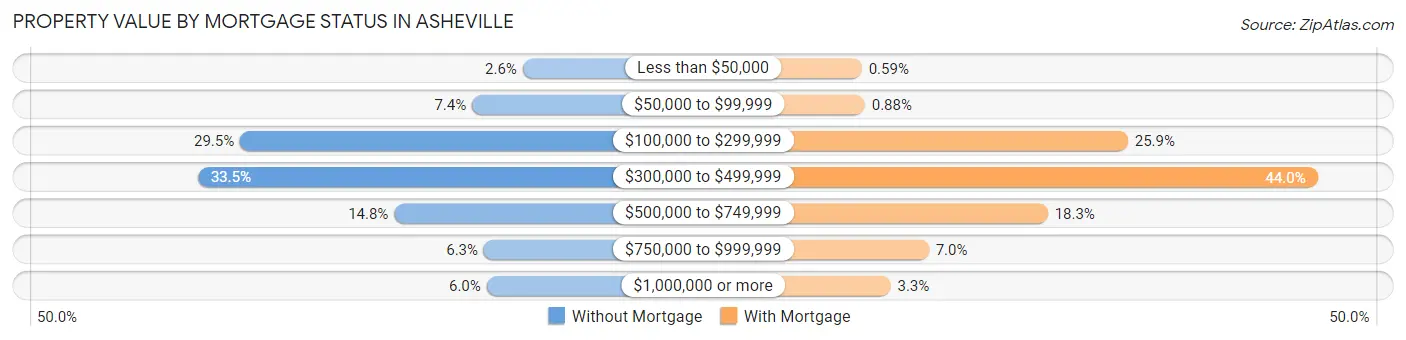
| Property Value | Without Mortgage | With Mortgage |
| Less than $50,000 | 196 (2.6%) | 68 (0.6%) |
| $50,000 to $99,999 | 566 (7.4%) | 101 (0.9%) |
| $100,000 to $299,999 | 2,257 (29.5%) | 2,971 (25.9%) |
| $300,000 to $499,999 | 2,565 (33.5%) | 5,041 (44.0%) |
| $500,000 to $749,999 | 1,133 (14.8%) | 2,096 (18.3%) |
| $750,000 to $999,999 | 479 (6.3%) | 798 (7.0%) |
| $1,000,000 or more | 459 (6.0%) | 381 (3.3%) |
| Total | 7,655 (100.0%) | 11,456 (100.0%) |
Household Income by Mortgage Status in Asheville
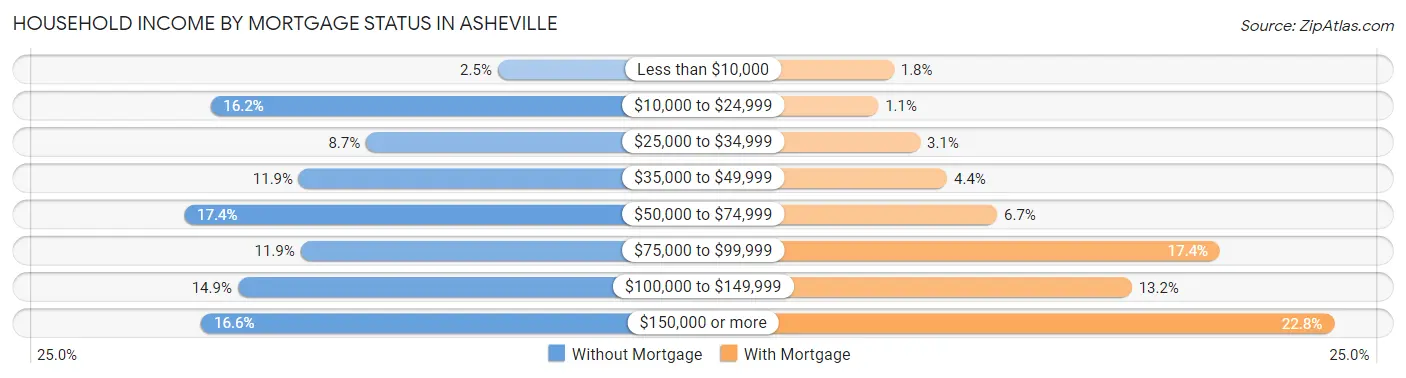
| Household Income | Without Mortgage | With Mortgage |
| Less than $10,000 | 189 (2.5%) | 209 (1.8%) |
| $10,000 to $24,999 | 1,236 (16.2%) | 124 (1.1%) |
| $25,000 to $34,999 | 669 (8.7%) | 352 (3.1%) |
| $35,000 to $49,999 | 914 (11.9%) | 499 (4.4%) |
| $50,000 to $74,999 | 1,332 (17.4%) | 772 (6.7%) |
| $75,000 to $99,999 | 908 (11.9%) | 1,988 (17.3%) |
| $100,000 to $149,999 | 1,137 (14.8%) | 1,507 (13.2%) |
| $150,000 or more | 1,270 (16.6%) | 2,611 (22.8%) |
| Total | 7,655 (100.0%) | 11,456 (100.0%) |
Property Value to Household Income Ratio in Asheville
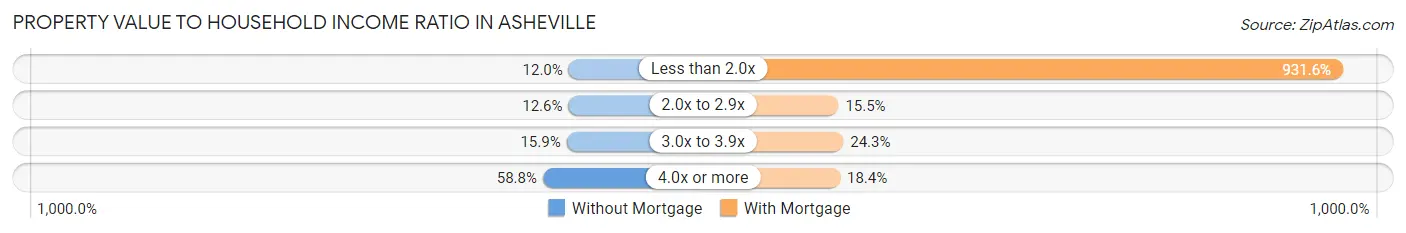
| Value-to-Income Ratio | Without Mortgage | With Mortgage |
| Less than 2.0x | 919 (12.0%) | 106,723 (931.6%) |
| 2.0x to 2.9x | 962 (12.6%) | 1,774 (15.5%) |
| 3.0x to 3.9x | 1,216 (15.9%) | 2,782 (24.3%) |
| 4.0x or more | 4,503 (58.8%) | 2,102 (18.3%) |
| Total | 7,655 (100.0%) | 11,456 (100.0%) |
Real Estate Taxes by Mortgage Status in Asheville
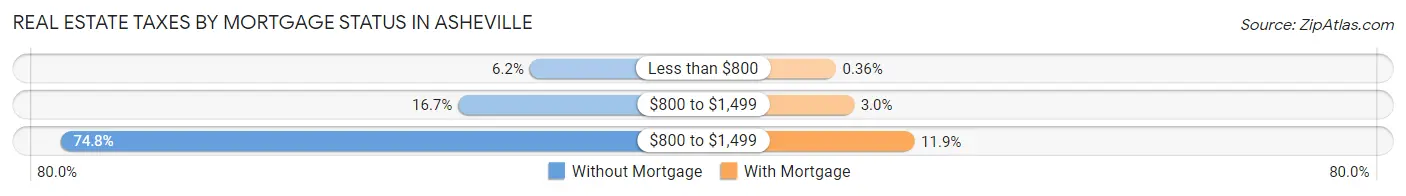
| Property Taxes | Without Mortgage | With Mortgage |
| Less than $800 | 474 (6.2%) | 41 (0.4%) |
| $800 to $1,499 | 1,275 (16.7%) | 346 (3.0%) |
| $800 to $1,499 | 5,724 (74.8%) | 1,357 (11.8%) |
| Total | 7,655 (100.0%) | 11,456 (100.0%) |
Health & Disability in Asheville
Health Insurance Coverage by Age in Asheville
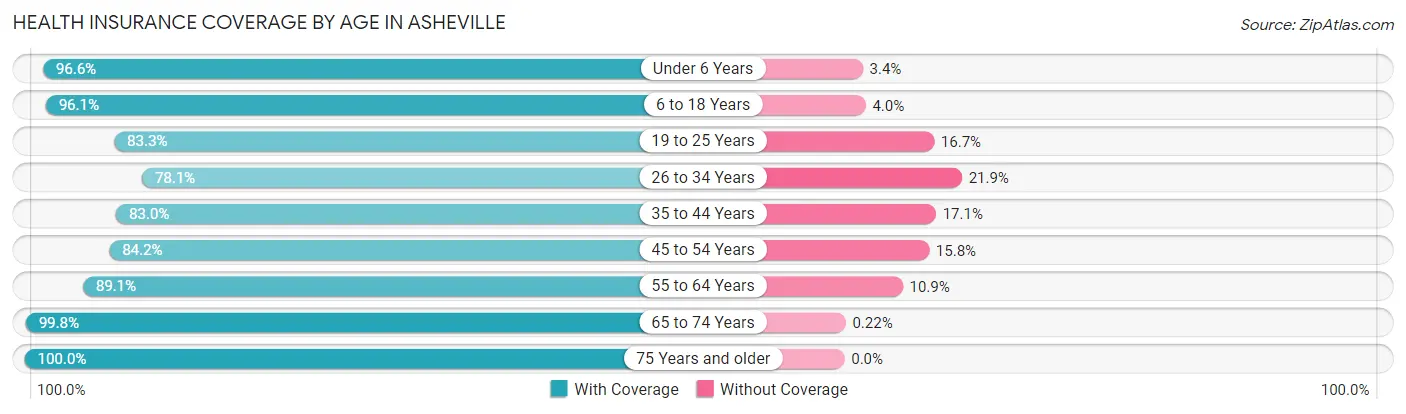
| Age Bracket | With Coverage | Without Coverage |
| Under 6 Years | 4,916 (96.6%) | 174 (3.4%) |
| 6 to 18 Years | 10,734 (96.1%) | 442 (4.0%) |
| 19 to 25 Years | 6,625 (83.3%) | 1,329 (16.7%) |
| 26 to 34 Years | 11,405 (78.1%) | 3,197 (21.9%) |
| 35 to 44 Years | 11,013 (83.0%) | 2,263 (17.1%) |
| 45 to 54 Years | 10,169 (84.2%) | 1,905 (15.8%) |
| 55 to 64 Years | 9,271 (89.1%) | 1,129 (10.9%) |
| 65 to 74 Years | 9,926 (99.8%) | 22 (0.2%) |
| 75 Years and older | 7,376 (100.0%) | 0 (0.0%) |
| Total | 81,435 (88.6%) | 10,461 (11.4%) |
Health Insurance Coverage by Citizenship Status in Asheville
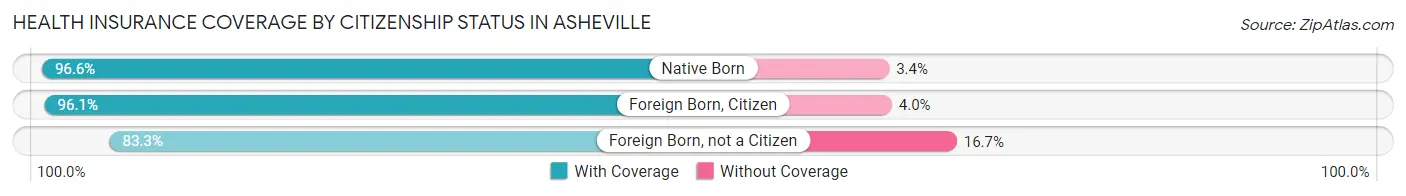
| Citizenship Status | With Coverage | Without Coverage |
| Native Born | 4,916 (96.6%) | 174 (3.4%) |
| Foreign Born, Citizen | 10,734 (96.1%) | 442 (4.0%) |
| Foreign Born, not a Citizen | 6,625 (83.3%) | 1,329 (16.7%) |
Health Insurance Coverage by Household Income in Asheville
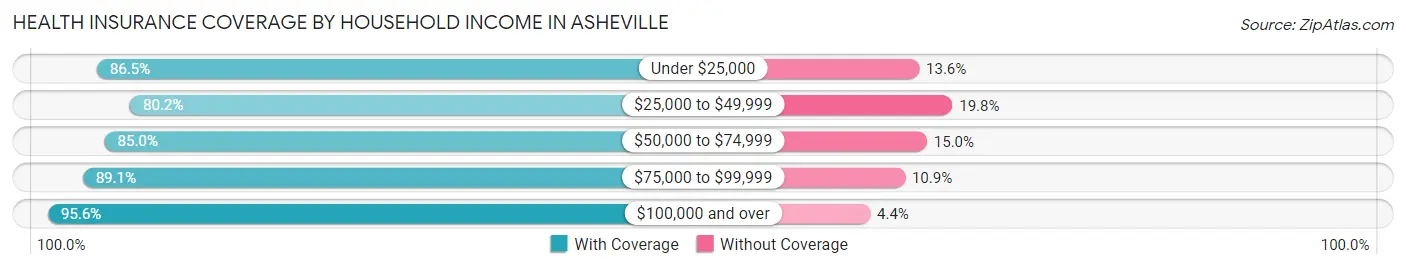
| Household Income | With Coverage | Without Coverage |
| Under $25,000 | 8,872 (86.5%) | 1,391 (13.6%) |
| $25,000 to $49,999 | 14,800 (80.2%) | 3,645 (19.8%) |
| $50,000 to $74,999 | 13,903 (85.0%) | 2,454 (15.0%) |
| $75,000 to $99,999 | 11,412 (89.1%) | 1,396 (10.9%) |
| $100,000 and over | 30,793 (95.6%) | 1,406 (4.4%) |
Public vs Private Health Insurance Coverage by Age in Asheville
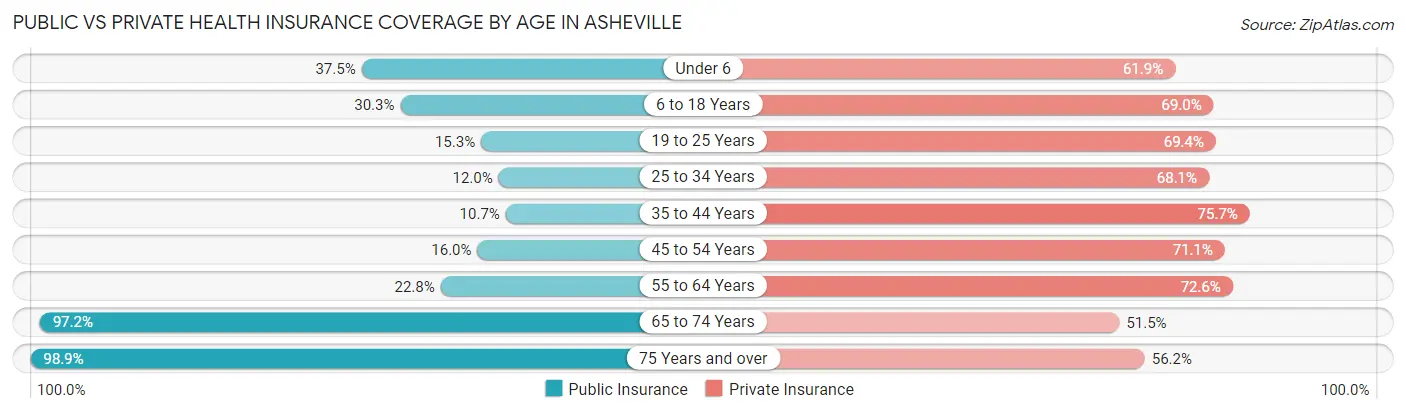
| Age Bracket | Public Insurance | Private Insurance |
| Under 6 | 1,907 (37.5%) | 3,148 (61.9%) |
| 6 to 18 Years | 3,383 (30.3%) | 7,712 (69.0%) |
| 19 to 25 Years | 1,216 (15.3%) | 5,521 (69.4%) |
| 25 to 34 Years | 1,756 (12.0%) | 9,949 (68.1%) |
| 35 to 44 Years | 1,422 (10.7%) | 10,050 (75.7%) |
| 45 to 54 Years | 1,927 (16.0%) | 8,582 (71.1%) |
| 55 to 64 Years | 2,371 (22.8%) | 7,545 (72.6%) |
| 65 to 74 Years | 9,668 (97.2%) | 5,127 (51.5%) |
| 75 Years and over | 7,296 (98.9%) | 4,148 (56.2%) |
| Total | 30,946 (33.7%) | 61,782 (67.2%) |
Disability Status by Sex by Age in Asheville
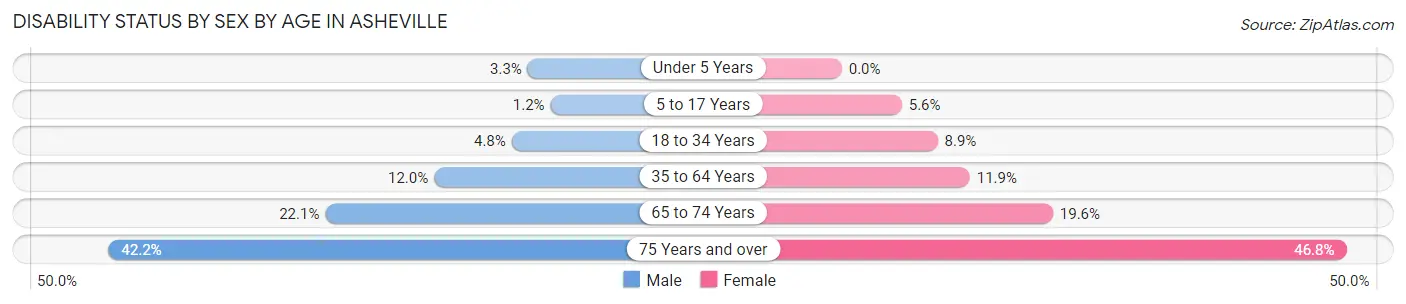
| Age Bracket | Male | Female |
| Under 5 Years | 71 (3.3%) | 0 (0.0%) |
| 5 to 17 Years | 75 (1.2%) | 280 (5.6%) |
| 18 to 34 Years | 536 (4.8%) | 1,071 (8.9%) |
| 35 to 64 Years | 2,079 (12.0%) | 2,189 (11.9%) |
| 65 to 74 Years | 1,012 (22.1%) | 1,052 (19.6%) |
| 75 Years and over | 1,143 (42.2%) | 2,186 (46.8%) |
Disability Class by Sex by Age in Asheville
Disability Class: Hearing Difficulty
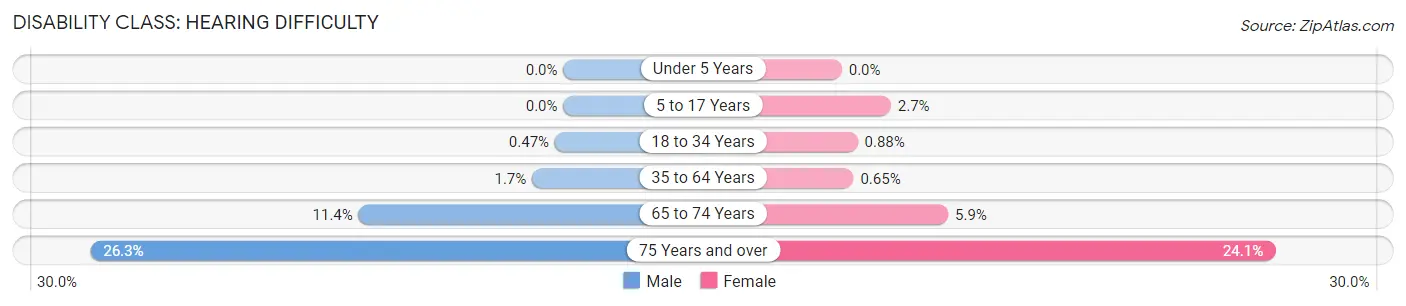
| Age Bracket | Male | Female |
| Under 5 Years | 0 (0.0%) | 0 (0.0%) |
| 5 to 17 Years | 0 (0.0%) | 137 (2.7%) |
| 18 to 34 Years | 53 (0.5%) | 106 (0.9%) |
| 35 to 64 Years | 301 (1.7%) | 119 (0.6%) |
| 65 to 74 Years | 522 (11.4%) | 318 (5.9%) |
| 75 Years and over | 713 (26.3%) | 1,126 (24.1%) |
Disability Class: Vision Difficulty
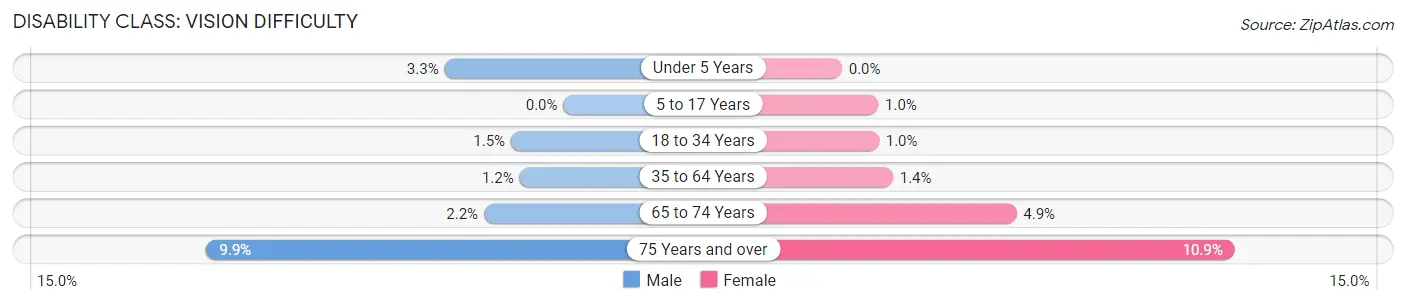
| Age Bracket | Male | Female |
| Under 5 Years | 71 (3.3%) | 0 (0.0%) |
| 5 to 17 Years | 0 (0.0%) | 51 (1.0%) |
| 18 to 34 Years | 163 (1.5%) | 124 (1.0%) |
| 35 to 64 Years | 212 (1.2%) | 262 (1.4%) |
| 65 to 74 Years | 101 (2.2%) | 261 (4.9%) |
| 75 Years and over | 269 (9.9%) | 511 (10.9%) |
Disability Class: Cognitive Difficulty
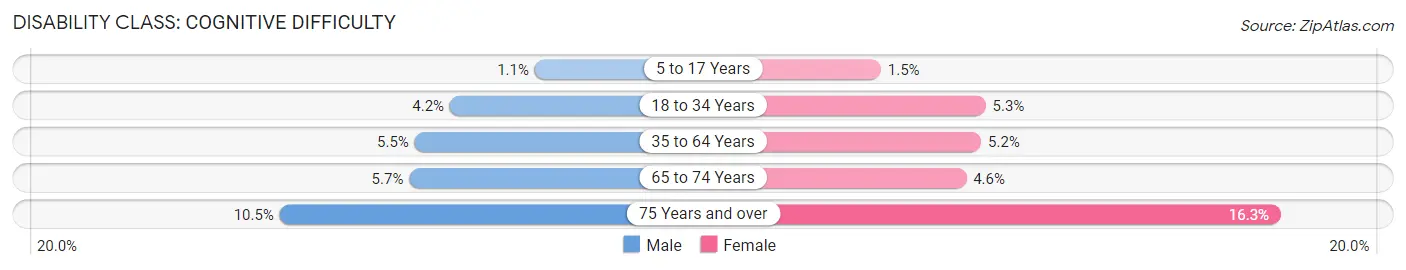
| Age Bracket | Male | Female |
| 5 to 17 Years | 66 (1.1%) | 73 (1.5%) |
| 18 to 34 Years | 470 (4.2%) | 643 (5.3%) |
| 35 to 64 Years | 957 (5.5%) | 953 (5.2%) |
| 65 to 74 Years | 262 (5.7%) | 248 (4.6%) |
| 75 Years and over | 285 (10.5%) | 761 (16.3%) |
Disability Class: Ambulatory Difficulty
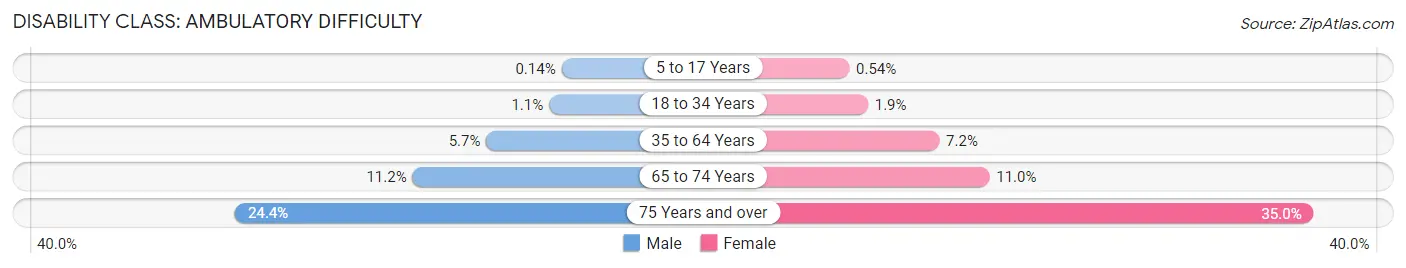
| Age Bracket | Male | Female |
| 5 to 17 Years | 9 (0.1%) | 27 (0.5%) |
| 18 to 34 Years | 118 (1.1%) | 232 (1.9%) |
| 35 to 64 Years | 990 (5.7%) | 1,332 (7.2%) |
| 65 to 74 Years | 513 (11.2%) | 588 (11.0%) |
| 75 Years and over | 660 (24.4%) | 1,635 (35.0%) |
Disability Class: Self-Care Difficulty
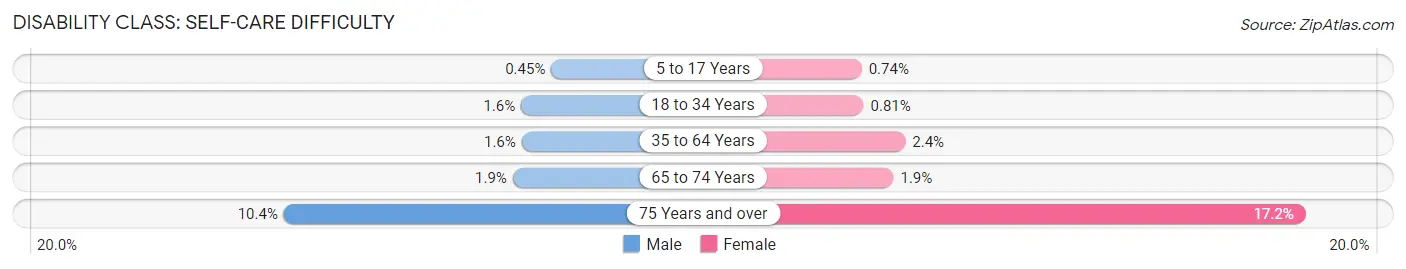
| Age Bracket | Male | Female |
| 5 to 17 Years | 28 (0.4%) | 37 (0.7%) |
| 18 to 34 Years | 175 (1.6%) | 97 (0.8%) |
| 35 to 64 Years | 269 (1.5%) | 434 (2.4%) |
| 65 to 74 Years | 86 (1.9%) | 103 (1.9%) |
| 75 Years and over | 281 (10.4%) | 804 (17.2%) |
Technology Access in Asheville
Computing Device Access in Asheville
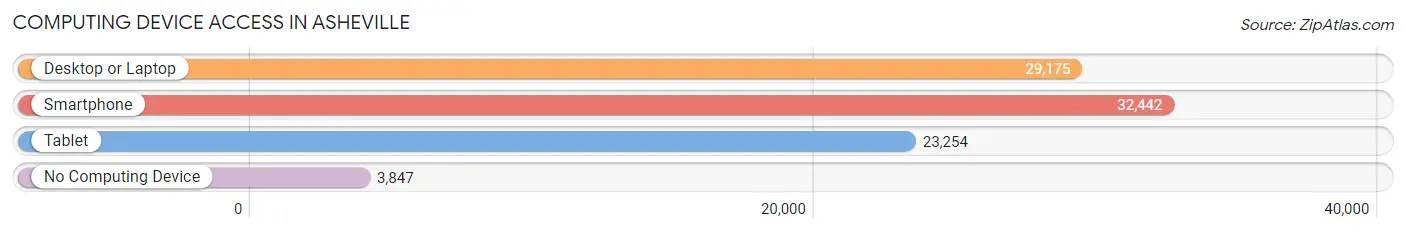
| Device Type | # Households | % Households |
| Desktop or Laptop | 29,175 | 76.3% |
| Smartphone | 32,442 | 84.9% |
| Tablet | 23,254 | 60.8% |
| No Computing Device | 3,847 | 10.1% |
| Total | 38,229 | 100.0% |
Internet Access in Asheville
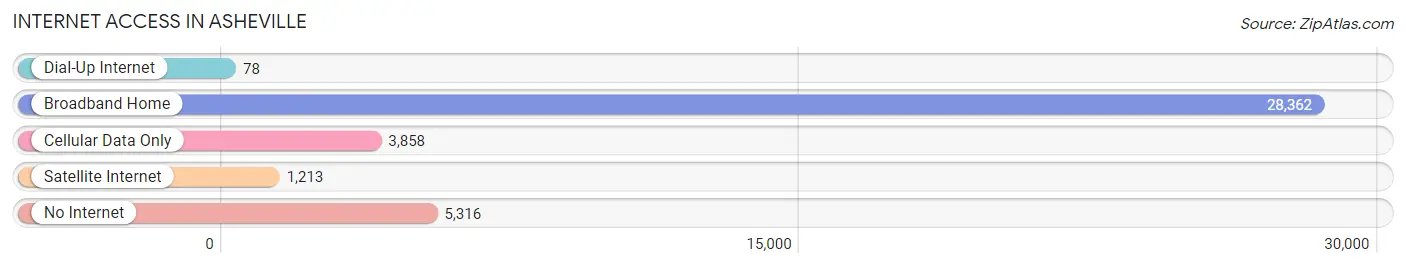
| Internet Type | # Households | % Households |
| Dial-Up Internet | 78 | 0.2% |
| Broadband Home | 28,362 | 74.2% |
| Cellular Data Only | 3,858 | 10.1% |
| Satellite Internet | 1,213 | 3.2% |
| No Internet | 5,316 | 13.9% |
| Total | 38,229 | 100.0% |
Asheville Summary
Asheville, North Carolina is a city located in the Blue Ridge Mountains of western North Carolina. It is the largest city in the western part of the state and the 12th largest city in the state. Asheville is known for its vibrant arts and culture, outdoor recreation, and its unique architecture.
Geography
Asheville is located in the Blue Ridge Mountains of western North Carolina, at the confluence of the French Broad and Swannanoa rivers. The city is situated at an elevation of 2,134 feet (650 m) above sea level. The city is surrounded by the Pisgah National Forest and the Great Smoky Mountains National Park. The city is located in Buncombe County, and is the county seat.
The city has a total area of 45.3 square miles (117.3 km2), of which 44.9 square miles (116.3 km2) is land and 0.4 square miles (1.0 km2) is water. The city is located in the Appalachian Mountains, and is surrounded by the Pisgah National Forest and the Great Smoky Mountains National Park.
Economy
Asheville is a major economic center in western North Carolina. The city is home to a variety of industries, including manufacturing, healthcare, tourism, and technology. The city is also home to a number of major employers, including the Mission Health System, the Buncombe County Schools, the City of Asheville, and the Biltmore Estate.
The city is also home to a number of major tourist attractions, including the Biltmore Estate, the Blue Ridge Parkway, and the Great Smoky Mountains National Park. Tourism is a major contributor to the city's economy, with over 10 million visitors each year.
Demographics
As of the 2010 census, the city had a population of 87,236. The racial makeup of the city was 77.2% White, 15.4% African American, 0.3% Native American, 3.2% Asian, 0.1% Pacific Islander, 1.7% from other races, and 2.1% from two or more races. Hispanic or Latino of any race were 5.7% of the population.
The median income for a household in the city was $41,845, and the median income for a family was $50,945. The per capita income for the city was $25,845. About 14.2% of families and 18.3% of the population were below the poverty line, including 25.7% of those under age 18 and 11.2% of those age 65 or over.
Asheville is a diverse city, with a variety of cultures and backgrounds. The city is home to a large number of immigrants, including those from Latin America, Asia, and Africa. The city is also home to a large number of LGBT residents.
Conclusion
Asheville, North Carolina is a vibrant city located in the Blue Ridge Mountains of western North Carolina. The city is known for its vibrant arts and culture, outdoor recreation, and its unique architecture. The city is home to a variety of industries, including manufacturing, healthcare, tourism, and technology. The city is also home to a number of major tourist attractions, including the Biltmore Estate, the Blue Ridge Parkway, and the Great Smoky Mountains National Park. The city has a population of 87,236, and is a diverse city, with a variety of cultures and backgrounds.
Common Questions
What is Per Capita Income in Asheville?
Per Capita income in Asheville is $40,899.
What is the Median Family Income in Asheville?
Median Family Income in Asheville is $87,626.
What is the Median Household income in Asheville?
Median Household Income in Asheville is $63,810.
What is Income or Wage Gap in Asheville?
Income or Wage Gap in Asheville is 11.4%.
Women in Asheville earn 88.6 cents for every dollar earned by a man.
What is Family Income Deficit in Asheville?
Family Income Deficit in Asheville is $8,216.
Families that are below poverty line in Asheville earn $8,216 less on average than the poverty threshold level.
What is Inequality or Gini Index in Asheville?
Inequality or Gini Index in Asheville is 0.49.
What is the Total Population of Asheville?
Total Population of Asheville is 93,695.
What is the Total Male Population of Asheville?
Total Male Population of Asheville is 45,056.
What is the Total Female Population of Asheville?
Total Female Population of Asheville is 48,639.
What is the Ratio of Males per 100 Females in Asheville?
There are 92.63 Males per 100 Females in Asheville.
What is the Ratio of Females per 100 Males in Asheville?
There are 107.95 Females per 100 Males in Asheville.
What is the Median Population Age in Asheville?
Median Population Age in Asheville is 40.5 Years.
What is the Average Family Size in Asheville
Average Family Size in Asheville is 3.1 People.
What is the Average Household Size in Asheville
Average Household Size in Asheville is 2.4 People.
How Large is the Labor Force in Asheville?
There are 50,503 People in the Labor Forcein in Asheville.
What is the Percentage of People in the Labor Force in Asheville?
63.4% of People are in the Labor Force in Asheville.
What is the Unemployment Rate in Asheville?
Unemployment Rate in Asheville is 4.1%.