Five Points, NC Map & Demographics
Five Points Map
Five Points Overview
$33,810
PER CAPITA INCOME
$103,553
AVG FAMILY INCOME
53.0%
WAGE / INCOME GAP [ % ]
47.0¢/ $1
WAGE / INCOME GAP [ $ ]
0.51
INEQUALITY / GINI INDEX
1,136
TOTAL POPULATION
482
MALE POPULATION
654
FEMALE POPULATION
73.70
MALES / 100 FEMALES
135.68
FEMALES / 100 MALES
37.4
MEDIAN AGE
3.5
AVG FAMILY SIZE
2.9
AVG HOUSEHOLD SIZE
630
LABOR FORCE [ PEOPLE ]
66.0%
PERCENT IN LABOR FORCE
7.8%
UNEMPLOYMENT RATE
Income in Five Points
Income Overview in Five Points
| Characteristic | Number | Measure |
| Per Capita Income | 1,136 | $33,810 |
| Median Family Income | 276 | $103,553 |
| Mean Family Income | 276 | $120,795 |
| Median Household Income | 395 | $0 |
| Mean Household Income | 395 | $95,032 |
| Income Deficit | 276 | $0 |
| Wage / Income Gap (%) | 1,136 | 52.98% |
| Wage / Income Gap ($) | 1,136 | 47.02¢ per $1 |
| Gini / Inequality Index | 1,136 | 0.51 |
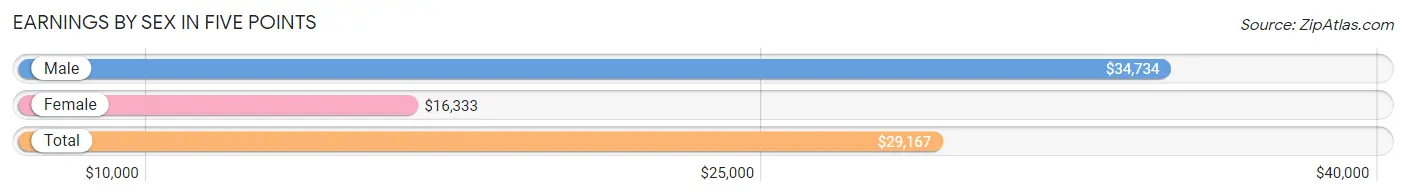
Earnings by Sex in Five Points
Average Earnings in Five Points are $29,167, $34,734 for men and $16,333 for women, a difference of 53.0%.
| Sex | Number | Average Earnings |
| Male | 300 (48.2%) | $34,734 |
| Female | 322 (51.8%) | $16,333 |
| Total | 622 (100.0%) | $29,167 |
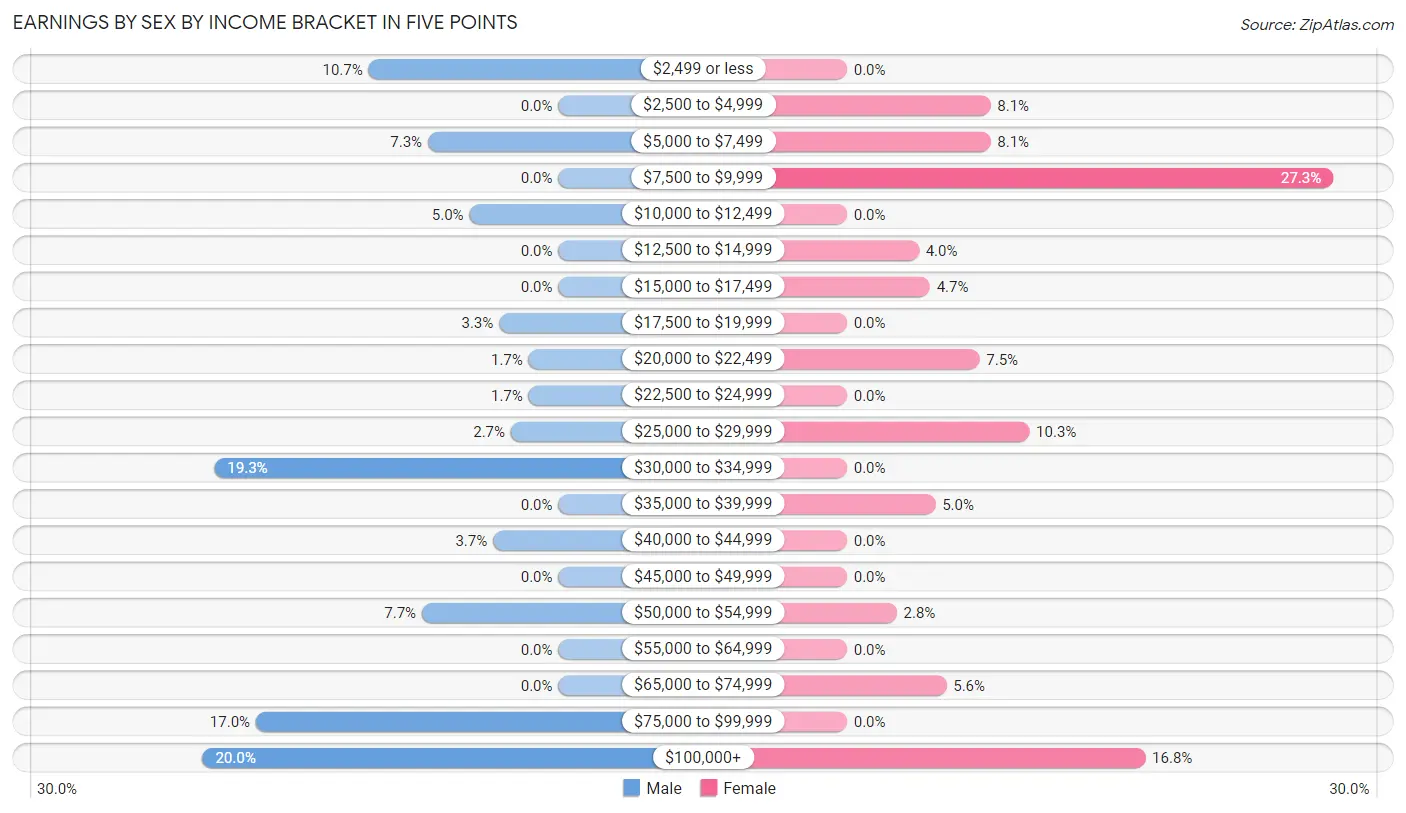
Earnings by Sex by Income Bracket in Five Points
The most common earnings brackets in Five Points are $100,000+ for men (60 | 20.0%) and $7,500 to $9,999 for women (88 | 27.3%).
| Income | Male | Female |
| $2,499 or less | 32 (10.7%) | 0 (0.0%) |
| $2,500 to $4,999 | 0 (0.0%) | 26 (8.1%) |
| $5,000 to $7,499 | 22 (7.3%) | 26 (8.1%) |
| $7,500 to $9,999 | 0 (0.0%) | 88 (27.3%) |
| $10,000 to $12,499 | 15 (5.0%) | 0 (0.0%) |
| $12,500 to $14,999 | 0 (0.0%) | 13 (4.0%) |
| $15,000 to $17,499 | 0 (0.0%) | 15 (4.7%) |
| $17,500 to $19,999 | 10 (3.3%) | 0 (0.0%) |
| $20,000 to $22,499 | 5 (1.7%) | 24 (7.4%) |
| $22,500 to $24,999 | 5 (1.7%) | 0 (0.0%) |
| $25,000 to $29,999 | 8 (2.7%) | 33 (10.2%) |
| $30,000 to $34,999 | 58 (19.3%) | 0 (0.0%) |
| $35,000 to $39,999 | 0 (0.0%) | 16 (5.0%) |
| $40,000 to $44,999 | 11 (3.7%) | 0 (0.0%) |
| $45,000 to $49,999 | 0 (0.0%) | 0 (0.0%) |
| $50,000 to $54,999 | 23 (7.7%) | 9 (2.8%) |
| $55,000 to $64,999 | 0 (0.0%) | 0 (0.0%) |
| $65,000 to $74,999 | 0 (0.0%) | 18 (5.6%) |
| $75,000 to $99,999 | 51 (17.0%) | 0 (0.0%) |
| $100,000+ | 60 (20.0%) | 54 (16.8%) |
| Total | 300 (100.0%) | 322 (100.0%) |
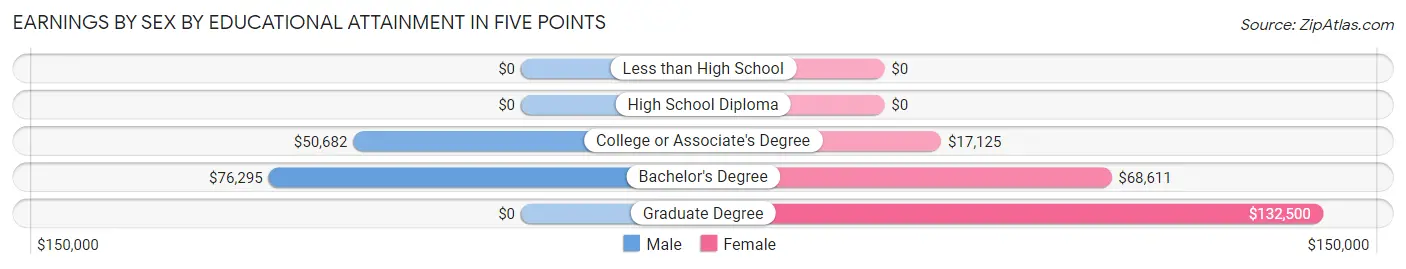
Earnings by Sex by Educational Attainment in Five Points
Average earnings in Five Points are $50,795 for men and $29,053 for women, a difference of 42.8%. Men with an educational attainment of bachelor's degree enjoy the highest average annual earnings of $76,295, while those with college or associate's degree education earn the least with $50,682. Women with an educational attainment of graduate degree earn the most with the average annual earnings of $132,500, while those with college or associate's degree education have the smallest earnings of $17,125.
| Educational Attainment | Male Income | Female Income |
| Less than High School | - | - |
| High School Diploma | - | - |
| College or Associate's Degree | $50,682 | $17,125 |
| Bachelor's Degree | $76,295 | $68,611 |
| Graduate Degree | - | - |
| Total | $50,795 | $29,053 |
Family Income in Five Points
Family Income Brackets in Five Points
According to the Five Points family income data, there are 58 families falling into the $100,000 to $149,999 income range, which is the most common income bracket and makes up 21.0% of all families. Conversely, the $15,000 to $24,999 income bracket is the least frequent group with only 6 families (2.2%) belonging to this category.
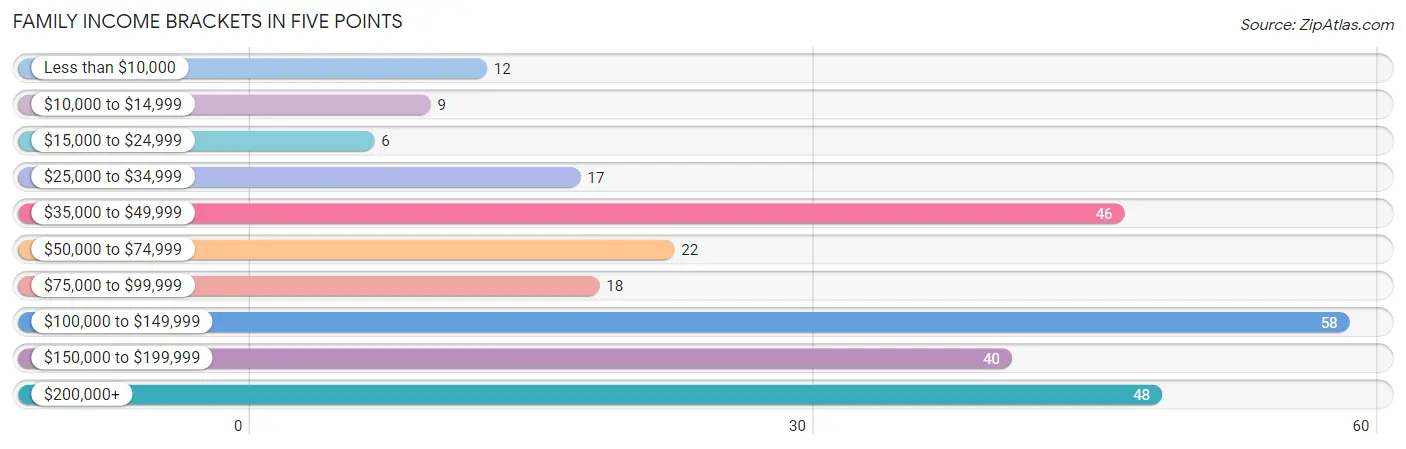
| Income Bracket | # Families | % Families |
| Less than $10,000 | 12 | 4.3% |
| $10,000 to $14,999 | 9 | 3.3% |
| $15,000 to $24,999 | 6 | 2.2% |
| $25,000 to $34,999 | 17 | 6.2% |
| $35,000 to $49,999 | 46 | 16.7% |
| $50,000 to $74,999 | 22 | 8.0% |
| $75,000 to $99,999 | 18 | 6.5% |
| $100,000 to $149,999 | 58 | 21.0% |
| $150,000 to $199,999 | 40 | 14.5% |
| $200,000+ | 48 | 17.4% |
Family Income by Famaliy Size in Five Points
4-person families (30 | 10.9%) account for the highest median family income in Five Points with $183,269 per family, while 4-person families (30 | 10.9%) have the highest median income of $45,817 per family member.
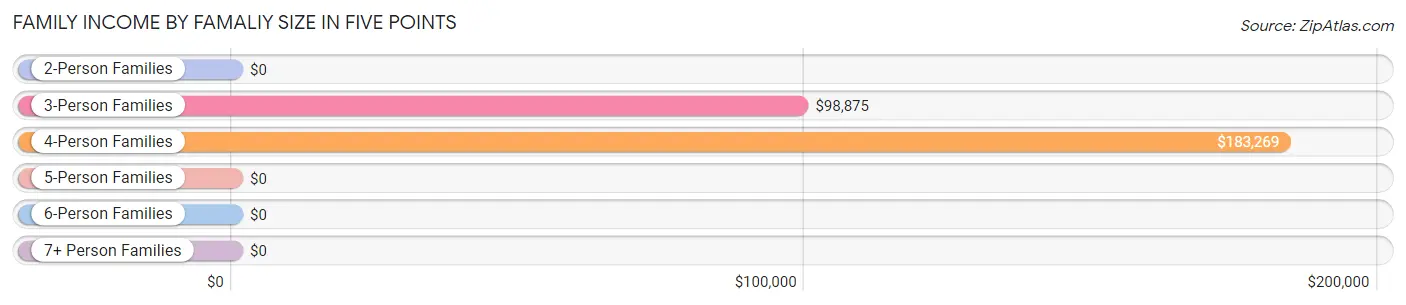
| Income Bracket | # Families | Median Income |
| 2-Person Families | 150 (54.3%) | $0 |
| 3-Person Families | 45 (16.3%) | $98,875 |
| 4-Person Families | 30 (10.9%) | $183,269 |
| 5-Person Families | 38 (13.8%) | $0 |
| 6-Person Families | 13 (4.7%) | $0 |
| 7+ Person Families | 0 (0.0%) | $0 |
| Total | 276 (100.0%) | $103,553 |
Family Income by Number of Earners in Five Points
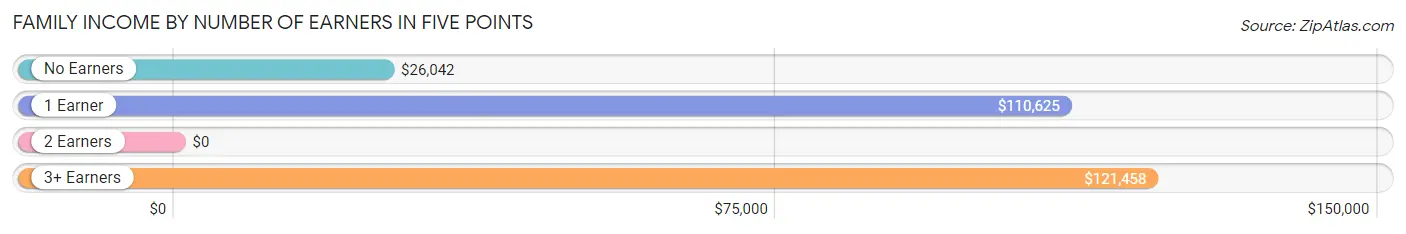
| Number of Earners | # Families | Median Income |
| No Earners | 59 (21.4%) | $26,042 |
| 1 Earner | 72 (26.1%) | $110,625 |
| 2 Earners | 92 (33.3%) | $0 |
| 3+ Earners | 53 (19.2%) | $121,458 |
| Total | 276 (100.0%) | $103,553 |
Household Income in Five Points
Household Income Brackets in Five Points
With 79 households falling in the category, the $35,000 to $49,999 income range is the most frequent in Five Points, accounting for 20.0% of all households. In contrast, only 6 households (1.5%) fall into the $15,000 to $24,999 income bracket, making it the least populous group.
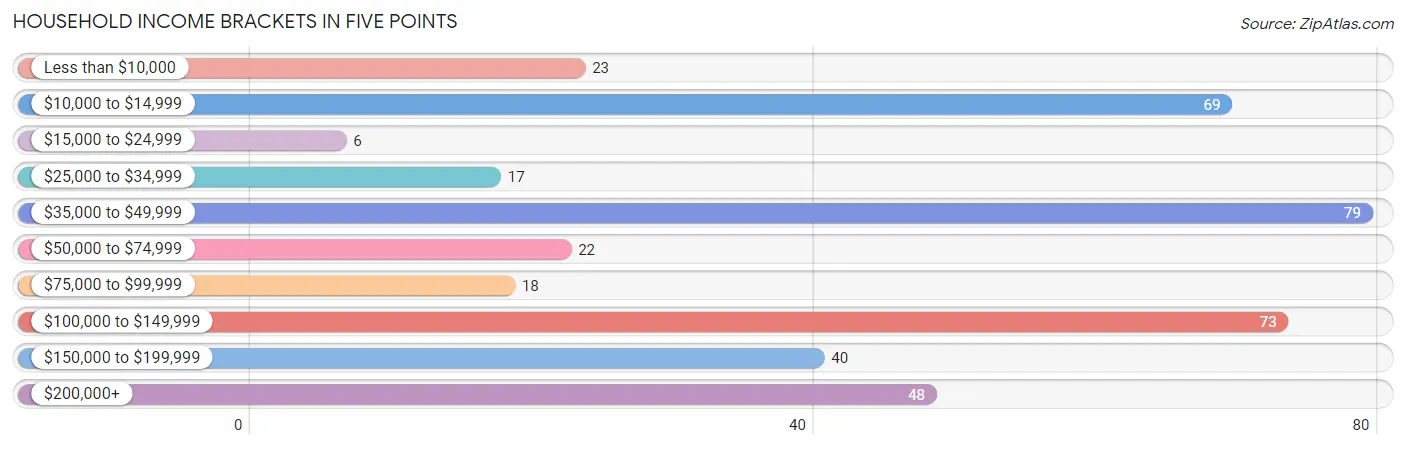
| Income Bracket | # Households | % Households |
| Less than $10,000 | 23 | 5.8% |
| $10,000 to $14,999 | 69 | 17.5% |
| $15,000 to $24,999 | 6 | 1.5% |
| $25,000 to $34,999 | 17 | 4.3% |
| $35,000 to $49,999 | 79 | 20.0% |
| $50,000 to $74,999 | 22 | 5.6% |
| $75,000 to $99,999 | 18 | 4.6% |
| $100,000 to $149,999 | 73 | 18.5% |
| $150,000 to $199,999 | 40 | 10.1% |
| $200,000+ | 48 | 12.2% |
Household Income by Householder Age in Five Points
The median household income in Five Points is $0, with the highest median household income of $110,781 found in the 25 to 44 years age bracket for the primary householder. A total of 109 households (27.6%) fall into this category. Meanwhile, the 15 to 24 years age bracket for the primary householder has the lowest median household income of $0, with 22 households (5.6%) in this group.
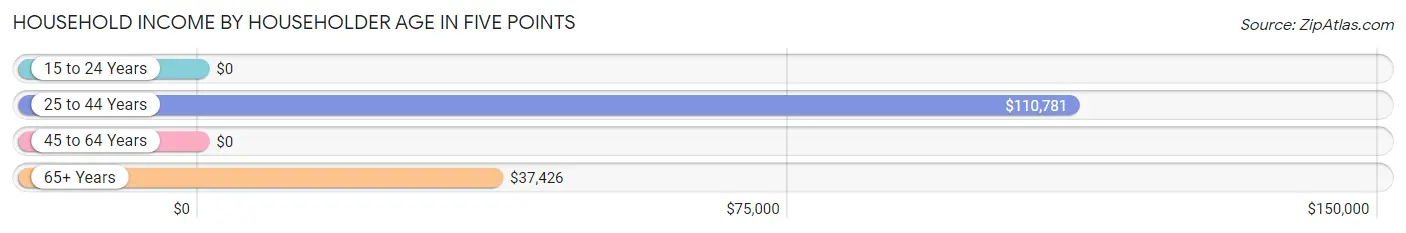
| Income Bracket | # Households | Median Income |
| 15 to 24 Years | 22 (5.6%) | $0 |
| 25 to 44 Years | 109 (27.6%) | $110,781 |
| 45 to 64 Years | 173 (43.8%) | $0 |
| 65+ Years | 91 (23.0%) | $37,426 |
| Total | 395 (100.0%) | $0 |
Poverty in Five Points
Income Below Poverty by Sex and Age in Five Points
With 6.2% poverty level for males and 18.0% for females among the residents of Five Points, 65 to 74 year old males and 55 to 64 year old females are the most vulnerable to poverty, with 12 males (21.0%) and 80 females (59.3%) in their respective age groups living below the poverty level.
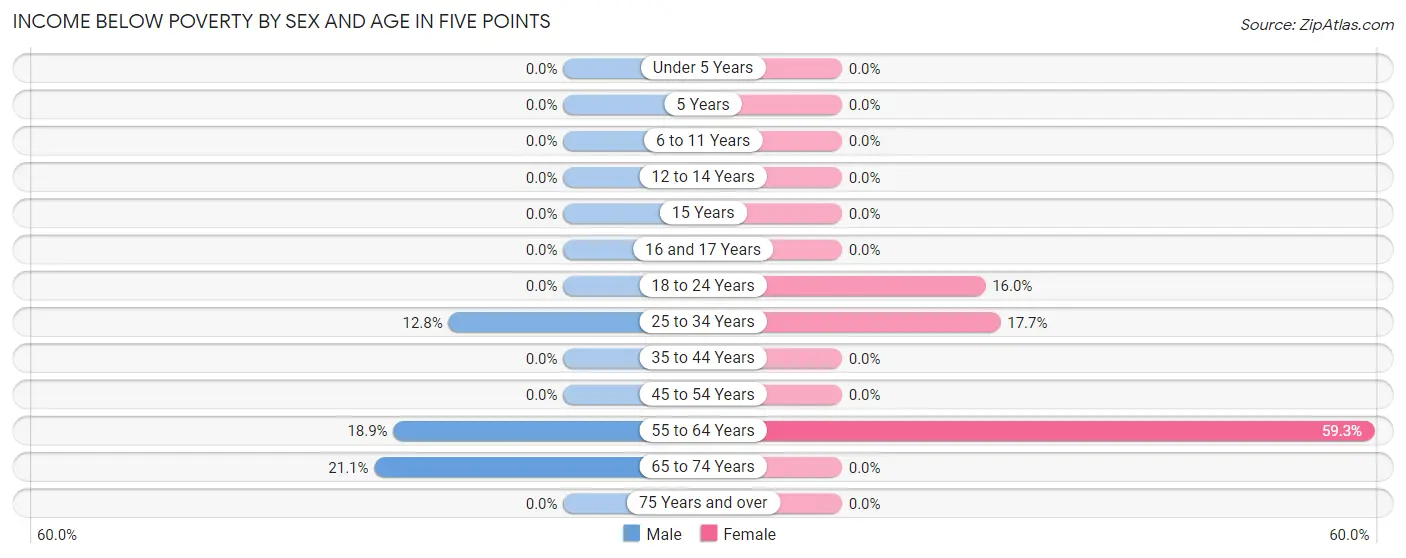
| Age Bracket | Male | Female |
| Under 5 Years | 0 (0.0%) | 0 (0.0%) |
| 5 Years | 0 (0.0%) | 0 (0.0%) |
| 6 to 11 Years | 0 (0.0%) | 0 (0.0%) |
| 12 to 14 Years | 0 (0.0%) | 0 (0.0%) |
| 15 Years | 0 (0.0%) | 0 (0.0%) |
| 16 and 17 Years | 0 (0.0%) | 0 (0.0%) |
| 18 to 24 Years | 0 (0.0%) | 23 (16.0%) |
| 25 to 34 Years | 11 (12.8%) | 15 (17.6%) |
| 35 to 44 Years | 0 (0.0%) | 0 (0.0%) |
| 45 to 54 Years | 0 (0.0%) | 0 (0.0%) |
| 55 to 64 Years | 7 (18.9%) | 80 (59.3%) |
| 65 to 74 Years | 12 (21.0%) | 0 (0.0%) |
| 75 Years and over | 0 (0.0%) | 0 (0.0%) |
| Total | 30 (6.2%) | 118 (18.0%) |
Income Above Poverty by Sex and Age in Five Points
According to the poverty statistics in Five Points, males aged under 5 years and females aged under 5 years are the age groups that are most secure financially, with 100.0% of males and 100.0% of females in these age groups living above the poverty line.
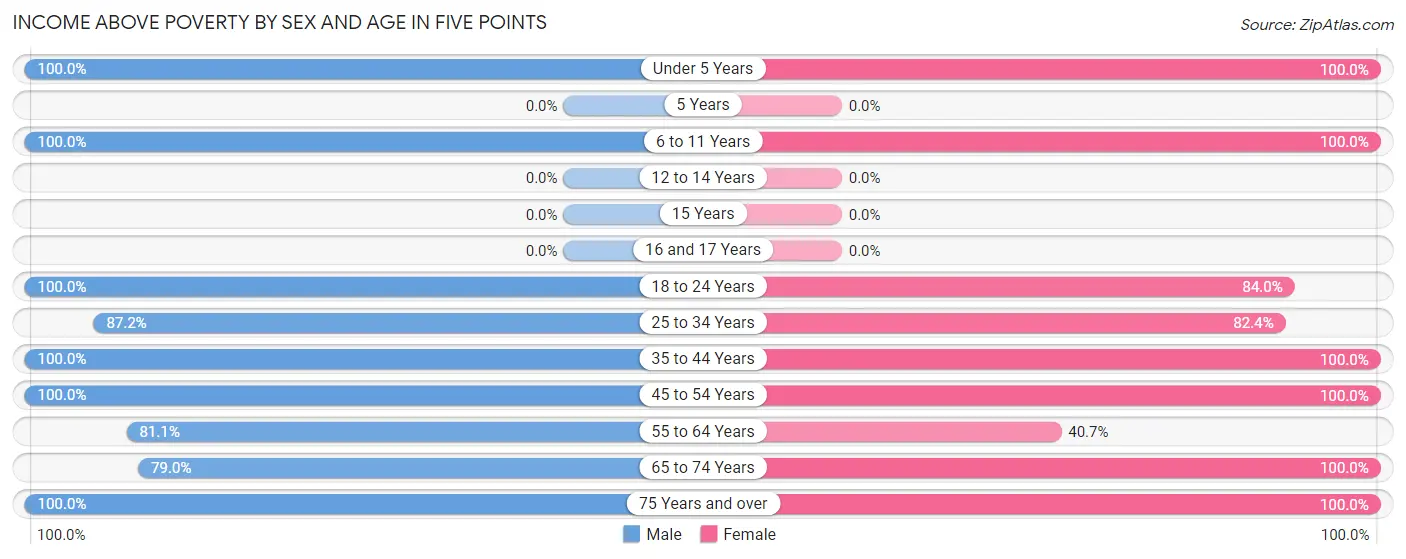
| Age Bracket | Male | Female |
| Under 5 Years | 57 (100.0%) | 29 (100.0%) |
| 5 Years | 0 (0.0%) | 0 (0.0%) |
| 6 to 11 Years | 30 (100.0%) | 65 (100.0%) |
| 12 to 14 Years | 0 (0.0%) | 0 (0.0%) |
| 15 Years | 0 (0.0%) | 0 (0.0%) |
| 16 and 17 Years | 0 (0.0%) | 0 (0.0%) |
| 18 to 24 Years | 50 (100.0%) | 121 (84.0%) |
| 25 to 34 Years | 75 (87.2%) | 70 (82.4%) |
| 35 to 44 Years | 64 (100.0%) | 57 (100.0%) |
| 45 to 54 Years | 87 (100.0%) | 62 (100.0%) |
| 55 to 64 Years | 30 (81.1%) | 55 (40.7%) |
| 65 to 74 Years | 45 (78.9%) | 64 (100.0%) |
| 75 Years and over | 14 (100.0%) | 13 (100.0%) |
| Total | 452 (93.8%) | 536 (82.0%) |
Income Below Poverty Among Married-Couple Families in Five Points
The poverty statistics for married-couple families in Five Points show that 8.7% or 21 of the total 240 families live below the poverty line. Families with no children have the highest poverty rate of 12.3%, comprising of 21 families. On the other hand, families with 1 or 2 children have the lowest poverty rate of 0.0%, which includes 0 families.
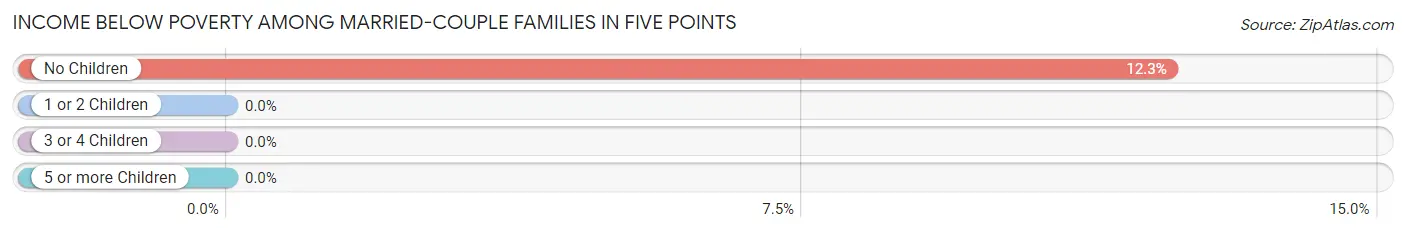
| Children | Above Poverty | Below Poverty |
| No Children | 150 (87.7%) | 21 (12.3%) |
| 1 or 2 Children | 45 (100.0%) | 0 (0.0%) |
| 3 or 4 Children | 24 (100.0%) | 0 (0.0%) |
| 5 or more Children | 0 (0.0%) | 0 (0.0%) |
| Total | 219 (91.2%) | 21 (8.7%) |
Income Below Poverty Among Single-Parent Households in Five Points
| Children | Single Father | Single Mother |
| No Children | 0 (0.0%) | 0 (0.0%) |
| 1 or 2 Children | 0 (0.0%) | 0 (0.0%) |
| 3 or 4 Children | 0 (0.0%) | 0 (0.0%) |
| 5 or more Children | 0 (0.0%) | 0 (0.0%) |
| Total | 0 (0.0%) | 0 (0.0%) |
Income Below Poverty Among Married-Couple vs Single-Parent Households in Five Points
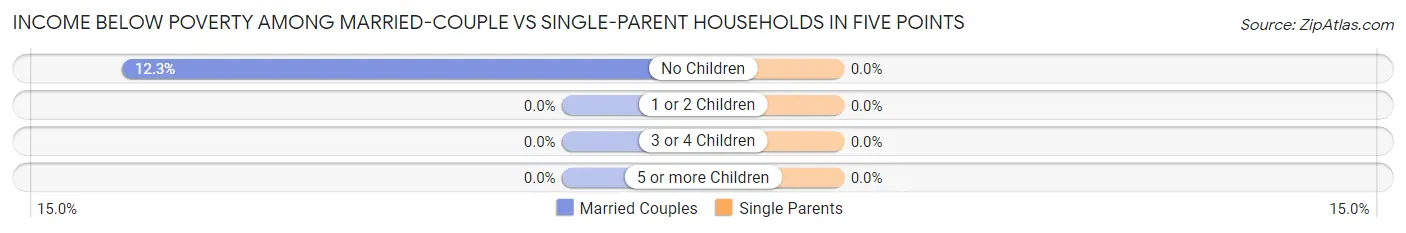
| Children | Married-Couple Families | Single-Parent Households |
| No Children | 21 (12.3%) | 0 (0.0%) |
| 1 or 2 Children | 0 (0.0%) | 0 (0.0%) |
| 3 or 4 Children | 0 (0.0%) | 0 (0.0%) |
| 5 or more Children | 0 (0.0%) | 0 (0.0%) |
| Total | 21 (8.7%) | 0 (0.0%) |
Race in Five Points
The most populous races in Five Points are White / Caucasian (737 | 64.9%), Black / African American (260 | 22.9%), and Hispanic or Latino (60 | 5.3%).
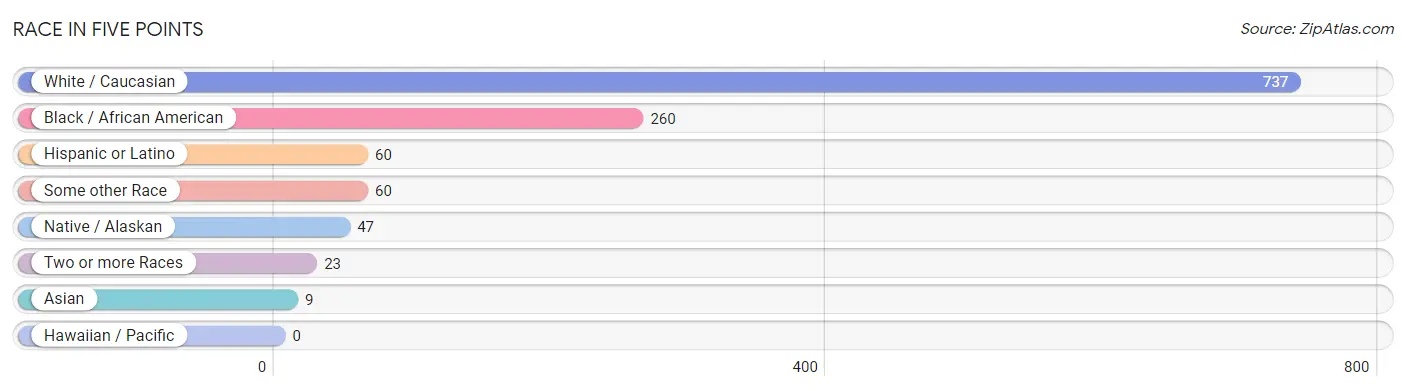
| Race | # Population | % Population |
| Asian | 9 | 0.8% |
| Black / African American | 260 | 22.9% |
| Hawaiian / Pacific | 0 | 0.0% |
| Hispanic or Latino | 60 | 5.3% |
| Native / Alaskan | 47 | 4.1% |
| White / Caucasian | 737 | 64.9% |
| Two or more Races | 23 | 2.0% |
| Some other Race | 60 | 5.3% |
| Total | 1,136 | 100.0% |
Ancestry in Five Points
The most populous ancestries reported in Five Points are English (165 | 14.5%), Irish (113 | 10.0%), Italian (101 | 8.9%), Puerto Rican (60 | 5.3%), and German (43 | 3.8%), together accounting for 42.4% of all Five Points residents.
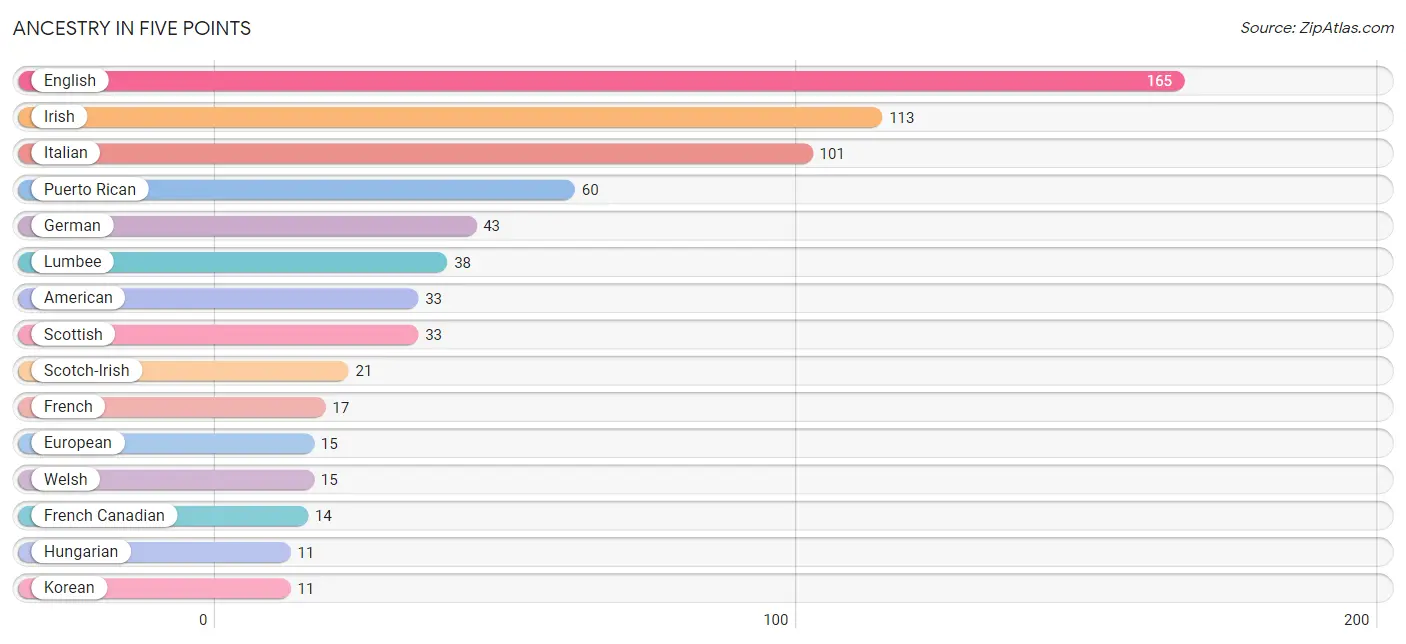
| Ancestry | # Population | % Population |
| American | 33 | 2.9% |
| Burmese | 9 | 0.8% |
| Choctaw | 9 | 0.8% |
| English | 165 | 14.5% |
| European | 15 | 1.3% |
| French | 17 | 1.5% |
| French Canadian | 14 | 1.2% |
| German | 43 | 3.8% |
| Hungarian | 11 | 1.0% |
| Irish | 113 | 10.0% |
| Italian | 101 | 8.9% |
| Korean | 11 | 1.0% |
| Lumbee | 38 | 3.4% |
| Puerto Rican | 60 | 5.3% |
| Scandinavian | 11 | 1.0% |
| Scotch-Irish | 21 | 1.8% |
| Scottish | 33 | 2.9% |
| Welsh | 15 | 1.3% | View All 18 Rows |
Immigrants in Five Points
The most numerous immigrant groups reported in Five Points came from Europe (39 | 3.4%), England (28 | 2.5%), Northern Europe (28 | 2.5%), Germany (11 | 1.0%), and Western Europe (11 | 1.0%), together accounting for 10.3% of all Five Points residents.
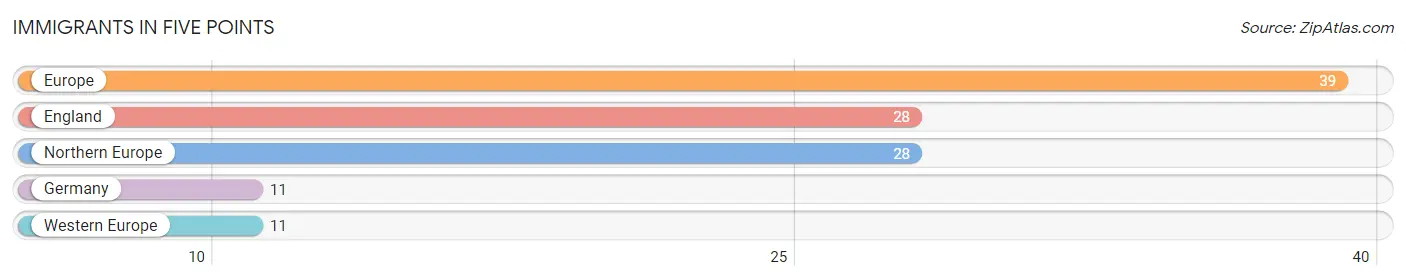
| Immigration Origin | # Population | % Population |
| England | 28 | 2.5% |
| Europe | 39 | 3.4% |
| Germany | 11 | 1.0% |
| Northern Europe | 28 | 2.5% |
| Western Europe | 11 | 1.0% | View All 5 Rows |
Sex and Age in Five Points
Sex and Age in Five Points
The most populous age groups in Five Points are 50 to 54 Years (74 | 15.3%) for men and 20 to 24 Years (116 | 17.7%) for women.
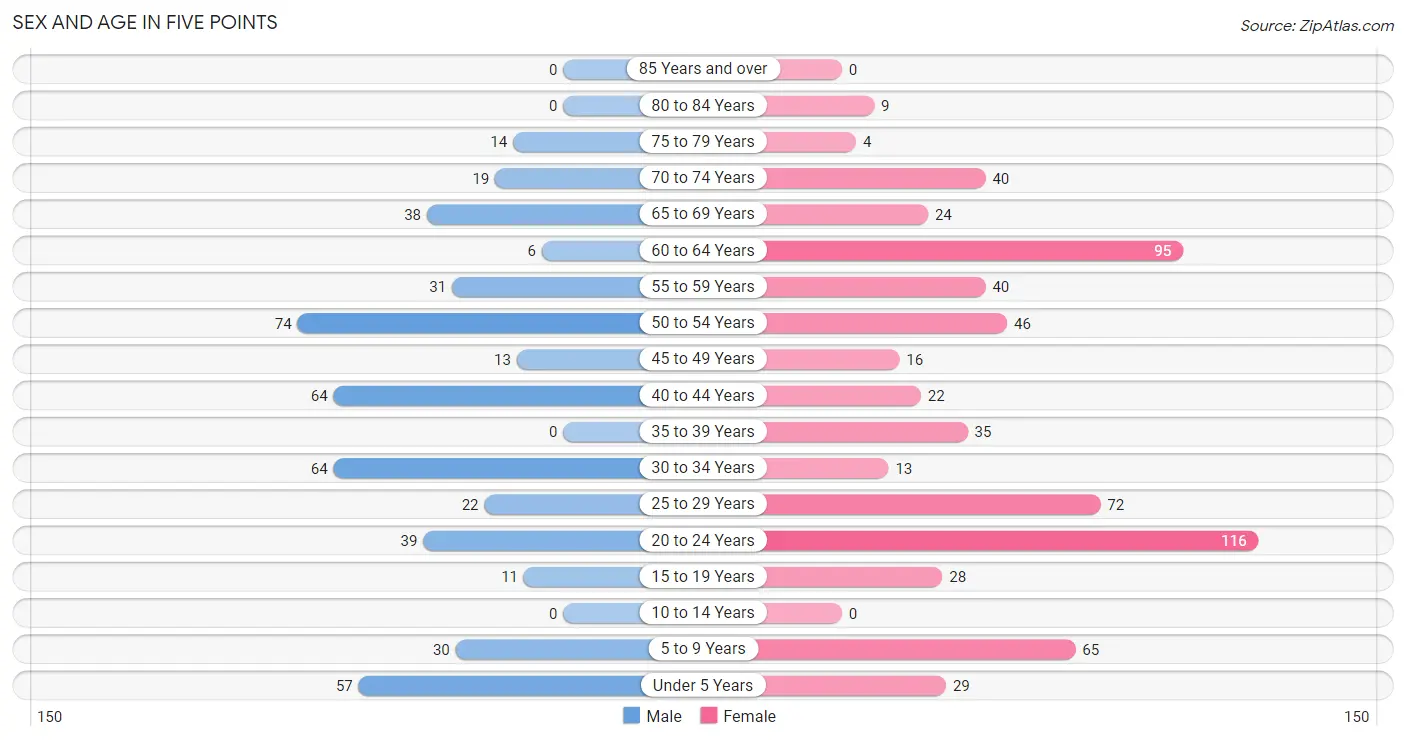
| Age Bracket | Male | Female |
| Under 5 Years | 57 (11.8%) | 29 (4.4%) |
| 5 to 9 Years | 30 (6.2%) | 65 (9.9%) |
| 10 to 14 Years | 0 (0.0%) | 0 (0.0%) |
| 15 to 19 Years | 11 (2.3%) | 28 (4.3%) |
| 20 to 24 Years | 39 (8.1%) | 116 (17.7%) |
| 25 to 29 Years | 22 (4.6%) | 72 (11.0%) |
| 30 to 34 Years | 64 (13.3%) | 13 (2.0%) |
| 35 to 39 Years | 0 (0.0%) | 35 (5.3%) |
| 40 to 44 Years | 64 (13.3%) | 22 (3.4%) |
| 45 to 49 Years | 13 (2.7%) | 16 (2.5%) |
| 50 to 54 Years | 74 (15.3%) | 46 (7.0%) |
| 55 to 59 Years | 31 (6.4%) | 40 (6.1%) |
| 60 to 64 Years | 6 (1.2%) | 95 (14.5%) |
| 65 to 69 Years | 38 (7.9%) | 24 (3.7%) |
| 70 to 74 Years | 19 (3.9%) | 40 (6.1%) |
| 75 to 79 Years | 14 (2.9%) | 4 (0.6%) |
| 80 to 84 Years | 0 (0.0%) | 9 (1.4%) |
| 85 Years and over | 0 (0.0%) | 0 (0.0%) |
| Total | 482 (100.0%) | 654 (100.0%) |
Families and Households in Five Points
Median Family Size in Five Points
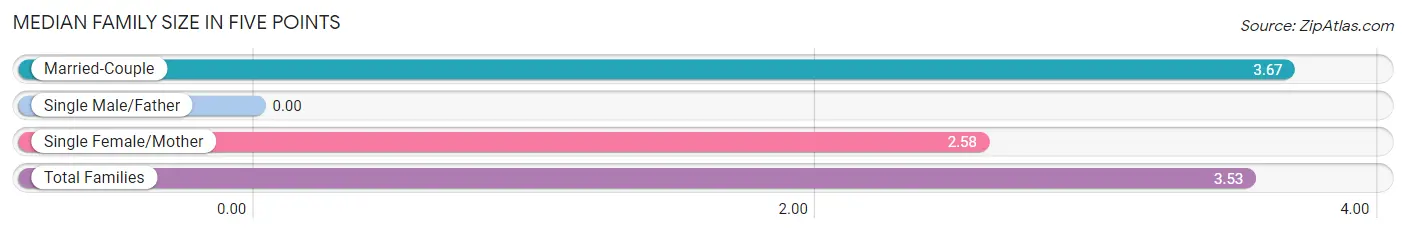
| Family Type | # Families | Family Size |
| Married-Couple | 240 (87.0%) | 3.67 |
| Single Male/Father | 0 (0.0%) | - |
| Single Female/Mother | 36 (13.0%) | 2.58 |
| Total Families | 276 (100.0%) | 3.53 |
Median Household Size in Five Points
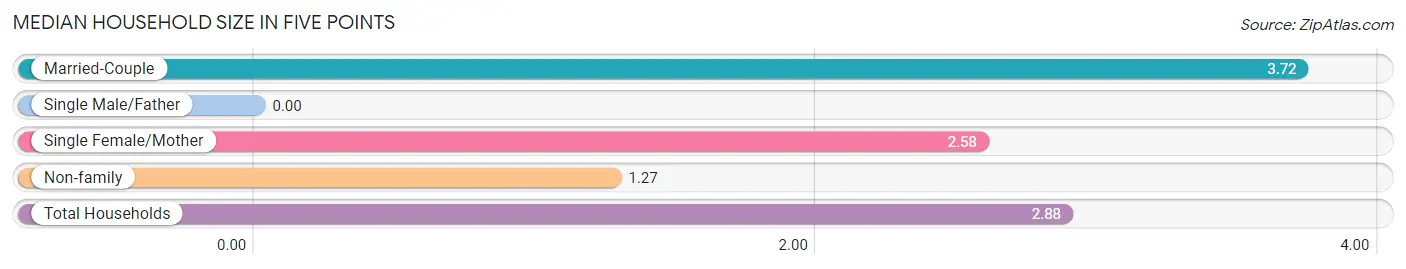
| Household Type | # Households | Household Size |
| Married-Couple | 240 (60.8%) | 3.72 |
| Single Male/Father | 0 (0.0%) | - |
| Single Female/Mother | 36 (9.1%) | 2.58 |
| Non-family | 119 (30.1%) | 1.27 |
| Total Households | 395 (100.0%) | 2.88 |
Household Size by Marriage Status in Five Points
Out of a total of 395 households in Five Points, 276 (69.9%) are family households, while 119 (30.1%) are nonfamily households. The most numerous type of family households are 2-person households, comprising 139, and the most common type of nonfamily households are 1-person households, comprising 82.
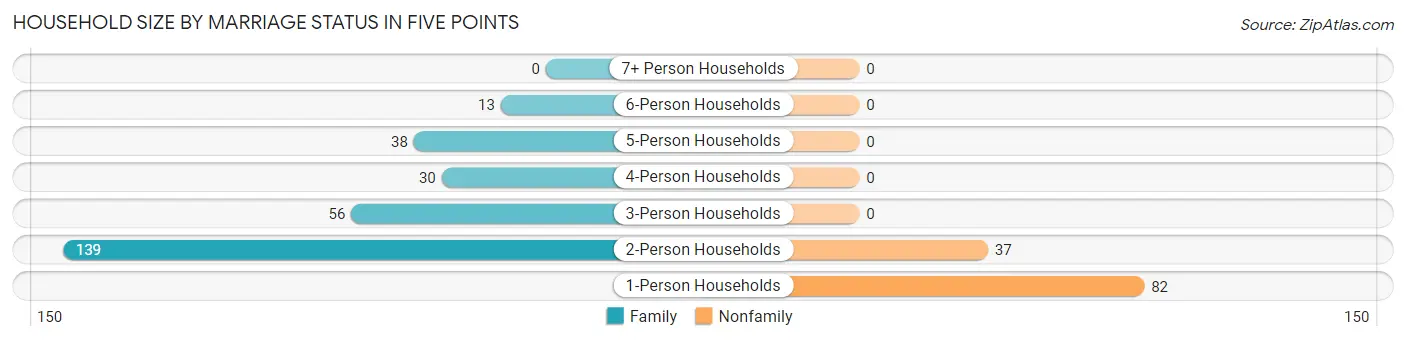
| Household Size | Family Households | Nonfamily Households |
| 1-Person Households | - | 82 (20.8%) |
| 2-Person Households | 139 (35.2%) | 37 (9.4%) |
| 3-Person Households | 56 (14.2%) | 0 (0.0%) |
| 4-Person Households | 30 (7.6%) | 0 (0.0%) |
| 5-Person Households | 38 (9.6%) | 0 (0.0%) |
| 6-Person Households | 13 (3.3%) | 0 (0.0%) |
| 7+ Person Households | 0 (0.0%) | 0 (0.0%) |
| Total | 276 (69.9%) | 119 (30.1%) |
Female Fertility in Five Points
Fertility by Age in Five Points
Average fertility rate in Five Points is 84.0 births per 1,000 women. Women in the age bracket of 20 to 34 years have the highest fertility rate with 129.0 births per 1,000 women. Women in the age bracket of 20 to 34 years acount for 100.0% of all women with births.
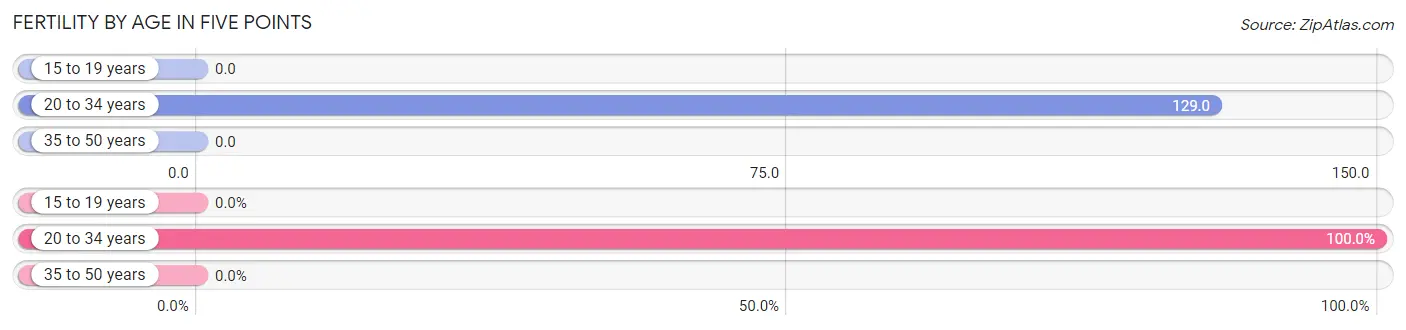
| Age Bracket | Women with Births | Births / 1,000 Women |
| 15 to 19 years | 0 (0.0%) | 0.0 |
| 20 to 34 years | 26 (100.0%) | 129.0 |
| 35 to 50 years | 0 (0.0%) | 0.0 |
| Total | 26 (100.0%) | 84.0 |
Fertility by Age by Marriage Status in Five Points
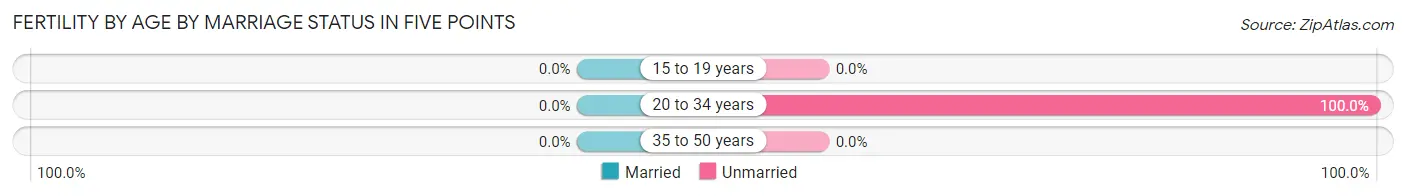
| Age Bracket | Married | Unmarried |
| 15 to 19 years | 0 (0.0%) | 0 (0.0%) |
| 20 to 34 years | 0 (0.0%) | 26 (100.0%) |
| 35 to 50 years | 0 (0.0%) | 0 (0.0%) |
| Total | 0 (0.0%) | 26 (100.0%) |
Fertility by Education in Five Points
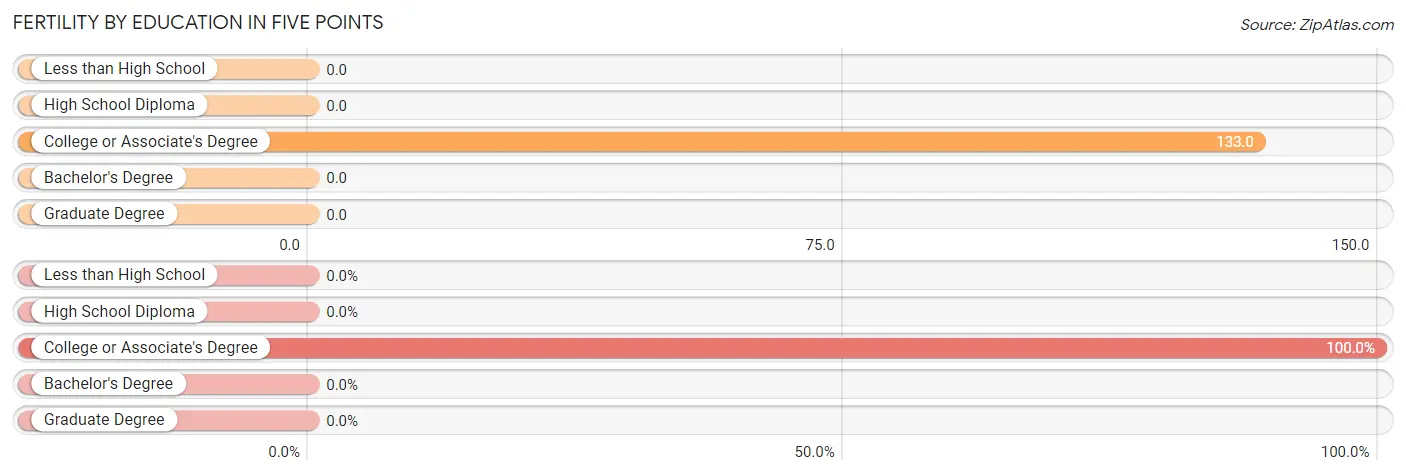
| Educational Attainment | Women with Births | Births / 1,000 Women |
| Less than High School | 0 (0.0%) | 0.0 |
| High School Diploma | 0 (0.0%) | 0.0 |
| College or Associate's Degree | 26 (100.0%) | 133.0 |
| Bachelor's Degree | 0 (0.0%) | 0.0 |
| Graduate Degree | 0 (0.0%) | 0.0 |
| Total | 26 (100.0%) | 84.0 |
Fertility by Education by Marriage Status in Five Points
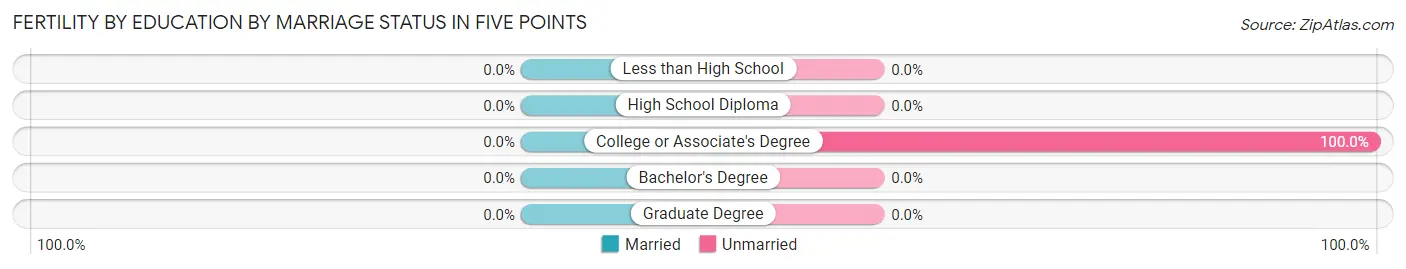
| Educational Attainment | Married | Unmarried |
| Less than High School | 0 (0.0%) | 0 (0.0%) |
| High School Diploma | 0 (0.0%) | 0 (0.0%) |
| College or Associate's Degree | 0 (0.0%) | 26 (100.0%) |
| Bachelor's Degree | 0 (0.0%) | 0 (0.0%) |
| Graduate Degree | 0 (0.0%) | 0 (0.0%) |
| Total | 0 (0.0%) | 26 (100.0%) |
Employment Characteristics in Five Points
Employment by Class of Employer in Five Points
Among the 585 employed individuals in Five Points, private company employees (331 | 56.6%), federal government employees (90 | 15.4%), and self-employed (incorporated) (67 | 11.5%) make up the most common classes of employment.
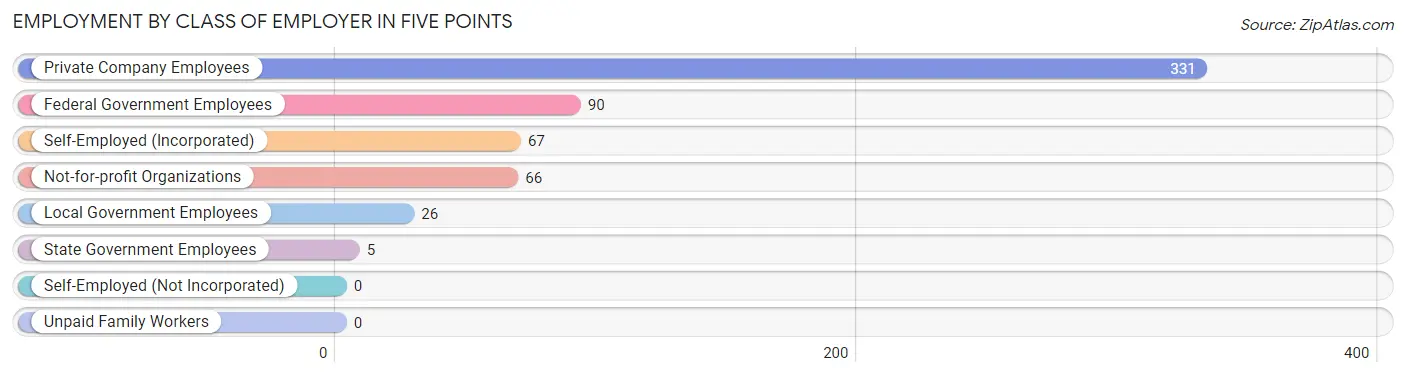
| Employer Class | # Employees | % Employees |
| Private Company Employees | 331 | 56.6% |
| Self-Employed (Incorporated) | 67 | 11.5% |
| Self-Employed (Not Incorporated) | 0 | 0.0% |
| Not-for-profit Organizations | 66 | 11.3% |
| Local Government Employees | 26 | 4.4% |
| State Government Employees | 5 | 0.9% |
| Federal Government Employees | 90 | 15.4% |
| Unpaid Family Workers | 0 | 0.0% |
| Total | 585 | 100.0% |
Employment Status by Age in Five Points
According to the labor force statistics for Five Points, out of the total population over 16 years of age (955), 66.0% or 630 individuals are in the labor force, with 7.8% or 49 of them unemployed. The age group with the highest labor force participation rate is 20 to 24 years, with 100.0% or 155 individuals in the labor force. Within the labor force, the 25 to 29 years age range has the highest percentage of unemployed individuals, with 20.8% or 20 of them being unemployed.
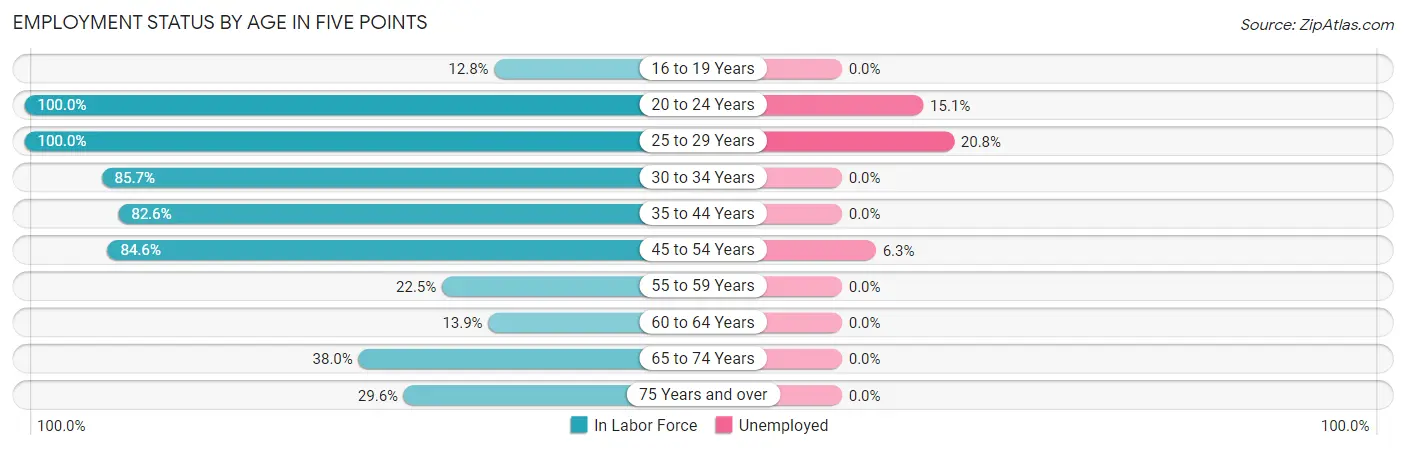
| Age Bracket | In Labor Force | Unemployed |
| 16 to 19 Years | 5 (12.8%) | 0 (0.0%) |
| 20 to 24 Years | 155 (100.0%) | 23 (15.1%) |
| 25 to 29 Years | 94 (100.0%) | 20 (20.8%) |
| 30 to 34 Years | 66 (85.7%) | 0 (0.0%) |
| 35 to 44 Years | 100 (82.6%) | 0 (0.0%) |
| 45 to 54 Years | 126 (84.6%) | 8 (6.3%) |
| 55 to 59 Years | 16 (22.5%) | 0 (0.0%) |
| 60 to 64 Years | 14 (13.9%) | 0 (0.0%) |
| 65 to 74 Years | 46 (38.0%) | 0 (0.0%) |
| 75 Years and over | 8 (29.6%) | 0 (0.0%) |
| Total | 630 (66.0%) | 49 (7.8%) |
Employment Status by Educational Attainment in Five Points
According to labor force statistics for Five Points, 67.9% of individuals (416) out of the total population between 25 and 64 years of age (613) are in the labor force, with 6.2% or 26 of them being unemployed. The group with the highest labor force participation rate are those with the educational attainment of bachelor's degree or higher, with 86.4% or 184 individuals in the labor force. Within the labor force, individuals with bachelor's degree or higher education have the highest percentage of unemployment, with 9.4% or 17 of them being unemployed.
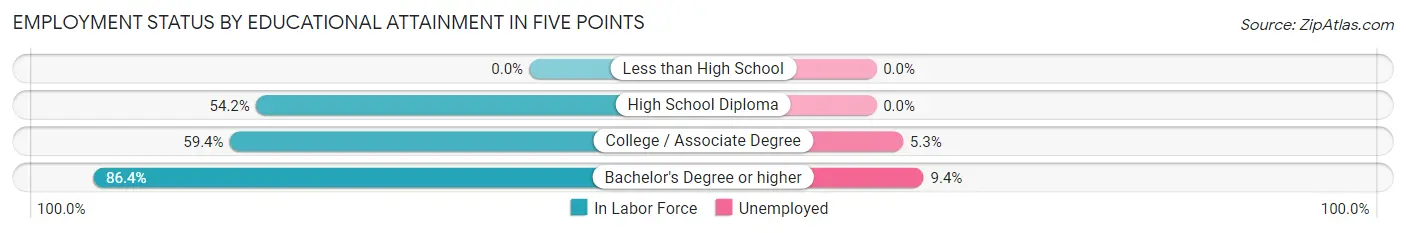
| Educational Attainment | In Labor Force | Unemployed |
| Less than High School | 0 (0.0%) | 0 (0.0%) |
| High School Diploma | 58 (54.2%) | 0 (0.0%) |
| College / Associate Degree | 174 (59.4%) | 16 (5.3%) |
| Bachelor's Degree or higher | 184 (86.4%) | 20 (9.4%) |
| Total | 416 (67.9%) | 38 (6.2%) |
Employment Occupations by Sex in Five Points
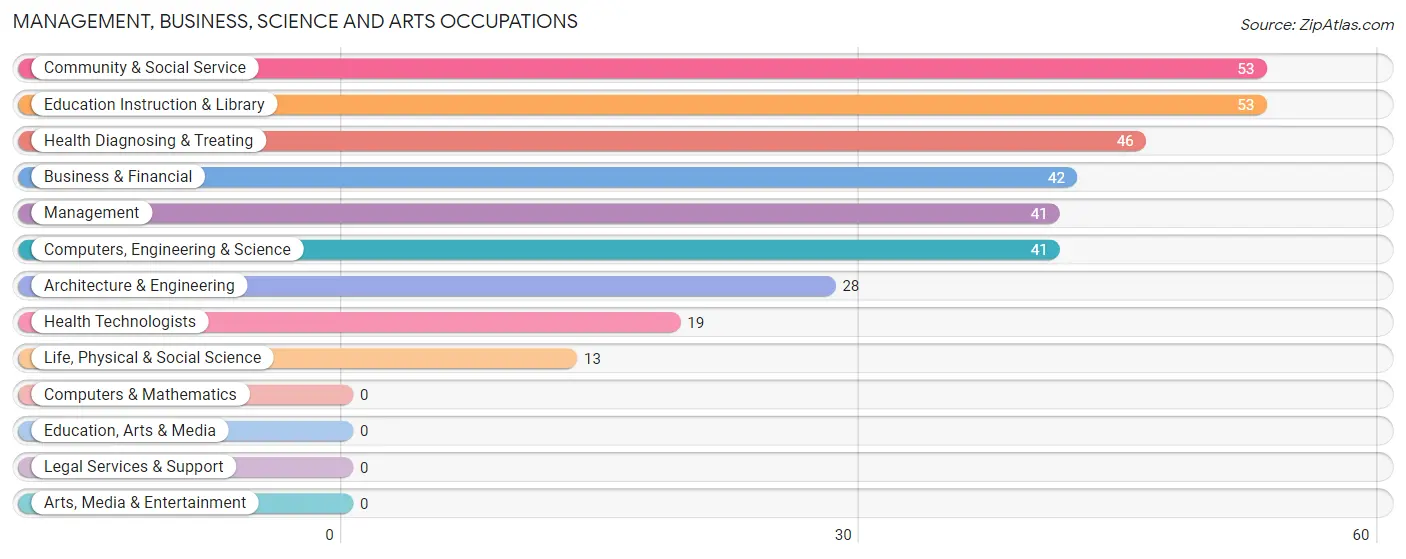
Management, Business, Science and Arts Occupations
The most common Management, Business, Science and Arts occupations in Five Points are Community & Social Service (53 | 10.0%), Education Instruction & Library (53 | 10.0%), Health Diagnosing & Treating (46 | 8.7%), Business & Financial (42 | 7.9%), and Management (41 | 7.7%).
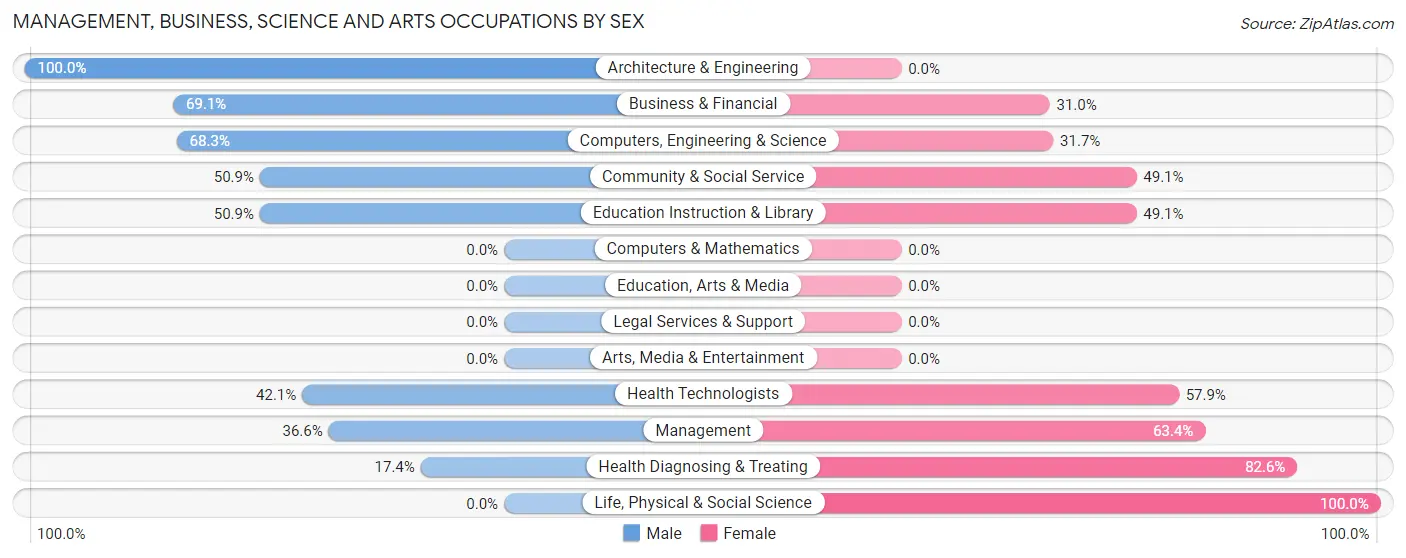
Management, Business, Science and Arts Occupations by Sex
Within the Management, Business, Science and Arts occupations in Five Points, the most male-oriented occupations are Architecture & Engineering (100.0%), Business & Financial (69.1%), and Computers, Engineering & Science (68.3%), while the most female-oriented occupations are Life, Physical & Social Science (100.0%), Health Diagnosing & Treating (82.6%), and Management (63.4%).
| Occupation | Male | Female |
| Management | 15 (36.6%) | 26 (63.4%) |
| Business & Financial | 29 (69.1%) | 13 (30.9%) |
| Computers, Engineering & Science | 28 (68.3%) | 13 (31.7%) |
| Computers & Mathematics | 0 (0.0%) | 0 (0.0%) |
| Architecture & Engineering | 28 (100.0%) | 0 (0.0%) |
| Life, Physical & Social Science | 0 (0.0%) | 13 (100.0%) |
| Community & Social Service | 27 (50.9%) | 26 (49.1%) |
| Education, Arts & Media | 0 (0.0%) | 0 (0.0%) |
| Legal Services & Support | 0 (0.0%) | 0 (0.0%) |
| Education Instruction & Library | 27 (50.9%) | 26 (49.1%) |
| Arts, Media & Entertainment | 0 (0.0%) | 0 (0.0%) |
| Health Diagnosing & Treating | 8 (17.4%) | 38 (82.6%) |
| Health Technologists | 8 (42.1%) | 11 (57.9%) |
| Total (Category) | 107 (48.0%) | 116 (52.0%) |
| Total (Overall) | 217 (40.9%) | 313 (59.1%) |
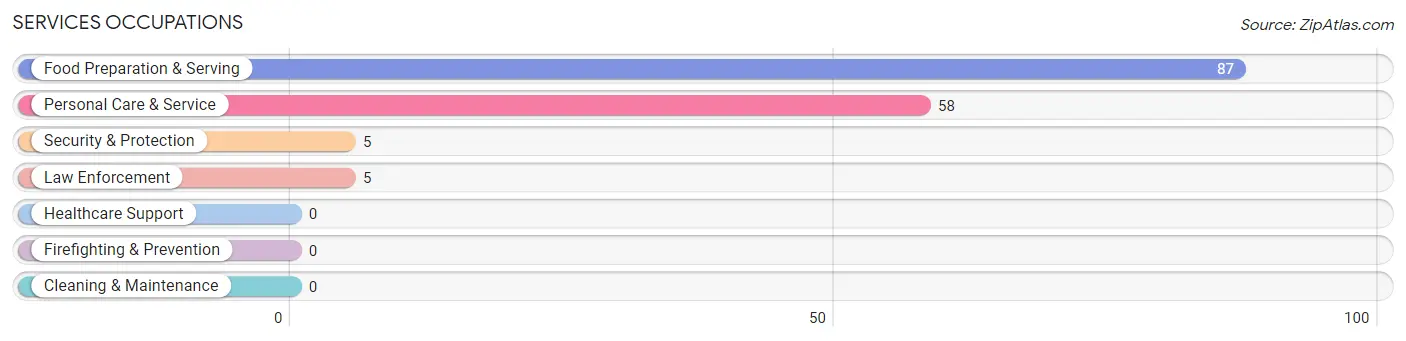
Services Occupations
The most common Services occupations in Five Points are Food Preparation & Serving (87 | 16.4%), Personal Care & Service (58 | 10.9%), Security & Protection (5 | 0.9%), and Law Enforcement (5 | 0.9%).
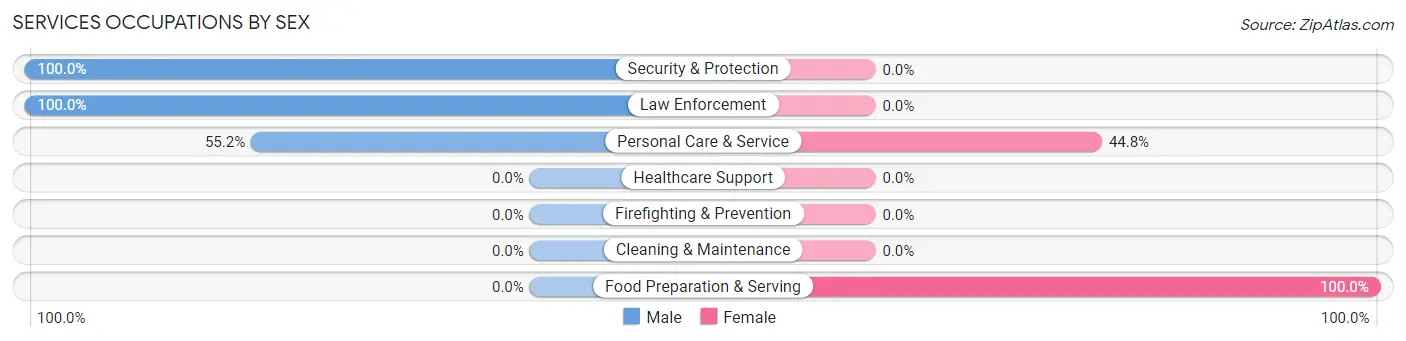
Services Occupations by Sex
Within the Services occupations in Five Points, the most male-oriented occupations are Security & Protection (100.0%), Law Enforcement (100.0%), and Personal Care & Service (55.2%), while the most female-oriented occupations are Food Preparation & Serving (100.0%), and Personal Care & Service (44.8%).
| Occupation | Male | Female |
| Healthcare Support | 0 (0.0%) | 0 (0.0%) |
| Security & Protection | 5 (100.0%) | 0 (0.0%) |
| Firefighting & Prevention | 0 (0.0%) | 0 (0.0%) |
| Law Enforcement | 5 (100.0%) | 0 (0.0%) |
| Food Preparation & Serving | 0 (0.0%) | 87 (100.0%) |
| Cleaning & Maintenance | 0 (0.0%) | 0 (0.0%) |
| Personal Care & Service | 32 (55.2%) | 26 (44.8%) |
| Total (Category) | 37 (24.7%) | 113 (75.3%) |
| Total (Overall) | 217 (40.9%) | 313 (59.1%) |
Sales and Office Occupations
The most common Sales and Office occupations in Five Points are Office & Administration (65 | 12.3%), and Sales & Related (10 | 1.9%).
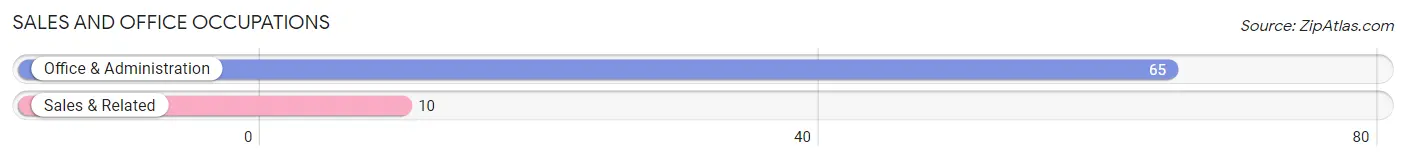
Sales and Office Occupations by Sex
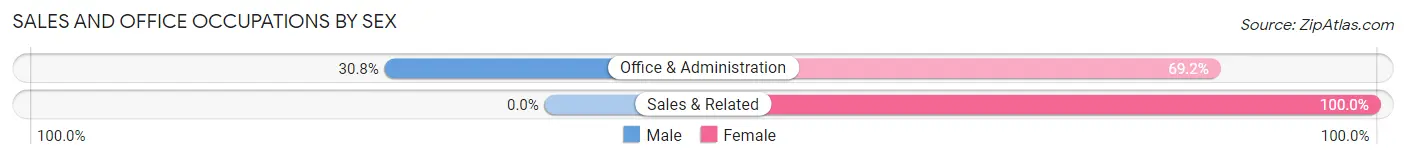
| Occupation | Male | Female |
| Sales & Related | 0 (0.0%) | 10 (100.0%) |
| Office & Administration | 20 (30.8%) | 45 (69.2%) |
| Total (Category) | 20 (26.7%) | 55 (73.3%) |
| Total (Overall) | 217 (40.9%) | 313 (59.1%) |
Natural Resources, Construction and Maintenance Occupations
The most common Natural Resources, Construction and Maintenance occupations in Five Points are , and Farming, Fishing & Forestry (24 | 4.5%).
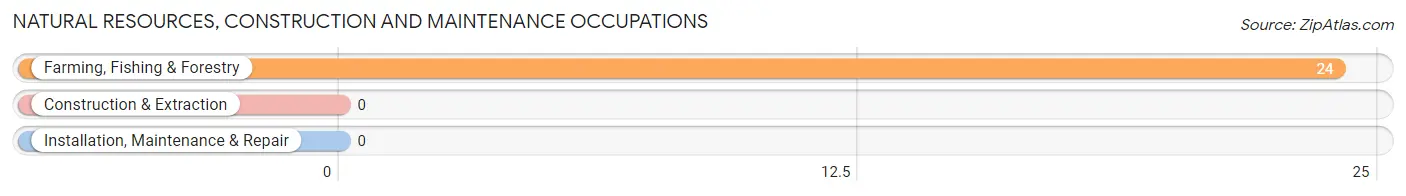
Natural Resources, Construction and Maintenance Occupations by Sex
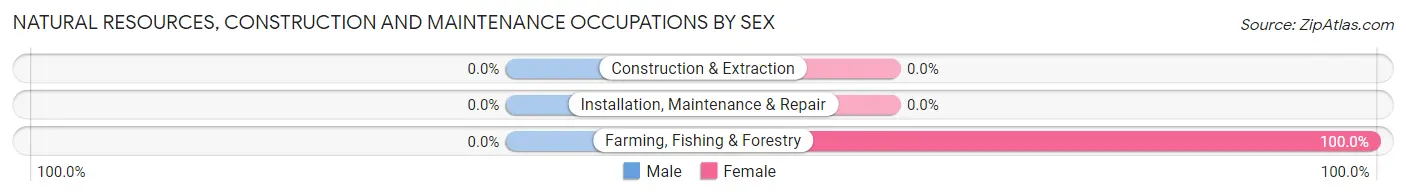
| Occupation | Male | Female |
| Farming, Fishing & Forestry | 0 (0.0%) | 24 (100.0%) |
| Construction & Extraction | 0 (0.0%) | 0 (0.0%) |
| Installation, Maintenance & Repair | 0 (0.0%) | 0 (0.0%) |
| Total (Category) | 0 (0.0%) | 24 (100.0%) |
| Total (Overall) | 217 (40.9%) | 313 (59.1%) |
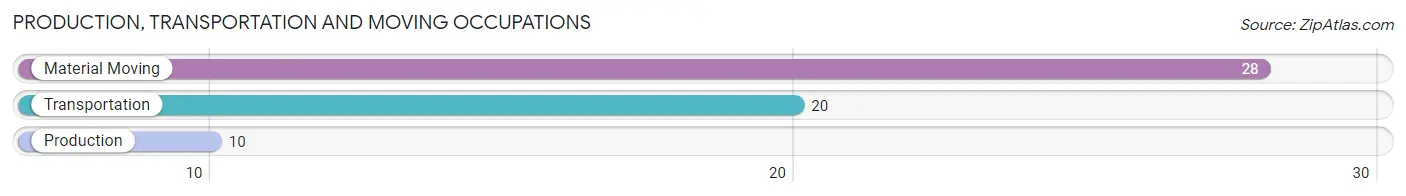
Production, Transportation and Moving Occupations
The most common Production, Transportation and Moving occupations in Five Points are Material Moving (28 | 5.3%), Transportation (20 | 3.8%), and Production (10 | 1.9%).
Production, Transportation and Moving Occupations by Sex
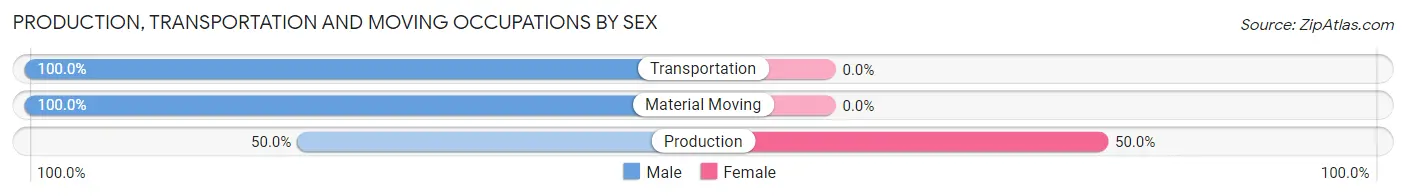
| Occupation | Male | Female |
| Production | 5 (50.0%) | 5 (50.0%) |
| Transportation | 20 (100.0%) | 0 (0.0%) |
| Material Moving | 28 (100.0%) | 0 (0.0%) |
| Total (Category) | 53 (91.4%) | 5 (8.6%) |
| Total (Overall) | 217 (40.9%) | 313 (59.1%) |
Employment Industries by Sex in Five Points
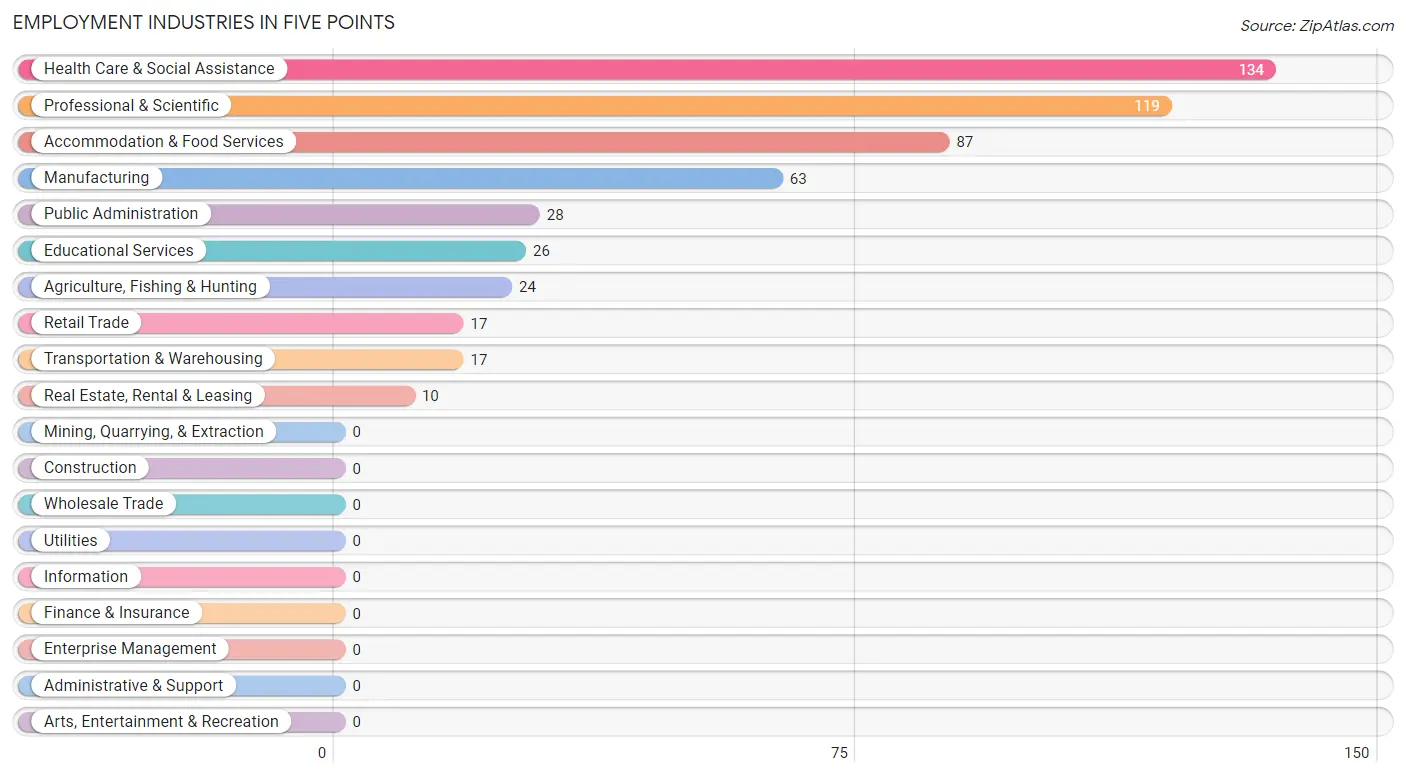
Employment Industries in Five Points
The major employment industries in Five Points include Health Care & Social Assistance (134 | 25.3%), Professional & Scientific (119 | 22.5%), Accommodation & Food Services (87 | 16.4%), Manufacturing (63 | 11.9%), and Public Administration (28 | 5.3%).
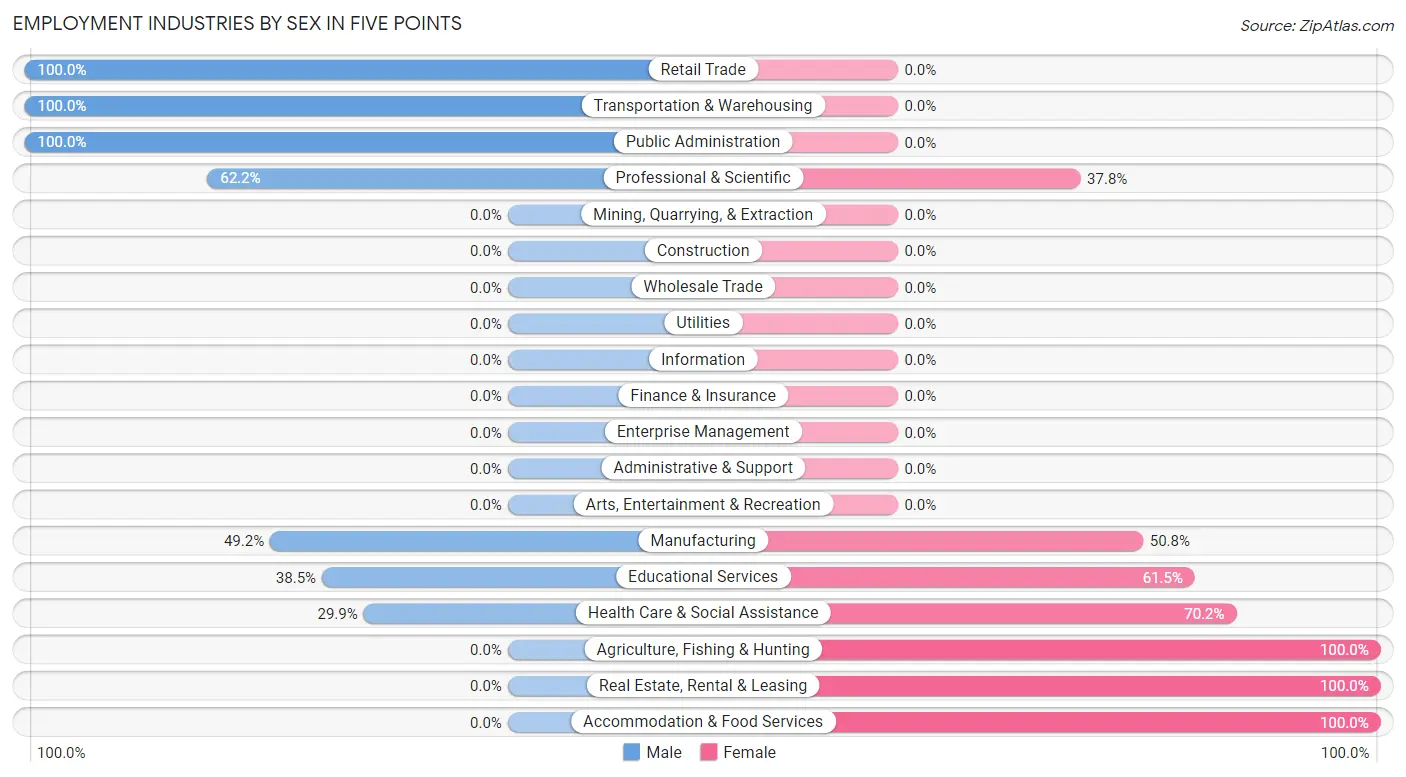
Employment Industries by Sex in Five Points
The Five Points industries that see more men than women are Retail Trade (100.0%), Transportation & Warehousing (100.0%), and Public Administration (100.0%), whereas the industries that tend to have a higher number of women are Agriculture, Fishing & Hunting (100.0%), Real Estate, Rental & Leasing (100.0%), and Accommodation & Food Services (100.0%).
| Industry | Male | Female |
| Agriculture, Fishing & Hunting | 0 (0.0%) | 24 (100.0%) |
| Mining, Quarrying, & Extraction | 0 (0.0%) | 0 (0.0%) |
| Construction | 0 (0.0%) | 0 (0.0%) |
| Manufacturing | 31 (49.2%) | 32 (50.8%) |
| Wholesale Trade | 0 (0.0%) | 0 (0.0%) |
| Retail Trade | 17 (100.0%) | 0 (0.0%) |
| Transportation & Warehousing | 17 (100.0%) | 0 (0.0%) |
| Utilities | 0 (0.0%) | 0 (0.0%) |
| Information | 0 (0.0%) | 0 (0.0%) |
| Finance & Insurance | 0 (0.0%) | 0 (0.0%) |
| Real Estate, Rental & Leasing | 0 (0.0%) | 10 (100.0%) |
| Professional & Scientific | 74 (62.2%) | 45 (37.8%) |
| Enterprise Management | 0 (0.0%) | 0 (0.0%) |
| Administrative & Support | 0 (0.0%) | 0 (0.0%) |
| Educational Services | 10 (38.5%) | 16 (61.5%) |
| Health Care & Social Assistance | 40 (29.8%) | 94 (70.2%) |
| Arts, Entertainment & Recreation | 0 (0.0%) | 0 (0.0%) |
| Accommodation & Food Services | 0 (0.0%) | 87 (100.0%) |
| Public Administration | 28 (100.0%) | 0 (0.0%) |
| Total | 217 (40.9%) | 313 (59.1%) |
Education in Five Points
School Enrollment in Five Points
The most common levels of schooling among the 284 students in Five Points are college / undergraduate (165 | 58.1%), elementary school (69 | 24.3%), and kindergarten (26 | 9.1%).
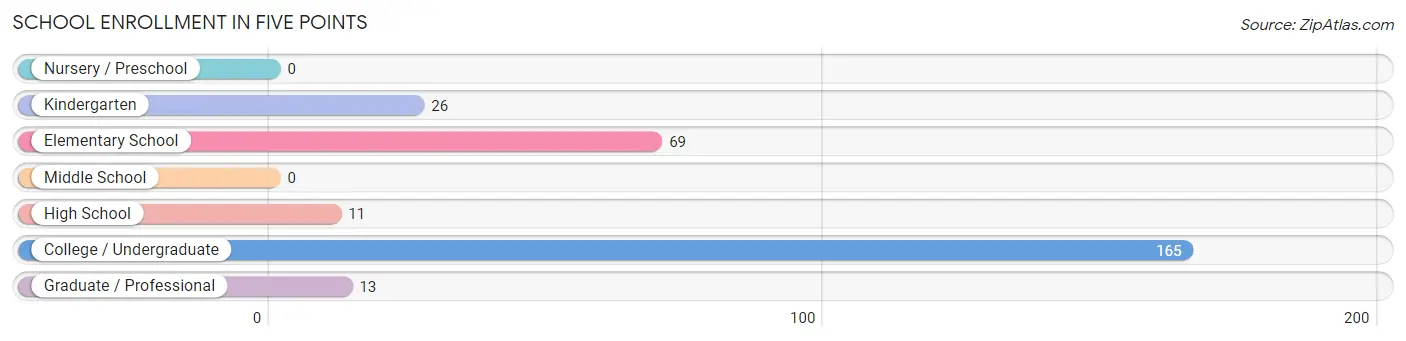
| School Level | # Students | % Students |
| Nursery / Preschool | 0 | 0.0% |
| Kindergarten | 26 | 9.1% |
| Elementary School | 69 | 24.3% |
| Middle School | 0 | 0.0% |
| High School | 11 | 3.9% |
| College / Undergraduate | 165 | 58.1% |
| Graduate / Professional | 13 | 4.6% |
| Total | 284 | 100.0% |
School Enrollment by Age by Funding Source in Five Points
Out of a total of 284 students who are enrolled in schools in Five Points, 49 (17.3%) attend a private institution, while the remaining 235 (82.7%) are enrolled in public schools. The age group of 25 to 34 year olds has the highest likelihood of being enrolled in private schools, with 37 (75.5% in the age bracket) enrolled. Conversely, the age group of 18 to 19 year olds has the lowest likelihood of being enrolled in a private school, with 39 (100.0% in the age bracket) attending a public institution.
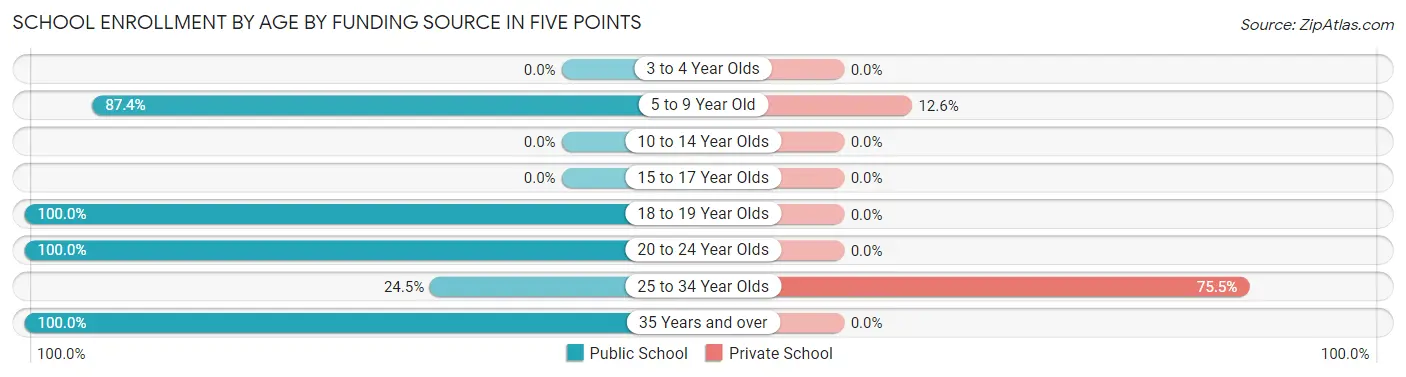
| Age Bracket | Public School | Private School |
| 3 to 4 Year Olds | 0 (0.0%) | 0 (0.0%) |
| 5 to 9 Year Old | 83 (87.4%) | 12 (12.6%) |
| 10 to 14 Year Olds | 0 (0.0%) | 0 (0.0%) |
| 15 to 17 Year Olds | 0 (0.0%) | 0 (0.0%) |
| 18 to 19 Year Olds | 39 (100.0%) | 0 (0.0%) |
| 20 to 24 Year Olds | 75 (100.0%) | 0 (0.0%) |
| 25 to 34 Year Olds | 12 (24.5%) | 37 (75.5%) |
| 35 Years and over | 26 (100.0%) | 0 (0.0%) |
| Total | 235 (82.7%) | 49 (17.3%) |
Educational Attainment by Field of Study in Five Points
Business (75 | 28.0%), education (74 | 27.6%), arts & humanities (31 | 11.6%), social sciences (23 | 8.6%), and physical & health sciences (17 | 6.3%) are the most common fields of study among 268 individuals in Five Points who have obtained a bachelor's degree or higher.
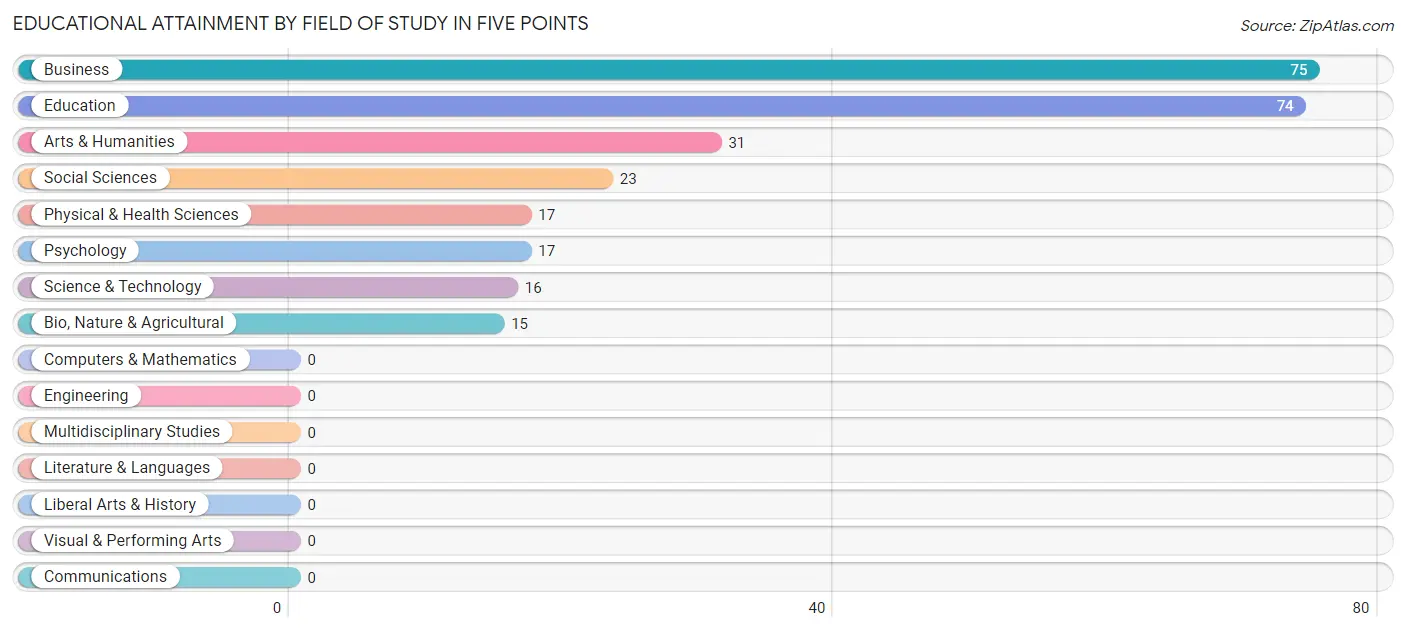
| Field of Study | # Graduates | % Graduates |
| Computers & Mathematics | 0 | 0.0% |
| Bio, Nature & Agricultural | 15 | 5.6% |
| Physical & Health Sciences | 17 | 6.3% |
| Psychology | 17 | 6.3% |
| Social Sciences | 23 | 8.6% |
| Engineering | 0 | 0.0% |
| Multidisciplinary Studies | 0 | 0.0% |
| Science & Technology | 16 | 6.0% |
| Business | 75 | 28.0% |
| Education | 74 | 27.6% |
| Literature & Languages | 0 | 0.0% |
| Liberal Arts & History | 0 | 0.0% |
| Visual & Performing Arts | 0 | 0.0% |
| Communications | 0 | 0.0% |
| Arts & Humanities | 31 | 11.6% |
| Total | 268 | 100.0% |
Transportation & Commute in Five Points
Vehicle Availability by Sex in Five Points
The most prevalent vehicle ownership categories in Five Points are males with 2 vehicles (113, accounting for 43.0%) and females with 2 vehicles (31, making up 35.1%).
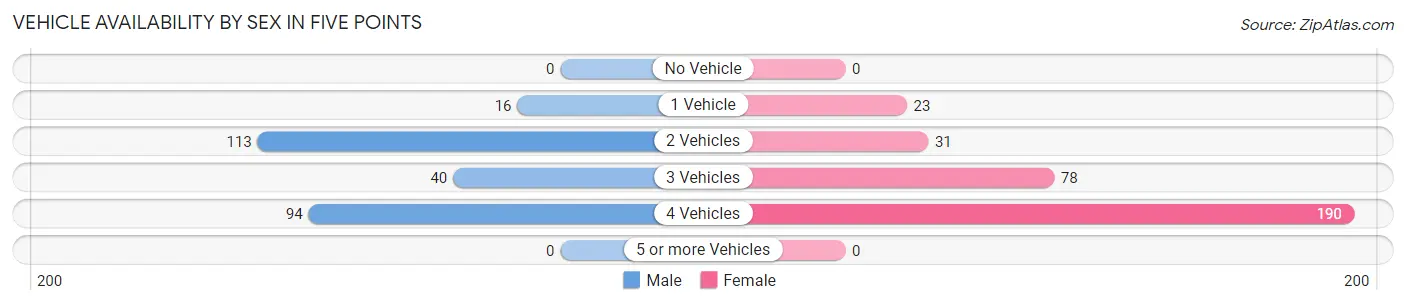
| Vehicles Available | Male | Female |
| No Vehicle | 0 (0.0%) | 0 (0.0%) |
| 1 Vehicle | 16 (6.1%) | 23 (7.1%) |
| 2 Vehicles | 113 (43.0%) | 31 (9.6%) |
| 3 Vehicles | 40 (15.2%) | 78 (24.2%) |
| 4 Vehicles | 94 (35.7%) | 190 (59.0%) |
| 5 or more Vehicles | 0 (0.0%) | 0 (0.0%) |
| Total | 263 (100.0%) | 322 (100.0%) |
Commute Time in Five Points
The most frequently occuring commute durations in Five Points are 45 to 59 minutes (113 commuters, 20.8%), 20 to 24 minutes (112 commuters, 20.6%), and 60 to 89 minutes (74 commuters, 13.6%).
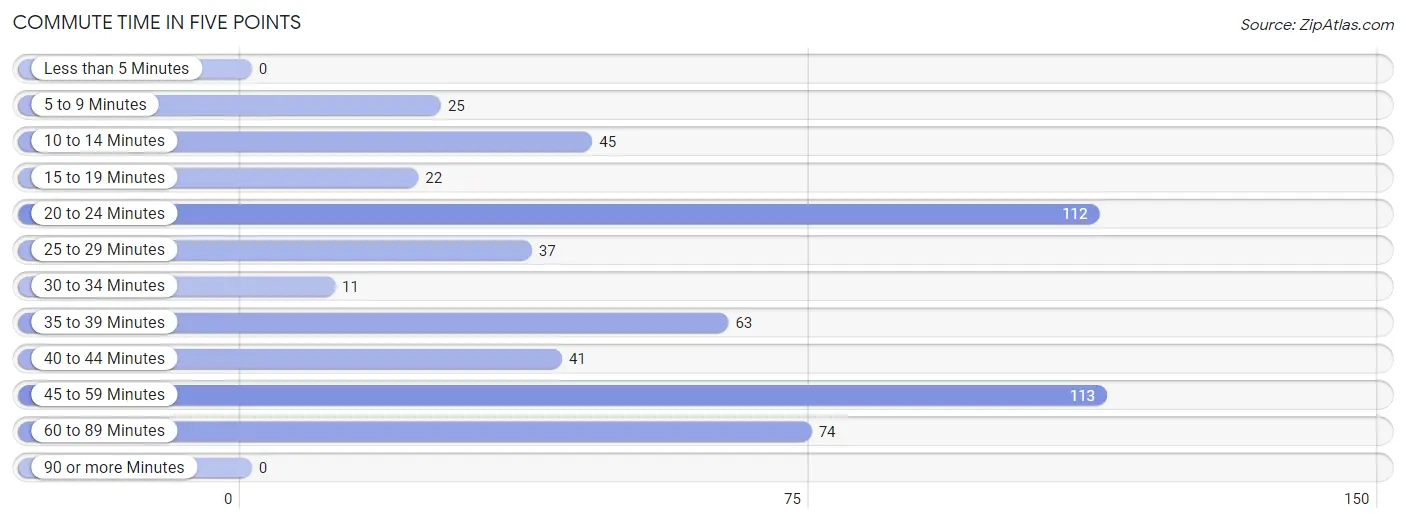
| Commute Time | # Commuters | % Commuters |
| Less than 5 Minutes | 0 | 0.0% |
| 5 to 9 Minutes | 25 | 4.6% |
| 10 to 14 Minutes | 45 | 8.3% |
| 15 to 19 Minutes | 22 | 4.1% |
| 20 to 24 Minutes | 112 | 20.6% |
| 25 to 29 Minutes | 37 | 6.8% |
| 30 to 34 Minutes | 11 | 2.0% |
| 35 to 39 Minutes | 63 | 11.6% |
| 40 to 44 Minutes | 41 | 7.5% |
| 45 to 59 Minutes | 113 | 20.8% |
| 60 to 89 Minutes | 74 | 13.6% |
| 90 or more Minutes | 0 | 0.0% |
Commute Time by Sex in Five Points
The most common commute times in Five Points are 45 to 59 minutes (85 commuters, 32.3%) for males and 20 to 24 minutes (64 commuters, 22.9%) for females.
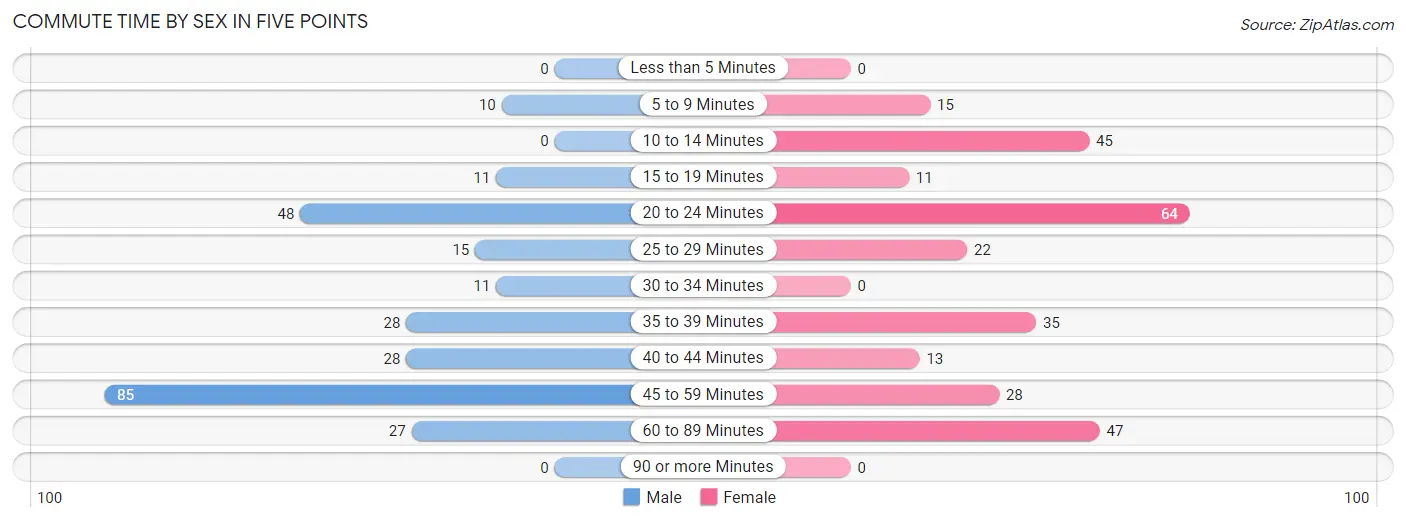
| Commute Time | Male | Female |
| Less than 5 Minutes | 0 (0.0%) | 0 (0.0%) |
| 5 to 9 Minutes | 10 (3.8%) | 15 (5.4%) |
| 10 to 14 Minutes | 0 (0.0%) | 45 (16.1%) |
| 15 to 19 Minutes | 11 (4.2%) | 11 (3.9%) |
| 20 to 24 Minutes | 48 (18.2%) | 64 (22.9%) |
| 25 to 29 Minutes | 15 (5.7%) | 22 (7.9%) |
| 30 to 34 Minutes | 11 (4.2%) | 0 (0.0%) |
| 35 to 39 Minutes | 28 (10.6%) | 35 (12.5%) |
| 40 to 44 Minutes | 28 (10.6%) | 13 (4.6%) |
| 45 to 59 Minutes | 85 (32.3%) | 28 (10.0%) |
| 60 to 89 Minutes | 27 (10.3%) | 47 (16.8%) |
| 90 or more Minutes | 0 (0.0%) | 0 (0.0%) |
Time of Departure to Work by Sex in Five Points
The most frequent times of departure to work in Five Points are 7:00 AM to 7:29 AM (47, 17.9%) for males and 7:00 AM to 7:29 AM (53, 18.9%) for females.
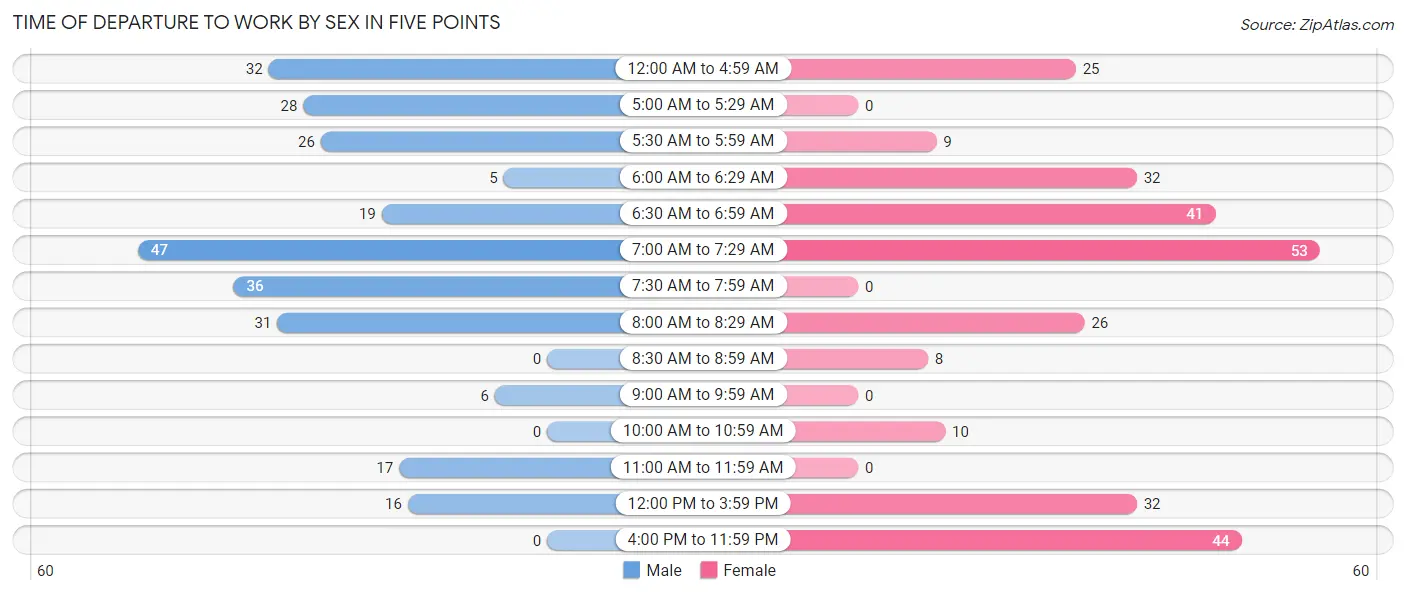
| Time of Departure | Male | Female |
| 12:00 AM to 4:59 AM | 32 (12.2%) | 25 (8.9%) |
| 5:00 AM to 5:29 AM | 28 (10.6%) | 0 (0.0%) |
| 5:30 AM to 5:59 AM | 26 (9.9%) | 9 (3.2%) |
| 6:00 AM to 6:29 AM | 5 (1.9%) | 32 (11.4%) |
| 6:30 AM to 6:59 AM | 19 (7.2%) | 41 (14.6%) |
| 7:00 AM to 7:29 AM | 47 (17.9%) | 53 (18.9%) |
| 7:30 AM to 7:59 AM | 36 (13.7%) | 0 (0.0%) |
| 8:00 AM to 8:29 AM | 31 (11.8%) | 26 (9.3%) |
| 8:30 AM to 8:59 AM | 0 (0.0%) | 8 (2.9%) |
| 9:00 AM to 9:59 AM | 6 (2.3%) | 0 (0.0%) |
| 10:00 AM to 10:59 AM | 0 (0.0%) | 10 (3.6%) |
| 11:00 AM to 11:59 AM | 17 (6.5%) | 0 (0.0%) |
| 12:00 PM to 3:59 PM | 16 (6.1%) | 32 (11.4%) |
| 4:00 PM to 11:59 PM | 0 (0.0%) | 44 (15.7%) |
| Total | 263 (100.0%) | 280 (100.0%) |
Housing Occupancy in Five Points
Occupancy by Ownership in Five Points
Of the total 395 dwellings in Five Points, owner-occupied units account for 321 (81.3%), while renter-occupied units make up 74 (18.7%).
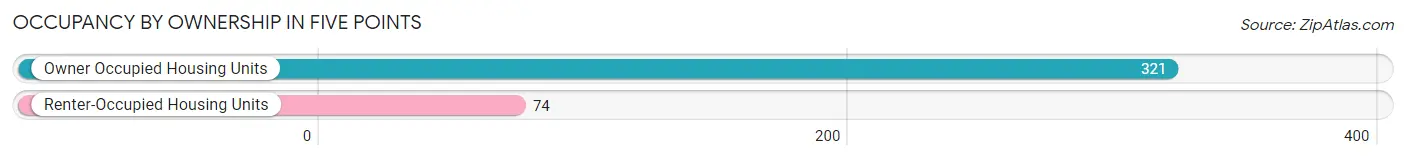
| Occupancy | # Housing Units | % Housing Units |
| Owner Occupied Housing Units | 321 | 81.3% |
| Renter-Occupied Housing Units | 74 | 18.7% |
| Total Occupied Housing Units | 395 | 100.0% |
Occupancy by Household Size in Five Points
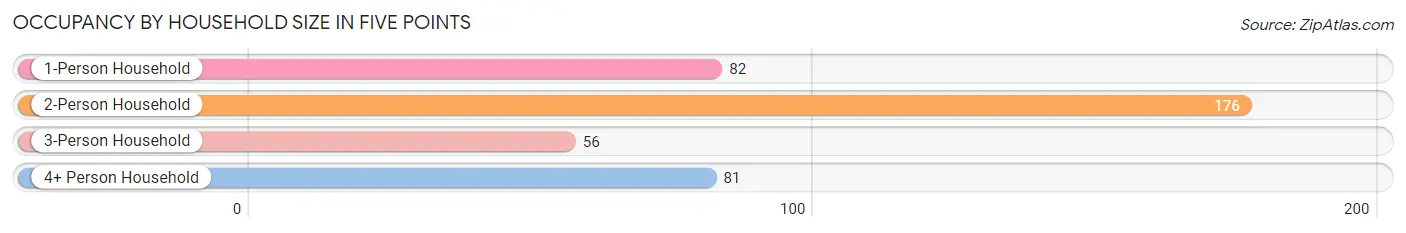
| Household Size | # Housing Units | % Housing Units |
| 1-Person Household | 82 | 20.8% |
| 2-Person Household | 176 | 44.6% |
| 3-Person Household | 56 | 14.2% |
| 4+ Person Household | 81 | 20.5% |
| Total Housing Units | 395 | 100.0% |
Occupancy by Ownership by Household Size in Five Points
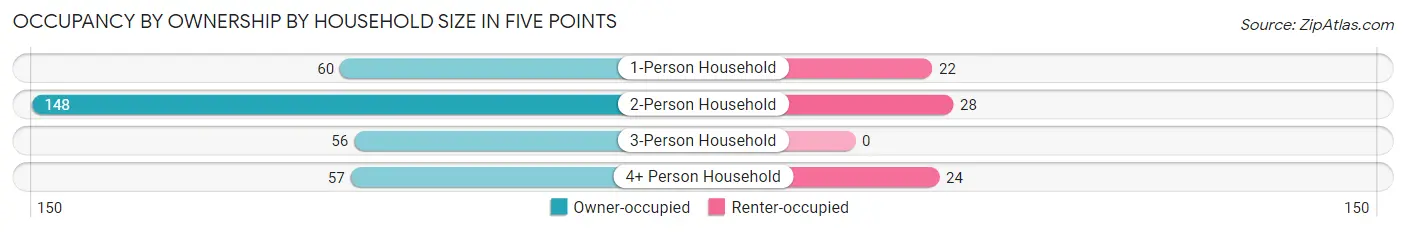
| Household Size | Owner-occupied | Renter-occupied |
| 1-Person Household | 60 (73.2%) | 22 (26.8%) |
| 2-Person Household | 148 (84.1%) | 28 (15.9%) |
| 3-Person Household | 56 (100.0%) | 0 (0.0%) |
| 4+ Person Household | 57 (70.4%) | 24 (29.6%) |
| Total Housing Units | 321 (81.3%) | 74 (18.7%) |
Occupancy by Educational Attainment in Five Points
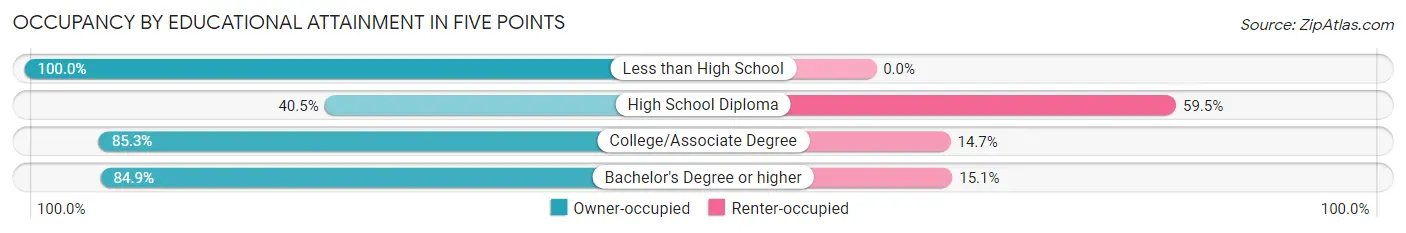
| Household Size | Owner-occupied | Renter-occupied |
| Less than High School | 9 (100.0%) | 0 (0.0%) |
| High School Diploma | 15 (40.5%) | 22 (59.5%) |
| College/Associate Degree | 162 (85.3%) | 28 (14.7%) |
| Bachelor's Degree or higher | 135 (84.9%) | 24 (15.1%) |
Occupancy by Age of Householder in Five Points
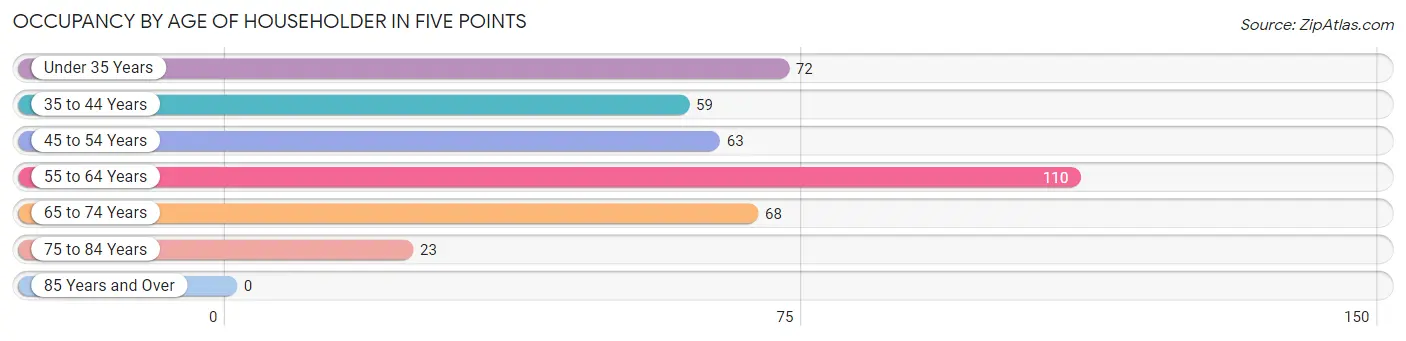
| Age Bracket | # Households | % Households |
| Under 35 Years | 72 | 18.2% |
| 35 to 44 Years | 59 | 14.9% |
| 45 to 54 Years | 63 | 16.0% |
| 55 to 64 Years | 110 | 27.9% |
| 65 to 74 Years | 68 | 17.2% |
| 75 to 84 Years | 23 | 5.8% |
| 85 Years and Over | 0 | 0.0% |
| Total | 395 | 100.0% |
Housing Finances in Five Points
Median Income by Occupancy in Five Points
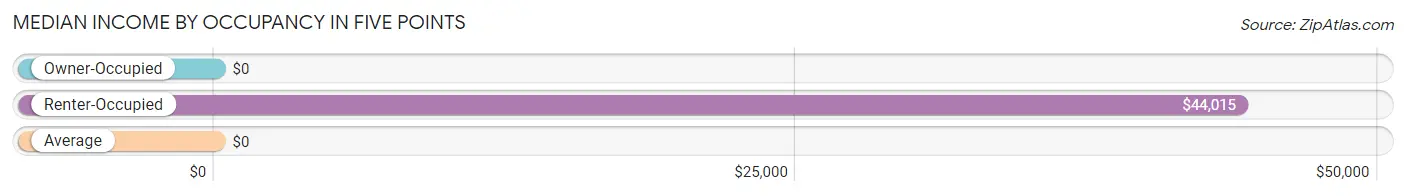
| Occupancy Type | # Households | Median Income |
| Owner-Occupied | 321 (81.3%) | $0 |
| Renter-Occupied | 74 (18.7%) | $44,015 |
| Average | 395 (100.0%) | $0 |
Occupancy by Householder Income Bracket in Five Points
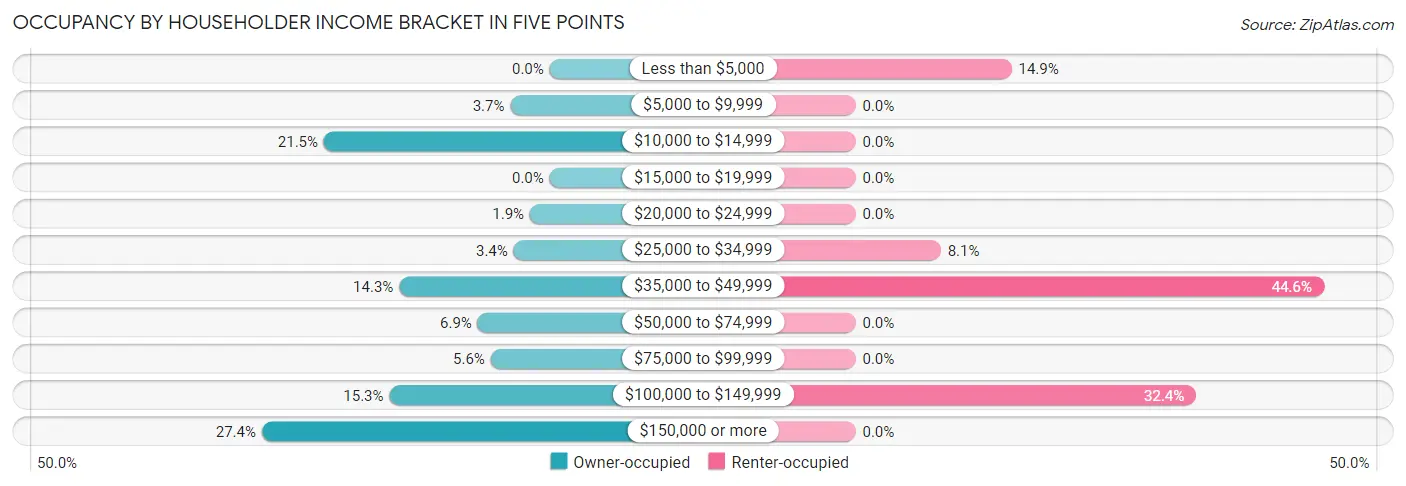
| Income Bracket | Owner-occupied | Renter-occupied |
| Less than $5,000 | 0 (0.0%) | 11 (14.9%) |
| $5,000 to $9,999 | 12 (3.7%) | 0 (0.0%) |
| $10,000 to $14,999 | 69 (21.5%) | 0 (0.0%) |
| $15,000 to $19,999 | 0 (0.0%) | 0 (0.0%) |
| $20,000 to $24,999 | 6 (1.9%) | 0 (0.0%) |
| $25,000 to $34,999 | 11 (3.4%) | 6 (8.1%) |
| $35,000 to $49,999 | 46 (14.3%) | 33 (44.6%) |
| $50,000 to $74,999 | 22 (6.9%) | 0 (0.0%) |
| $75,000 to $99,999 | 18 (5.6%) | 0 (0.0%) |
| $100,000 to $149,999 | 49 (15.3%) | 24 (32.4%) |
| $150,000 or more | 88 (27.4%) | 0 (0.0%) |
| Total | 321 (100.0%) | 74 (100.0%) |
Monthly Housing Cost Tiers in Five Points
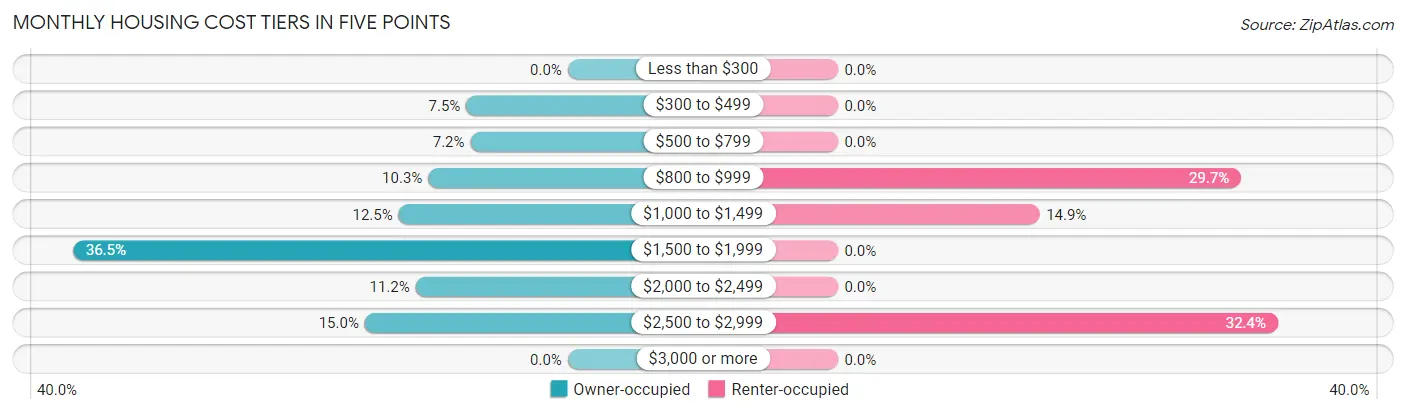
| Monthly Cost | Owner-occupied | Renter-occupied |
| Less than $300 | 0 (0.0%) | 0 (0.0%) |
| $300 to $499 | 24 (7.5%) | 0 (0.0%) |
| $500 to $799 | 23 (7.2%) | 0 (0.0%) |
| $800 to $999 | 33 (10.3%) | 22 (29.7%) |
| $1,000 to $1,499 | 40 (12.5%) | 11 (14.9%) |
| $1,500 to $1,999 | 117 (36.4%) | 0 (0.0%) |
| $2,000 to $2,499 | 36 (11.2%) | 0 (0.0%) |
| $2,500 to $2,999 | 48 (14.9%) | 24 (32.4%) |
| $3,000 or more | 0 (0.0%) | 0 (0.0%) |
| Total | 321 (100.0%) | 74 (100.0%) |
Physical Housing Characteristics in Five Points
Housing Structures in Five Points
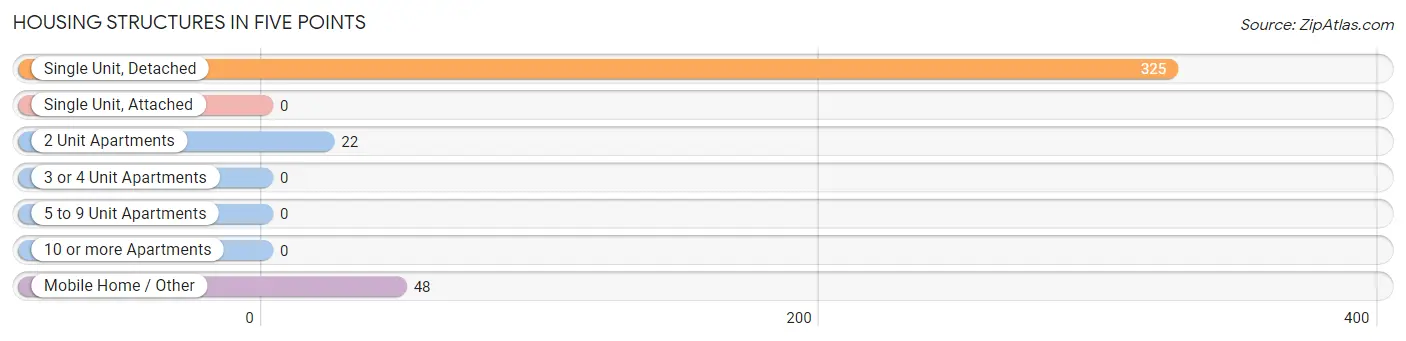
| Structure Type | # Housing Units | % Housing Units |
| Single Unit, Detached | 325 | 82.3% |
| Single Unit, Attached | 0 | 0.0% |
| 2 Unit Apartments | 22 | 5.6% |
| 3 or 4 Unit Apartments | 0 | 0.0% |
| 5 to 9 Unit Apartments | 0 | 0.0% |
| 10 or more Apartments | 0 | 0.0% |
| Mobile Home / Other | 48 | 12.1% |
| Total | 395 | 100.0% |
Housing Structures by Occupancy in Five Points
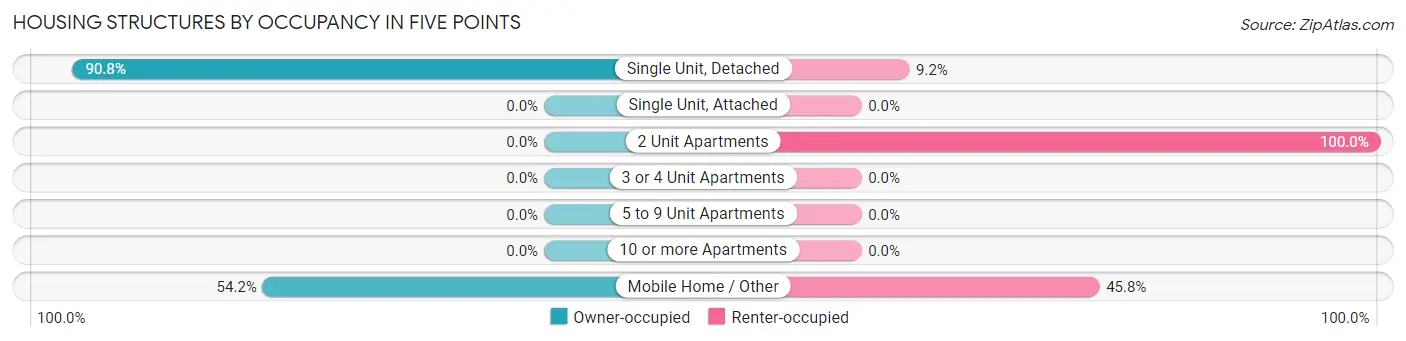
| Structure Type | Owner-occupied | Renter-occupied |
| Single Unit, Detached | 295 (90.8%) | 30 (9.2%) |
| Single Unit, Attached | 0 (0.0%) | 0 (0.0%) |
| 2 Unit Apartments | 0 (0.0%) | 22 (100.0%) |
| 3 or 4 Unit Apartments | 0 (0.0%) | 0 (0.0%) |
| 5 to 9 Unit Apartments | 0 (0.0%) | 0 (0.0%) |
| 10 or more Apartments | 0 (0.0%) | 0 (0.0%) |
| Mobile Home / Other | 26 (54.2%) | 22 (45.8%) |
| Total | 321 (81.3%) | 74 (18.7%) |
Housing Structures by Number of Rooms in Five Points
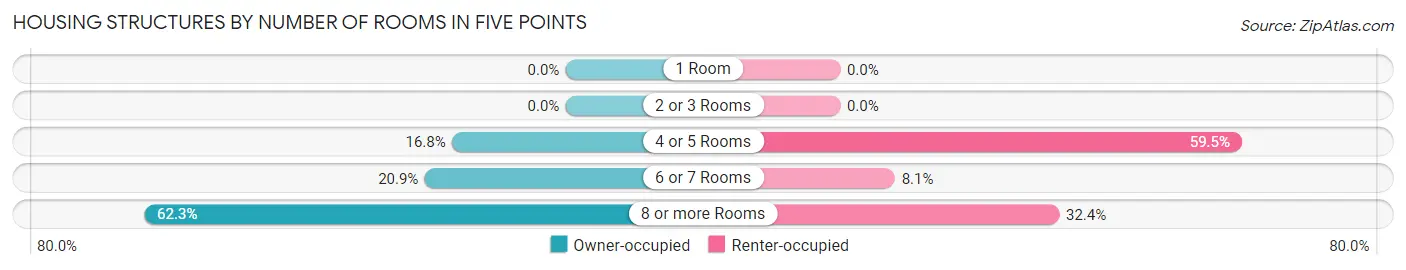
| Number of Rooms | Owner-occupied | Renter-occupied |
| 1 Room | 0 (0.0%) | 0 (0.0%) |
| 2 or 3 Rooms | 0 (0.0%) | 0 (0.0%) |
| 4 or 5 Rooms | 54 (16.8%) | 44 (59.5%) |
| 6 or 7 Rooms | 67 (20.9%) | 6 (8.1%) |
| 8 or more Rooms | 200 (62.3%) | 24 (32.4%) |
| Total | 321 (100.0%) | 74 (100.0%) |
Housing Structure by Heating Type in Five Points
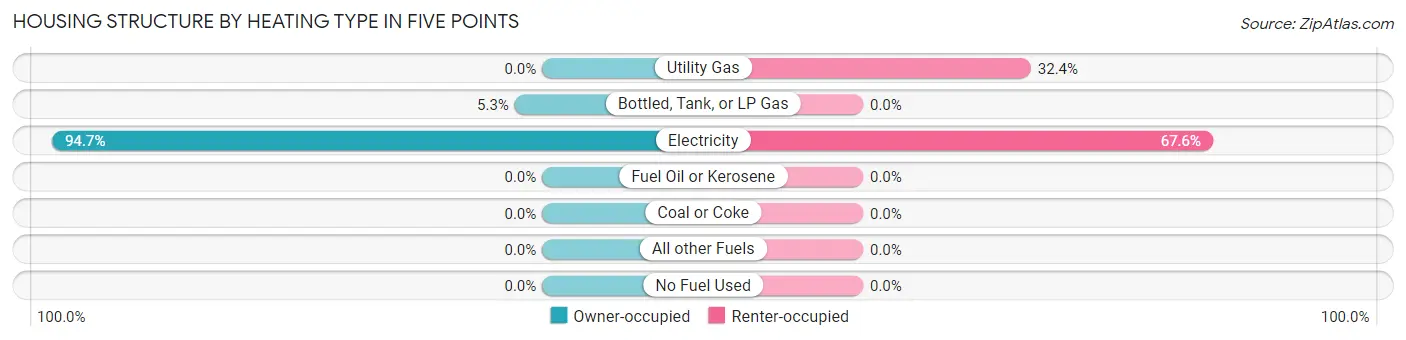
| Heating Type | Owner-occupied | Renter-occupied |
| Utility Gas | 0 (0.0%) | 24 (32.4%) |
| Bottled, Tank, or LP Gas | 17 (5.3%) | 0 (0.0%) |
| Electricity | 304 (94.7%) | 50 (67.6%) |
| Fuel Oil or Kerosene | 0 (0.0%) | 0 (0.0%) |
| Coal or Coke | 0 (0.0%) | 0 (0.0%) |
| All other Fuels | 0 (0.0%) | 0 (0.0%) |
| No Fuel Used | 0 (0.0%) | 0 (0.0%) |
| Total | 321 (100.0%) | 74 (100.0%) |
Household Vehicle Usage in Five Points
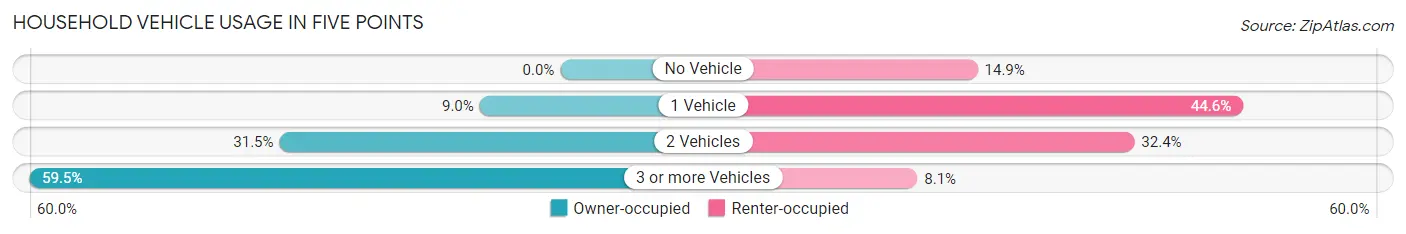
| Vehicles per Household | Owner-occupied | Renter-occupied |
| No Vehicle | 0 (0.0%) | 11 (14.9%) |
| 1 Vehicle | 29 (9.0%) | 33 (44.6%) |
| 2 Vehicles | 101 (31.5%) | 24 (32.4%) |
| 3 or more Vehicles | 191 (59.5%) | 6 (8.1%) |
| Total | 321 (100.0%) | 74 (100.0%) |
Real Estate & Mortgages in Five Points
Real Estate and Mortgage Overview in Five Points
| Characteristic | Without Mortgage | With Mortgage |
| Housing Units | 53 | 268 |
| Median Property Value | - | - |
| Median Household Income | $53,942 | $82 |
| Monthly Housing Costs | $515 | $0 |
| Real Estate Taxes | $1,167 | $0 |
Property Value by Mortgage Status in Five Points
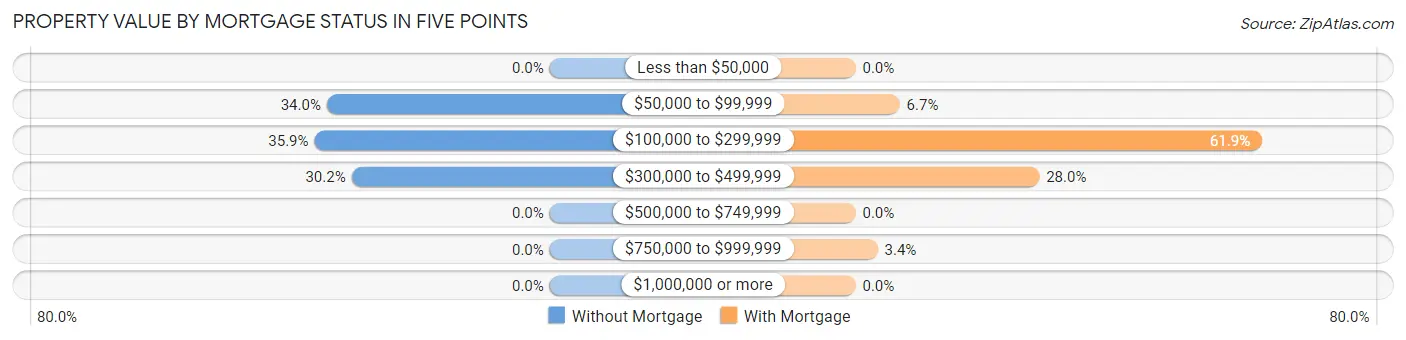
| Property Value | Without Mortgage | With Mortgage |
| Less than $50,000 | 0 (0.0%) | 0 (0.0%) |
| $50,000 to $99,999 | 18 (34.0%) | 18 (6.7%) |
| $100,000 to $299,999 | 19 (35.8%) | 166 (61.9%) |
| $300,000 to $499,999 | 16 (30.2%) | 75 (28.0%) |
| $500,000 to $749,999 | 0 (0.0%) | 0 (0.0%) |
| $750,000 to $999,999 | 0 (0.0%) | 9 (3.4%) |
| $1,000,000 or more | 0 (0.0%) | 0 (0.0%) |
| Total | 53 (100.0%) | 268 (100.0%) |
Household Income by Mortgage Status in Five Points
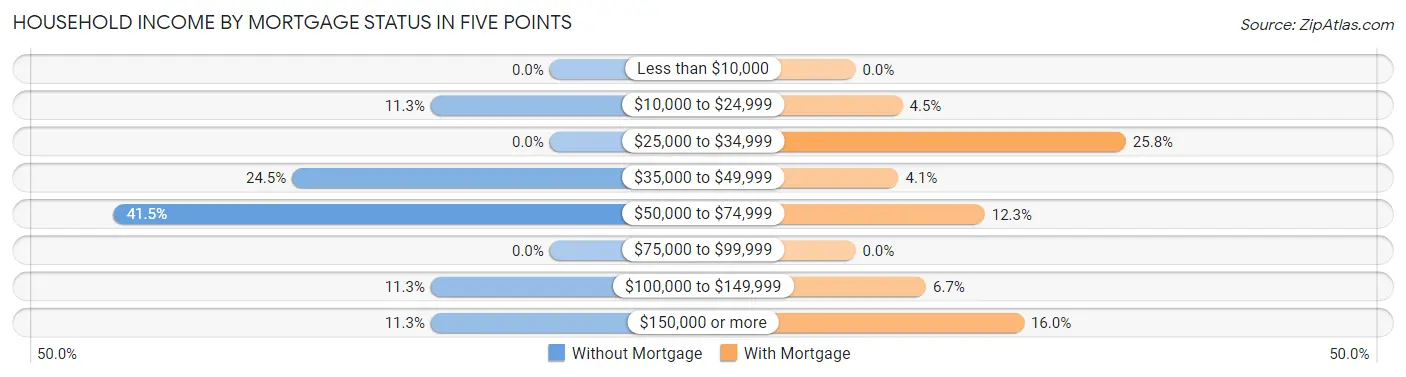
| Household Income | Without Mortgage | With Mortgage |
| Less than $10,000 | 0 (0.0%) | 0 (0.0%) |
| $10,000 to $24,999 | 6 (11.3%) | 12 (4.5%) |
| $25,000 to $34,999 | 0 (0.0%) | 69 (25.8%) |
| $35,000 to $49,999 | 13 (24.5%) | 11 (4.1%) |
| $50,000 to $74,999 | 22 (41.5%) | 33 (12.3%) |
| $75,000 to $99,999 | 0 (0.0%) | 0 (0.0%) |
| $100,000 to $149,999 | 6 (11.3%) | 18 (6.7%) |
| $150,000 or more | 6 (11.3%) | 43 (16.0%) |
| Total | 53 (100.0%) | 268 (100.0%) |
Property Value to Household Income Ratio in Five Points
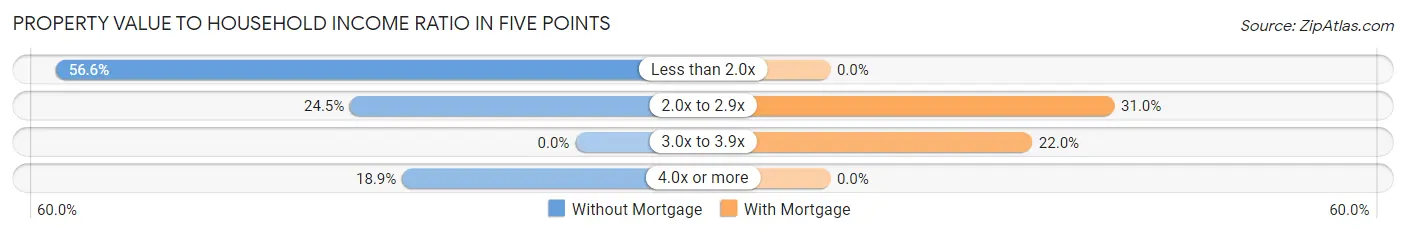
| Value-to-Income Ratio | Without Mortgage | With Mortgage |
| Less than 2.0x | 30 (56.6%) | 0 (0.0%) |
| 2.0x to 2.9x | 13 (24.5%) | 83 (31.0%) |
| 3.0x to 3.9x | 0 (0.0%) | 59 (22.0%) |
| 4.0x or more | 10 (18.9%) | 0 (0.0%) |
| Total | 53 (100.0%) | 268 (100.0%) |
Real Estate Taxes by Mortgage Status in Five Points
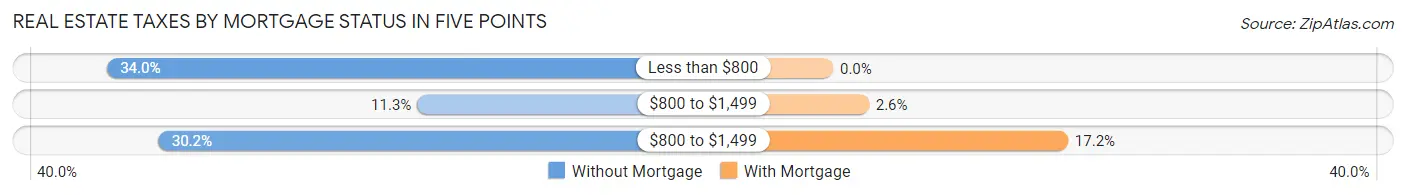
| Property Taxes | Without Mortgage | With Mortgage |
| Less than $800 | 18 (34.0%) | 0 (0.0%) |
| $800 to $1,499 | 6 (11.3%) | 7 (2.6%) |
| $800 to $1,499 | 16 (30.2%) | 46 (17.2%) |
| Total | 53 (100.0%) | 268 (100.0%) |
Health & Disability in Five Points
Health Insurance Coverage by Age in Five Points
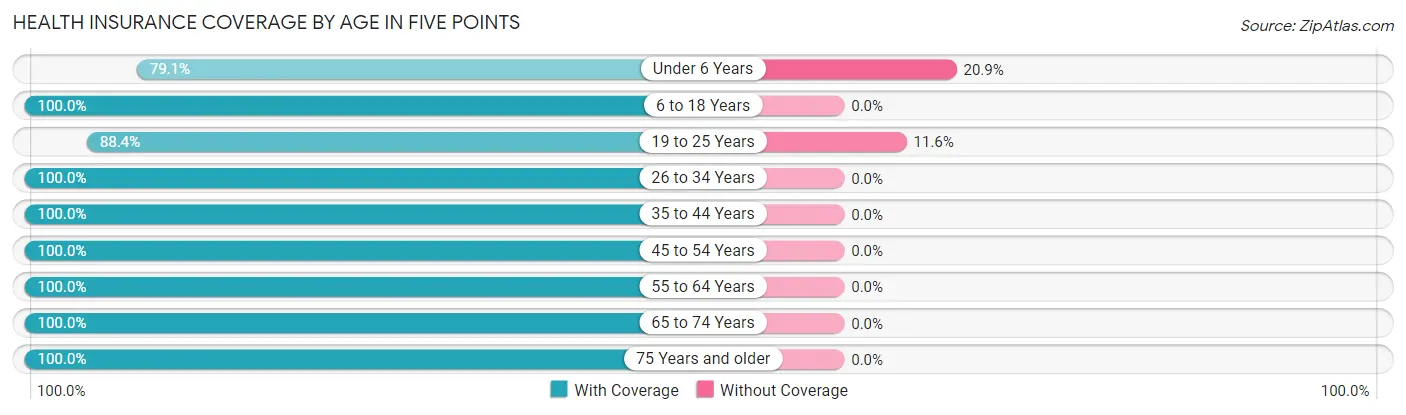
| Age Bracket | With Coverage | Without Coverage |
| Under 6 Years | 68 (79.1%) | 18 (20.9%) |
| 6 to 18 Years | 106 (100.0%) | 0 (0.0%) |
| 19 to 25 Years | 175 (88.4%) | 23 (11.6%) |
| 26 to 34 Years | 125 (100.0%) | 0 (0.0%) |
| 35 to 44 Years | 97 (100.0%) | 0 (0.0%) |
| 45 to 54 Years | 149 (100.0%) | 0 (0.0%) |
| 55 to 64 Years | 172 (100.0%) | 0 (0.0%) |
| 65 to 74 Years | 121 (100.0%) | 0 (0.0%) |
| 75 Years and older | 27 (100.0%) | 0 (0.0%) |
| Total | 1,040 (96.2%) | 41 (3.8%) |
Health Insurance Coverage by Citizenship Status in Five Points
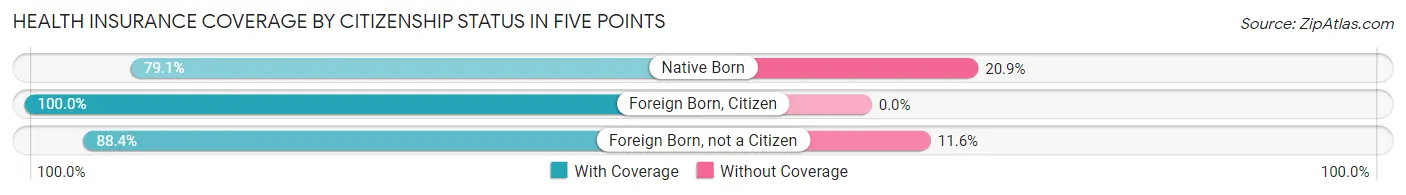
| Citizenship Status | With Coverage | Without Coverage |
| Native Born | 68 (79.1%) | 18 (20.9%) |
| Foreign Born, Citizen | 106 (100.0%) | 0 (0.0%) |
| Foreign Born, not a Citizen | 175 (88.4%) | 23 (11.6%) |
Health Insurance Coverage by Household Income in Five Points
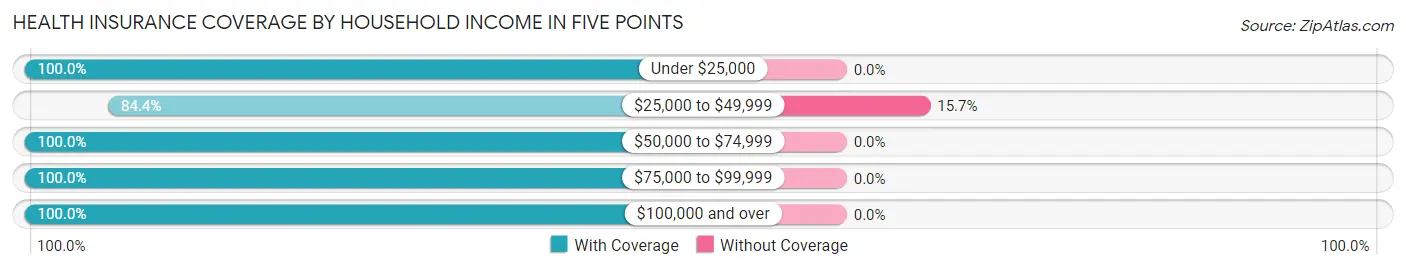
| Household Income | With Coverage | Without Coverage |
| Under $25,000 | 120 (100.0%) | 0 (0.0%) |
| $25,000 to $49,999 | 221 (84.4%) | 41 (15.7%) |
| $50,000 to $74,999 | 96 (100.0%) | 0 (0.0%) |
| $75,000 to $99,999 | 38 (100.0%) | 0 (0.0%) |
| $100,000 and over | 565 (100.0%) | 0 (0.0%) |
Public vs Private Health Insurance Coverage by Age in Five Points
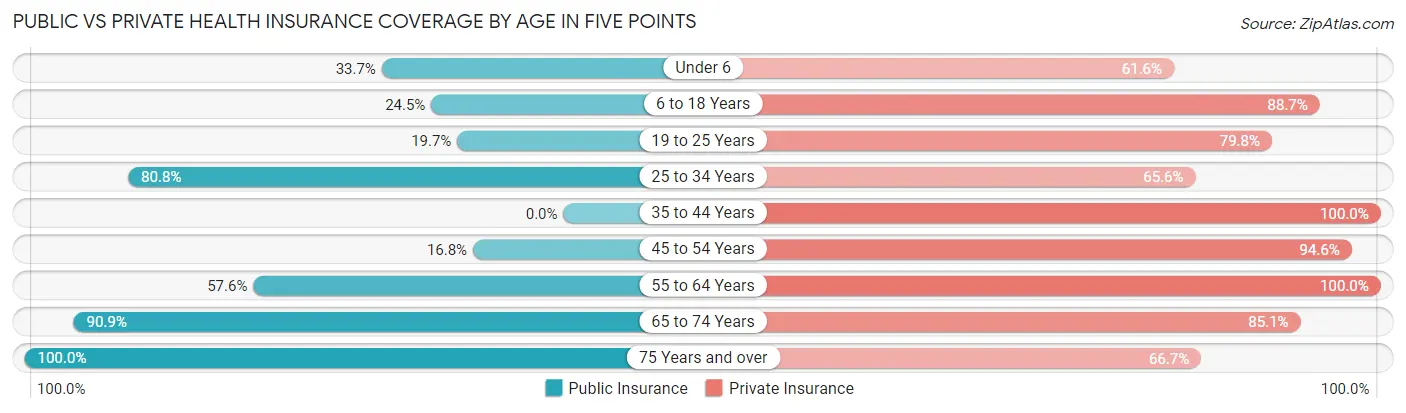
| Age Bracket | Public Insurance | Private Insurance |
| Under 6 | 29 (33.7%) | 53 (61.6%) |
| 6 to 18 Years | 26 (24.5%) | 94 (88.7%) |
| 19 to 25 Years | 39 (19.7%) | 158 (79.8%) |
| 25 to 34 Years | 101 (80.8%) | 82 (65.6%) |
| 35 to 44 Years | 0 (0.0%) | 97 (100.0%) |
| 45 to 54 Years | 25 (16.8%) | 141 (94.6%) |
| 55 to 64 Years | 99 (57.6%) | 172 (100.0%) |
| 65 to 74 Years | 110 (90.9%) | 103 (85.1%) |
| 75 Years and over | 27 (100.0%) | 18 (66.7%) |
| Total | 456 (42.2%) | 918 (84.9%) |
Disability Status by Sex by Age in Five Points
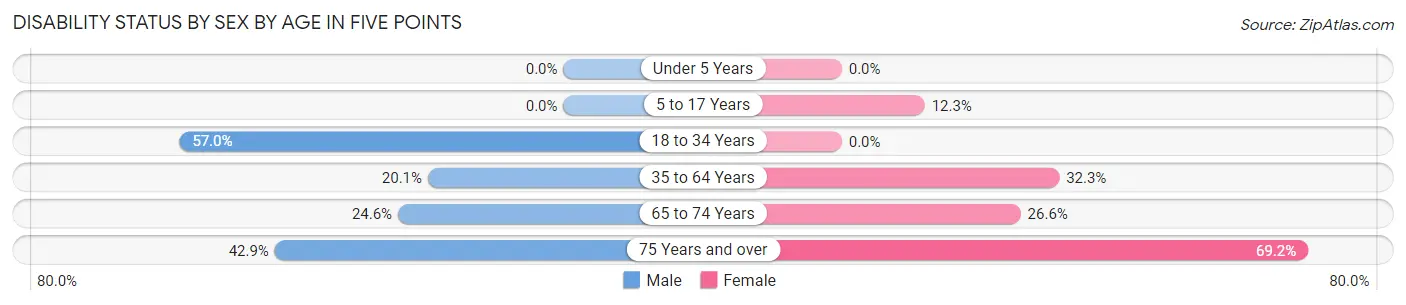
| Age Bracket | Male | Female |
| Under 5 Years | 0 (0.0%) | 0 (0.0%) |
| 5 to 17 Years | 0 (0.0%) | 8 (12.3%) |
| 18 to 34 Years | 65 (57.0%) | 0 (0.0%) |
| 35 to 64 Years | 33 (20.1%) | 82 (32.3%) |
| 65 to 74 Years | 14 (24.6%) | 17 (26.6%) |
| 75 Years and over | 6 (42.9%) | 9 (69.2%) |
Disability Class by Sex by Age in Five Points
Disability Class: Hearing Difficulty
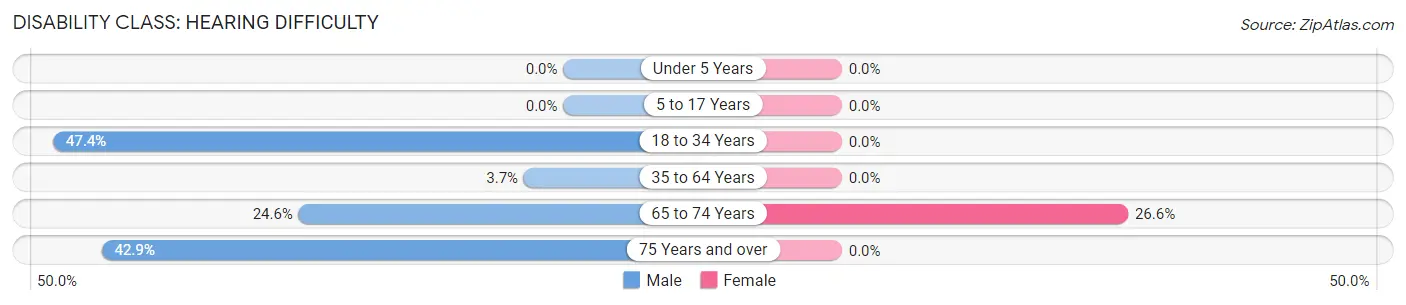
| Age Bracket | Male | Female |
| Under 5 Years | 0 (0.0%) | 0 (0.0%) |
| 5 to 17 Years | 0 (0.0%) | 0 (0.0%) |
| 18 to 34 Years | 54 (47.4%) | 0 (0.0%) |
| 35 to 64 Years | 6 (3.7%) | 0 (0.0%) |
| 65 to 74 Years | 14 (24.6%) | 17 (26.6%) |
| 75 Years and over | 6 (42.9%) | 0 (0.0%) |
Disability Class: Vision Difficulty
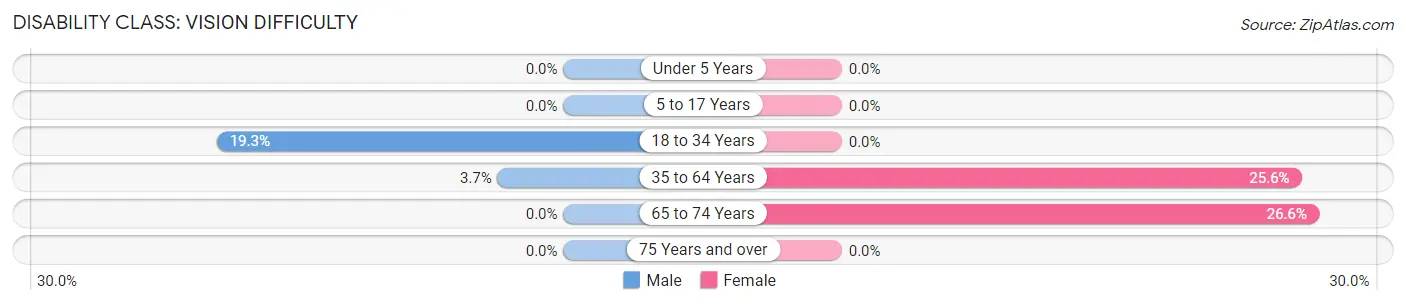
| Age Bracket | Male | Female |
| Under 5 Years | 0 (0.0%) | 0 (0.0%) |
| 5 to 17 Years | 0 (0.0%) | 0 (0.0%) |
| 18 to 34 Years | 22 (19.3%) | 0 (0.0%) |
| 35 to 64 Years | 6 (3.7%) | 65 (25.6%) |
| 65 to 74 Years | 0 (0.0%) | 17 (26.6%) |
| 75 Years and over | 0 (0.0%) | 0 (0.0%) |
Disability Class: Cognitive Difficulty
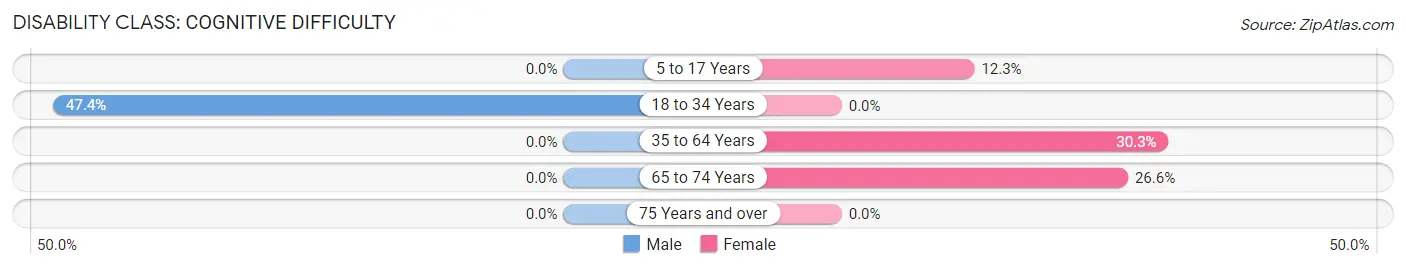
| Age Bracket | Male | Female |
| 5 to 17 Years | 0 (0.0%) | 8 (12.3%) |
| 18 to 34 Years | 54 (47.4%) | 0 (0.0%) |
| 35 to 64 Years | 0 (0.0%) | 77 (30.3%) |
| 65 to 74 Years | 0 (0.0%) | 17 (26.6%) |
| 75 Years and over | 0 (0.0%) | 0 (0.0%) |
Disability Class: Ambulatory Difficulty
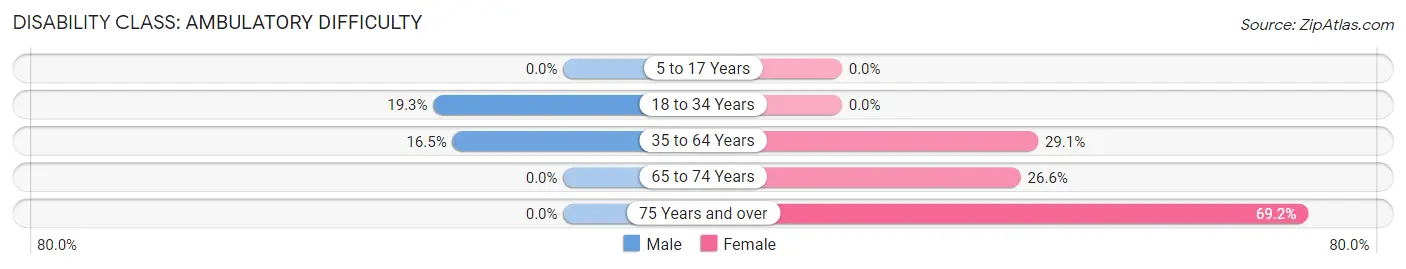
| Age Bracket | Male | Female |
| 5 to 17 Years | 0 (0.0%) | 0 (0.0%) |
| 18 to 34 Years | 22 (19.3%) | 0 (0.0%) |
| 35 to 64 Years | 27 (16.5%) | 74 (29.1%) |
| 65 to 74 Years | 0 (0.0%) | 17 (26.6%) |
| 75 Years and over | 0 (0.0%) | 9 (69.2%) |
Disability Class: Self-Care Difficulty
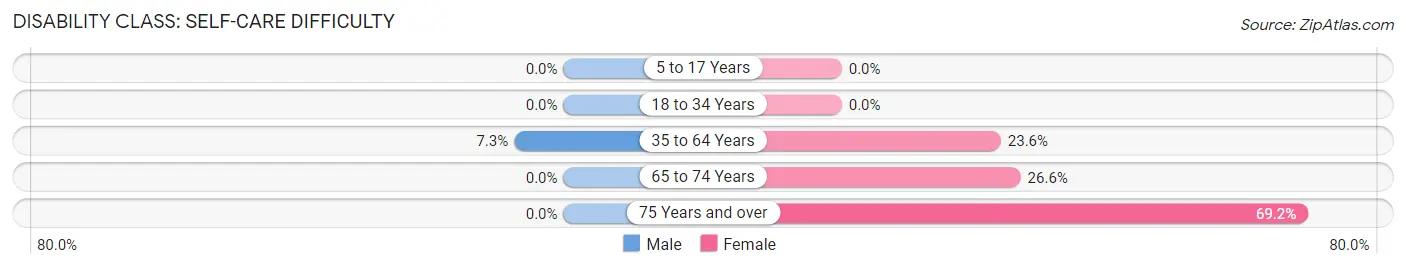
| Age Bracket | Male | Female |
| 5 to 17 Years | 0 (0.0%) | 0 (0.0%) |
| 18 to 34 Years | 0 (0.0%) | 0 (0.0%) |
| 35 to 64 Years | 12 (7.3%) | 60 (23.6%) |
| 65 to 74 Years | 0 (0.0%) | 17 (26.6%) |
| 75 Years and over | 0 (0.0%) | 9 (69.2%) |
Technology Access in Five Points
Computing Device Access in Five Points
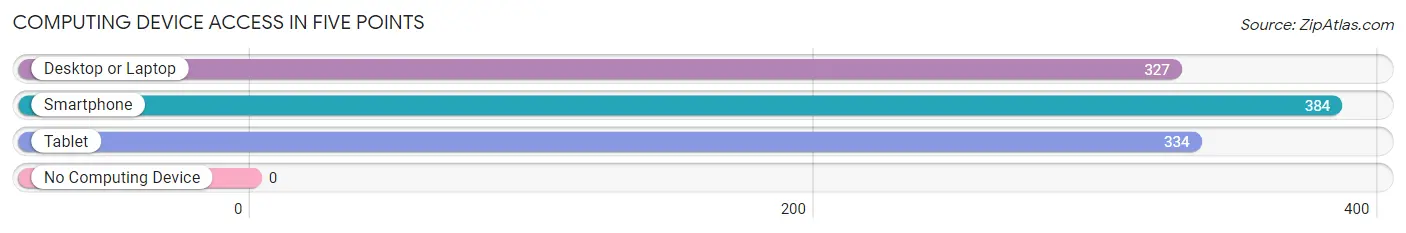
| Device Type | # Households | % Households |
| Desktop or Laptop | 327 | 82.8% |
| Smartphone | 384 | 97.2% |
| Tablet | 334 | 84.6% |
| No Computing Device | 0 | 0.0% |
| Total | 395 | 100.0% |
Internet Access in Five Points
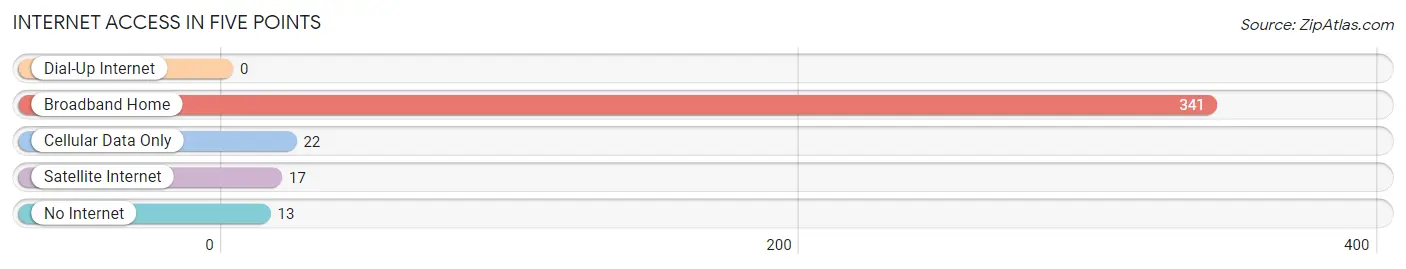
| Internet Type | # Households | % Households |
| Dial-Up Internet | 0 | 0.0% |
| Broadband Home | 341 | 86.3% |
| Cellular Data Only | 22 | 5.6% |
| Satellite Internet | 17 | 4.3% |
| No Internet | 13 | 3.3% |
| Total | 395 | 100.0% |
Five Points Summary
Five Points is a small unincorporated community located in the western part of Johnston County, North Carolina. It is situated along the Neuse River, approximately 20 miles south of Raleigh. The community is named for the five points of intersection of the Neuse River, the Little River, and the White Oak Creek.
History
Five Points was first settled in the late 1700s by a group of settlers from Virginia. The area was originally known as “Five Points Crossroads” due to the five points of intersection of the Neuse River, the Little River, and the White Oak Creek. The area was primarily used for farming and timber production.
In the early 1800s, the area began to develop as a small trading post. The first store was opened in 1820 and the first post office was established in 1825. The area continued to grow and by the mid-1800s, the community had become a popular stop for travelers and traders.
In the late 1800s, the area began to develop into a small town. The first school was built in 1887 and the first church was established in 1889. The town continued to grow and by the early 1900s, it had become a thriving community with several stores, churches, and a post office.
Geography
Five Points is located in the western part of Johnston County, North Carolina. It is situated along the Neuse River, approximately 20 miles south of Raleigh. The community is surrounded by rolling hills and is located in a rural area. The area is mostly flat with some small hills and valleys.
The climate in Five Points is mild and humid. The average temperature in the summer is around 80 degrees Fahrenheit and the average temperature in the winter is around 40 degrees Fahrenheit. The area receives an average of 45 inches of rain per year.
Economy
The economy of Five Points is primarily based on agriculture and timber production. The area is home to several farms and timber companies. The area also has several small businesses, including restaurants, stores, and service providers.
The area is also home to several manufacturing companies, including a furniture factory and a textile mill. The area is also home to several small businesses, including a grocery store, a hardware store, and a gas station.
Demographics
As of the 2010 census, the population of Five Points was 1,845. The population is primarily white (94.3%) and African American (3.7%). The median household income is $41,250 and the median home value is $133,000.
The area is served by the Johnston County School District. The area is home to several churches, including the Five Points Baptist Church, the Five Points Methodist Church, and the Five Points Presbyterian Church.
Conclusion
Five Points is a small unincorporated community located in the western part of Johnston County, North Carolina. It is situated along the Neuse River, approximately 20 miles south of Raleigh. The community is named for the five points of intersection of the Neuse River, the Little River, and the White Oak Creek. The area has a long history of farming and timber production and is now home to several small businesses and manufacturing companies. The population of Five Points is primarily white and African American and the median household income is $41,250. The area is served by the Johnston County School District and is home to several churches.
Common Questions
What is Per Capita Income in Five Points?
Per Capita income in Five Points is $33,810.
What is the Median Family Income in Five Points?
Median Family Income in Five Points is $103,553.
What is Income or Wage Gap in Five Points?
Income or Wage Gap in Five Points is 53.0%.
Women in Five Points earn 47.0 cents for every dollar earned by a man.
What is Inequality or Gini Index in Five Points?
Inequality or Gini Index in Five Points is 0.51.
What is the Total Population of Five Points?
Total Population of Five Points is 1,136.
What is the Total Male Population of Five Points?
Total Male Population of Five Points is 482.
What is the Total Female Population of Five Points?
Total Female Population of Five Points is 654.
What is the Ratio of Males per 100 Females in Five Points?
There are 73.70 Males per 100 Females in Five Points.
What is the Ratio of Females per 100 Males in Five Points?
There are 135.68 Females per 100 Males in Five Points.
What is the Median Population Age in Five Points?
Median Population Age in Five Points is 37.4 Years.
What is the Average Family Size in Five Points
Average Family Size in Five Points is 3.5 People.
What is the Average Household Size in Five Points
Average Household Size in Five Points is 2.9 People.
How Large is the Labor Force in Five Points?
There are 630 People in the Labor Forcein in Five Points.
What is the Percentage of People in the Labor Force in Five Points?
66.0% of People are in the Labor Force in Five Points.
What is the Unemployment Rate in Five Points?
Unemployment Rate in Five Points is 7.8%.