Cities with the Highest Percentage of Population Employed in Mining, Quarrying, & Extraction in North Carolina
RELATED REPORTS & OPTIONS
Mining, Quarrying, & Extraction
North Carolina
Compare Cities
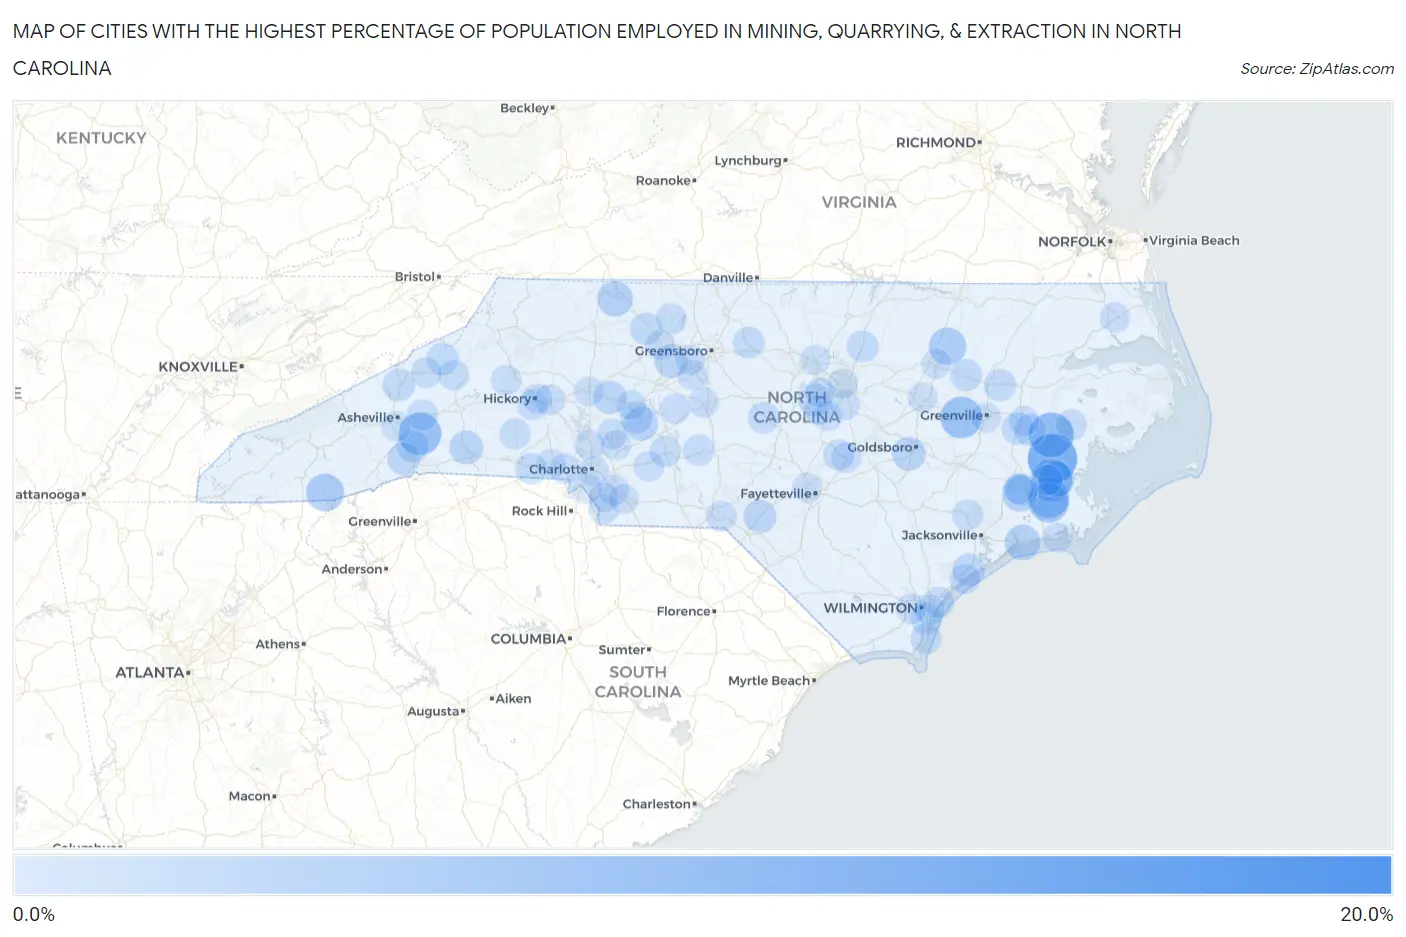
Map of Cities with the Highest Percentage of Population Employed in Mining, Quarrying, & Extraction in North Carolina
0.0%
20.0%
Cities with the Highest Percentage of Population Employed in Mining, Quarrying, & Extraction in North Carolina
| City | % Employed | vs State | vs National | |
| 1. | Gold Hill | 17.1% | 0.13%(+17.0)#1 | 0.44%(+16.7)#333 |
| 2. | Aurora | 10.2% | 0.13%(+10.1)#2 | 0.44%(+9.80)#738 |
| 3. | Bath | 7.7% | 0.13%(+7.57)#3 | 0.44%(+7.25)#1,049 |
| 4. | Gerton | 6.6% | 0.13%(+6.47)#4 | 0.44%(+6.15)#1,233 |
| 5. | Alliance | 6.2% | 0.13%(+6.10)#5 | 0.44%(+5.78)#1,303 |
| 6. | Farmville | 6.0% | 0.13%(+5.92)#6 | 0.44%(+5.60)#1,347 |
| 7. | Arapahoe | 5.6% | 0.13%(+5.43)#7 | 0.44%(+5.12)#1,454 |
| 8. | Minnesott Beach | 5.1% | 0.13%(+5.00)#8 | 0.44%(+4.69)#1,571 |
| 9. | Highlands | 4.0% | 0.13%(+3.90)#9 | 0.44%(+3.59)#1,929 |
| 10. | Whitakers | 3.8% | 0.13%(+3.70)#10 | 0.44%(+3.39)#2,028 |
| 11. | Bayboro | 3.2% | 0.13%(+3.06)#11 | 0.44%(+2.75)#2,370 |
| 12. | White Plains | 2.9% | 0.13%(+2.80)#12 | 0.44%(+2.49)#2,530 |
| 13. | Brices Creek | 2.9% | 0.13%(+2.78)#13 | 0.44%(+2.46)#2,544 |
| 14. | Cape Carteret | 2.8% | 0.13%(+2.72)#14 | 0.44%(+2.41)#2,587 |
| 15. | Mar Mac | 2.0% | 0.13%(+1.89)#15 | 0.44%(+1.57)#3,253 |
| 16. | Rockwell | 2.0% | 0.13%(+1.85)#16 | 0.44%(+1.53)#3,291 |
| 17. | Ruth | 2.0% | 0.13%(+1.83)#17 | 0.44%(+1.52)#3,301 |
| 18. | Wallburg | 1.8% | 0.13%(+1.67)#18 | 0.44%(+1.35)#3,474 |
| 19. | Cleveland | 1.7% | 0.13%(+1.62)#19 | 0.44%(+1.30)#3,515 |
| 20. | Wagram | 1.6% | 0.13%(+1.49)#20 | 0.44%(+1.18)#3,670 |
| 21. | Apex | 1.5% | 0.13%(+1.41)#21 | 0.44%(+1.09)#3,787 |
| 22. | Valley Hill | 1.5% | 0.13%(+1.34)#22 | 0.44%(+1.03)#3,864 |
| 23. | Holly Ridge | 1.4% | 0.13%(+1.29)#23 | 0.44%(+0.973)#3,929 |
| 24. | Faith | 1.3% | 0.13%(+1.20)#24 | 0.44%(+0.887)#4,047 |
| 25. | Mars Hill | 1.2% | 0.13%(+1.09)#25 | 0.44%(+0.779)#4,210 |
| 26. | Fruitland | 1.2% | 0.13%(+1.09)#26 | 0.44%(+0.775)#4,222 |
| 27. | Tobaccoville | 1.1% | 0.13%(+1.02)#27 | 0.44%(+0.708)#4,326 |
| 28. | Robersonville | 1.1% | 0.13%(+1.00)#28 | 0.44%(+0.691)#4,348 |
| 29. | New Bern | 1.1% | 0.13%(+0.988)#29 | 0.44%(+0.674)#4,386 |
| 30. | Chocowinity | 1.1% | 0.13%(+0.975)#30 | 0.44%(+0.662)#4,401 |
| 31. | River Road | 1.1% | 0.13%(+0.975)#31 | 0.44%(+0.661)#4,402 |
| 32. | Bakersville | 1.1% | 0.13%(+0.937)#32 | 0.44%(+0.624)#4,455 |
| 33. | Tarboro | 1.0% | 0.13%(+0.909)#33 | 0.44%(+0.595)#4,500 |
| 34. | Franklinton | 0.89% | 0.13%(+0.767)#34 | 0.44%(+0.454)#4,753 |
| 35. | Goldston | 0.88% | 0.13%(+0.758)#35 | 0.44%(+0.445)#4,773 |
| 36. | Glen Raven | 0.84% | 0.13%(+0.716)#36 | 0.44%(+0.402)#4,848 |
| 37. | Kings Mountain | 0.82% | 0.13%(+0.695)#37 | 0.44%(+0.381)#4,894 |
| 38. | Silver Lake | 0.77% | 0.13%(+0.640)#38 | 0.44%(+0.326)#5,014 |
| 39. | Belhaven | 0.69% | 0.13%(+0.560)#39 | 0.44%(+0.246)#5,239 |
| 40. | Ogden | 0.67% | 0.13%(+0.545)#40 | 0.44%(+0.232)#5,273 |
| 41. | Richlands | 0.65% | 0.13%(+0.523)#41 | 0.44%(+0.209)#5,331 |
| 42. | Troy | 0.62% | 0.13%(+0.498)#42 | 0.44%(+0.184)#5,406 |
| 43. | Belwood | 0.56% | 0.13%(+0.430)#43 | 0.44%(+0.117)#5,612 |
| 44. | Walnut Cove | 0.55% | 0.13%(+0.423)#44 | 0.44%(+0.109)#5,632 |
| 45. | Black Mountain | 0.55% | 0.13%(+0.420)#45 | 0.44%(+0.107)#5,642 |
| 46. | Albemarle | 0.53% | 0.13%(+0.408)#46 | 0.44%(+0.094)#5,680 |
| 47. | Erwin | 0.51% | 0.13%(+0.382)#47 | 0.44%(+0.069)#5,746 |
| 48. | Kure Beach | 0.48% | 0.13%(+0.358)#48 | 0.44%(+0.044)#5,820 |
| 49. | Spruce Pine | 0.45% | 0.13%(+0.328)#49 | 0.44%(+0.015)#5,918 |
| 50. | Burnsville | 0.44% | 0.13%(+0.317)#50 | 0.44%(+0.004)#5,954 |
| 51. | Grantsboro | 0.43% | 0.13%(+0.301)#51 | 0.44%(-0.013)#6,018 |
| 52. | Trent Woods | 0.42% | 0.13%(+0.292)#52 | 0.44%(-0.021)#6,049 |
| 53. | Oakboro | 0.33% | 0.13%(+0.199)#53 | 0.44%(-0.115)#6,401 |
| 54. | Hamlet | 0.32% | 0.13%(+0.197)#54 | 0.44%(-0.116)#6,405 |
| 55. | Leland | 0.32% | 0.13%(+0.193)#55 | 0.44%(-0.121)#6,422 |
| 56. | Mountain View | 0.30% | 0.13%(+0.174)#56 | 0.44%(-0.139)#6,488 |
| 57. | Conover | 0.28% | 0.13%(+0.152)#57 | 0.44%(-0.161)#6,557 |
| 58. | Cramerton | 0.27% | 0.13%(+0.145)#58 | 0.44%(-0.169)#6,590 |
| 59. | Asheboro | 0.26% | 0.13%(+0.135)#59 | 0.44%(-0.178)#6,625 |
| 60. | Dunn | 0.26% | 0.13%(+0.132)#60 | 0.44%(-0.181)#6,641 |
| 61. | Archdale | 0.25% | 0.13%(+0.120)#61 | 0.44%(-0.194)#6,681 |
| 62. | Indian Trail | 0.24% | 0.13%(+0.111)#62 | 0.44%(-0.203)#6,704 |
| 63. | Waxhaw | 0.24% | 0.13%(+0.110)#63 | 0.44%(-0.204)#6,708 |
| 64. | Surf City | 0.24% | 0.13%(+0.110)#64 | 0.44%(-0.204)#6,709 |
| 65. | Washington | 0.21% | 0.13%(+0.083)#65 | 0.44%(-0.230)#6,827 |
| 66. | Gamewell | 0.20% | 0.13%(+0.077)#66 | 0.44%(-0.236)#6,848 |
| 67. | Elizabeth City | 0.19% | 0.13%(+0.067)#67 | 0.44%(-0.246)#6,890 |
| 68. | Denton | 0.17% | 0.13%(+0.043)#68 | 0.44%(-0.270)#6,984 |
| 69. | Kannapolis | 0.16% | 0.13%(+0.028)#69 | 0.44%(-0.285)#7,043 |
| 70. | Hickory | 0.16% | 0.13%(+0.028)#70 | 0.44%(-0.285)#7,044 |
| 71. | Concord | 0.14% | 0.13%(+0.011)#71 | 0.44%(-0.303)#7,133 |
| 72. | Pineville | 0.14% | 0.13%(+0.009)#72 | 0.44%(-0.304)#7,139 |
| 73. | Statesville | 0.13% | 0.13%(-0.001)#73 | 0.44%(-0.315)#7,196 |
| 74. | Weddington | 0.12% | 0.13%(-0.002)#74 | 0.44%(-0.316)#7,206 |
| 75. | Fuquay Varina | 0.12% | 0.13%(-0.004)#75 | 0.44%(-0.318)#7,221 |
| 76. | Holly Springs | 0.12% | 0.13%(-0.007)#76 | 0.44%(-0.321)#7,235 |
| 77. | Wilmington | 0.12% | 0.13%(-0.008)#77 | 0.44%(-0.321)#7,239 |
| 78. | Rocky Mount | 0.12% | 0.13%(-0.010)#78 | 0.44%(-0.324)#7,251 |
| 79. | Morehead City | 0.11% | 0.13%(-0.012)#79 | 0.44%(-0.326)#7,266 |
| 80. | Asheville | 0.11% | 0.13%(-0.013)#80 | 0.44%(-0.327)#7,271 |
| 81. | Garner | 0.11% | 0.13%(-0.020)#81 | 0.44%(-0.333)#7,306 |
| 82. | Salisbury | 0.093% | 0.13%(-0.034)#82 | 0.44%(-0.348)#7,378 |
| 83. | Wilson | 0.082% | 0.13%(-0.045)#83 | 0.44%(-0.358)#7,440 |
| 84. | Winston Salem | 0.071% | 0.13%(-0.056)#84 | 0.44%(-0.369)#7,518 |
| 85. | Durham | 0.069% | 0.13%(-0.058)#85 | 0.44%(-0.372)#7,537 |
| 86. | Raleigh | 0.068% | 0.13%(-0.059)#86 | 0.44%(-0.372)#7,544 |
| 87. | Monroe | 0.060% | 0.13%(-0.067)#87 | 0.44%(-0.381)#7,604 |
| 88. | Gastonia | 0.045% | 0.13%(-0.082)#88 | 0.44%(-0.396)#7,696 |
| 89. | Charlotte | 0.044% | 0.13%(-0.083)#89 | 0.44%(-0.397)#7,703 |
| 90. | Greenville | 0.033% | 0.13%(-0.094)#90 | 0.44%(-0.407)#7,779 |
| 91. | Huntersville | 0.021% | 0.13%(-0.106)#91 | 0.44%(-0.419)#7,869 |
| 92. | Fayetteville | 0.017% | 0.13%(-0.110)#92 | 0.44%(-0.423)#7,888 |
| 93. | High Point | 0.017% | 0.13%(-0.110)#93 | 0.44%(-0.423)#7,890 |
| 94. | Cary | 0.0032% | 0.13%(-0.124)#94 | 0.44%(-0.437)#7,939 |
Common Questions
What are the Top 10 Cities with the Highest Percentage of Population Employed in Mining, Quarrying, & Extraction in North Carolina?
Top 10 Cities with the Highest Percentage of Population Employed in Mining, Quarrying, & Extraction in North Carolina are:
What city has the Highest Percentage of Population Employed in Mining, Quarrying, & Extraction in North Carolina?
Aurora has the Highest Percentage of Population Employed in Mining, Quarrying, & Extraction in North Carolina with 10.2%.
What is the Percentage of Population Employed in Mining, Quarrying, & Extraction in the State of North Carolina?
Percentage of Population Employed in Mining, Quarrying, & Extraction in North Carolina is 0.13%.
What is the Percentage of Population Employed in Mining, Quarrying, & Extraction in the United States?
Percentage of Population Employed in Mining, Quarrying, & Extraction in the United States is 0.44%.