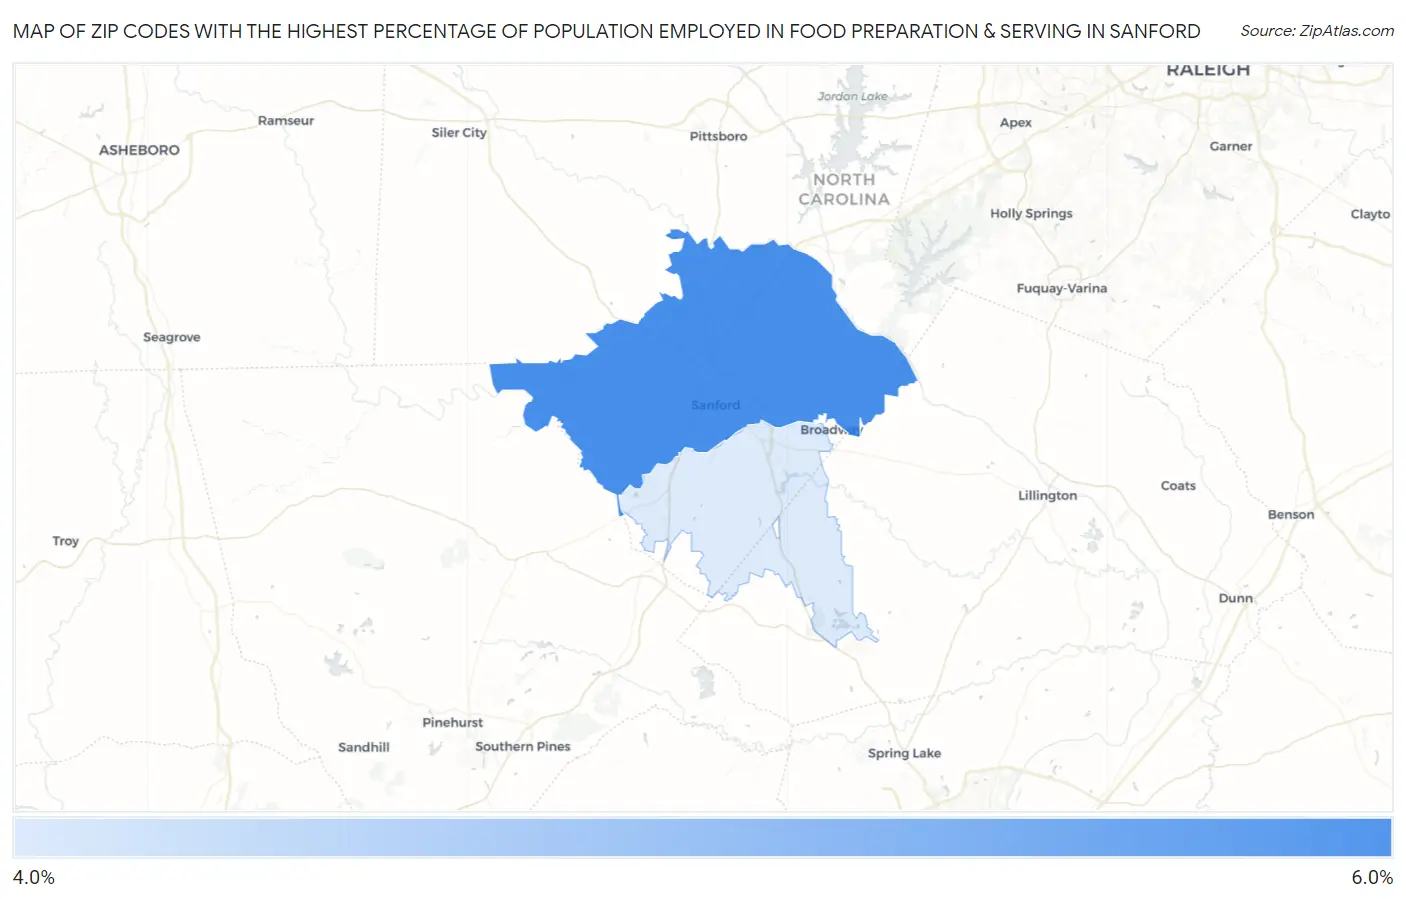
Zip Codes with the Highest Percentage of Population Employed in Food Preparation & Serving in Sanford, NC
RELATED REPORTS & OPTIONS
Food Preparation & Serving
Sanford
Compare Zip Codes
Map of Zip Codes with the Highest Percentage of Population Employed in Food Preparation & Serving in Sanford
4.1%
5.2%
Zip Codes with the Highest Percentage of Population Employed in Food Preparation & Serving in Sanford, NC
| Zip Code | % Employed | vs State | vs National | |
| 1. | 27330 | 5.2% | 5.3%(-0.086)#335 | 5.3%(-0.082)#12,120 |
| 2. | 27332 | 4.1% | 5.3%(-1.17)#461 | 5.3%(-1.17)#16,640 |
1
Common Questions
What are the Top Zip Codes with the Highest Percentage of Population Employed in Food Preparation & Serving in Sanford, NC?
Top Zip Codes with the Highest Percentage of Population Employed in Food Preparation & Serving in Sanford, NC are:
What zip code has the Highest Percentage of Population Employed in Food Preparation & Serving in Sanford, NC?
27330 has the Highest Percentage of Population Employed in Food Preparation & Serving in Sanford, NC with 5.2%.
What is the Percentage of Population Employed in Food Preparation & Serving in Sanford, NC?
Percentage of Population Employed in Food Preparation & Serving in Sanford is 5.7%.
What is the Percentage of Population Employed in Food Preparation & Serving in North Carolina?
Percentage of Population Employed in Food Preparation & Serving in North Carolina is 5.3%.
What is the Percentage of Population Employed in Food Preparation & Serving in the United States?
Percentage of Population Employed in Food Preparation & Serving in the United States is 5.3%.