Zip Codes with the Highest Percentage of Population Employed in Food Preparation & Serving in Raleigh, NC
RELATED REPORTS & OPTIONS
Food Preparation & Serving
Raleigh
Compare Zip Codes
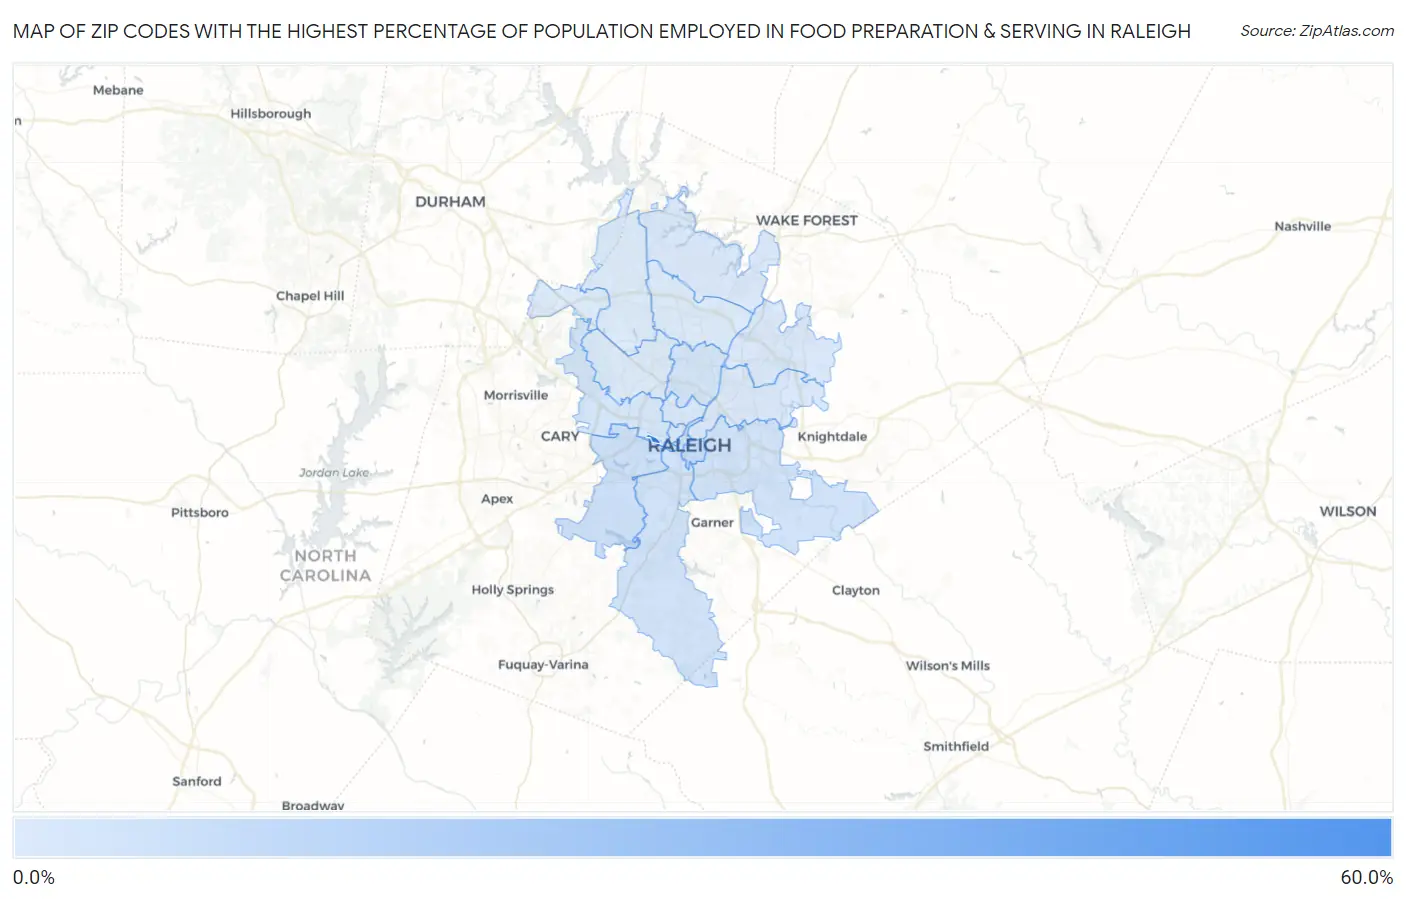
Map of Zip Codes with the Highest Percentage of Population Employed in Food Preparation & Serving in Raleigh
3.1%
54.6%
Zip Codes with the Highest Percentage of Population Employed in Food Preparation & Serving in Raleigh, NC
| Zip Code | % Employed | vs State | vs National | |
| 1. | 27695 | 54.6% | 5.3%(+49.3)#1 | 5.3%(+49.3)#43 |
| 2. | 27601 | 9.8% | 5.3%(+4.52)#72 | 5.3%(+4.52)#2,789 |
| 3. | 27606 | 7.9% | 5.3%(+2.58)#134 | 5.3%(+2.58)#4,934 |
| 4. | 27610 | 6.4% | 5.3%(+1.09)#215 | 5.3%(+1.09)#8,191 |
| 5. | 27603 | 6.1% | 5.3%(+0.787)#239 | 5.3%(+0.792)#9,095 |
| 6. | 27609 | 5.7% | 5.3%(+0.379)#283 | 5.3%(+0.384)#10,456 |
| 7. | 27607 | 4.7% | 5.3%(-0.550)#391 | 5.3%(-0.546)#13,989 |
| 8. | 27605 | 4.6% | 5.3%(-0.658)#408 | 5.3%(-0.654)#14,442 |
| 9. | 27616 | 4.0% | 5.3%(-1.28)#474 | 5.3%(-1.28)#17,104 |
| 10. | 27604 | 3.6% | 5.3%(-1.68)#511 | 5.3%(-1.68)#18,735 |
| 11. | 27614 | 3.5% | 5.3%(-1.80)#524 | 5.3%(-1.79)#19,219 |
| 12. | 27608 | 3.4% | 5.3%(-1.88)#535 | 5.3%(-1.87)#19,559 |
| 13. | 27613 | 3.3% | 5.3%(-1.97)#550 | 5.3%(-1.97)#19,997 |
| 14. | 27615 | 3.2% | 5.3%(-2.10)#563 | 5.3%(-2.10)#20,518 |
| 15. | 27612 | 3.2% | 5.3%(-2.11)#564 | 5.3%(-2.11)#20,554 |
| 16. | 27617 | 3.1% | 5.3%(-2.22)#580 | 5.3%(-2.22)#20,986 |
1
Common Questions
What are the Top 10 Zip Codes with the Highest Percentage of Population Employed in Food Preparation & Serving in Raleigh, NC?
Top 10 Zip Codes with the Highest Percentage of Population Employed in Food Preparation & Serving in Raleigh, NC are:
What zip code has the Highest Percentage of Population Employed in Food Preparation & Serving in Raleigh, NC?
27695 has the Highest Percentage of Population Employed in Food Preparation & Serving in Raleigh, NC with 54.6%.
What is the Percentage of Population Employed in Food Preparation & Serving in Raleigh, NC?
Percentage of Population Employed in Food Preparation & Serving in Raleigh is 5.1%.
What is the Percentage of Population Employed in Food Preparation & Serving in North Carolina?
Percentage of Population Employed in Food Preparation & Serving in North Carolina is 5.3%.
What is the Percentage of Population Employed in Food Preparation & Serving in the United States?
Percentage of Population Employed in Food Preparation & Serving in the United States is 5.3%.