Zip Codes with the Highest Percentage of Population Employed in Food Preparation & Serving in High Point, NC
RELATED REPORTS & OPTIONS
Food Preparation & Serving
High Point
Compare Zip Codes
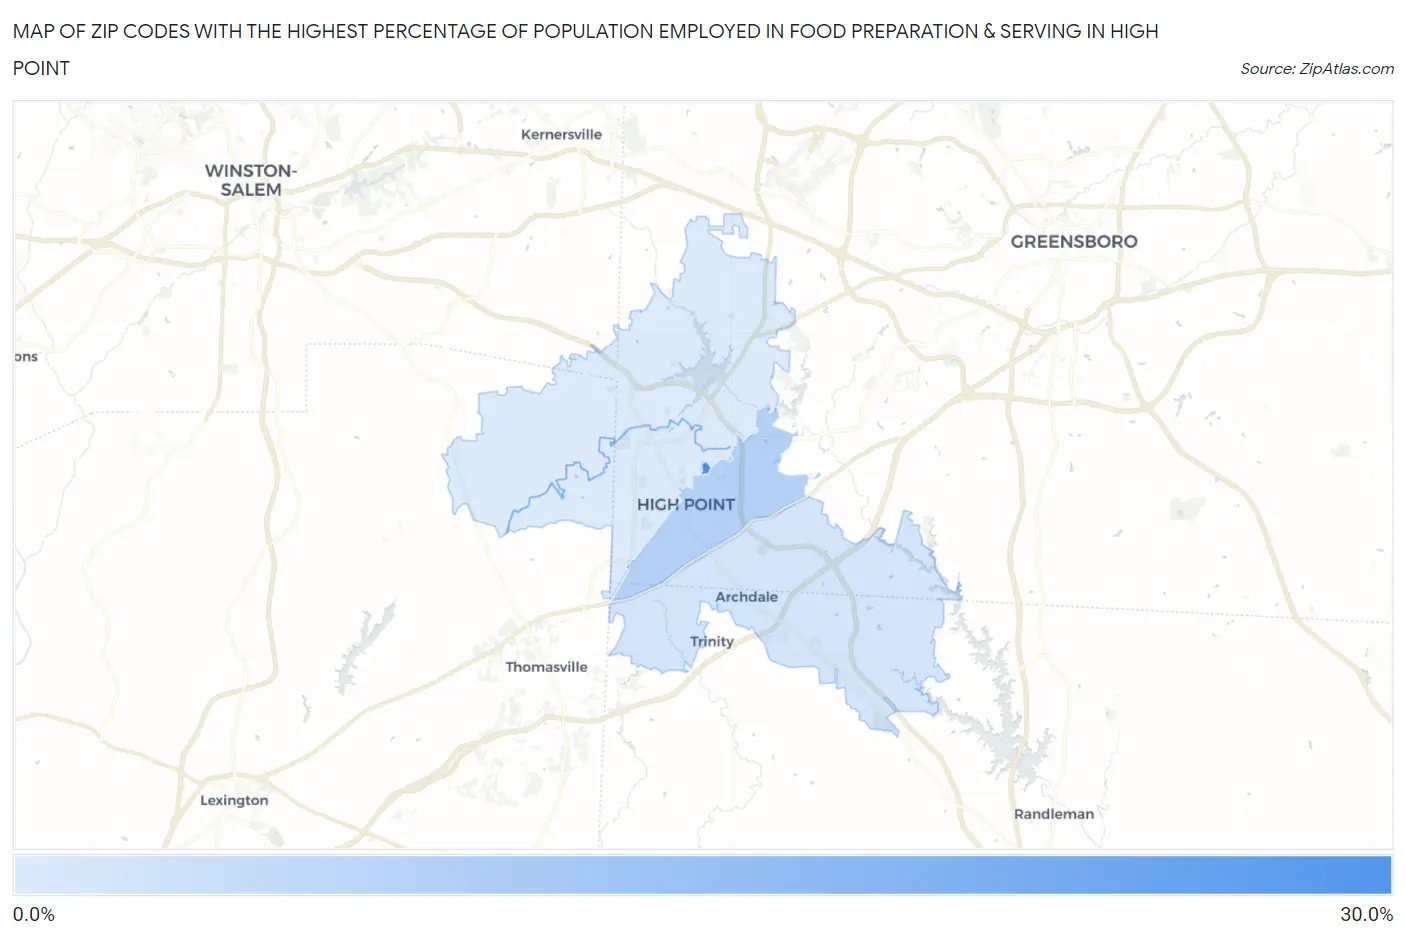
Map of Zip Codes with the Highest Percentage of Population Employed in Food Preparation & Serving in High Point
5.1%
27.0%
Zip Codes with the Highest Percentage of Population Employed in Food Preparation & Serving in High Point, NC
| Zip Code | % Employed | vs State | vs National | |
| 1. | 27268 | 27.0% | 5.3%(+21.7)#8 | 5.3%(+21.7)#264 |
| 2. | 27260 | 10.7% | 5.3%(+5.37)#58 | 5.3%(+5.37)#2,227 |
| 3. | 27263 | 6.4% | 5.3%(+1.08)#217 | 5.3%(+1.08)#8,223 |
| 4. | 27262 | 5.1% | 5.3%(-0.194)#344 | 5.3%(-0.189)#12,558 |
| 5. | 27265 | 5.1% | 5.3%(-0.228)#349 | 5.3%(-0.223)#12,680 |
1
Common Questions
What are the Top 3 Zip Codes with the Highest Percentage of Population Employed in Food Preparation & Serving in High Point, NC?
Top 3 Zip Codes with the Highest Percentage of Population Employed in Food Preparation & Serving in High Point, NC are:
What zip code has the Highest Percentage of Population Employed in Food Preparation & Serving in High Point, NC?
27268 has the Highest Percentage of Population Employed in Food Preparation & Serving in High Point, NC with 27.0%.
What is the Percentage of Population Employed in Food Preparation & Serving in High Point, NC?
Percentage of Population Employed in Food Preparation & Serving in High Point is 6.2%.
What is the Percentage of Population Employed in Food Preparation & Serving in North Carolina?
Percentage of Population Employed in Food Preparation & Serving in North Carolina is 5.3%.
What is the Percentage of Population Employed in Food Preparation & Serving in the United States?
Percentage of Population Employed in Food Preparation & Serving in the United States is 5.3%.