Zip Codes with the Highest Percentage of Population Employed in Food Preparation & Serving in Henderson, NC
RELATED REPORTS & OPTIONS
Food Preparation & Serving
Henderson
Compare Zip Codes
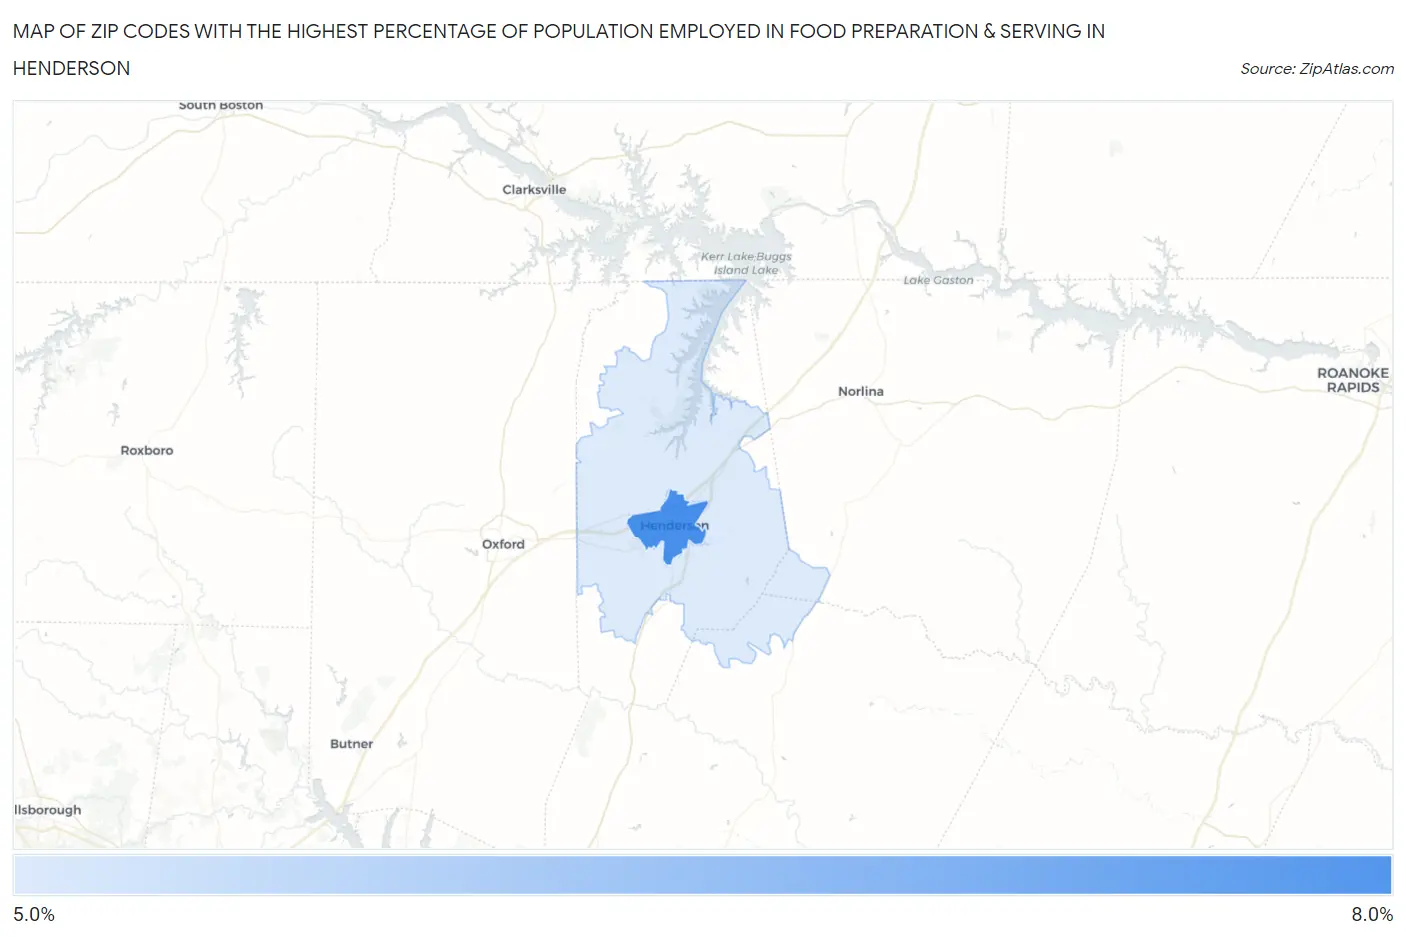
Map of Zip Codes with the Highest Percentage of Population Employed in Food Preparation & Serving in Henderson
5.6%
6.3%
Zip Codes with the Highest Percentage of Population Employed in Food Preparation & Serving in Henderson, NC
| Zip Code | % Employed | vs State | vs National | |
| 1. | 27536 | 6.3% | 5.3%(+1.02)#223 | 5.3%(+1.03)#8,396 |
| 2. | 27537 | 5.6% | 5.3%(+0.347)#291 | 5.3%(+0.351)#10,570 |
1
Common Questions
What are the Top Zip Codes with the Highest Percentage of Population Employed in Food Preparation & Serving in Henderson, NC?
Top Zip Codes with the Highest Percentage of Population Employed in Food Preparation & Serving in Henderson, NC are:
What zip code has the Highest Percentage of Population Employed in Food Preparation & Serving in Henderson, NC?
27536 has the Highest Percentage of Population Employed in Food Preparation & Serving in Henderson, NC with 6.3%.
What is the Percentage of Population Employed in Food Preparation & Serving in Henderson, NC?
Percentage of Population Employed in Food Preparation & Serving in Henderson is 6.5%.
What is the Percentage of Population Employed in Food Preparation & Serving in North Carolina?
Percentage of Population Employed in Food Preparation & Serving in North Carolina is 5.3%.
What is the Percentage of Population Employed in Food Preparation & Serving in the United States?
Percentage of Population Employed in Food Preparation & Serving in the United States is 5.3%.