South Mills, NC Map & Demographics
South Mills Map
South Mills Overview
$22,878
PER CAPITA INCOME
0.36
INEQUALITY / GINI INDEX
627
TOTAL POPULATION
386
MALE POPULATION
241
FEMALE POPULATION
160.17
MALES / 100 FEMALES
62.44
FEMALES / 100 MALES
29.3
MEDIAN AGE
3.4
AVG FAMILY SIZE
3.0
AVG HOUSEHOLD SIZE
367
LABOR FORCE [ PEOPLE ]
96.6%
PERCENT IN LABOR FORCE
9.3%
UNEMPLOYMENT RATE
South Mills Zip Codes
South Mills Area Codes
Income in South Mills
Income Overview in South Mills
| Characteristic | Number | Measure |
| Per Capita Income | 627 | $22,878 |
| Median Family Income | 168 | $0 |
| Mean Family Income | 168 | $69,027 |
| Median Household Income | 206 | $0 |
| Mean Household Income | 206 | $68,237 |
| Income Deficit | 168 | $0 |
| Wage / Income Gap (%) | 627 | 0.00% |
| Wage / Income Gap ($) | 627 | 100.00¢ per $1 |
| Gini / Inequality Index | 627 | 0.36 |
Earnings by Sex in South Mills
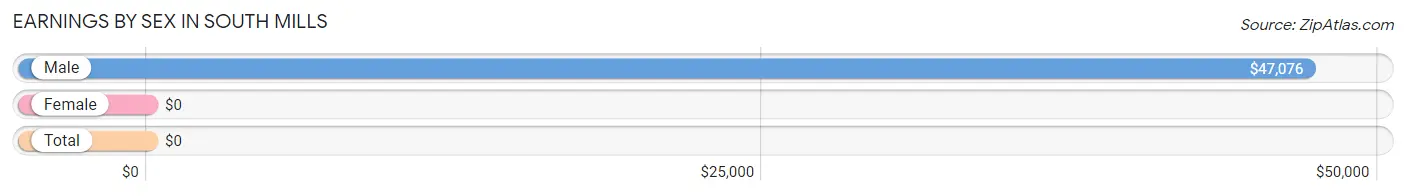
| Sex | Number | Average Earnings |
| Male | 146 (43.8%) | $47,076 |
| Female | 187 (56.2%) | $0 |
| Total | 333 (100.0%) | $0 |
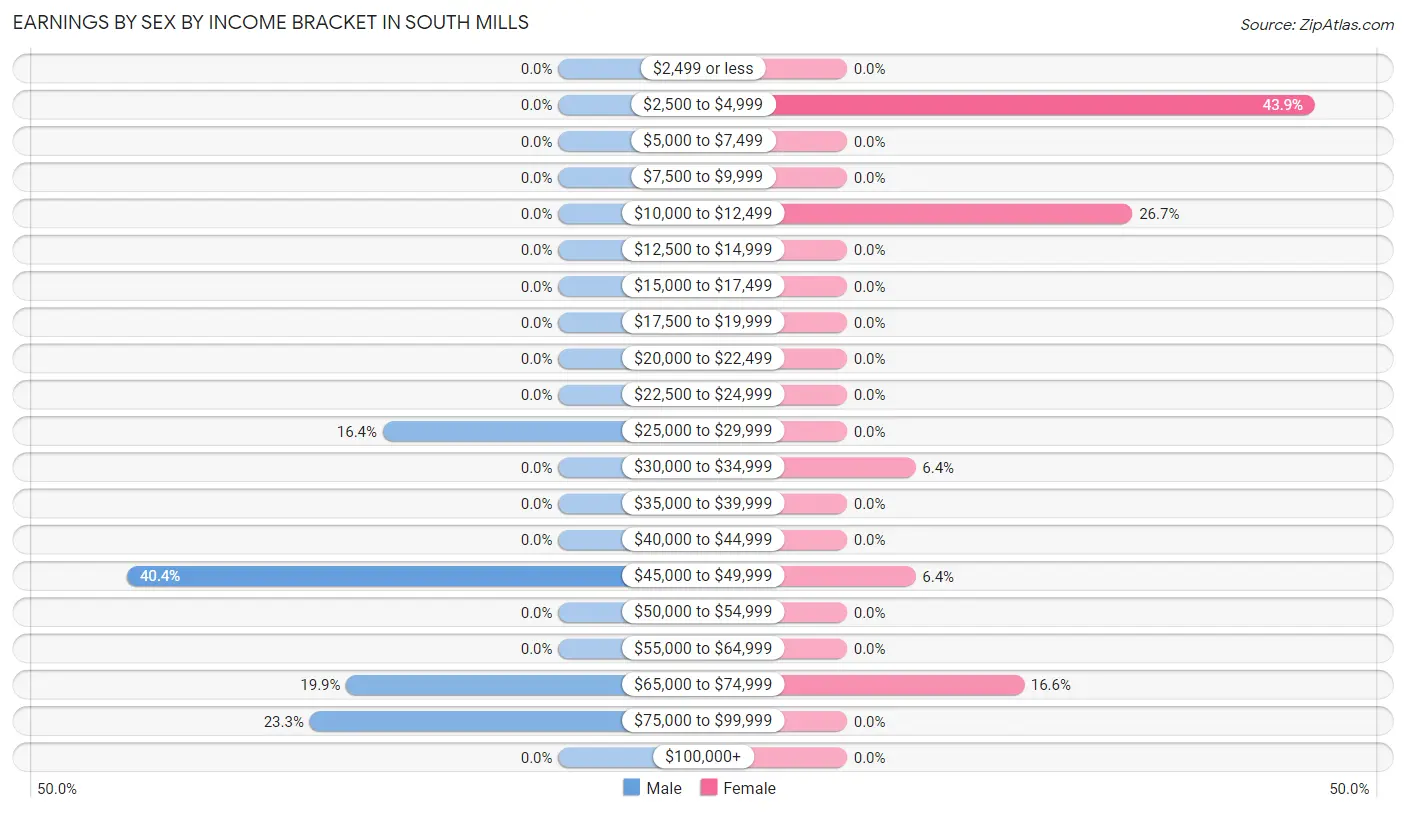
Earnings by Sex by Income Bracket in South Mills
The most common earnings brackets in South Mills are $45,000 to $49,999 for men (59 | 40.4%) and $2,500 to $4,999 for women (82 | 43.9%).
| Income | Male | Female |
| $2,499 or less | 0 (0.0%) | 0 (0.0%) |
| $2,500 to $4,999 | 0 (0.0%) | 82 (43.9%) |
| $5,000 to $7,499 | 0 (0.0%) | 0 (0.0%) |
| $7,500 to $9,999 | 0 (0.0%) | 0 (0.0%) |
| $10,000 to $12,499 | 0 (0.0%) | 50 (26.7%) |
| $12,500 to $14,999 | 0 (0.0%) | 0 (0.0%) |
| $15,000 to $17,499 | 0 (0.0%) | 0 (0.0%) |
| $17,500 to $19,999 | 0 (0.0%) | 0 (0.0%) |
| $20,000 to $22,499 | 0 (0.0%) | 0 (0.0%) |
| $22,500 to $24,999 | 0 (0.0%) | 0 (0.0%) |
| $25,000 to $29,999 | 24 (16.4%) | 0 (0.0%) |
| $30,000 to $34,999 | 0 (0.0%) | 12 (6.4%) |
| $35,000 to $39,999 | 0 (0.0%) | 0 (0.0%) |
| $40,000 to $44,999 | 0 (0.0%) | 0 (0.0%) |
| $45,000 to $49,999 | 59 (40.4%) | 12 (6.4%) |
| $50,000 to $54,999 | 0 (0.0%) | 0 (0.0%) |
| $55,000 to $64,999 | 0 (0.0%) | 0 (0.0%) |
| $65,000 to $74,999 | 29 (19.9%) | 31 (16.6%) |
| $75,000 to $99,999 | 34 (23.3%) | 0 (0.0%) |
| $100,000+ | 0 (0.0%) | 0 (0.0%) |
| Total | 146 (100.0%) | 187 (100.0%) |
Earnings by Sex by Educational Attainment in South Mills
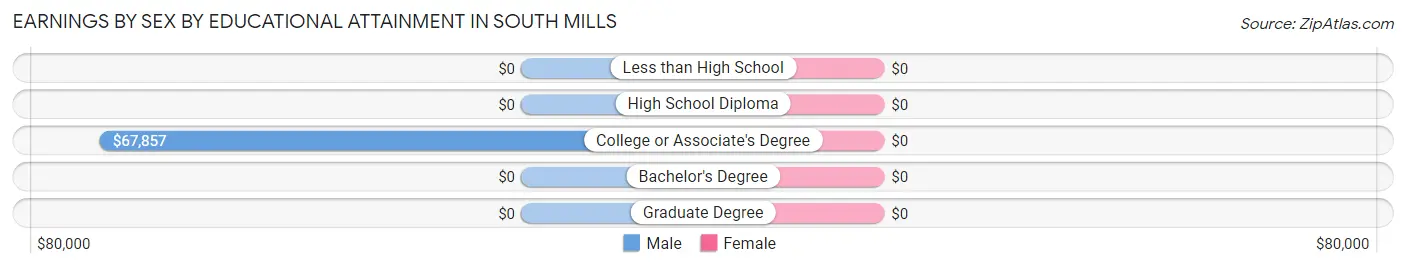
| Educational Attainment | Male Income | Female Income |
| Less than High School | - | - |
| High School Diploma | - | - |
| College or Associate's Degree | $67,857 | $0 |
| Bachelor's Degree | - | - |
| Graduate Degree | - | - |
| Total | $47,076 | $0 |
Family Income in South Mills
Family Income Brackets in South Mills
According to the South Mills family income data, there are 82 families falling into the $25,000 to $34,999 income range, which is the most common income bracket and makes up 48.8% of all families.
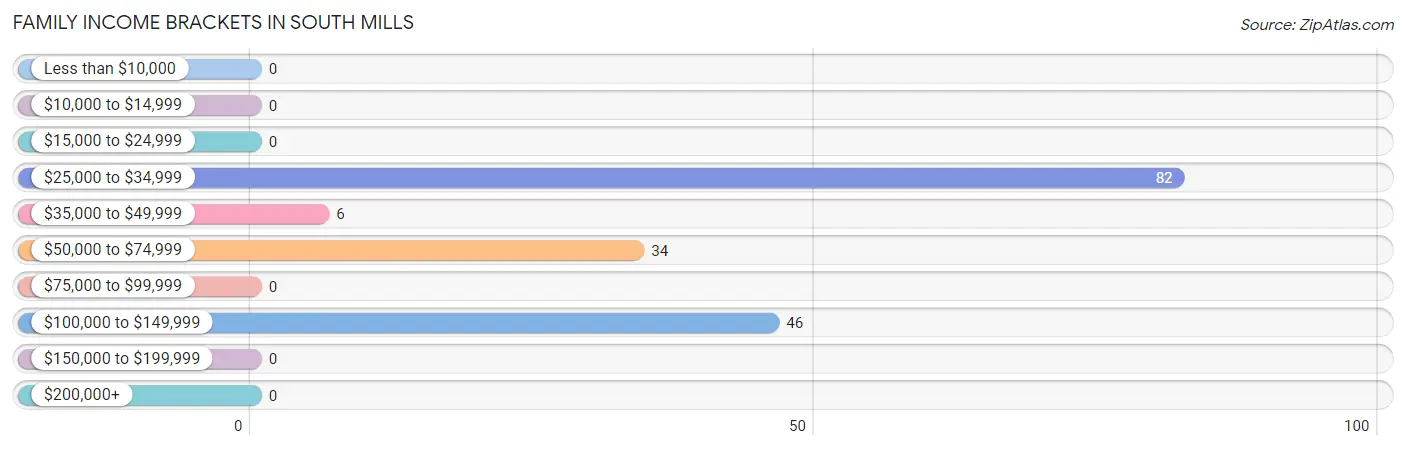
| Income Bracket | # Families | % Families |
| Less than $10,000 | 0 | 0.0% |
| $10,000 to $14,999 | 0 | 0.0% |
| $15,000 to $24,999 | 0 | 0.0% |
| $25,000 to $34,999 | 82 | 48.8% |
| $35,000 to $49,999 | 6 | 3.6% |
| $50,000 to $74,999 | 34 | 20.2% |
| $75,000 to $99,999 | 0 | 0.0% |
| $100,000 to $149,999 | 46 | 27.4% |
| $150,000 to $199,999 | 0 | 0.0% |
| $200,000+ | 0 | 0.0% |
Family Income by Famaliy Size in South Mills
| Income Bracket | # Families | Median Income |
| 2-Person Families | 37 (22.0%) | $0 |
| 3-Person Families | 0 (0.0%) | $0 |
| 4-Person Families | 15 (8.9%) | $0 |
| 5-Person Families | 116 (69.1%) | $0 |
| 6-Person Families | 0 (0.0%) | $0 |
| 7+ Person Families | 0 (0.0%) | $0 |
| Total | 168 (100.0%) | $0 |
Family Income by Number of Earners in South Mills
| Number of Earners | # Families | Median Income |
| No Earners | 6 (3.6%) | $0 |
| 1 Earner | 34 (20.2%) | $0 |
| 2 Earners | 128 (76.2%) | $0 |
| 3+ Earners | 0 (0.0%) | $0 |
| Total | 168 (100.0%) | $0 |
Household Income in South Mills
Household Income Brackets in South Mills
With 106 households falling in the category, the $25,000 to $34,999 income range is the most frequent in South Mills, accounting for 51.5% of all households.
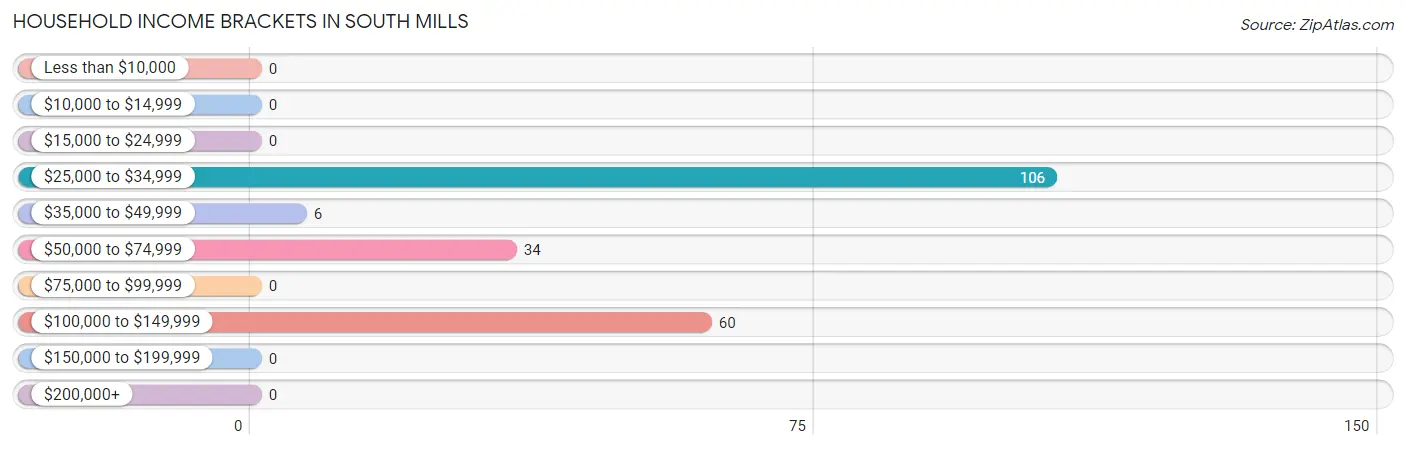
| Income Bracket | # Households | % Households |
| Less than $10,000 | 0 | 0.0% |
| $10,000 to $14,999 | 0 | 0.0% |
| $15,000 to $24,999 | 0 | 0.0% |
| $25,000 to $34,999 | 106 | 51.5% |
| $35,000 to $49,999 | 6 | 2.9% |
| $50,000 to $74,999 | 34 | 16.5% |
| $75,000 to $99,999 | 0 | 0.0% |
| $100,000 to $149,999 | 60 | 29.1% |
| $150,000 to $199,999 | 0 | 0.0% |
| $200,000+ | 0 | 0.0% |
Household Income by Householder Age in South Mills
| Income Bracket | # Households | Median Income |
| 15 to 24 Years | 0 (0.0%) | $0 |
| 25 to 44 Years | 49 (23.8%) | $0 |
| 45 to 64 Years | 151 (73.3%) | $0 |
| 65+ Years | 6 (2.9%) | $0 |
| Total | 206 (100.0%) | $0 |
Poverty in South Mills
Income Below Poverty by Sex and Age in South Mills
With 28.0% poverty level for males and 54.8% for females among the residents of South Mills, 6 to 11 year old males and 45 to 54 year old females are the most vulnerable to poverty, with 108 males (100.0%) and 82 females (87.2%) in their respective age groups living below the poverty level.
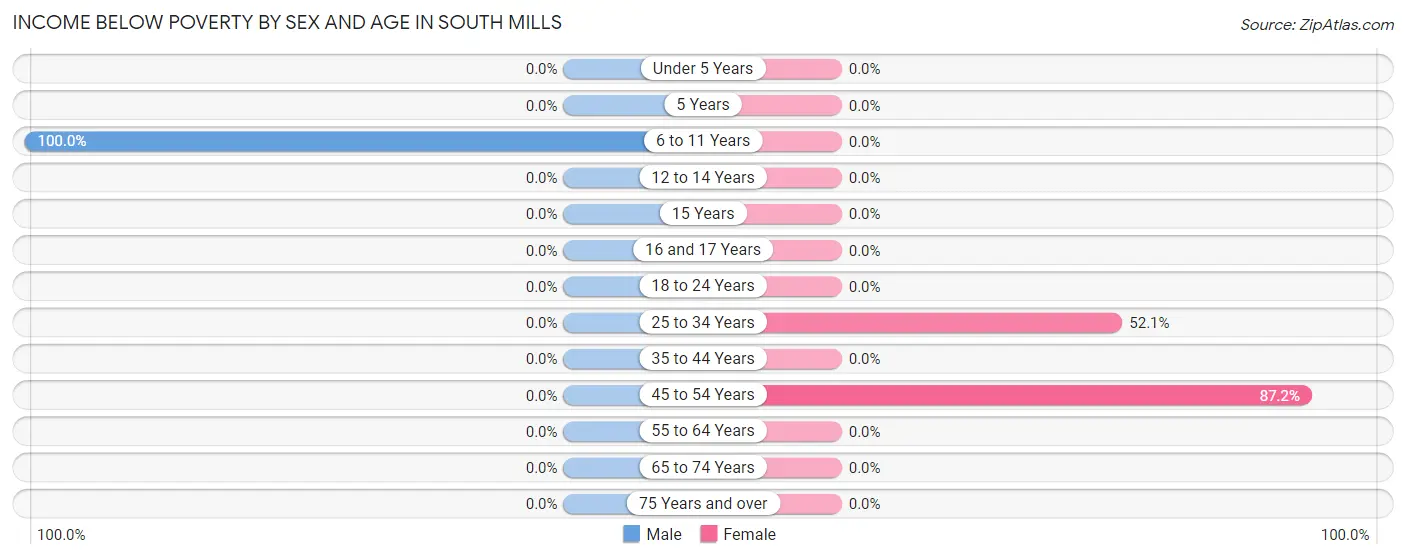
| Age Bracket | Male | Female |
| Under 5 Years | 0 (0.0%) | 0 (0.0%) |
| 5 Years | 0 (0.0%) | 0 (0.0%) |
| 6 to 11 Years | 108 (100.0%) | 0 (0.0%) |
| 12 to 14 Years | 0 (0.0%) | 0 (0.0%) |
| 15 Years | 0 (0.0%) | 0 (0.0%) |
| 16 and 17 Years | 0 (0.0%) | 0 (0.0%) |
| 18 to 24 Years | 0 (0.0%) | 0 (0.0%) |
| 25 to 34 Years | 0 (0.0%) | 50 (52.1%) |
| 35 to 44 Years | 0 (0.0%) | 0 (0.0%) |
| 45 to 54 Years | 0 (0.0%) | 82 (87.2%) |
| 55 to 64 Years | 0 (0.0%) | 0 (0.0%) |
| 65 to 74 Years | 0 (0.0%) | 0 (0.0%) |
| 75 Years and over | 0 (0.0%) | 0 (0.0%) |
| Total | 108 (28.0%) | 132 (54.8%) |
Income Above Poverty by Sex and Age in South Mills
According to the poverty statistics in South Mills, males aged under 5 years and females aged under 5 years are the age groups that are most secure financially, with 100.0% of males and 100.0% of females in these age groups living above the poverty line.
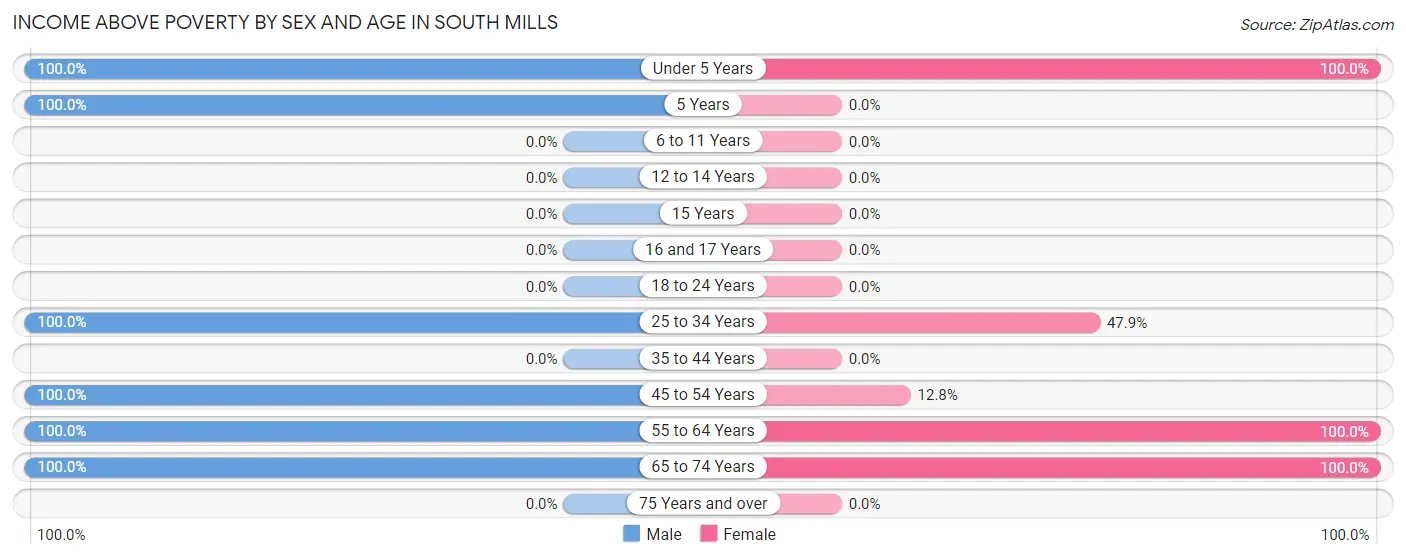
| Age Bracket | Male | Female |
| Under 5 Years | 94 (100.0%) | 13 (100.0%) |
| 5 Years | 32 (100.0%) | 0 (0.0%) |
| 6 to 11 Years | 0 (0.0%) | 0 (0.0%) |
| 12 to 14 Years | 0 (0.0%) | 0 (0.0%) |
| 15 Years | 0 (0.0%) | 0 (0.0%) |
| 16 and 17 Years | 0 (0.0%) | 0 (0.0%) |
| 18 to 24 Years | 0 (0.0%) | 0 (0.0%) |
| 25 to 34 Years | 74 (100.0%) | 46 (47.9%) |
| 35 to 44 Years | 0 (0.0%) | 0 (0.0%) |
| 45 to 54 Years | 24 (100.0%) | 12 (12.8%) |
| 55 to 64 Years | 48 (100.0%) | 31 (100.0%) |
| 65 to 74 Years | 6 (100.0%) | 7 (100.0%) |
| 75 Years and over | 0 (0.0%) | 0 (0.0%) |
| Total | 278 (72.0%) | 109 (45.2%) |
Income Below Poverty Among Married-Couple Families in South Mills
| Children | Above Poverty | Below Poverty |
| No Children | 37 (100.0%) | 0 (0.0%) |
| 1 or 2 Children | 15 (100.0%) | 0 (0.0%) |
| 3 or 4 Children | 34 (100.0%) | 0 (0.0%) |
| 5 or more Children | 0 (0.0%) | 0 (0.0%) |
| Total | 86 (100.0%) | 0 (0.0%) |
Income Below Poverty Among Single-Parent Households in South Mills
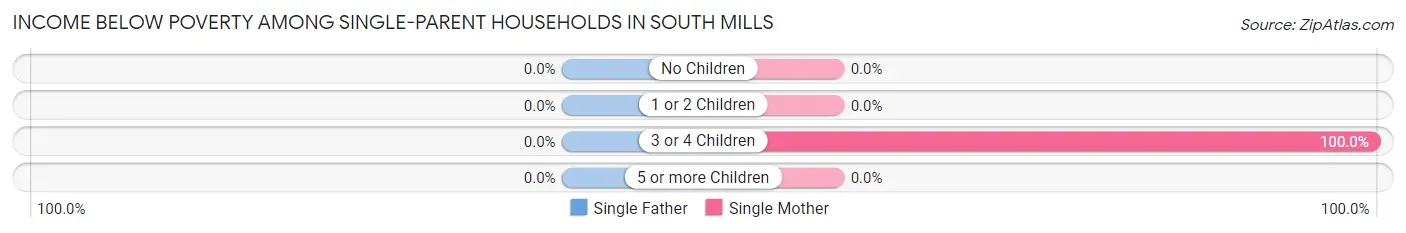
| Children | Single Father | Single Mother |
| No Children | 0 (0.0%) | 0 (0.0%) |
| 1 or 2 Children | 0 (0.0%) | 0 (0.0%) |
| 3 or 4 Children | 0 (0.0%) | 82 (100.0%) |
| 5 or more Children | 0 (0.0%) | 0 (0.0%) |
| Total | 0 (0.0%) | 82 (100.0%) |
Income Below Poverty Among Married-Couple vs Single-Parent Households in South Mills
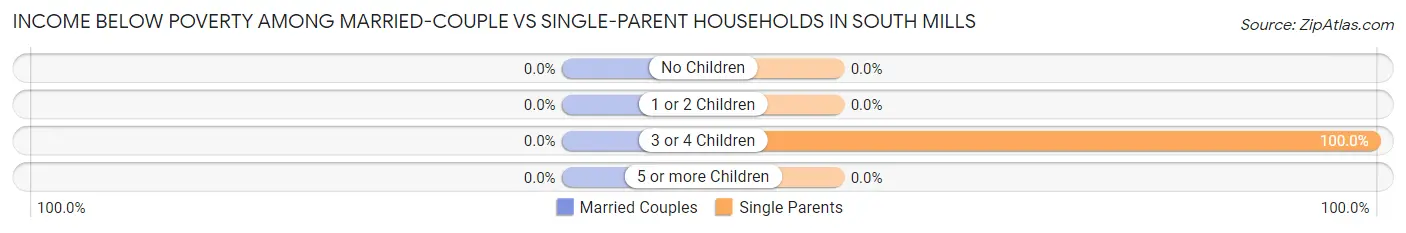
| Children | Married-Couple Families | Single-Parent Households |
| No Children | 0 (0.0%) | 0 (0.0%) |
| 1 or 2 Children | 0 (0.0%) | 0 (0.0%) |
| 3 or 4 Children | 0 (0.0%) | 82 (100.0%) |
| 5 or more Children | 0 (0.0%) | 0 (0.0%) |
| Total | 0 (0.0%) | 82 (100.0%) |
Race in South Mills
The most populous races in South Mills are White / Caucasian (614 | 97.9%), and Black / African American (13 | 2.1%).
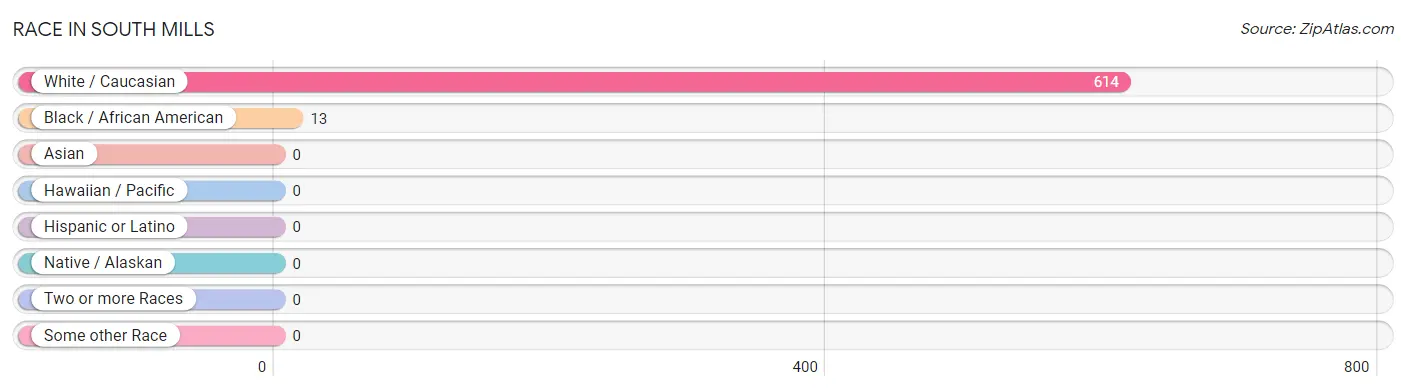
| Race | # Population | % Population |
| Asian | 0 | 0.0% |
| Black / African American | 13 | 2.1% |
| Hawaiian / Pacific | 0 | 0.0% |
| Hispanic or Latino | 0 | 0.0% |
| Native / Alaskan | 0 | 0.0% |
| White / Caucasian | 614 | 97.9% |
| Two or more Races | 0 | 0.0% |
| Some other Race | 0 | 0.0% |
| Total | 627 | 100.0% |
Ancestry in South Mills
The most populous ancestries reported in South Mills are Italian (255 | 40.7%), Irish (206 | 32.9%), American (65 | 10.4%), German (26 | 4.2%), and English (14 | 2.2%), together accounting for 90.3% of all South Mills residents.
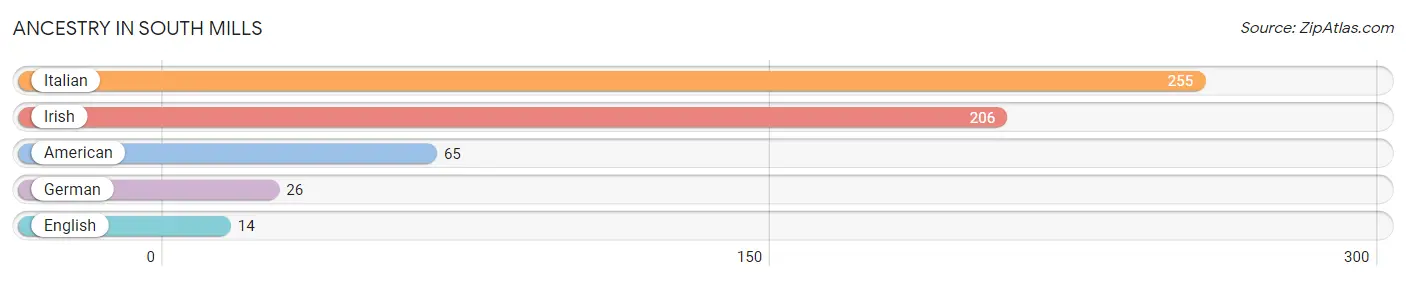
| Ancestry | # Population | % Population |
| American | 65 | 10.4% |
| English | 14 | 2.2% |
| German | 26 | 4.2% |
| Irish | 206 | 32.9% |
| Italian | 255 | 40.7% | View All 5 Rows |
Immigrants in South Mills

| Immigration Origin | # Population | % Population | View All 0 Rows |
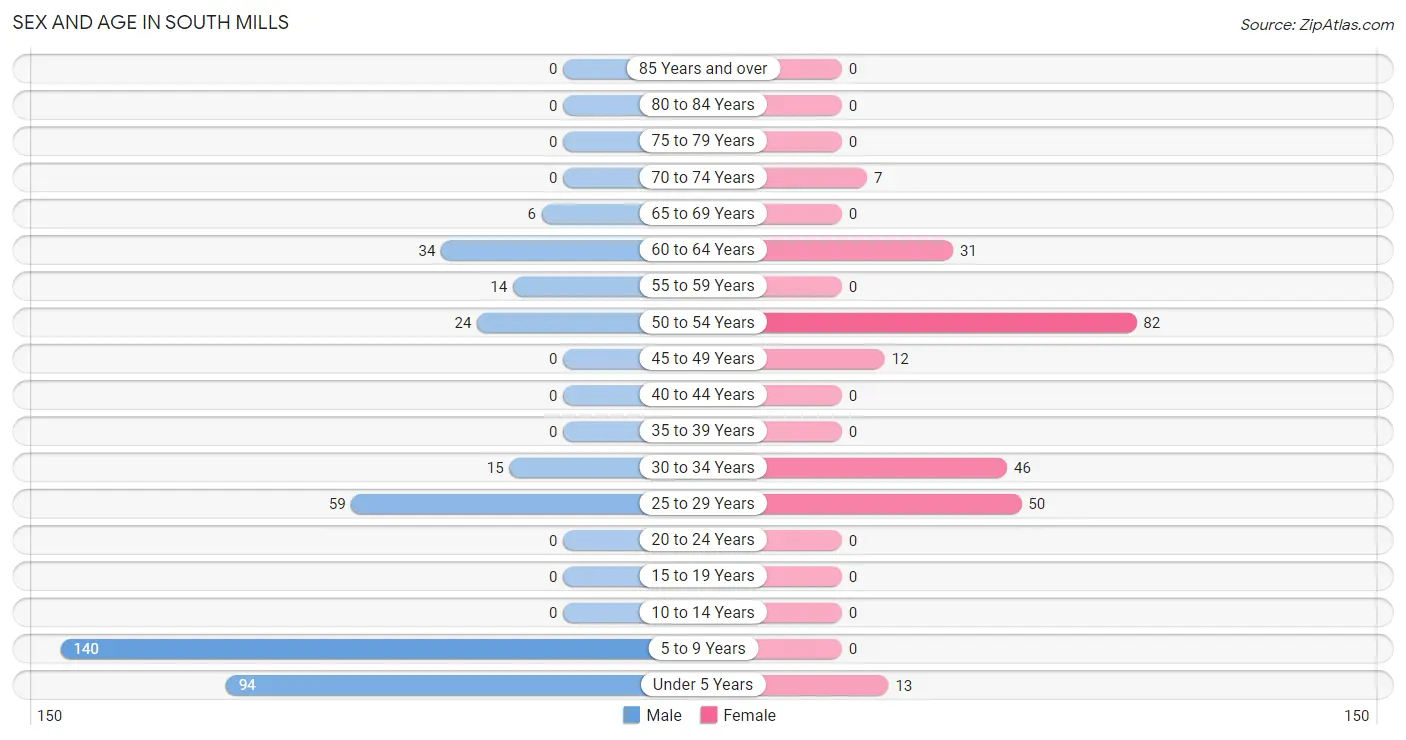
Sex and Age in South Mills
Sex and Age in South Mills
The most populous age groups in South Mills are 5 to 9 Years (140 | 36.3%) for men and 50 to 54 Years (82 | 34.0%) for women.
| Age Bracket | Male | Female |
| Under 5 Years | 94 (24.3%) | 13 (5.4%) |
| 5 to 9 Years | 140 (36.3%) | 0 (0.0%) |
| 10 to 14 Years | 0 (0.0%) | 0 (0.0%) |
| 15 to 19 Years | 0 (0.0%) | 0 (0.0%) |
| 20 to 24 Years | 0 (0.0%) | 0 (0.0%) |
| 25 to 29 Years | 59 (15.3%) | 50 (20.7%) |
| 30 to 34 Years | 15 (3.9%) | 46 (19.1%) |
| 35 to 39 Years | 0 (0.0%) | 0 (0.0%) |
| 40 to 44 Years | 0 (0.0%) | 0 (0.0%) |
| 45 to 49 Years | 0 (0.0%) | 12 (5.0%) |
| 50 to 54 Years | 24 (6.2%) | 82 (34.0%) |
| 55 to 59 Years | 14 (3.6%) | 0 (0.0%) |
| 60 to 64 Years | 34 (8.8%) | 31 (12.9%) |
| 65 to 69 Years | 6 (1.5%) | 0 (0.0%) |
| 70 to 74 Years | 0 (0.0%) | 7 (2.9%) |
| 75 to 79 Years | 0 (0.0%) | 0 (0.0%) |
| 80 to 84 Years | 0 (0.0%) | 0 (0.0%) |
| 85 Years and over | 0 (0.0%) | 0 (0.0%) |
| Total | 386 (100.0%) | 241 (100.0%) |
Families and Households in South Mills
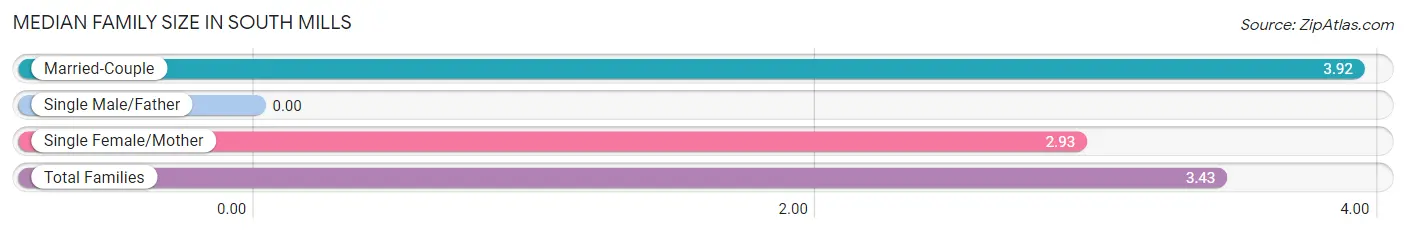
Median Family Size in South Mills
| Family Type | # Families | Family Size |
| Married-Couple | 86 (51.2%) | 3.92 |
| Single Male/Father | 0 (0.0%) | - |
| Single Female/Mother | 82 (48.8%) | 2.93 |
| Total Families | 168 (100.0%) | 3.43 |
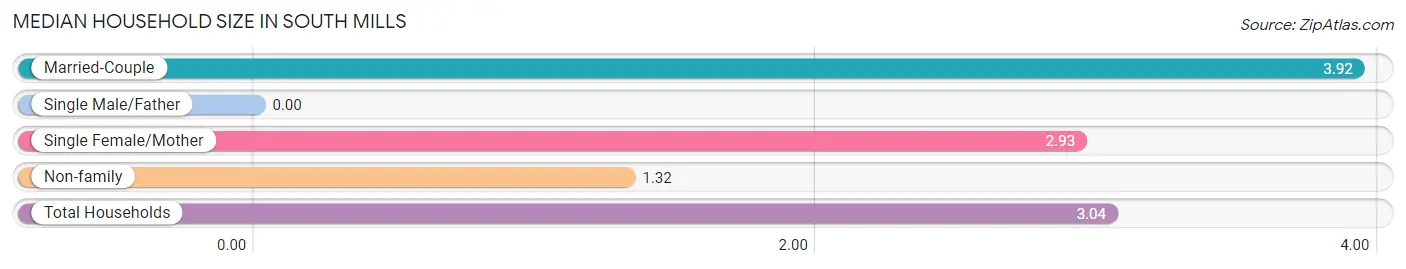
Median Household Size in South Mills
| Household Type | # Households | Household Size |
| Married-Couple | 86 (41.7%) | 3.92 |
| Single Male/Father | 0 (0.0%) | - |
| Single Female/Mother | 82 (39.8%) | 2.93 |
| Non-family | 38 (18.4%) | 1.32 |
| Total Households | 206 (100.0%) | 3.04 |
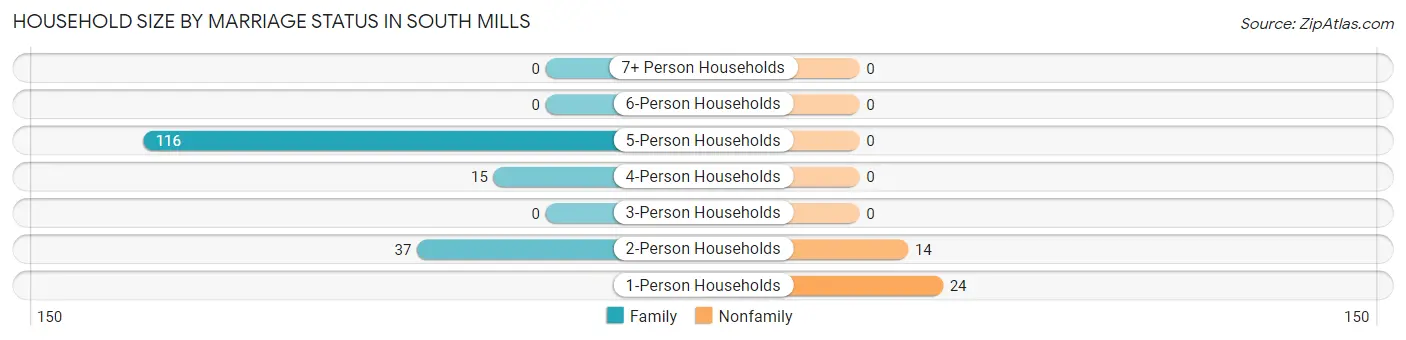
Household Size by Marriage Status in South Mills
Out of a total of 206 households in South Mills, 168 (81.6%) are family households, while 38 (18.4%) are nonfamily households. The most numerous type of family households are 5-person households, comprising 116, and the most common type of nonfamily households are 1-person households, comprising 24.
| Household Size | Family Households | Nonfamily Households |
| 1-Person Households | - | 24 (11.7%) |
| 2-Person Households | 37 (18.0%) | 14 (6.8%) |
| 3-Person Households | 0 (0.0%) | 0 (0.0%) |
| 4-Person Households | 15 (7.3%) | 0 (0.0%) |
| 5-Person Households | 116 (56.3%) | 0 (0.0%) |
| 6-Person Households | 0 (0.0%) | 0 (0.0%) |
| 7+ Person Households | 0 (0.0%) | 0 (0.0%) |
| Total | 168 (81.6%) | 38 (18.4%) |
Female Fertility in South Mills
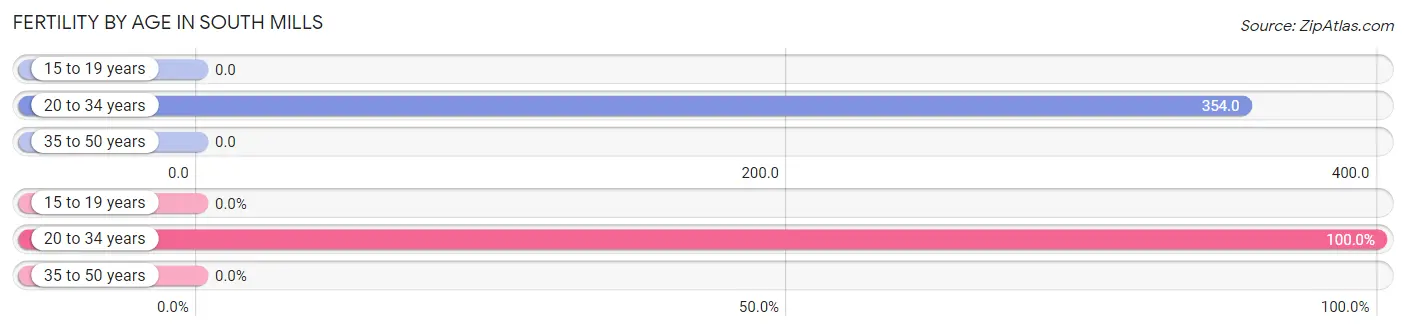
Fertility by Age in South Mills
Average fertility rate in South Mills is 315.0 births per 1,000 women. Women in the age bracket of 20 to 34 years have the highest fertility rate with 354.0 births per 1,000 women. Women in the age bracket of 20 to 34 years acount for 100.0% of all women with births.
| Age Bracket | Women with Births | Births / 1,000 Women |
| 15 to 19 years | 0 (0.0%) | 0.0 |
| 20 to 34 years | 34 (100.0%) | 354.0 |
| 35 to 50 years | 0 (0.0%) | 0.0 |
| Total | 34 (100.0%) | 315.0 |
Fertility by Age by Marriage Status in South Mills
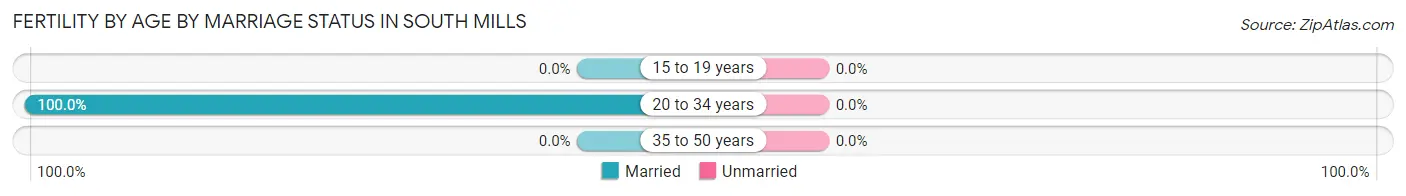
| Age Bracket | Married | Unmarried |
| 15 to 19 years | 0 (0.0%) | 0 (0.0%) |
| 20 to 34 years | 34 (100.0%) | 0 (0.0%) |
| 35 to 50 years | 0 (0.0%) | 0 (0.0%) |
| Total | 34 (100.0%) | 0 (0.0%) |
Fertility by Education in South Mills
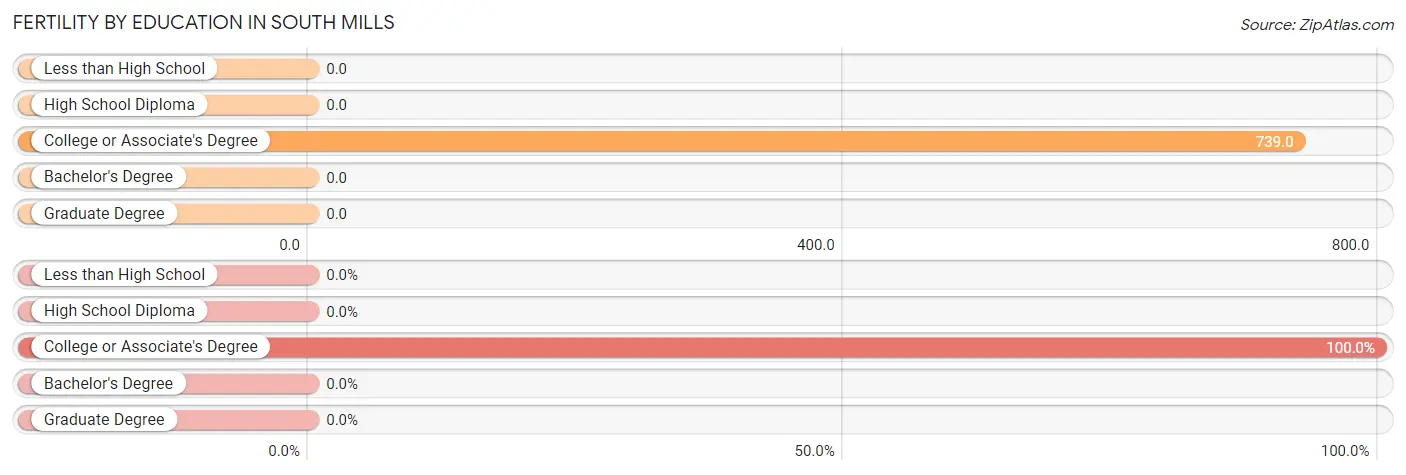
| Educational Attainment | Women with Births | Births / 1,000 Women |
| Less than High School | 0 (0.0%) | 0.0 |
| High School Diploma | 0 (0.0%) | 0.0 |
| College or Associate's Degree | 34 (100.0%) | 739.0 |
| Bachelor's Degree | 0 (0.0%) | 0.0 |
| Graduate Degree | 0 (0.0%) | 0.0 |
| Total | 34 (100.0%) | 315.0 |
Fertility by Education by Marriage Status in South Mills
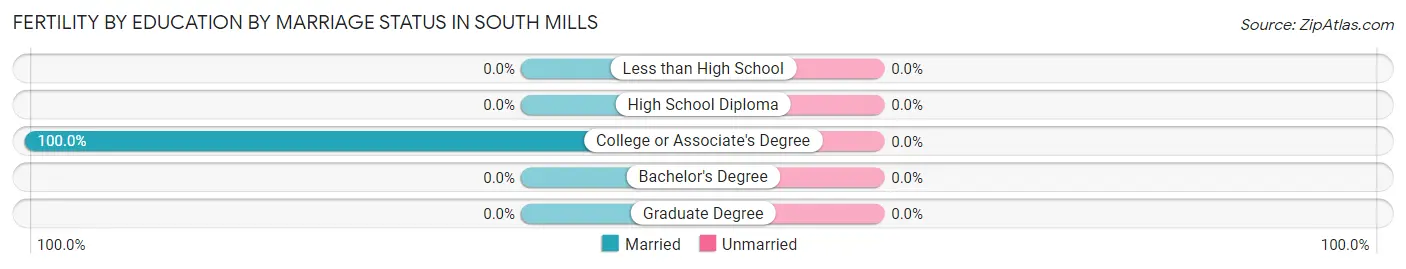
| Educational Attainment | Married | Unmarried |
| Less than High School | 0 (0.0%) | 0 (0.0%) |
| High School Diploma | 0 (0.0%) | 0 (0.0%) |
| College or Associate's Degree | 34 (100.0%) | 0 (0.0%) |
| Bachelor's Degree | 0 (0.0%) | 0 (0.0%) |
| Graduate Degree | 0 (0.0%) | 0 (0.0%) |
| Total | 34 (100.0%) | 0 (0.0%) |
Employment Characteristics in South Mills
Employment by Class of Employer in South Mills
Among the 333 employed individuals in South Mills, private company employees (205 | 61.6%), self-employed (not incorporated) (82 | 24.6%), and local government employees (34 | 10.2%) make up the most common classes of employment.
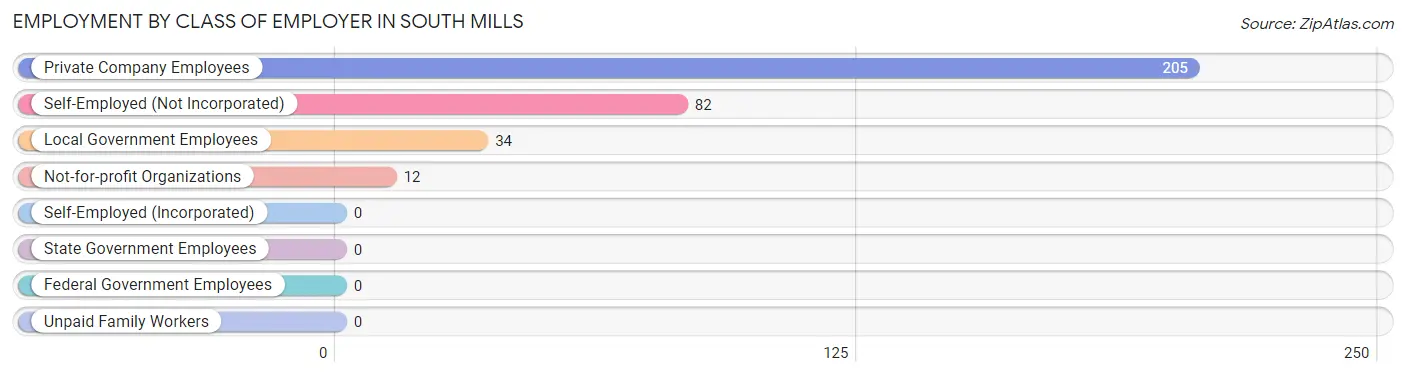
| Employer Class | # Employees | % Employees |
| Private Company Employees | 205 | 61.6% |
| Self-Employed (Incorporated) | 0 | 0.0% |
| Self-Employed (Not Incorporated) | 82 | 24.6% |
| Not-for-profit Organizations | 12 | 3.6% |
| Local Government Employees | 34 | 10.2% |
| State Government Employees | 0 | 0.0% |
| Federal Government Employees | 0 | 0.0% |
| Unpaid Family Workers | 0 | 0.0% |
| Total | 333 | 100.0% |
Employment Status by Age in South Mills
According to the labor force statistics for South Mills, out of the total population over 16 years of age (380), 96.6% or 367 individuals are in the labor force, with 9.3% or 34 of them unemployed. The age group with the highest labor force participation rate is 25 to 29 years, with 100.0% or 109 individuals in the labor force. Within the labor force, the 30 to 34 years age range has the highest percentage of unemployed individuals, with 55.7% or 34 of them being unemployed.
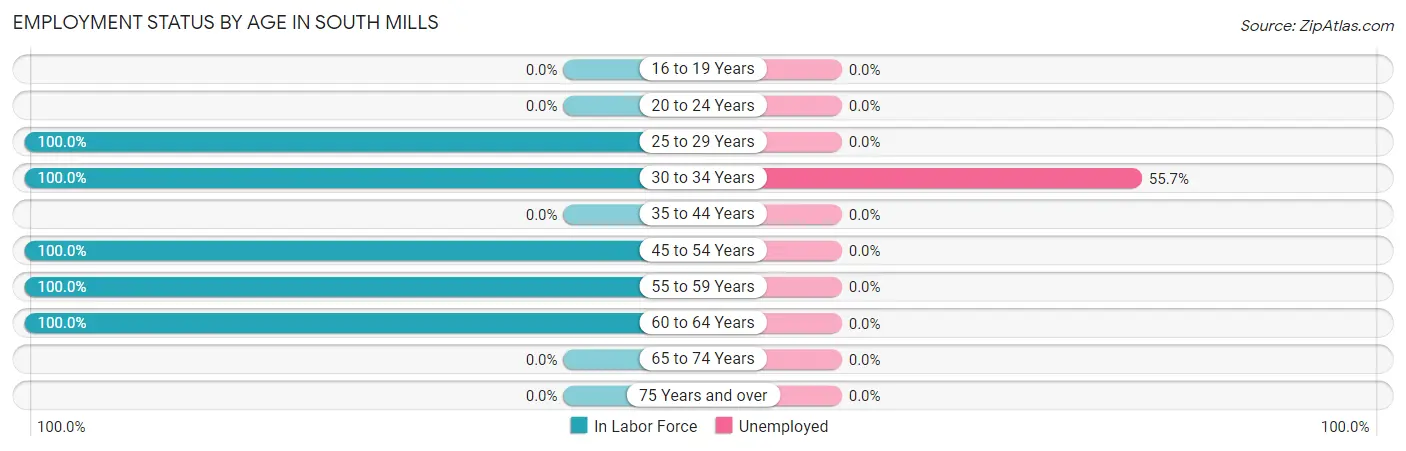
| Age Bracket | In Labor Force | Unemployed |
| 16 to 19 Years | 0 (0.0%) | 0 (0.0%) |
| 20 to 24 Years | 0 (0.0%) | 0 (0.0%) |
| 25 to 29 Years | 109 (100.0%) | 0 (0.0%) |
| 30 to 34 Years | 61 (100.0%) | 34 (55.7%) |
| 35 to 44 Years | 0 (0.0%) | 0 (0.0%) |
| 45 to 54 Years | 118 (100.0%) | 0 (0.0%) |
| 55 to 59 Years | 14 (100.0%) | 0 (0.0%) |
| 60 to 64 Years | 65 (100.0%) | 0 (0.0%) |
| 65 to 74 Years | 0 (0.0%) | 0 (0.0%) |
| 75 Years and over | 0 (0.0%) | 0 (0.0%) |
| Total | 367 (96.6%) | 34 (9.3%) |
Employment Status by Educational Attainment in South Mills
According to labor force statistics for South Mills, 100.0% of individuals (367) out of the total population between 25 and 64 years of age (367) are in the labor force, with 9.3% or 34 of them being unemployed. The group with the highest labor force participation rate are those with the educational attainment of less than high school, with 100.0% or 24 individuals in the labor force. Within the labor force, individuals with college / associate degree education have the highest percentage of unemployment, with 17.1% or 34 of them being unemployed.
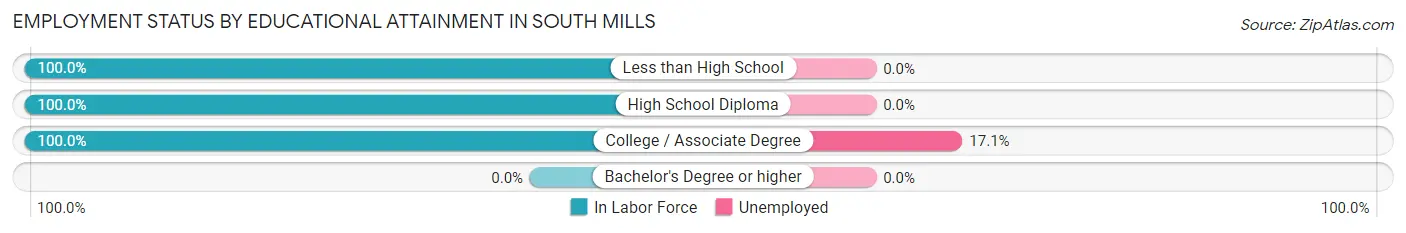
| Educational Attainment | In Labor Force | Unemployed |
| Less than High School | 24 (100.0%) | 0 (0.0%) |
| High School Diploma | 144 (100.0%) | 0 (0.0%) |
| College / Associate Degree | 199 (100.0%) | 34 (17.1%) |
| Bachelor's Degree or higher | 0 (0.0%) | 0 (0.0%) |
| Total | 367 (100.0%) | 34 (9.3%) |
Employment Occupations by Sex in South Mills
Management, Business, Science and Arts Occupations
The most common Management, Business, Science and Arts occupations in South Mills are , and Management (109 | 32.7%).
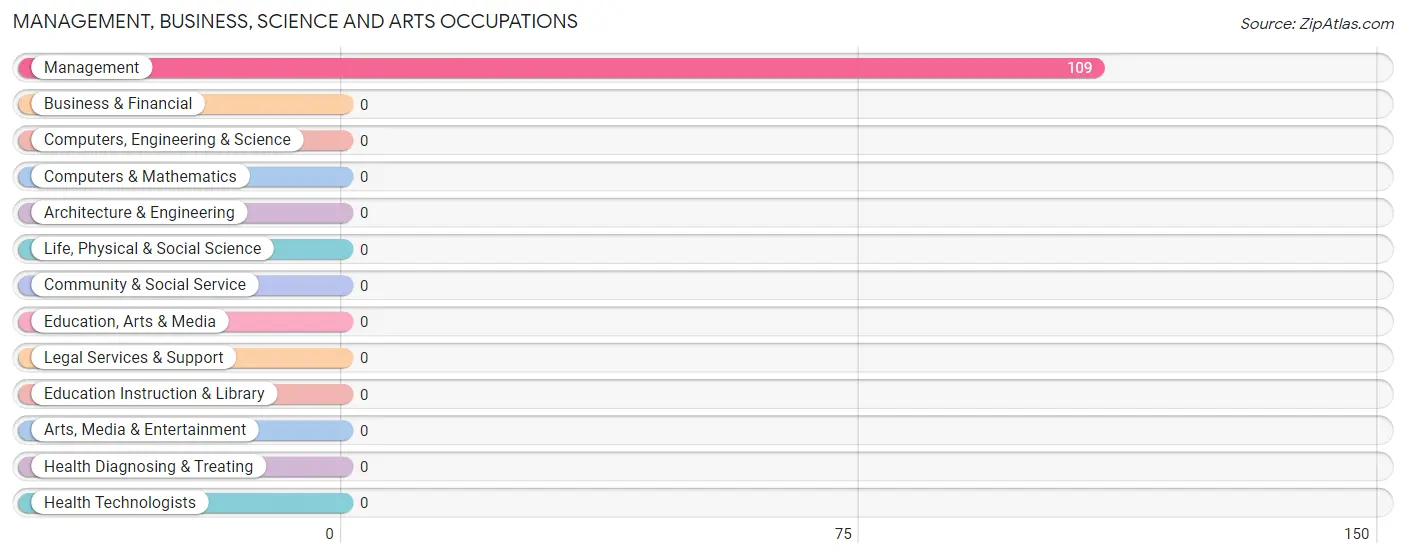
Management, Business, Science and Arts Occupations by Sex
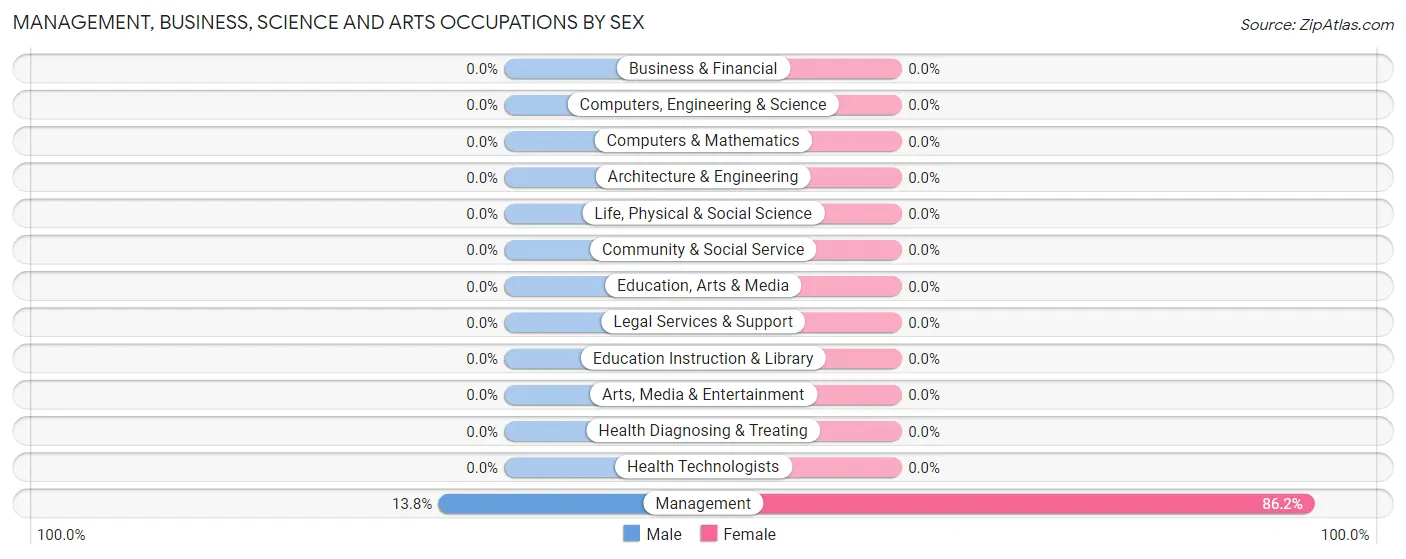
| Occupation | Male | Female |
| Management | 15 (13.8%) | 94 (86.2%) |
| Business & Financial | 0 (0.0%) | 0 (0.0%) |
| Computers, Engineering & Science | 0 (0.0%) | 0 (0.0%) |
| Computers & Mathematics | 0 (0.0%) | 0 (0.0%) |
| Architecture & Engineering | 0 (0.0%) | 0 (0.0%) |
| Life, Physical & Social Science | 0 (0.0%) | 0 (0.0%) |
| Community & Social Service | 0 (0.0%) | 0 (0.0%) |
| Education, Arts & Media | 0 (0.0%) | 0 (0.0%) |
| Legal Services & Support | 0 (0.0%) | 0 (0.0%) |
| Education Instruction & Library | 0 (0.0%) | 0 (0.0%) |
| Arts, Media & Entertainment | 0 (0.0%) | 0 (0.0%) |
| Health Diagnosing & Treating | 0 (0.0%) | 0 (0.0%) |
| Health Technologists | 0 (0.0%) | 0 (0.0%) |
| Total (Category) | 15 (13.8%) | 94 (86.2%) |
| Total (Overall) | 146 (43.8%) | 187 (56.2%) |
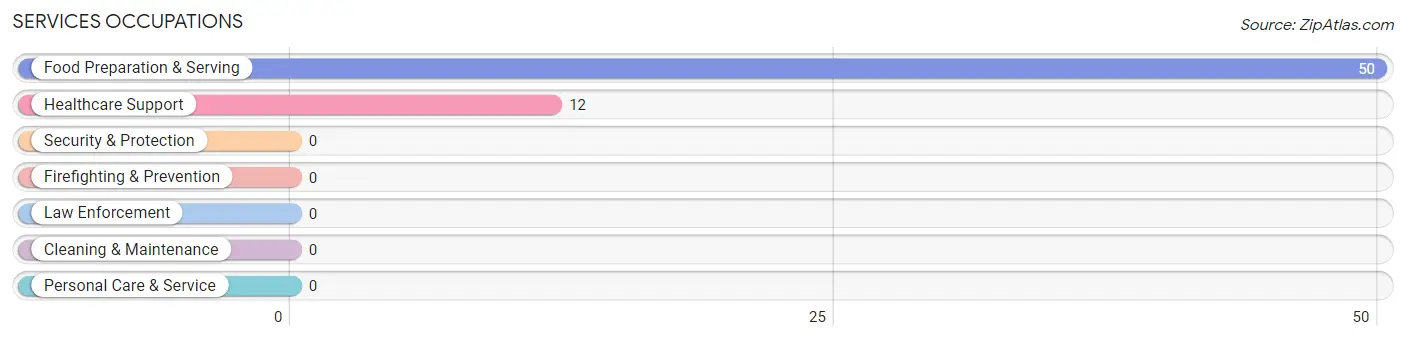
Services Occupations
The most common Services occupations in South Mills are Food Preparation & Serving (50 | 15.0%), and Healthcare Support (12 | 3.6%).
Services Occupations by Sex
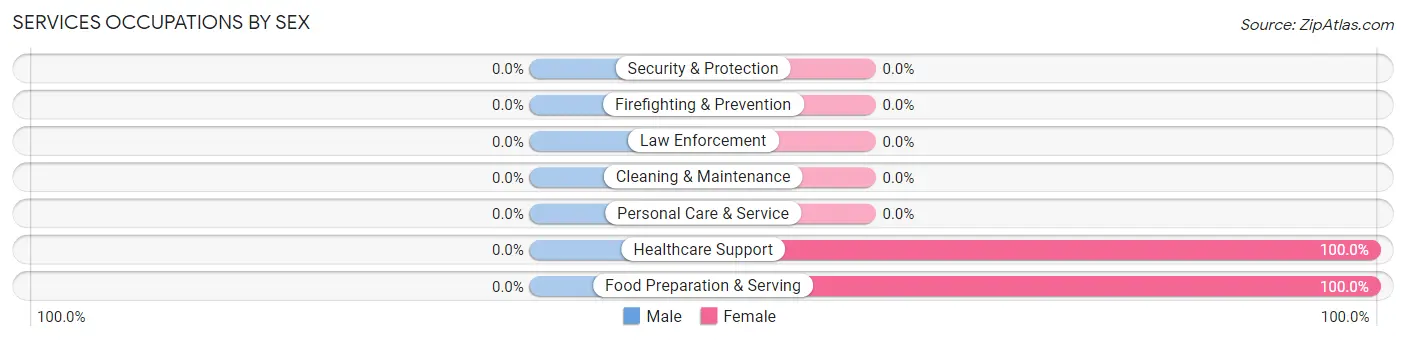
| Occupation | Male | Female |
| Healthcare Support | 0 (0.0%) | 12 (100.0%) |
| Security & Protection | 0 (0.0%) | 0 (0.0%) |
| Firefighting & Prevention | 0 (0.0%) | 0 (0.0%) |
| Law Enforcement | 0 (0.0%) | 0 (0.0%) |
| Food Preparation & Serving | 0 (0.0%) | 50 (100.0%) |
| Cleaning & Maintenance | 0 (0.0%) | 0 (0.0%) |
| Personal Care & Service | 0 (0.0%) | 0 (0.0%) |
| Total (Category) | 0 (0.0%) | 62 (100.0%) |
| Total (Overall) | 146 (43.8%) | 187 (56.2%) |
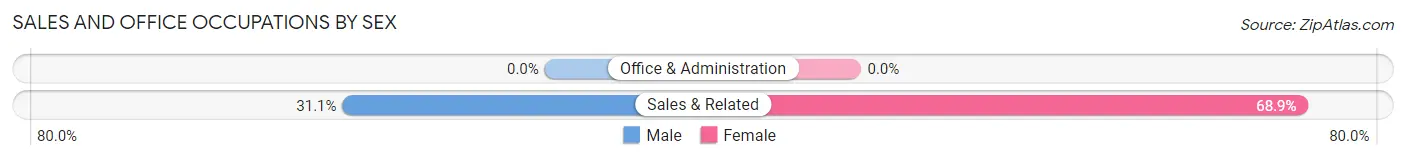
Sales and Office Occupations
The most common Sales and Office occupations in South Mills are , and Sales & Related (45 | 13.5%).
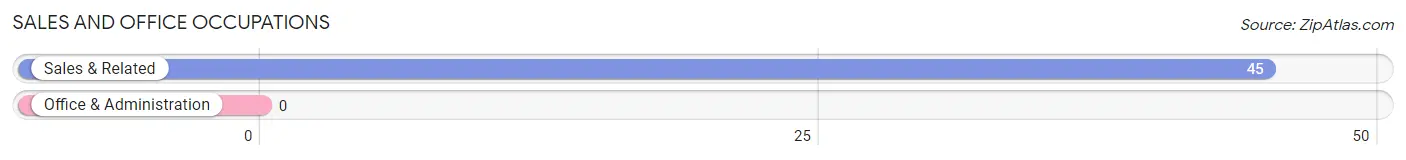
Sales and Office Occupations by Sex
| Occupation | Male | Female |
| Sales & Related | 14 (31.1%) | 31 (68.9%) |
| Office & Administration | 0 (0.0%) | 0 (0.0%) |
| Total (Category) | 14 (31.1%) | 31 (68.9%) |
| Total (Overall) | 146 (43.8%) | 187 (56.2%) |
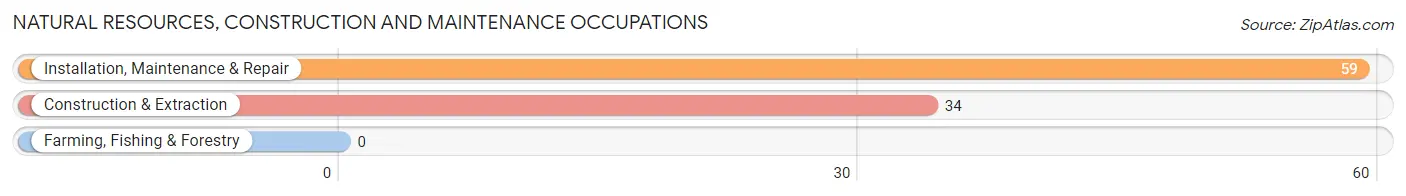
Natural Resources, Construction and Maintenance Occupations
The most common Natural Resources, Construction and Maintenance occupations in South Mills are Installation, Maintenance & Repair (59 | 17.7%), and Construction & Extraction (34 | 10.2%).
Natural Resources, Construction and Maintenance Occupations by Sex
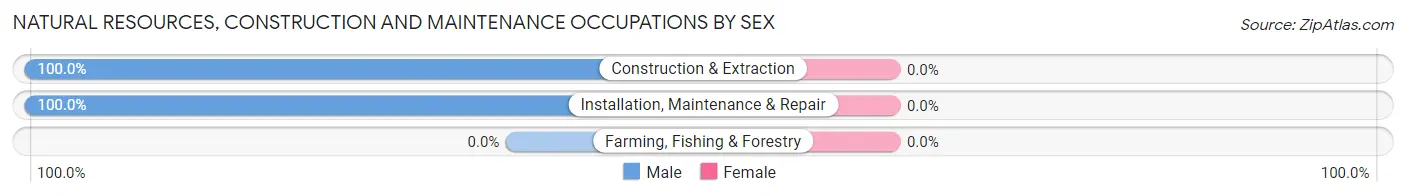
| Occupation | Male | Female |
| Farming, Fishing & Forestry | 0 (0.0%) | 0 (0.0%) |
| Construction & Extraction | 34 (100.0%) | 0 (0.0%) |
| Installation, Maintenance & Repair | 59 (100.0%) | 0 (0.0%) |
| Total (Category) | 93 (100.0%) | 0 (0.0%) |
| Total (Overall) | 146 (43.8%) | 187 (56.2%) |
Production, Transportation and Moving Occupations
The most common Production, Transportation and Moving occupations in South Mills are , and Production (24 | 7.2%).
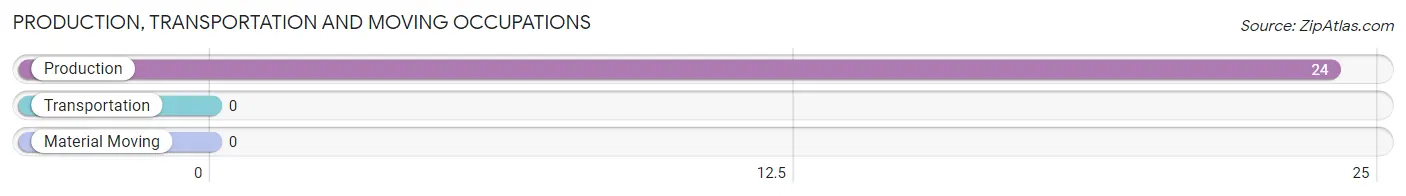
Production, Transportation and Moving Occupations by Sex
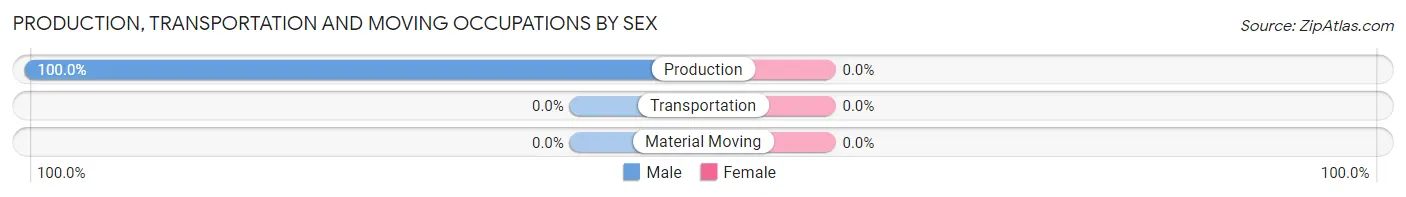
| Occupation | Male | Female |
| Production | 24 (100.0%) | 0 (0.0%) |
| Transportation | 0 (0.0%) | 0 (0.0%) |
| Material Moving | 0 (0.0%) | 0 (0.0%) |
| Total (Category) | 24 (100.0%) | 0 (0.0%) |
| Total (Overall) | 146 (43.8%) | 187 (56.2%) |
Employment Industries by Sex in South Mills
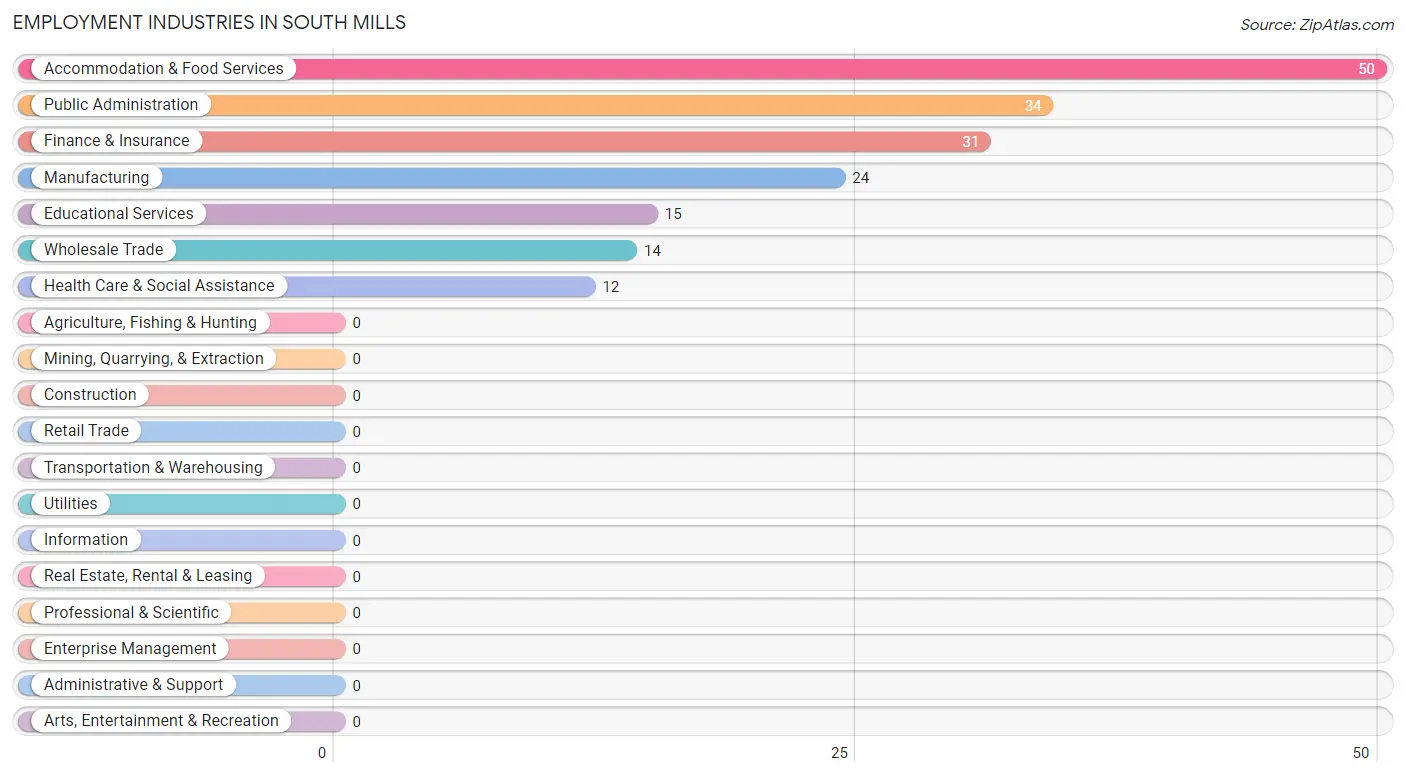
Employment Industries in South Mills
The major employment industries in South Mills include Accommodation & Food Services (50 | 15.0%), Public Administration (34 | 10.2%), Finance & Insurance (31 | 9.3%), Manufacturing (24 | 7.2%), and Educational Services (15 | 4.5%).
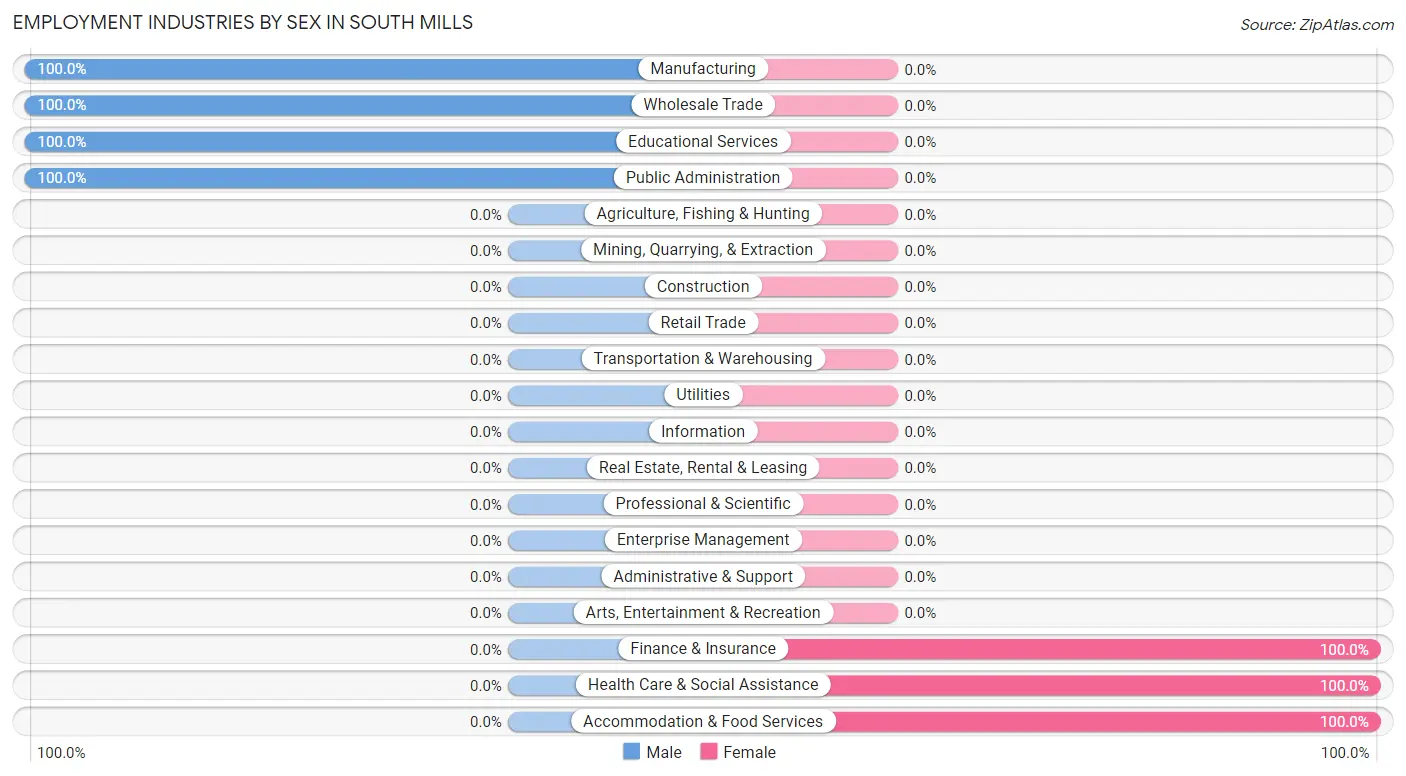
Employment Industries by Sex in South Mills
The South Mills industries that see more men than women are Manufacturing (100.0%), Wholesale Trade (100.0%), and Educational Services (100.0%), whereas the industries that tend to have a higher number of women are Finance & Insurance (100.0%), Health Care & Social Assistance (100.0%), and Accommodation & Food Services (100.0%).
| Industry | Male | Female |
| Agriculture, Fishing & Hunting | 0 (0.0%) | 0 (0.0%) |
| Mining, Quarrying, & Extraction | 0 (0.0%) | 0 (0.0%) |
| Construction | 0 (0.0%) | 0 (0.0%) |
| Manufacturing | 24 (100.0%) | 0 (0.0%) |
| Wholesale Trade | 14 (100.0%) | 0 (0.0%) |
| Retail Trade | 0 (0.0%) | 0 (0.0%) |
| Transportation & Warehousing | 0 (0.0%) | 0 (0.0%) |
| Utilities | 0 (0.0%) | 0 (0.0%) |
| Information | 0 (0.0%) | 0 (0.0%) |
| Finance & Insurance | 0 (0.0%) | 31 (100.0%) |
| Real Estate, Rental & Leasing | 0 (0.0%) | 0 (0.0%) |
| Professional & Scientific | 0 (0.0%) | 0 (0.0%) |
| Enterprise Management | 0 (0.0%) | 0 (0.0%) |
| Administrative & Support | 0 (0.0%) | 0 (0.0%) |
| Educational Services | 15 (100.0%) | 0 (0.0%) |
| Health Care & Social Assistance | 0 (0.0%) | 12 (100.0%) |
| Arts, Entertainment & Recreation | 0 (0.0%) | 0 (0.0%) |
| Accommodation & Food Services | 0 (0.0%) | 50 (100.0%) |
| Public Administration | 34 (100.0%) | 0 (0.0%) |
| Total | 146 (43.8%) | 187 (56.2%) |
Education in South Mills
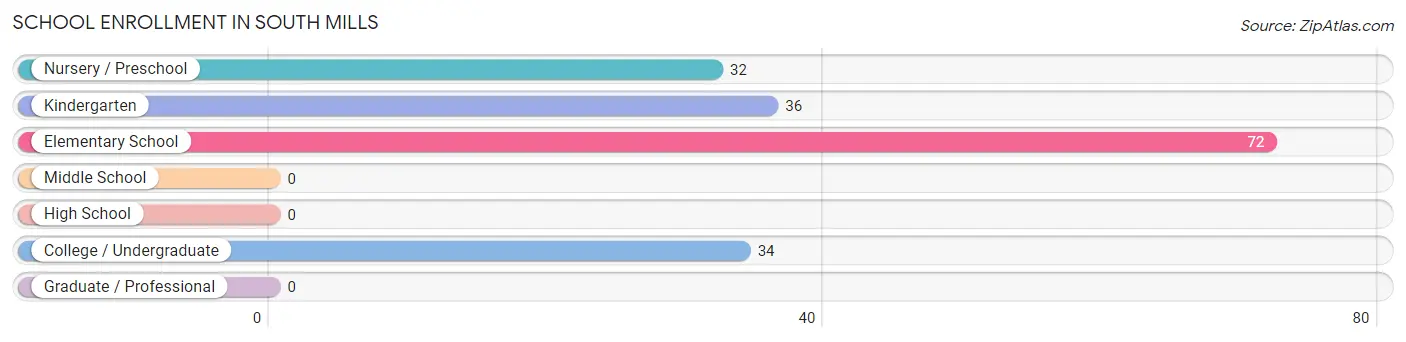
School Enrollment in South Mills
The most common levels of schooling among the 174 students in South Mills are elementary school (72 | 41.4%), kindergarten (36 | 20.7%), and college / undergraduate (34 | 19.5%).
| School Level | # Students | % Students |
| Nursery / Preschool | 32 | 18.4% |
| Kindergarten | 36 | 20.7% |
| Elementary School | 72 | 41.4% |
| Middle School | 0 | 0.0% |
| High School | 0 | 0.0% |
| College / Undergraduate | 34 | 19.5% |
| Graduate / Professional | 0 | 0.0% |
| Total | 174 | 100.0% |
School Enrollment by Age by Funding Source in South Mills
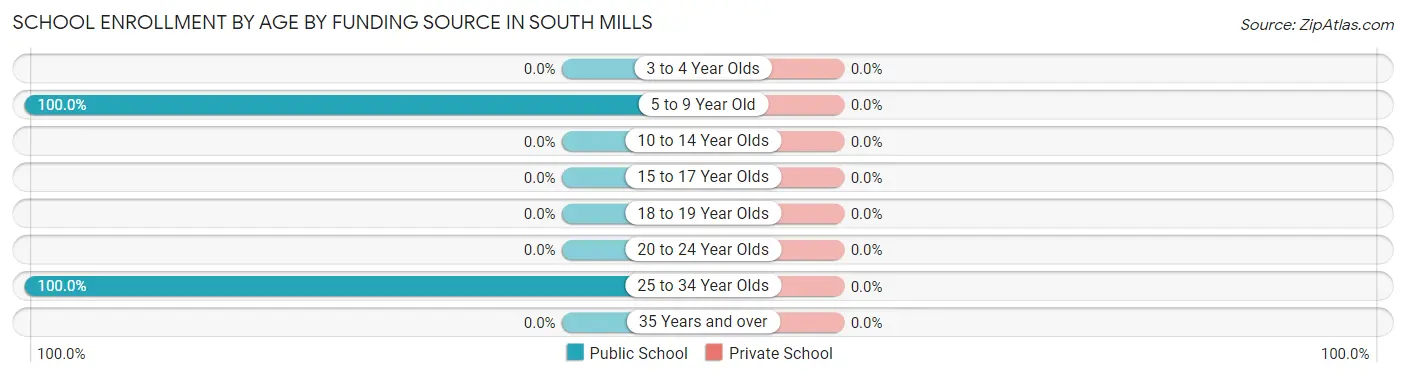
| Age Bracket | Public School | Private School |
| 3 to 4 Year Olds | 0 (0.0%) | 0 (0.0%) |
| 5 to 9 Year Old | 140 (100.0%) | 0 (0.0%) |
| 10 to 14 Year Olds | 0 (0.0%) | 0 (0.0%) |
| 15 to 17 Year Olds | 0 (0.0%) | 0 (0.0%) |
| 18 to 19 Year Olds | 0 (0.0%) | 0 (0.0%) |
| 20 to 24 Year Olds | 0 (0.0%) | 0 (0.0%) |
| 25 to 34 Year Olds | 34 (100.0%) | 0 (0.0%) |
| 35 Years and over | 0 (0.0%) | 0 (0.0%) |
| Total | 174 (100.0%) | 0 (0.0%) |
Educational Attainment by Field of Study in South Mills
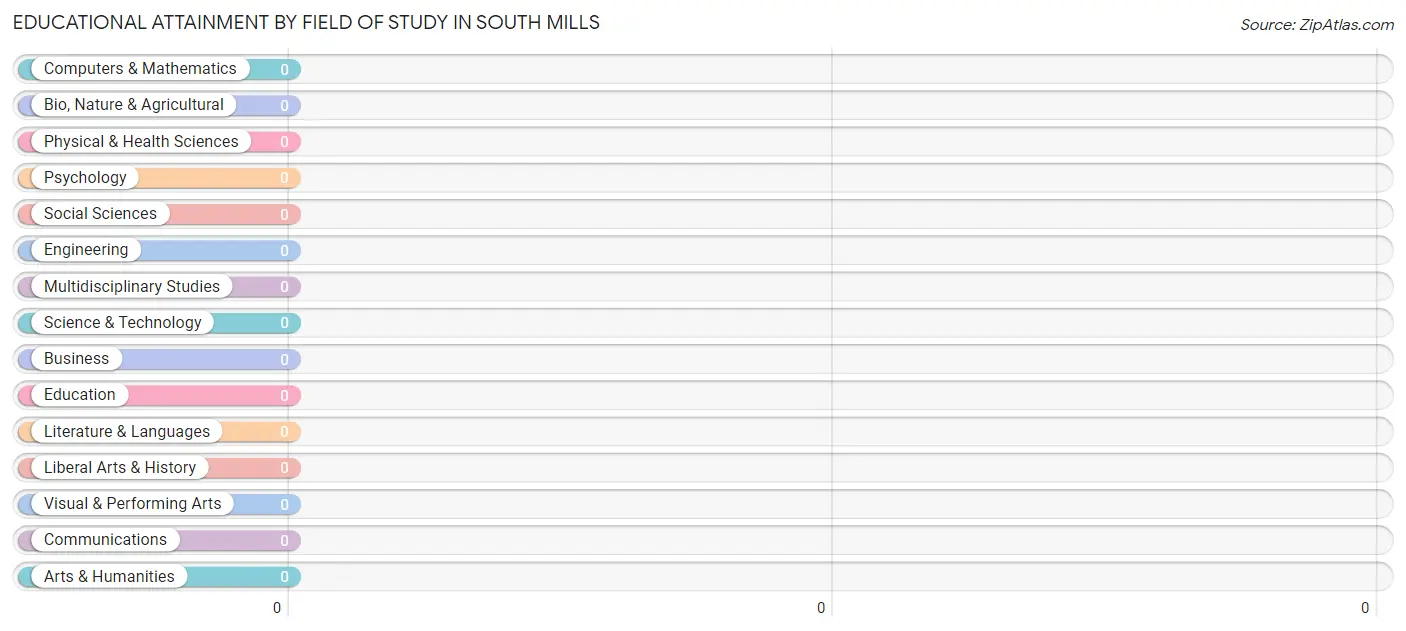
| Field of Study | # Graduates | % Graduates |
| Computers & Mathematics | 0 | 0.0% |
| Bio, Nature & Agricultural | 0 | 0.0% |
| Physical & Health Sciences | 0 | 0.0% |
| Psychology | 0 | 0.0% |
| Social Sciences | 0 | 0.0% |
| Engineering | 0 | 0.0% |
| Multidisciplinary Studies | 0 | 0.0% |
| Science & Technology | 0 | 0.0% |
| Business | 0 | 0.0% |
| Education | 0 | 0.0% |
| Literature & Languages | 0 | 0.0% |
| Liberal Arts & History | 0 | 0.0% |
| Visual & Performing Arts | 0 | 0.0% |
| Communications | 0 | 0.0% |
| Arts & Humanities | 0 | 0.0% |
| Total | 0 | 0.0% |
Transportation & Commute in South Mills
Vehicle Availability by Sex in South Mills
The most prevalent vehicle ownership categories in South Mills are males with 2 vehicles (93, accounting for 63.7%) and females with 2 vehicles (163, making up 49.7%).
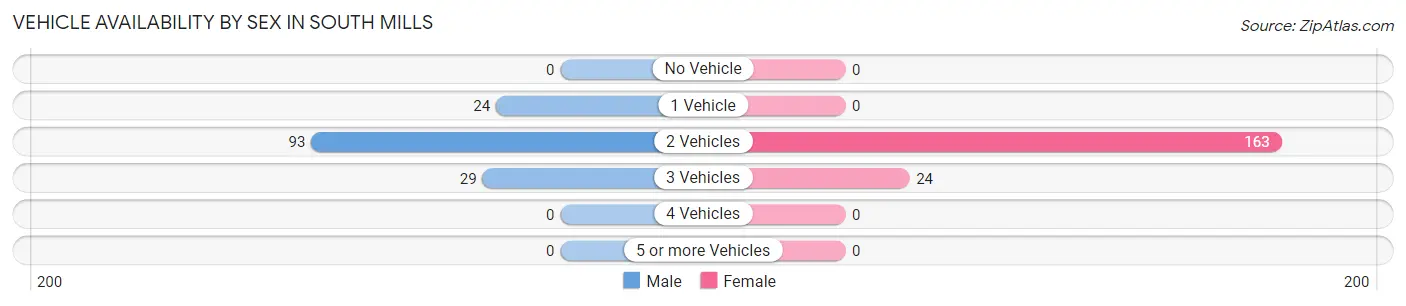
| Vehicles Available | Male | Female |
| No Vehicle | 0 (0.0%) | 0 (0.0%) |
| 1 Vehicle | 24 (16.4%) | 0 (0.0%) |
| 2 Vehicles | 93 (63.7%) | 163 (87.2%) |
| 3 Vehicles | 29 (19.9%) | 24 (12.8%) |
| 4 Vehicles | 0 (0.0%) | 0 (0.0%) |
| 5 or more Vehicles | 0 (0.0%) | 0 (0.0%) |
| Total | 146 (100.0%) | 187 (100.0%) |
Commute Time in South Mills
The most frequently occuring commute durations in South Mills are 15 to 19 minutes (82 commuters, 24.6%), 20 to 24 minutes (65 commuters, 19.5%), and 30 to 34 minutes (62 commuters, 18.6%).
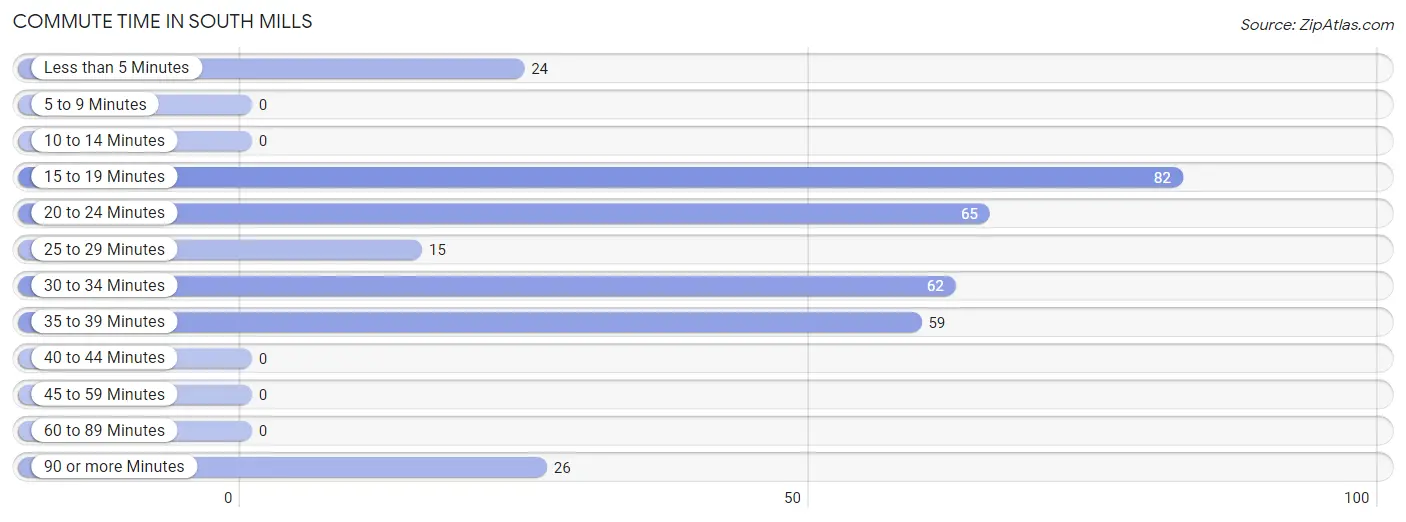
| Commute Time | # Commuters | % Commuters |
| Less than 5 Minutes | 24 | 7.2% |
| 5 to 9 Minutes | 0 | 0.0% |
| 10 to 14 Minutes | 0 | 0.0% |
| 15 to 19 Minutes | 82 | 24.6% |
| 20 to 24 Minutes | 65 | 19.5% |
| 25 to 29 Minutes | 15 | 4.5% |
| 30 to 34 Minutes | 62 | 18.6% |
| 35 to 39 Minutes | 59 | 17.7% |
| 40 to 44 Minutes | 0 | 0.0% |
| 45 to 59 Minutes | 0 | 0.0% |
| 60 to 89 Minutes | 0 | 0.0% |
| 90 or more Minutes | 26 | 7.8% |
Commute Time by Sex in South Mills
The most common commute times in South Mills are 35 to 39 minutes (59 commuters, 40.4%) for males and 15 to 19 minutes (82 commuters, 43.9%) for females.
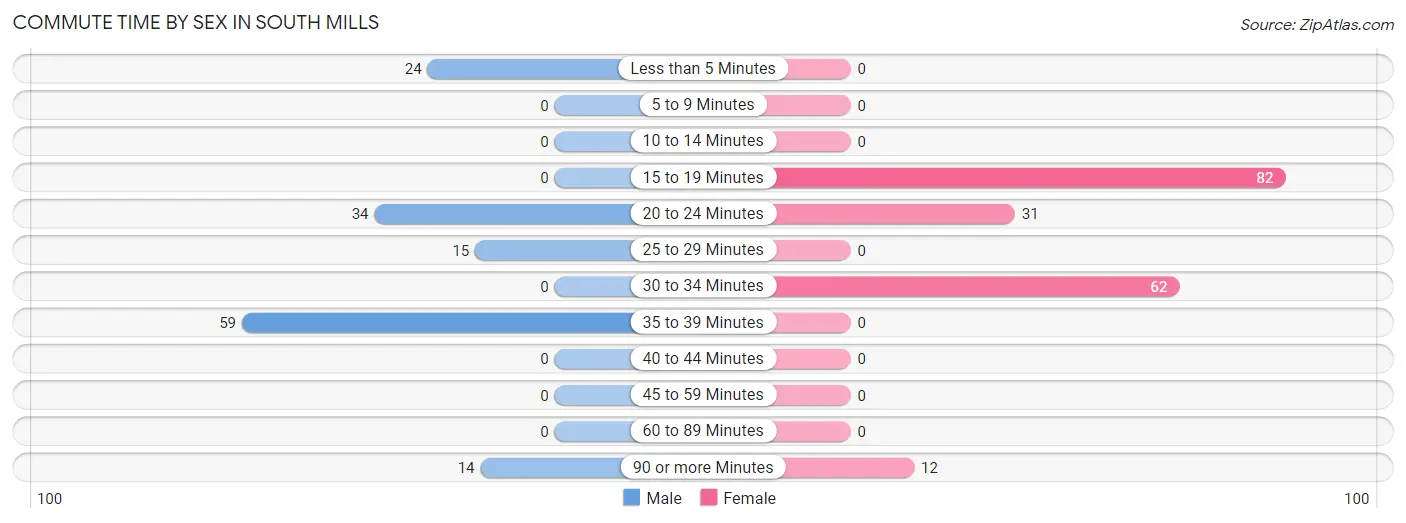
| Commute Time | Male | Female |
| Less than 5 Minutes | 24 (16.4%) | 0 (0.0%) |
| 5 to 9 Minutes | 0 (0.0%) | 0 (0.0%) |
| 10 to 14 Minutes | 0 (0.0%) | 0 (0.0%) |
| 15 to 19 Minutes | 0 (0.0%) | 82 (43.9%) |
| 20 to 24 Minutes | 34 (23.3%) | 31 (16.6%) |
| 25 to 29 Minutes | 15 (10.3%) | 0 (0.0%) |
| 30 to 34 Minutes | 0 (0.0%) | 62 (33.2%) |
| 35 to 39 Minutes | 59 (40.4%) | 0 (0.0%) |
| 40 to 44 Minutes | 0 (0.0%) | 0 (0.0%) |
| 45 to 59 Minutes | 0 (0.0%) | 0 (0.0%) |
| 60 to 89 Minutes | 0 (0.0%) | 0 (0.0%) |
| 90 or more Minutes | 14 (9.6%) | 12 (6.4%) |
Time of Departure to Work by Sex in South Mills
The most frequent times of departure to work in South Mills are 7:00 AM to 7:29 AM (59, 40.4%) for males and 12:00 AM to 4:59 AM (94, 50.3%) for females.
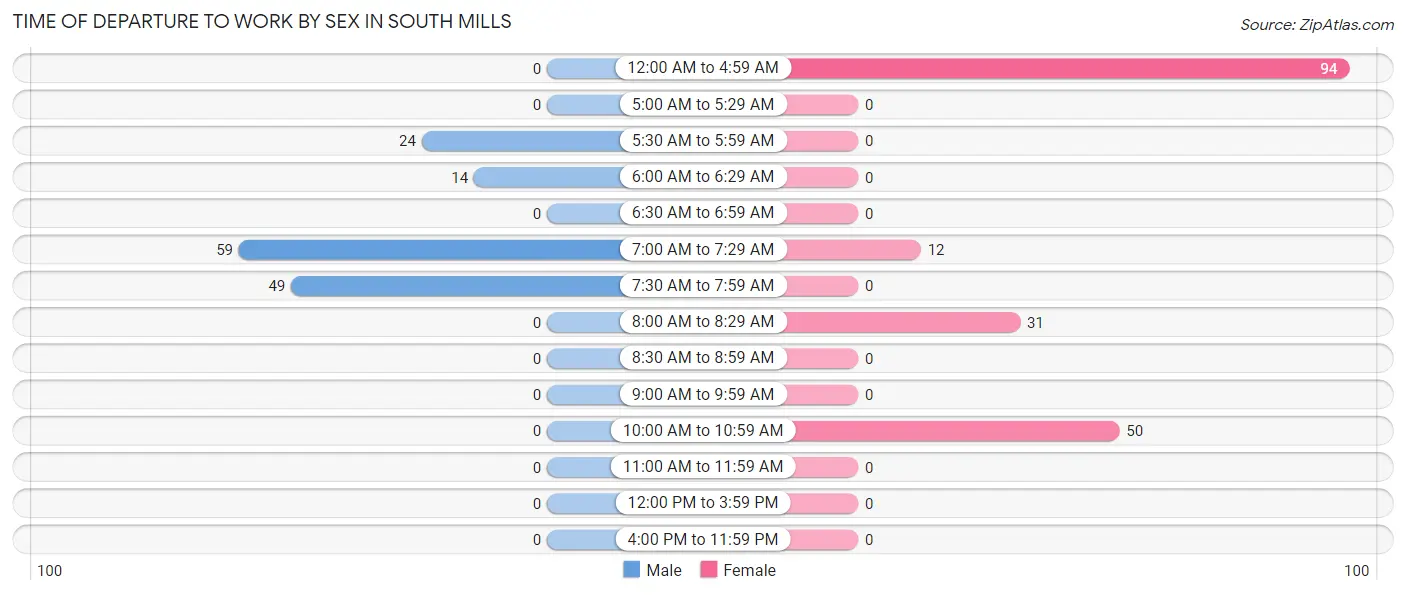
| Time of Departure | Male | Female |
| 12:00 AM to 4:59 AM | 0 (0.0%) | 94 (50.3%) |
| 5:00 AM to 5:29 AM | 0 (0.0%) | 0 (0.0%) |
| 5:30 AM to 5:59 AM | 24 (16.4%) | 0 (0.0%) |
| 6:00 AM to 6:29 AM | 14 (9.6%) | 0 (0.0%) |
| 6:30 AM to 6:59 AM | 0 (0.0%) | 0 (0.0%) |
| 7:00 AM to 7:29 AM | 59 (40.4%) | 12 (6.4%) |
| 7:30 AM to 7:59 AM | 49 (33.6%) | 0 (0.0%) |
| 8:00 AM to 8:29 AM | 0 (0.0%) | 31 (16.6%) |
| 8:30 AM to 8:59 AM | 0 (0.0%) | 0 (0.0%) |
| 9:00 AM to 9:59 AM | 0 (0.0%) | 0 (0.0%) |
| 10:00 AM to 10:59 AM | 0 (0.0%) | 50 (26.7%) |
| 11:00 AM to 11:59 AM | 0 (0.0%) | 0 (0.0%) |
| 12:00 PM to 3:59 PM | 0 (0.0%) | 0 (0.0%) |
| 4:00 PM to 11:59 PM | 0 (0.0%) | 0 (0.0%) |
| Total | 146 (100.0%) | 187 (100.0%) |
Housing Occupancy in South Mills
Occupancy by Ownership in South Mills
Of the total 206 dwellings in South Mills, owner-occupied units account for 206 (100.0%), while renter-occupied units make up 0 (0.0%).
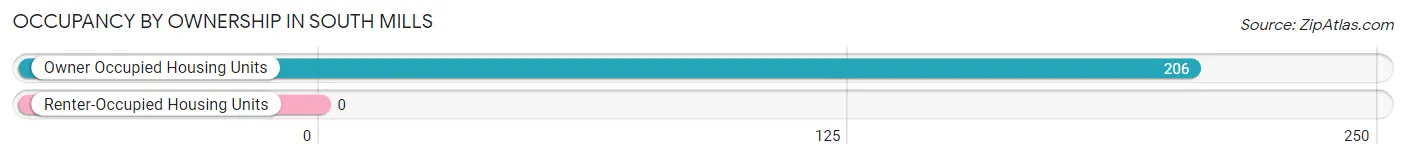
| Occupancy | # Housing Units | % Housing Units |
| Owner Occupied Housing Units | 206 | 100.0% |
| Renter-Occupied Housing Units | 0 | 0.0% |
| Total Occupied Housing Units | 206 | 100.0% |
Occupancy by Household Size in South Mills
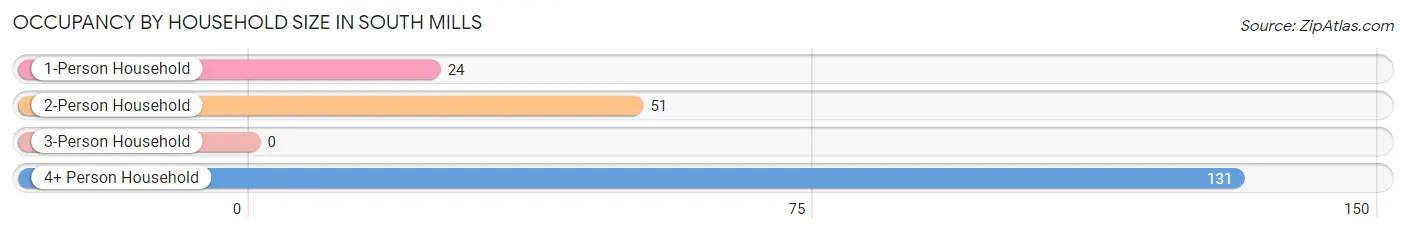
| Household Size | # Housing Units | % Housing Units |
| 1-Person Household | 24 | 11.7% |
| 2-Person Household | 51 | 24.8% |
| 3-Person Household | 0 | 0.0% |
| 4+ Person Household | 131 | 63.6% |
| Total Housing Units | 206 | 100.0% |
Occupancy by Ownership by Household Size in South Mills
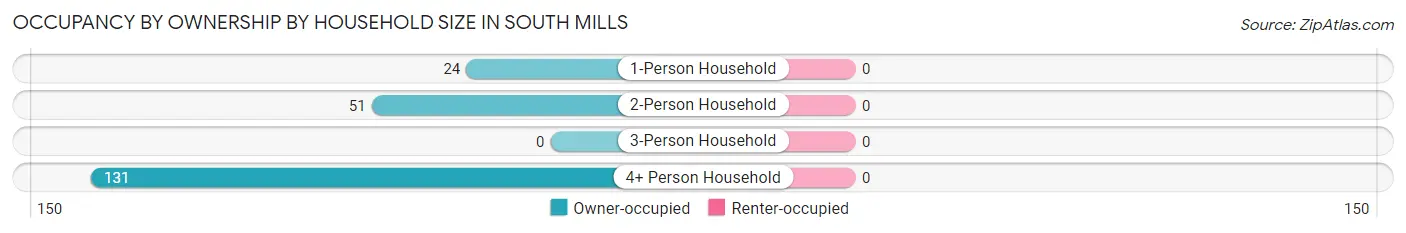
| Household Size | Owner-occupied | Renter-occupied |
| 1-Person Household | 24 (100.0%) | 0 (0.0%) |
| 2-Person Household | 51 (100.0%) | 0 (0.0%) |
| 3-Person Household | 0 (0.0%) | 0 (0.0%) |
| 4+ Person Household | 131 (100.0%) | 0 (0.0%) |
| Total Housing Units | 206 (100.0%) | 0 (0.0%) |
Occupancy by Educational Attainment in South Mills
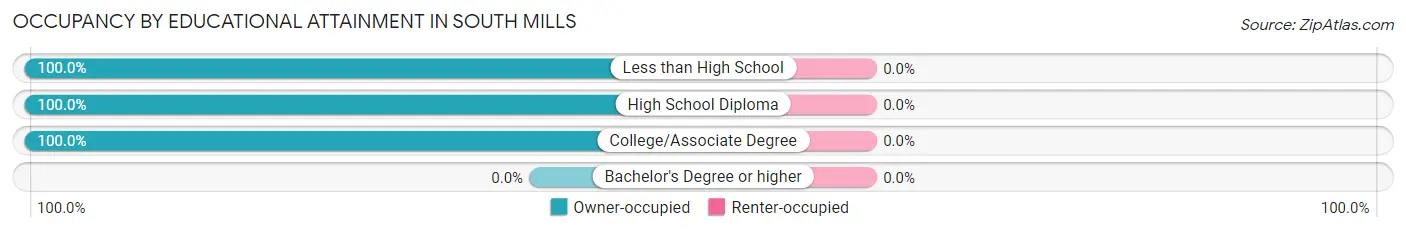
| Household Size | Owner-occupied | Renter-occupied |
| Less than High School | 30 (100.0%) | 0 (0.0%) |
| High School Diploma | 82 (100.0%) | 0 (0.0%) |
| College/Associate Degree | 94 (100.0%) | 0 (0.0%) |
| Bachelor's Degree or higher | 0 (0.0%) | 0 (0.0%) |
Occupancy by Age of Householder in South Mills
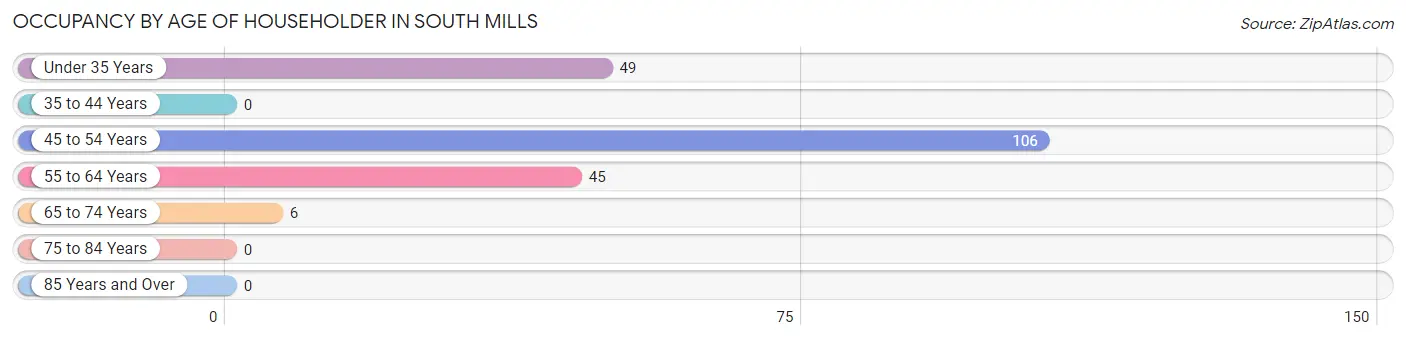
| Age Bracket | # Households | % Households |
| Under 35 Years | 49 | 23.8% |
| 35 to 44 Years | 0 | 0.0% |
| 45 to 54 Years | 106 | 51.5% |
| 55 to 64 Years | 45 | 21.8% |
| 65 to 74 Years | 6 | 2.9% |
| 75 to 84 Years | 0 | 0.0% |
| 85 Years and Over | 0 | 0.0% |
| Total | 206 | 100.0% |
Housing Finances in South Mills
Median Income by Occupancy in South Mills
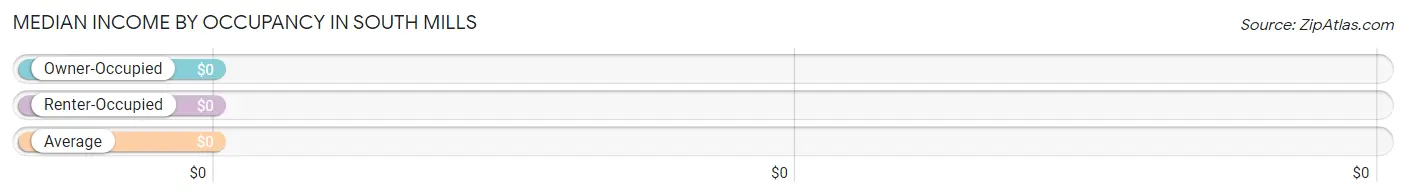
| Occupancy Type | # Households | Median Income |
| Owner-Occupied | 206 (100.0%) | $0 |
| Renter-Occupied | 0 (0.0%) | $0 |
| Average | 206 (100.0%) | $0 |
Occupancy by Householder Income Bracket in South Mills
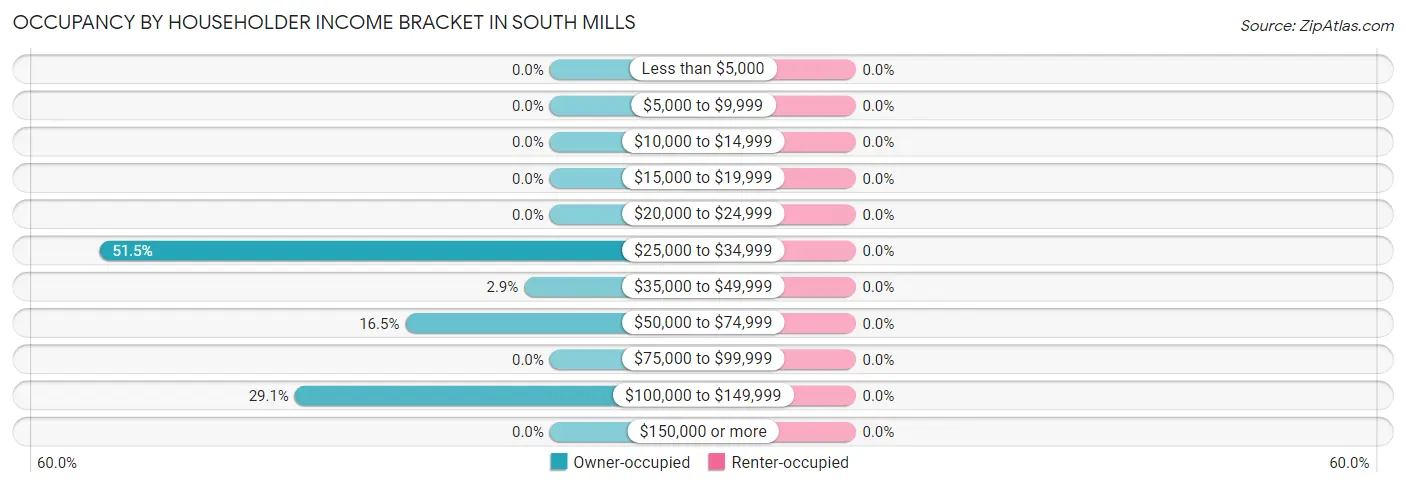
| Income Bracket | Owner-occupied | Renter-occupied |
| Less than $5,000 | 0 (0.0%) | 0 (0.0%) |
| $5,000 to $9,999 | 0 (0.0%) | 0 (0.0%) |
| $10,000 to $14,999 | 0 (0.0%) | 0 (0.0%) |
| $15,000 to $19,999 | 0 (0.0%) | 0 (0.0%) |
| $20,000 to $24,999 | 0 (0.0%) | 0 (0.0%) |
| $25,000 to $34,999 | 106 (51.5%) | 0 (0.0%) |
| $35,000 to $49,999 | 6 (2.9%) | 0 (0.0%) |
| $50,000 to $74,999 | 34 (16.5%) | 0 (0.0%) |
| $75,000 to $99,999 | 0 (0.0%) | 0 (0.0%) |
| $100,000 to $149,999 | 60 (29.1%) | 0 (0.0%) |
| $150,000 or more | 0 (0.0%) | 0 (0.0%) |
| Total | 206 (100.0%) | 0 (0.0%) |
Monthly Housing Cost Tiers in South Mills
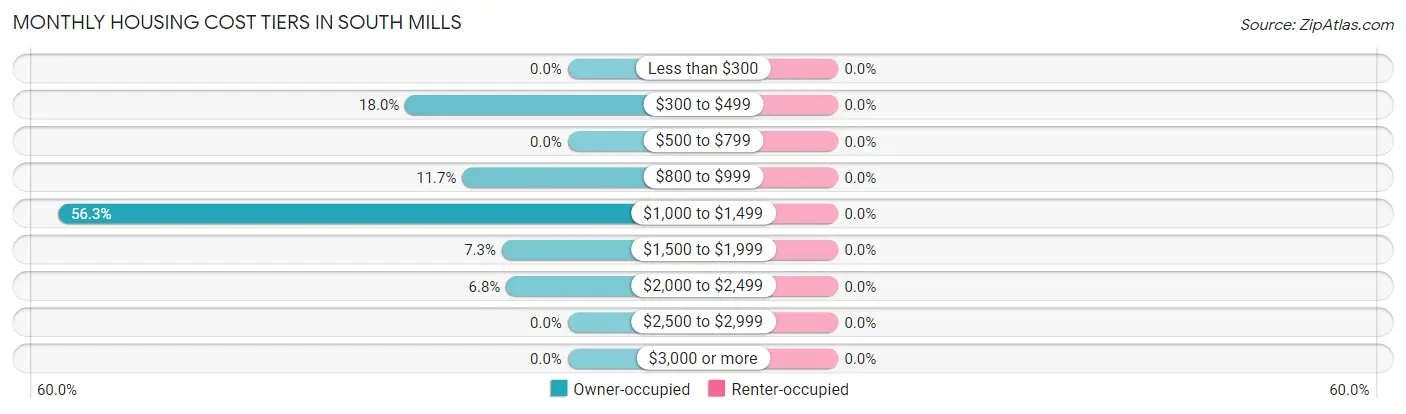
| Monthly Cost | Owner-occupied | Renter-occupied |
| Less than $300 | 0 (0.0%) | 0 (0.0%) |
| $300 to $499 | 37 (18.0%) | 0 (0.0%) |
| $500 to $799 | 0 (0.0%) | 0 (0.0%) |
| $800 to $999 | 24 (11.7%) | 0 (0.0%) |
| $1,000 to $1,499 | 116 (56.3%) | 0 (0.0%) |
| $1,500 to $1,999 | 15 (7.3%) | 0 (0.0%) |
| $2,000 to $2,499 | 14 (6.8%) | 0 (0.0%) |
| $2,500 to $2,999 | 0 (0.0%) | 0 (0.0%) |
| $3,000 or more | 0 (0.0%) | 0 (0.0%) |
| Total | 206 (100.0%) | 0 (0.0%) |
Physical Housing Characteristics in South Mills
Housing Structures in South Mills
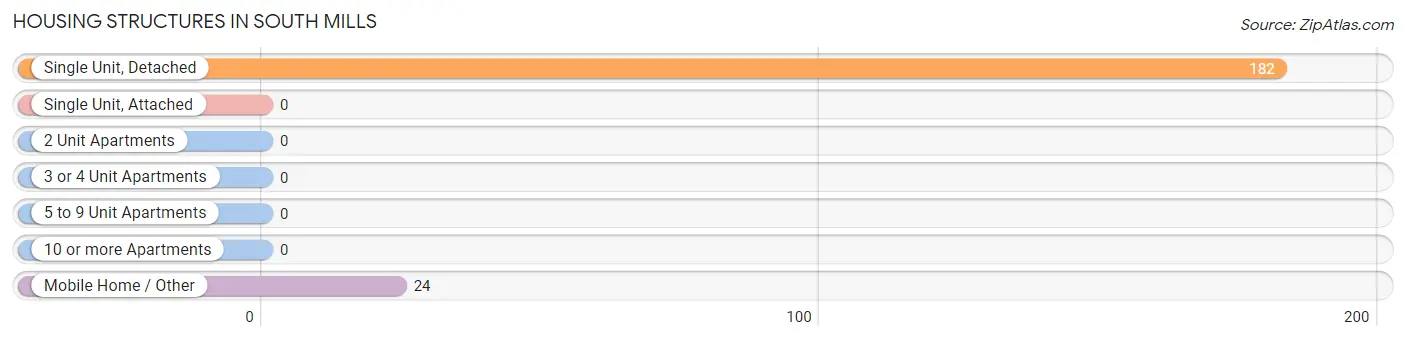
| Structure Type | # Housing Units | % Housing Units |
| Single Unit, Detached | 182 | 88.3% |
| Single Unit, Attached | 0 | 0.0% |
| 2 Unit Apartments | 0 | 0.0% |
| 3 or 4 Unit Apartments | 0 | 0.0% |
| 5 to 9 Unit Apartments | 0 | 0.0% |
| 10 or more Apartments | 0 | 0.0% |
| Mobile Home / Other | 24 | 11.7% |
| Total | 206 | 100.0% |
Housing Structures by Occupancy in South Mills
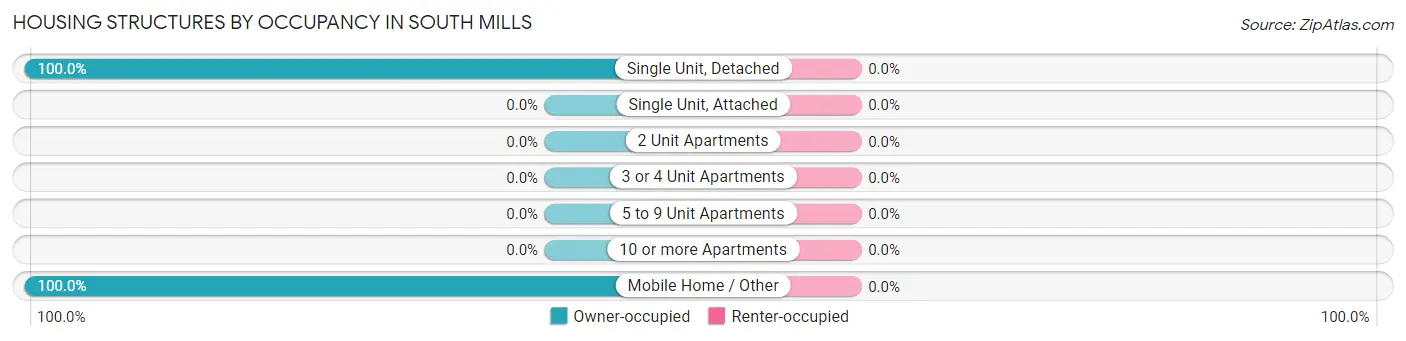
| Structure Type | Owner-occupied | Renter-occupied |
| Single Unit, Detached | 182 (100.0%) | 0 (0.0%) |
| Single Unit, Attached | 0 (0.0%) | 0 (0.0%) |
| 2 Unit Apartments | 0 (0.0%) | 0 (0.0%) |
| 3 or 4 Unit Apartments | 0 (0.0%) | 0 (0.0%) |
| 5 to 9 Unit Apartments | 0 (0.0%) | 0 (0.0%) |
| 10 or more Apartments | 0 (0.0%) | 0 (0.0%) |
| Mobile Home / Other | 24 (100.0%) | 0 (0.0%) |
| Total | 206 (100.0%) | 0 (0.0%) |
Housing Structures by Number of Rooms in South Mills
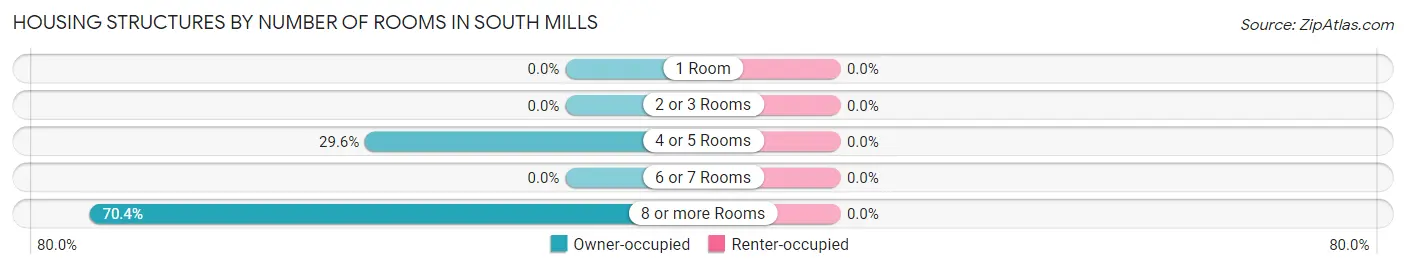
| Number of Rooms | Owner-occupied | Renter-occupied |
| 1 Room | 0 (0.0%) | 0 (0.0%) |
| 2 or 3 Rooms | 0 (0.0%) | 0 (0.0%) |
| 4 or 5 Rooms | 61 (29.6%) | 0 (0.0%) |
| 6 or 7 Rooms | 0 (0.0%) | 0 (0.0%) |
| 8 or more Rooms | 145 (70.4%) | 0 (0.0%) |
| Total | 206 (100.0%) | 0 (0.0%) |
Housing Structure by Heating Type in South Mills
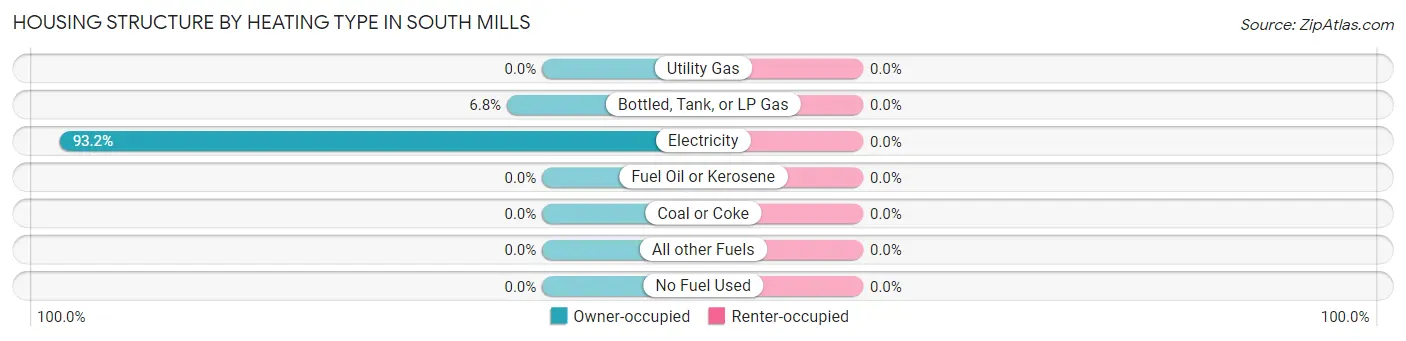
| Heating Type | Owner-occupied | Renter-occupied |
| Utility Gas | 0 (0.0%) | 0 (0.0%) |
| Bottled, Tank, or LP Gas | 14 (6.8%) | 0 (0.0%) |
| Electricity | 192 (93.2%) | 0 (0.0%) |
| Fuel Oil or Kerosene | 0 (0.0%) | 0 (0.0%) |
| Coal or Coke | 0 (0.0%) | 0 (0.0%) |
| All other Fuels | 0 (0.0%) | 0 (0.0%) |
| No Fuel Used | 0 (0.0%) | 0 (0.0%) |
| Total | 206 (100.0%) | 0 (0.0%) |
Household Vehicle Usage in South Mills
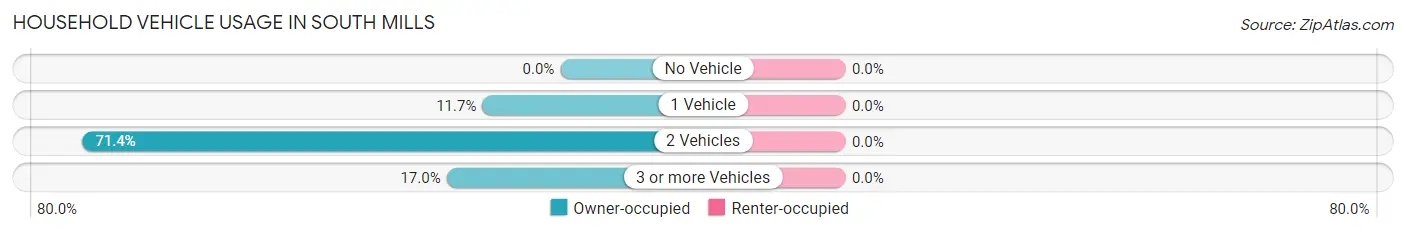
| Vehicles per Household | Owner-occupied | Renter-occupied |
| No Vehicle | 0 (0.0%) | 0 (0.0%) |
| 1 Vehicle | 24 (11.7%) | 0 (0.0%) |
| 2 Vehicles | 147 (71.4%) | 0 (0.0%) |
| 3 or more Vehicles | 35 (17.0%) | 0 (0.0%) |
| Total | 206 (100.0%) | 0 (0.0%) |
Real Estate & Mortgages in South Mills
Real Estate and Mortgage Overview in South Mills
| Characteristic | Without Mortgage | With Mortgage |
| Housing Units | 37 | 169 |
| Median Property Value | - | - |
| Median Household Income | - | - |
| Monthly Housing Costs | - | - |
| Real Estate Taxes | - | - |
Property Value by Mortgage Status in South Mills
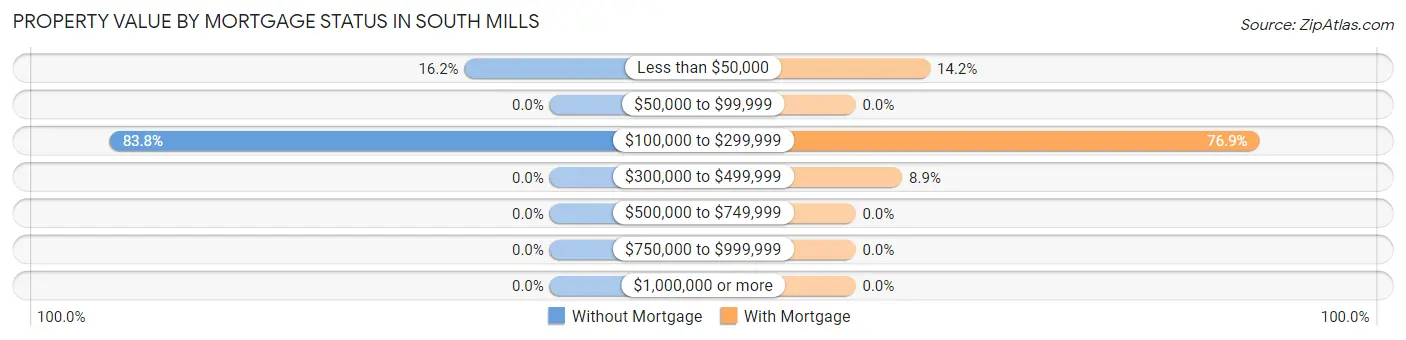
| Property Value | Without Mortgage | With Mortgage |
| Less than $50,000 | 6 (16.2%) | 24 (14.2%) |
| $50,000 to $99,999 | 0 (0.0%) | 0 (0.0%) |
| $100,000 to $299,999 | 31 (83.8%) | 130 (76.9%) |
| $300,000 to $499,999 | 0 (0.0%) | 15 (8.9%) |
| $500,000 to $749,999 | 0 (0.0%) | 0 (0.0%) |
| $750,000 to $999,999 | 0 (0.0%) | 0 (0.0%) |
| $1,000,000 or more | 0 (0.0%) | 0 (0.0%) |
| Total | 37 (100.0%) | 169 (100.0%) |
Household Income by Mortgage Status in South Mills
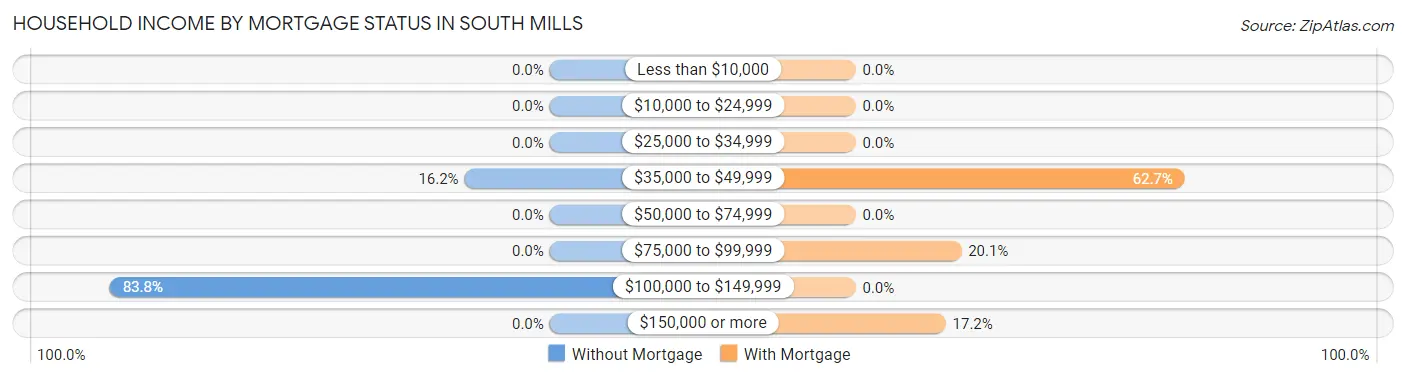
| Household Income | Without Mortgage | With Mortgage |
| Less than $10,000 | 0 (0.0%) | 0 (0.0%) |
| $10,000 to $24,999 | 0 (0.0%) | 0 (0.0%) |
| $25,000 to $34,999 | 0 (0.0%) | 0 (0.0%) |
| $35,000 to $49,999 | 6 (16.2%) | 106 (62.7%) |
| $50,000 to $74,999 | 0 (0.0%) | 0 (0.0%) |
| $75,000 to $99,999 | 0 (0.0%) | 34 (20.1%) |
| $100,000 to $149,999 | 31 (83.8%) | 0 (0.0%) |
| $150,000 or more | 0 (0.0%) | 29 (17.2%) |
| Total | 37 (100.0%) | 169 (100.0%) |
Property Value to Household Income Ratio in South Mills
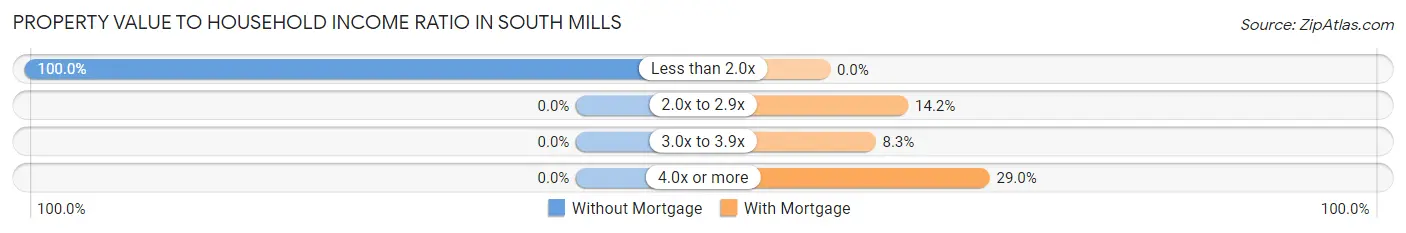
| Value-to-Income Ratio | Without Mortgage | With Mortgage |
| Less than 2.0x | 37 (100.0%) | 0 (0.0%) |
| 2.0x to 2.9x | 0 (0.0%) | 24 (14.2%) |
| 3.0x to 3.9x | 0 (0.0%) | 14 (8.3%) |
| 4.0x or more | 0 (0.0%) | 49 (29.0%) |
| Total | 37 (100.0%) | 169 (100.0%) |
Real Estate Taxes by Mortgage Status in South Mills
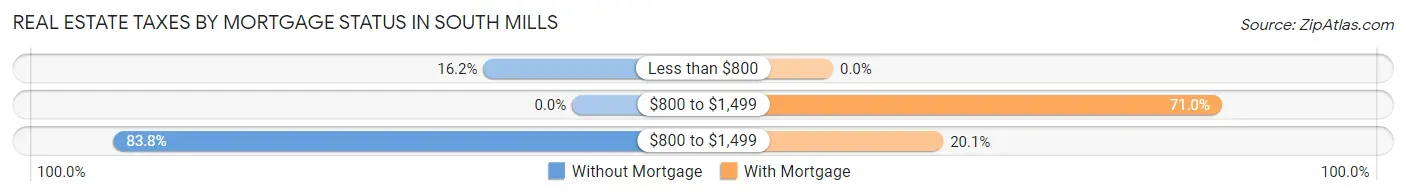
| Property Taxes | Without Mortgage | With Mortgage |
| Less than $800 | 6 (16.2%) | 0 (0.0%) |
| $800 to $1,499 | 0 (0.0%) | 120 (71.0%) |
| $800 to $1,499 | 31 (83.8%) | 34 (20.1%) |
| Total | 37 (100.0%) | 169 (100.0%) |
Health & Disability in South Mills
Health Insurance Coverage by Age in South Mills
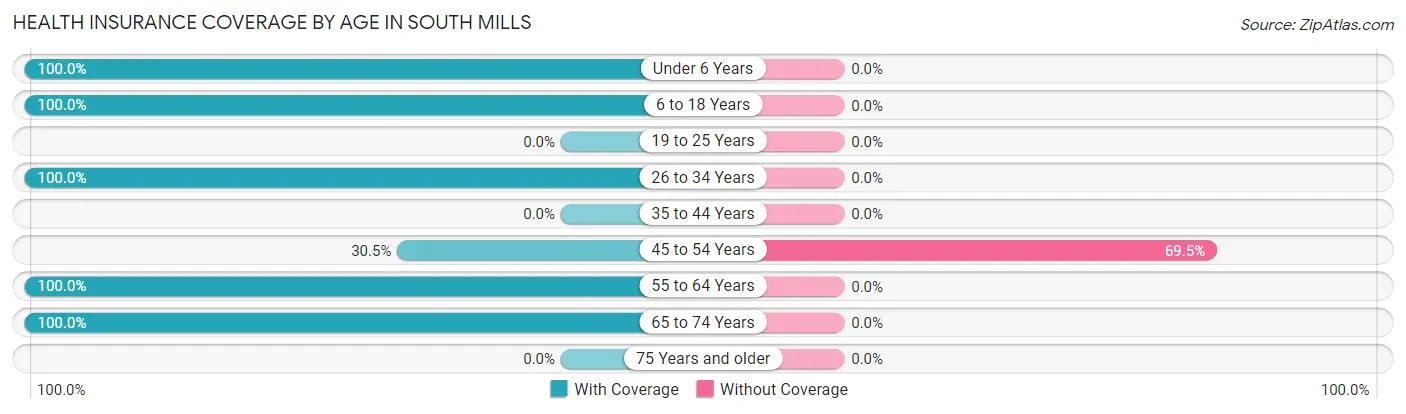
| Age Bracket | With Coverage | Without Coverage |
| Under 6 Years | 139 (100.0%) | 0 (0.0%) |
| 6 to 18 Years | 108 (100.0%) | 0 (0.0%) |
| 19 to 25 Years | 0 (0.0%) | 0 (0.0%) |
| 26 to 34 Years | 170 (100.0%) | 0 (0.0%) |
| 35 to 44 Years | 0 (0.0%) | 0 (0.0%) |
| 45 to 54 Years | 36 (30.5%) | 82 (69.5%) |
| 55 to 64 Years | 79 (100.0%) | 0 (0.0%) |
| 65 to 74 Years | 13 (100.0%) | 0 (0.0%) |
| 75 Years and older | 0 (0.0%) | 0 (0.0%) |
| Total | 545 (86.9%) | 82 (13.1%) |
Health Insurance Coverage by Citizenship Status in South Mills
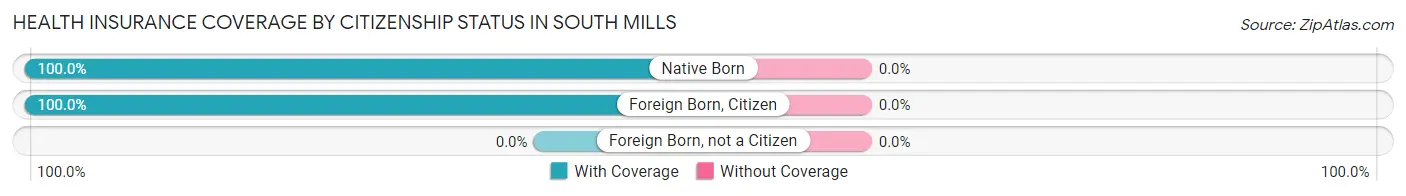
| Citizenship Status | With Coverage | Without Coverage |
| Native Born | 139 (100.0%) | 0 (0.0%) |
| Foreign Born, Citizen | 108 (100.0%) | 0 (0.0%) |
| Foreign Born, not a Citizen | 0 (0.0%) | 0 (0.0%) |
Health Insurance Coverage by Household Income in South Mills
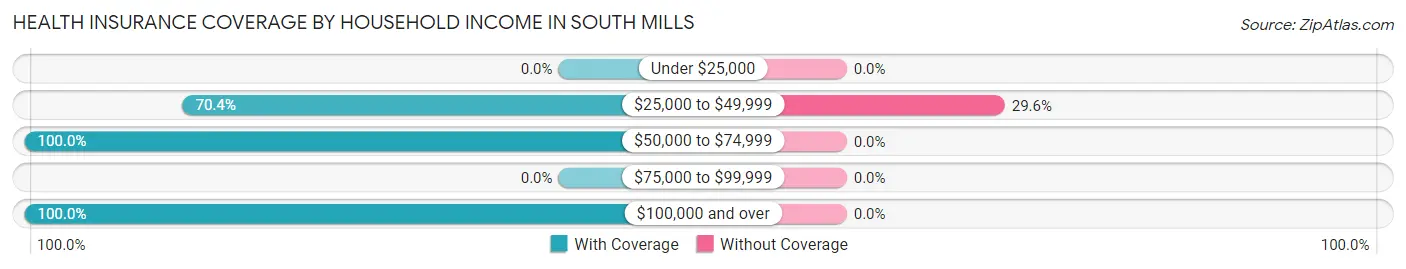
| Household Income | With Coverage | Without Coverage |
| Under $25,000 | 0 (0.0%) | 0 (0.0%) |
| $25,000 to $49,999 | 195 (70.4%) | 82 (29.6%) |
| $50,000 to $74,999 | 206 (100.0%) | 0 (0.0%) |
| $75,000 to $99,999 | 0 (0.0%) | 0 (0.0%) |
| $100,000 and over | 144 (100.0%) | 0 (0.0%) |
Public vs Private Health Insurance Coverage by Age in South Mills
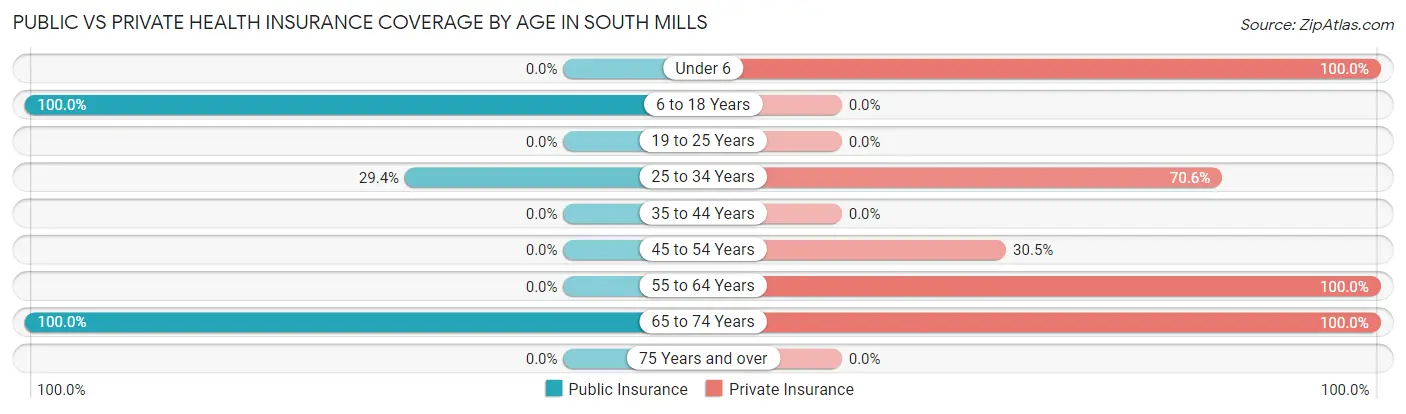
| Age Bracket | Public Insurance | Private Insurance |
| Under 6 | 0 (0.0%) | 139 (100.0%) |
| 6 to 18 Years | 108 (100.0%) | 0 (0.0%) |
| 19 to 25 Years | 0 (0.0%) | 0 (0.0%) |
| 25 to 34 Years | 50 (29.4%) | 120 (70.6%) |
| 35 to 44 Years | 0 (0.0%) | 0 (0.0%) |
| 45 to 54 Years | 0 (0.0%) | 36 (30.5%) |
| 55 to 64 Years | 0 (0.0%) | 79 (100.0%) |
| 65 to 74 Years | 13 (100.0%) | 13 (100.0%) |
| 75 Years and over | 0 (0.0%) | 0 (0.0%) |
| Total | 171 (27.3%) | 387 (61.7%) |
Disability Status by Sex by Age in South Mills
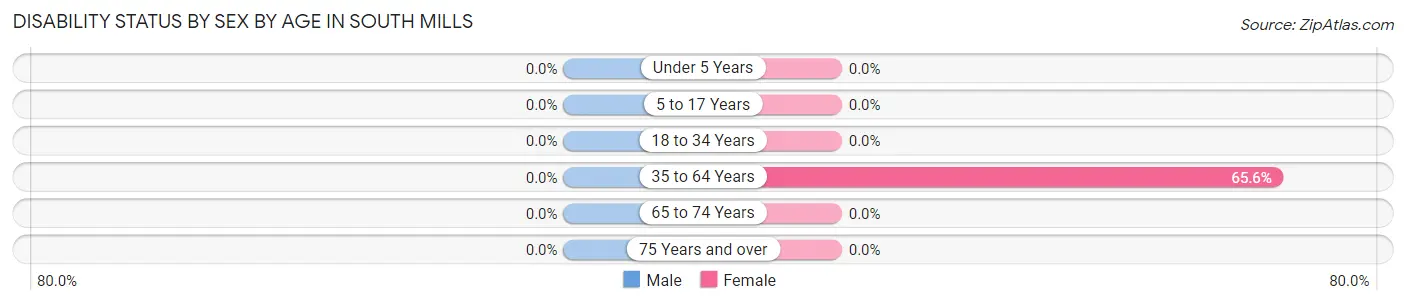
| Age Bracket | Male | Female |
| Under 5 Years | 0 (0.0%) | 0 (0.0%) |
| 5 to 17 Years | 0 (0.0%) | 0 (0.0%) |
| 18 to 34 Years | 0 (0.0%) | 0 (0.0%) |
| 35 to 64 Years | 0 (0.0%) | 82 (65.6%) |
| 65 to 74 Years | 0 (0.0%) | 0 (0.0%) |
| 75 Years and over | 0 (0.0%) | 0 (0.0%) |
Disability Class by Sex by Age in South Mills
Disability Class: Hearing Difficulty
| Age Bracket | Male | Female |
| Under 5 Years | 0 (0.0%) | 0 (0.0%) |
| 5 to 17 Years | 0 (0.0%) | 0 (0.0%) |
| 18 to 34 Years | 0 (0.0%) | 0 (0.0%) |
| 35 to 64 Years | 0 (0.0%) | 0 (0.0%) |
| 65 to 74 Years | 0 (0.0%) | 0 (0.0%) |
| 75 Years and over | 0 (0.0%) | 0 (0.0%) |
Disability Class: Vision Difficulty
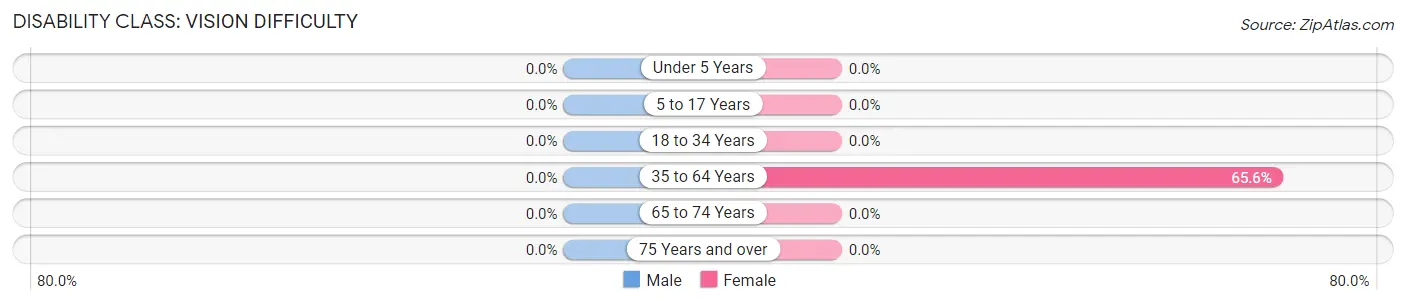
| Age Bracket | Male | Female |
| Under 5 Years | 0 (0.0%) | 0 (0.0%) |
| 5 to 17 Years | 0 (0.0%) | 0 (0.0%) |
| 18 to 34 Years | 0 (0.0%) | 0 (0.0%) |
| 35 to 64 Years | 0 (0.0%) | 82 (65.6%) |
| 65 to 74 Years | 0 (0.0%) | 0 (0.0%) |
| 75 Years and over | 0 (0.0%) | 0 (0.0%) |
Disability Class: Cognitive Difficulty
| Age Bracket | Male | Female |
| 5 to 17 Years | 0 (0.0%) | 0 (0.0%) |
| 18 to 34 Years | 0 (0.0%) | 0 (0.0%) |
| 35 to 64 Years | 0 (0.0%) | 0 (0.0%) |
| 65 to 74 Years | 0 (0.0%) | 0 (0.0%) |
| 75 Years and over | 0 (0.0%) | 0 (0.0%) |
Disability Class: Ambulatory Difficulty
| Age Bracket | Male | Female |
| 5 to 17 Years | 0 (0.0%) | 0 (0.0%) |
| 18 to 34 Years | 0 (0.0%) | 0 (0.0%) |
| 35 to 64 Years | 0 (0.0%) | 0 (0.0%) |
| 65 to 74 Years | 0 (0.0%) | 0 (0.0%) |
| 75 Years and over | 0 (0.0%) | 0 (0.0%) |
Disability Class: Self-Care Difficulty
| Age Bracket | Male | Female |
| 5 to 17 Years | 0 (0.0%) | 0 (0.0%) |
| 18 to 34 Years | 0 (0.0%) | 0 (0.0%) |
| 35 to 64 Years | 0 (0.0%) | 0 (0.0%) |
| 65 to 74 Years | 0 (0.0%) | 0 (0.0%) |
| 75 Years and over | 0 (0.0%) | 0 (0.0%) |
Technology Access in South Mills
Computing Device Access in South Mills
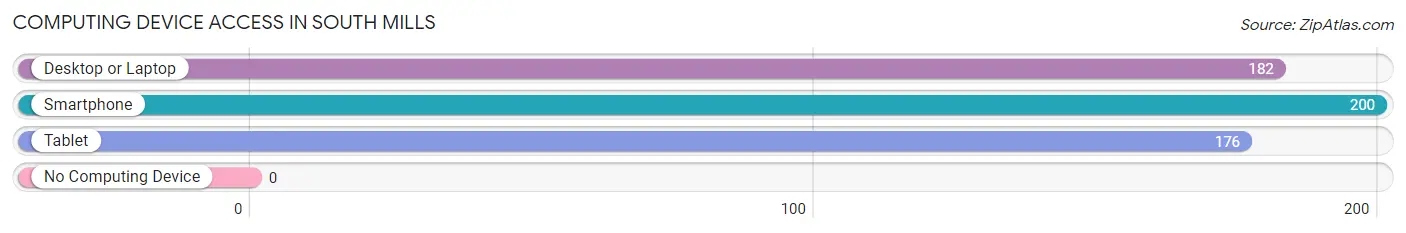
| Device Type | # Households | % Households |
| Desktop or Laptop | 182 | 88.3% |
| Smartphone | 200 | 97.1% |
| Tablet | 176 | 85.4% |
| No Computing Device | 0 | 0.0% |
| Total | 206 | 100.0% |
Internet Access in South Mills
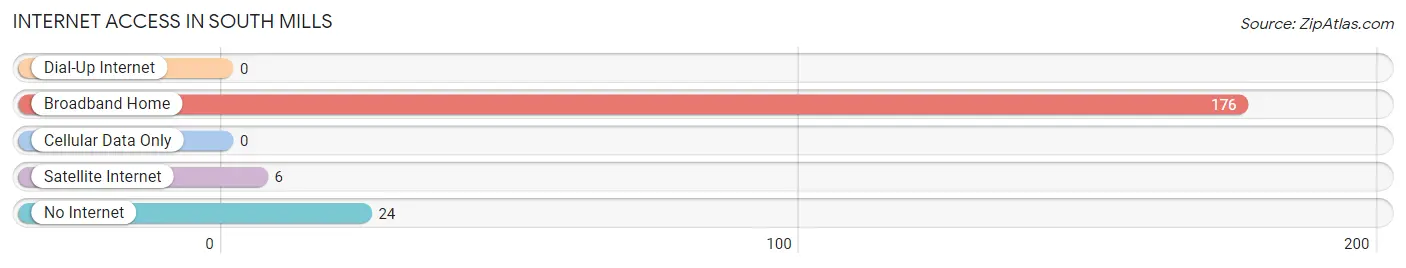
| Internet Type | # Households | % Households |
| Dial-Up Internet | 0 | 0.0% |
| Broadband Home | 176 | 85.4% |
| Cellular Data Only | 0 | 0.0% |
| Satellite Internet | 6 | 2.9% |
| No Internet | 24 | 11.7% |
| Total | 206 | 100.0% |
South Mills Summary
History
South Mills is a small town located in Camden County, North Carolina. It is situated on the banks of the Pasquotank River, and is part of the Elizabeth City Micropolitan Statistical Area. The town was first settled in 1790 by a group of Quakers from Pennsylvania, and was originally known as “Quaker Settlement”. The town was officially incorporated in 1887, and was named after the nearby South Mills Plantation.
The town was an important port for the shipping of naval stores, such as turpentine and tar, during the 19th century. The town was also home to a number of shipbuilding companies, and was the site of the first steamboat to be built in North Carolina. The town was also home to a number of other industries, including a cotton mill, a sawmill, and a brickyard.
The town was also home to a number of prominent citizens, including William H. S. Burgwyn, a Confederate general who was killed in the Battle of Gettysburg. The town was also home to a number of prominent African-American citizens, including the Reverend John T. Moore, who was a leader in the African-American community in the late 19th and early 20th centuries.
Geography
South Mills is located in Camden County, North Carolina, and is situated on the banks of the Pasquotank River. The town is located approximately 20 miles south of Elizabeth City, and is part of the Elizabeth City Micropolitan Statistical Area. The town is located in a rural area, and is surrounded by farmland and forests. The town is located at an elevation of approximately 20 feet above sea level.
The climate in South Mills is classified as humid subtropical, with hot, humid summers and mild winters. The average annual temperature is around 68 degrees Fahrenheit, and the average annual precipitation is around 45 inches.
Economy
The economy of South Mills is largely based on agriculture and tourism. The town is home to a number of farms, and is a popular destination for tourists who are interested in exploring the area’s natural beauty. The town is also home to a number of small businesses, including restaurants, shops, and other services.
The town is also home to a number of manufacturing companies, including a furniture manufacturer, a boat manufacturer, and a plastics manufacturer. The town is also home to a number of government agencies, including the Camden County Sheriff’s Office, the Camden County Health Department, and the Camden County Public Schools.
Demographics
As of the 2010 census, the population of South Mills was 1,845. The racial makeup of the town was 79.3% White, 17.2% African American, 0.7% Native American, 0.3% Asian, 0.1% Pacific Islander, and 2.4% from other races. The median household income was $37,917, and the median family income was $45,938. The per capita income was $19,945.
Conclusion
South Mills is a small town located in Camden County, North Carolina. It is situated on the banks of the Pasquotank River, and is part of the Elizabeth City Micropolitan Statistical Area. The town was first settled in 1790 by a group of Quakers from Pennsylvania, and was officially incorporated in 1887. The town’s economy is largely based on agriculture and tourism, and it is home to a number of small businesses, manufacturing companies, and government agencies. As of the 2010 census, the population of South Mills was 1,845, and the median household income was $37,917.
Common Questions
What is Per Capita Income in South Mills?
Per Capita income in South Mills is $22,878.
What is Inequality or Gini Index in South Mills?
Inequality or Gini Index in South Mills is 0.36.
What is the Total Population of South Mills?
Total Population of South Mills is 627.
What is the Total Male Population of South Mills?
Total Male Population of South Mills is 386.
What is the Total Female Population of South Mills?
Total Female Population of South Mills is 241.
What is the Ratio of Males per 100 Females in South Mills?
There are 160.17 Males per 100 Females in South Mills.
What is the Ratio of Females per 100 Males in South Mills?
There are 62.44 Females per 100 Males in South Mills.
What is the Median Population Age in South Mills?
Median Population Age in South Mills is 29.3 Years.
What is the Average Family Size in South Mills
Average Family Size in South Mills is 3.4 People.
What is the Average Household Size in South Mills
Average Household Size in South Mills is 3.0 People.
How Large is the Labor Force in South Mills?
There are 367 People in the Labor Forcein in South Mills.
What is the Percentage of People in the Labor Force in South Mills?
96.6% of People are in the Labor Force in South Mills.
What is the Unemployment Rate in South Mills?
Unemployment Rate in South Mills is 9.3%.