Woodfin, NC Map & Demographics
Woodfin Map
Woodfin Overview
$37,727
PER CAPITA INCOME
$70,956
AVG FAMILY INCOME
$59,144
AVG HOUSEHOLD INCOME
16.7%
WAGE / INCOME GAP [ % ]
83.3¢/ $1
WAGE / INCOME GAP [ $ ]
0.45
INEQUALITY / GINI INDEX
7,901
TOTAL POPULATION
4,253
MALE POPULATION
3,648
FEMALE POPULATION
116.58
MALES / 100 FEMALES
85.77
FEMALES / 100 MALES
42.3
MEDIAN AGE
3.0
AVG FAMILY SIZE
2.4
AVG HOUSEHOLD SIZE
3,938
LABOR FORCE [ PEOPLE ]
56.0%
PERCENT IN LABOR FORCE
2.0%
UNEMPLOYMENT RATE
Woodfin Area Codes
Income in Woodfin
Income Overview in Woodfin
Per Capita Income in Woodfin is $37,727, while median incomes of families and households are $70,956 and $59,144 respectively.
| Characteristic | Number | Measure |
| Per Capita Income | 7,901 | $37,727 |
| Median Family Income | 1,641 | $70,956 |
| Mean Family Income | 1,641 | $105,169 |
| Median Household Income | 2,958 | $59,144 |
| Mean Household Income | 2,958 | $85,123 |
| Income Deficit | 1,641 | $0 |
| Wage / Income Gap (%) | 7,901 | 16.74% |
| Wage / Income Gap ($) | 7,901 | 83.26¢ per $1 |
| Gini / Inequality Index | 7,901 | 0.45 |
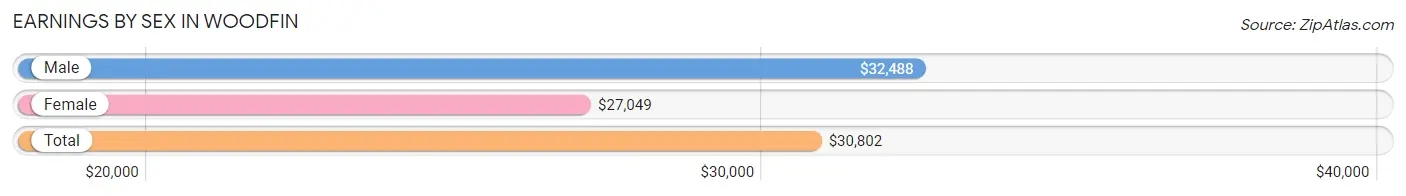
Earnings by Sex in Woodfin
Average Earnings in Woodfin are $30,802, $32,488 for men and $27,049 for women, a difference of 16.7%.
| Sex | Number | Average Earnings |
| Male | 2,534 (58.2%) | $32,488 |
| Female | 1,822 (41.8%) | $27,049 |
| Total | 4,356 (100.0%) | $30,802 |
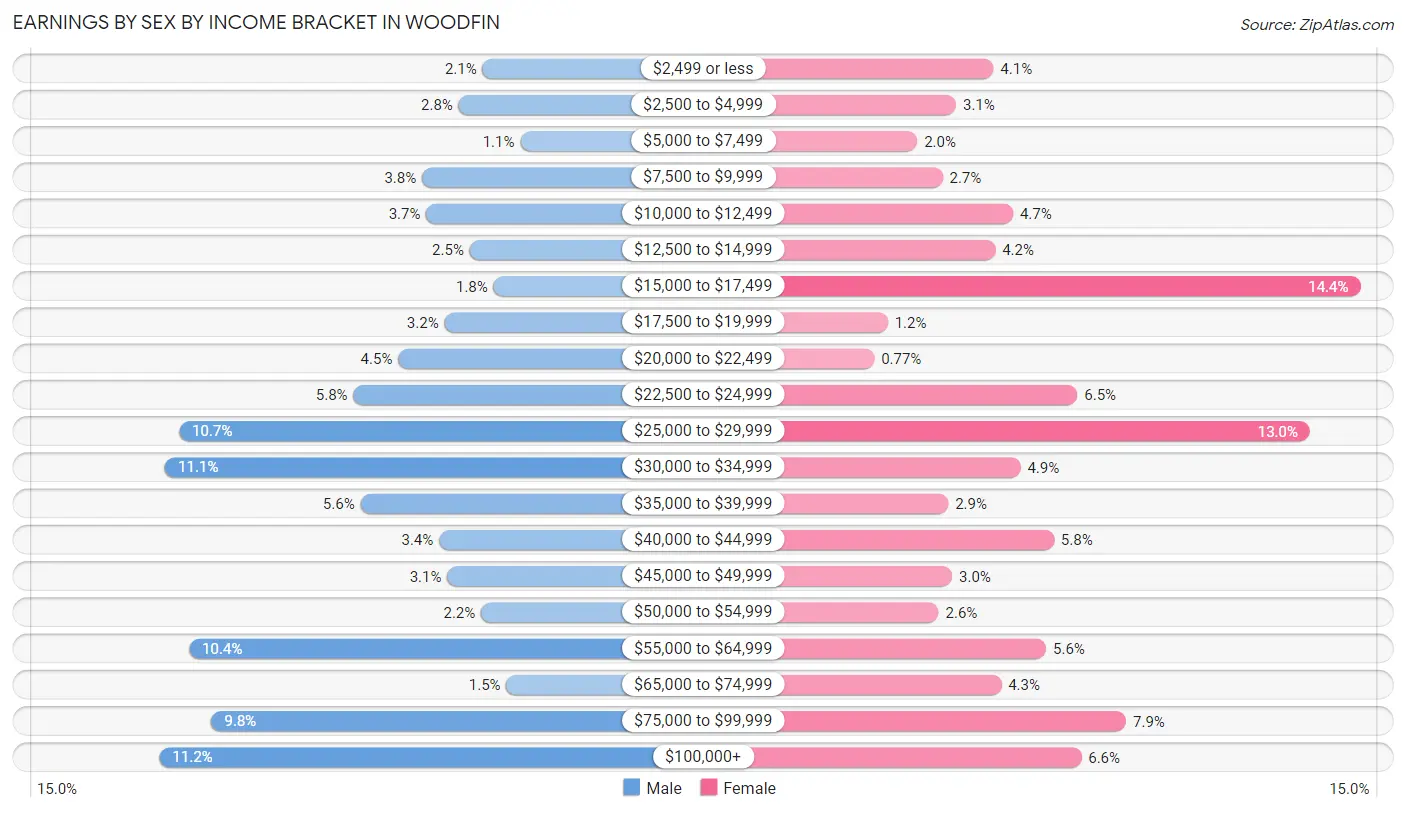
Earnings by Sex by Income Bracket in Woodfin
The most common earnings brackets in Woodfin are $100,000+ for men (284 | 11.2%) and $15,000 to $17,499 for women (263 | 14.4%).
| Income | Male | Female |
| $2,499 or less | 54 (2.1%) | 75 (4.1%) |
| $2,500 to $4,999 | 71 (2.8%) | 56 (3.1%) |
| $5,000 to $7,499 | 27 (1.1%) | 36 (2.0%) |
| $7,500 to $9,999 | 97 (3.8%) | 49 (2.7%) |
| $10,000 to $12,499 | 94 (3.7%) | 85 (4.7%) |
| $12,500 to $14,999 | 63 (2.5%) | 76 (4.2%) |
| $15,000 to $17,499 | 46 (1.8%) | 263 (14.4%) |
| $17,500 to $19,999 | 81 (3.2%) | 21 (1.1%) |
| $20,000 to $22,499 | 114 (4.5%) | 14 (0.8%) |
| $22,500 to $24,999 | 146 (5.8%) | 118 (6.5%) |
| $25,000 to $29,999 | 270 (10.7%) | 237 (13.0%) |
| $30,000 to $34,999 | 280 (11.1%) | 89 (4.9%) |
| $35,000 to $39,999 | 141 (5.6%) | 52 (2.9%) |
| $40,000 to $44,999 | 85 (3.4%) | 106 (5.8%) |
| $45,000 to $49,999 | 79 (3.1%) | 54 (3.0%) |
| $50,000 to $54,999 | 55 (2.2%) | 47 (2.6%) |
| $55,000 to $64,999 | 263 (10.4%) | 102 (5.6%) |
| $65,000 to $74,999 | 37 (1.5%) | 79 (4.3%) |
| $75,000 to $99,999 | 247 (9.8%) | 143 (7.9%) |
| $100,000+ | 284 (11.2%) | 120 (6.6%) |
| Total | 2,534 (100.0%) | 1,822 (100.0%) |
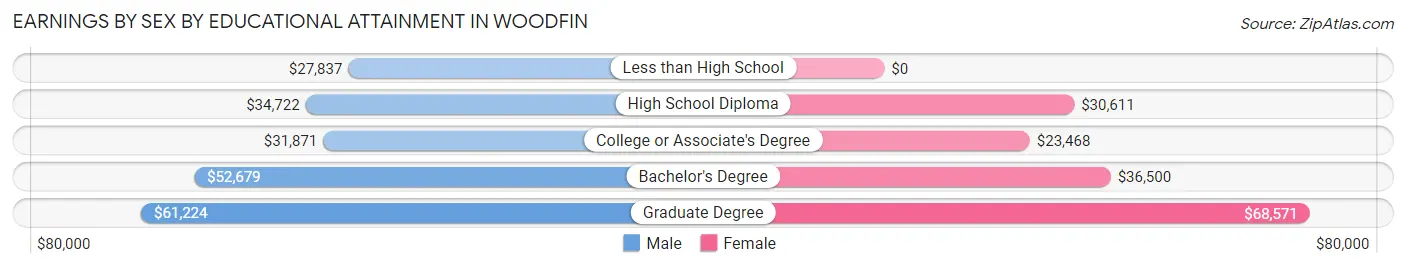
Earnings by Sex by Educational Attainment in Woodfin
Average earnings in Woodfin are $35,543 for men and $29,718 for women, a difference of 16.4%. Men with an educational attainment of graduate degree enjoy the highest average annual earnings of $61,224, while those with less than high school education earn the least with $27,837. Women with an educational attainment of graduate degree earn the most with the average annual earnings of $68,571, while those with college or associate's degree education have the smallest earnings of $23,468.
| Educational Attainment | Male Income | Female Income |
| Less than High School | $27,837 | $0 |
| High School Diploma | $34,722 | $30,611 |
| College or Associate's Degree | $31,871 | $23,468 |
| Bachelor's Degree | $52,679 | $36,500 |
| Graduate Degree | $61,224 | $68,571 |
| Total | $35,543 | $29,718 |
Family Income in Woodfin
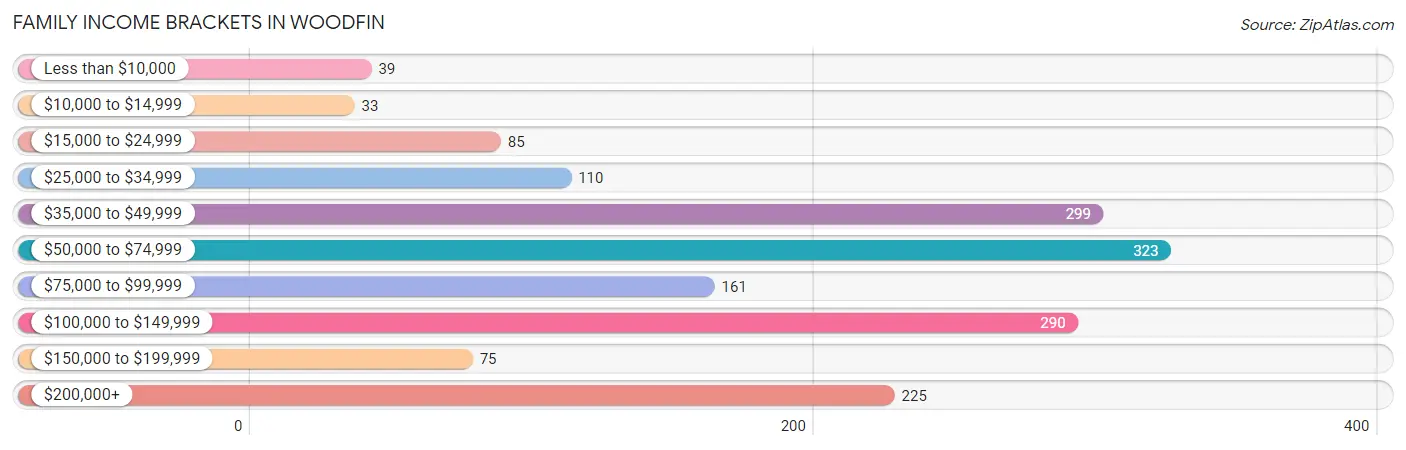
Family Income Brackets in Woodfin
According to the Woodfin family income data, there are 323 families falling into the $50,000 to $74,999 income range, which is the most common income bracket and makes up 19.7% of all families. Conversely, the $10,000 to $14,999 income bracket is the least frequent group with only 33 families (2.0%) belonging to this category.
| Income Bracket | # Families | % Families |
| Less than $10,000 | 39 | 2.4% |
| $10,000 to $14,999 | 33 | 2.0% |
| $15,000 to $24,999 | 85 | 5.2% |
| $25,000 to $34,999 | 110 | 6.7% |
| $35,000 to $49,999 | 299 | 18.2% |
| $50,000 to $74,999 | 323 | 19.7% |
| $75,000 to $99,999 | 161 | 9.8% |
| $100,000 to $149,999 | 290 | 17.7% |
| $150,000 to $199,999 | 75 | 4.6% |
| $200,000+ | 225 | 13.7% |
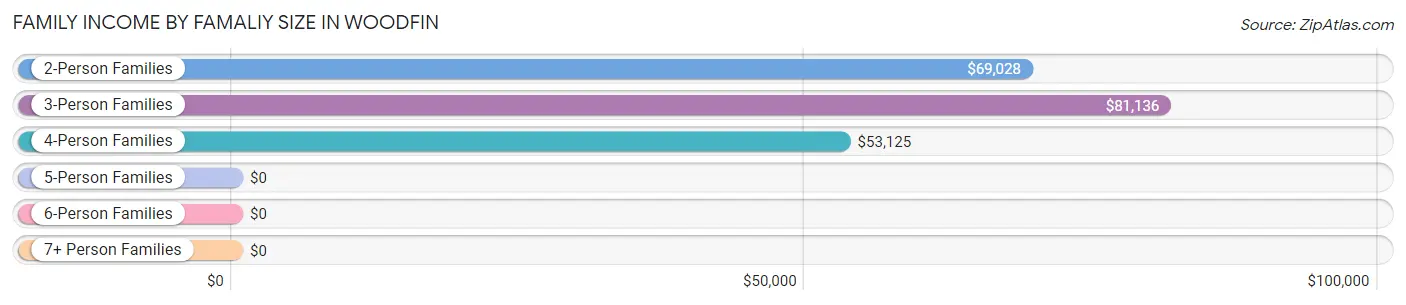
Family Income by Famaliy Size in Woodfin
3-person families (302 | 18.4%) account for the highest median family income in Woodfin with $81,136 per family, while 2-person families (1,074 | 65.4%) have the highest median income of $34,514 per family member.
| Income Bracket | # Families | Median Income |
| 2-Person Families | 1,074 (65.4%) | $69,028 |
| 3-Person Families | 302 (18.4%) | $81,136 |
| 4-Person Families | 241 (14.7%) | $53,125 |
| 5-Person Families | 24 (1.5%) | $0 |
| 6-Person Families | 0 (0.0%) | $0 |
| 7+ Person Families | 0 (0.0%) | $0 |
| Total | 1,641 (100.0%) | $70,956 |
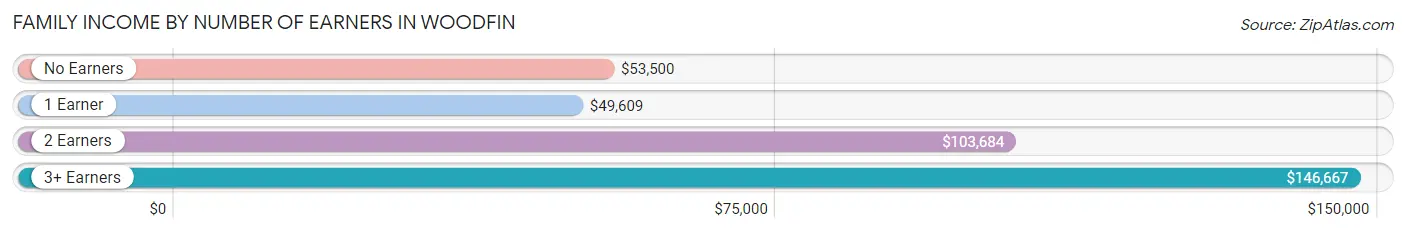
Family Income by Number of Earners in Woodfin
The median family income in Woodfin is $70,956, with families comprising 3+ earners (54) having the highest median family income of $146,667, while families with 1 earner (539) have the lowest median family income of $49,609, accounting for 3.3% and 32.9% of families, respectively.
| Number of Earners | # Families | Median Income |
| No Earners | 384 (23.4%) | $53,500 |
| 1 Earner | 539 (32.9%) | $49,609 |
| 2 Earners | 664 (40.5%) | $103,684 |
| 3+ Earners | 54 (3.3%) | $146,667 |
| Total | 1,641 (100.0%) | $70,956 |
Household Income in Woodfin
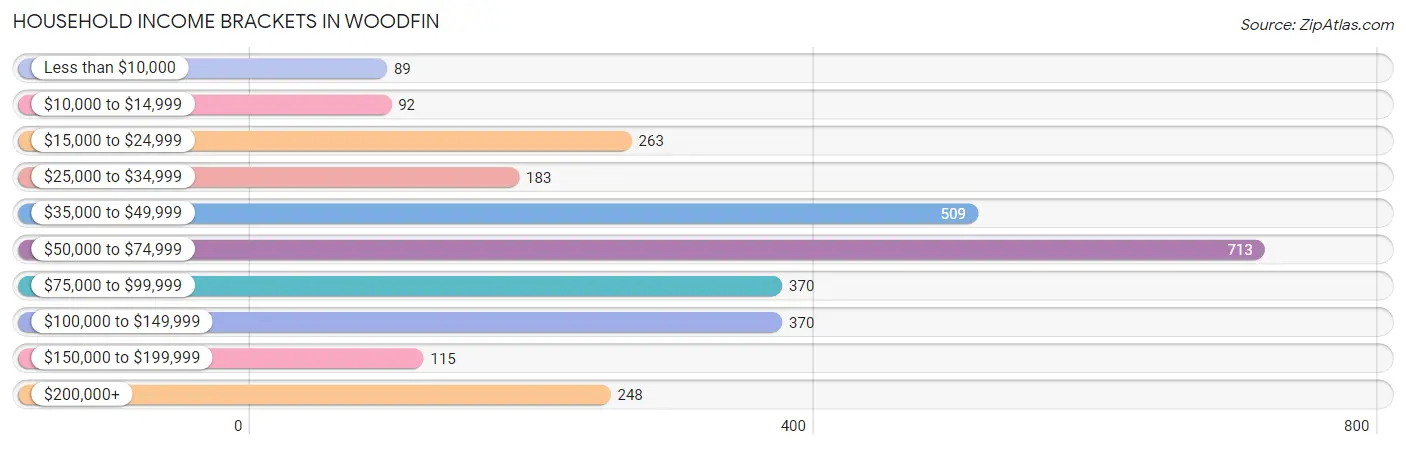
Household Income Brackets in Woodfin
With 713 households falling in the category, the $50,000 to $74,999 income range is the most frequent in Woodfin, accounting for 24.1% of all households. In contrast, only 89 households (3.0%) fall into the less than $10,000 income bracket, making it the least populous group.
| Income Bracket | # Households | % Households |
| Less than $10,000 | 89 | 3.0% |
| $10,000 to $14,999 | 92 | 3.1% |
| $15,000 to $24,999 | 263 | 8.9% |
| $25,000 to $34,999 | 183 | 6.2% |
| $35,000 to $49,999 | 509 | 17.2% |
| $50,000 to $74,999 | 713 | 24.1% |
| $75,000 to $99,999 | 370 | 12.5% |
| $100,000 to $149,999 | 370 | 12.5% |
| $150,000 to $199,999 | 115 | 3.9% |
| $200,000+ | 248 | 8.4% |
Household Income by Householder Age in Woodfin
The median household income in Woodfin is $59,144, with the highest median household income of $64,762 found in the 25 to 44 years age bracket for the primary householder. A total of 988 households (33.4%) fall into this category. Meanwhile, the 15 to 24 years age bracket for the primary householder has the lowest median household income of $41,094, with 133 households (4.5%) in this group.
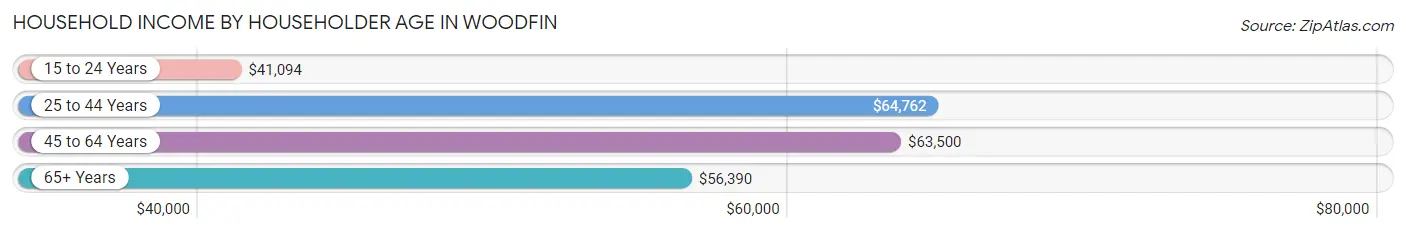
| Income Bracket | # Households | Median Income |
| 15 to 24 Years | 133 (4.5%) | $41,094 |
| 25 to 44 Years | 988 (33.4%) | $64,762 |
| 45 to 64 Years | 1,002 (33.9%) | $63,500 |
| 65+ Years | 835 (28.2%) | $56,390 |
| Total | 2,958 (100.0%) | $59,144 |
Poverty in Woodfin
Income Below Poverty by Sex and Age in Woodfin
With 13.2% poverty level for males and 15.7% for females among the residents of Woodfin, 12 to 14 year old males and 6 to 11 year old females are the most vulnerable to poverty, with 80 males (57.6%) and 129 females (55.4%) in their respective age groups living below the poverty level.
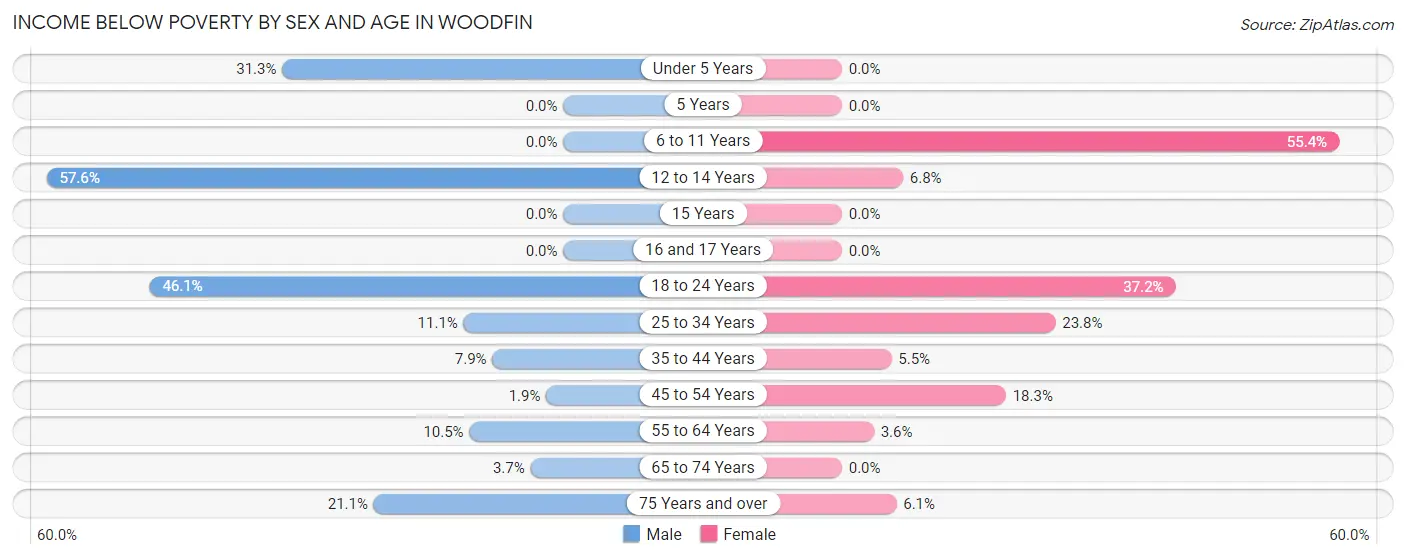
| Age Bracket | Male | Female |
| Under 5 Years | 41 (31.3%) | 0 (0.0%) |
| 5 Years | 0 (0.0%) | 0 (0.0%) |
| 6 to 11 Years | 0 (0.0%) | 129 (55.4%) |
| 12 to 14 Years | 80 (57.6%) | 7 (6.8%) |
| 15 Years | 0 (0.0%) | 0 (0.0%) |
| 16 and 17 Years | 0 (0.0%) | 0 (0.0%) |
| 18 to 24 Years | 112 (46.1%) | 107 (37.1%) |
| 25 to 34 Years | 87 (11.1%) | 166 (23.8%) |
| 35 to 44 Years | 46 (7.9%) | 24 (5.5%) |
| 45 to 54 Years | 9 (1.9%) | 86 (18.3%) |
| 55 to 64 Years | 61 (10.5%) | 15 (3.5%) |
| 65 to 74 Years | 14 (3.6%) | 0 (0.0%) |
| 75 Years and over | 38 (21.1%) | 23 (6.1%) |
| Total | 488 (13.2%) | 557 (15.7%) |
Income Above Poverty by Sex and Age in Woodfin
According to the poverty statistics in Woodfin, males aged 6 to 11 years and females aged under 5 years are the age groups that are most secure financially, with 100.0% of males and 100.0% of females in these age groups living above the poverty line.
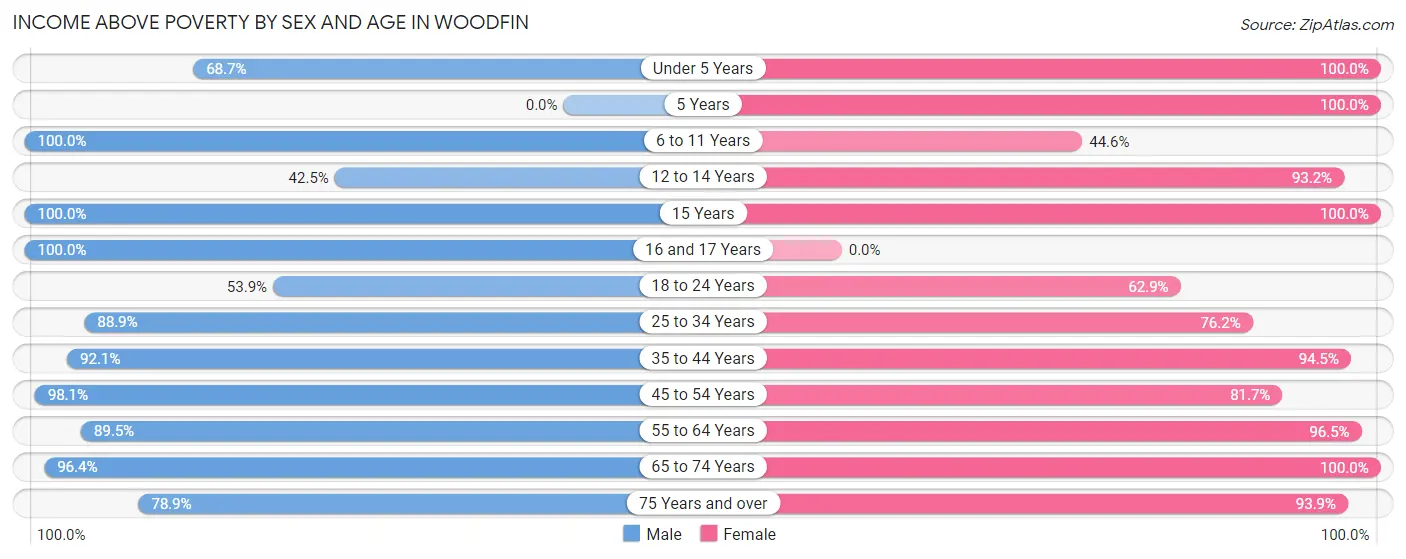
| Age Bracket | Male | Female |
| Under 5 Years | 90 (68.7%) | 137 (100.0%) |
| 5 Years | 0 (0.0%) | 10 (100.0%) |
| 6 to 11 Years | 35 (100.0%) | 104 (44.6%) |
| 12 to 14 Years | 59 (42.4%) | 96 (93.2%) |
| 15 Years | 30 (100.0%) | 26 (100.0%) |
| 16 and 17 Years | 135 (100.0%) | 0 (0.0%) |
| 18 to 24 Years | 131 (53.9%) | 181 (62.8%) |
| 25 to 34 Years | 697 (88.9%) | 532 (76.2%) |
| 35 to 44 Years | 536 (92.1%) | 411 (94.5%) |
| 45 to 54 Years | 464 (98.1%) | 385 (81.7%) |
| 55 to 64 Years | 522 (89.5%) | 408 (96.5%) |
| 65 to 74 Years | 370 (96.4%) | 341 (100.0%) |
| 75 Years and over | 142 (78.9%) | 356 (93.9%) |
| Total | 3,211 (86.8%) | 2,987 (84.3%) |
Income Below Poverty Among Married-Couple Families in Woodfin
The poverty statistics for married-couple families in Woodfin show that 7.1% or 85 of the total 1,199 families live below the poverty line. Families with 1 or 2 children have the highest poverty rate of 8.6%, comprising of 30 families. On the other hand, families with no children have the lowest poverty rate of 6.5%, which includes 55 families.
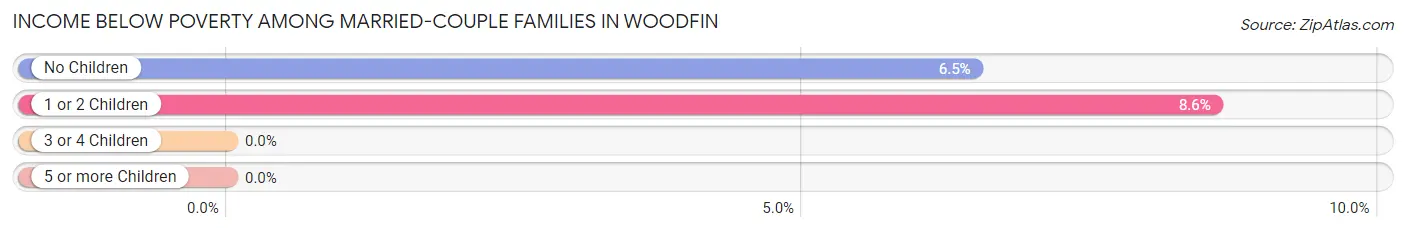
| Children | Above Poverty | Below Poverty |
| No Children | 794 (93.5%) | 55 (6.5%) |
| 1 or 2 Children | 320 (91.4%) | 30 (8.6%) |
| 3 or 4 Children | 0 (0.0%) | 0 (0.0%) |
| 5 or more Children | 0 (0.0%) | 0 (0.0%) |
| Total | 1,114 (92.9%) | 85 (7.1%) |
Income Below Poverty Among Single-Parent Households in Woodfin
According to the poverty data in Woodfin, 6.6% or 6 single-father households and 12.0% or 42 single-mother households are living below the poverty line. Among single-father households, those with 1 or 2 children have the highest poverty rate, with 6 households (50.0%) experiencing poverty. Likewise, among single-mother households, those with 3 or 4 children have the highest poverty rate, with 26 households (57.8%) falling below the poverty line.
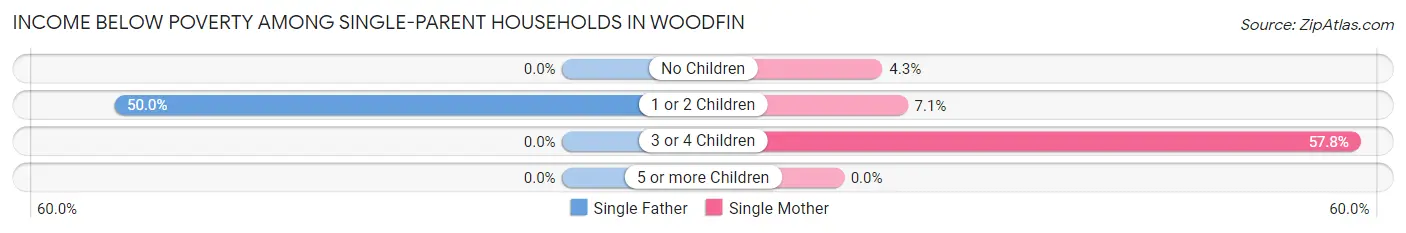
| Children | Single Father | Single Mother |
| No Children | 0 (0.0%) | 9 (4.3%) |
| 1 or 2 Children | 6 (50.0%) | 7 (7.1%) |
| 3 or 4 Children | 0 (0.0%) | 26 (57.8%) |
| 5 or more Children | 0 (0.0%) | 0 (0.0%) |
| Total | 6 (6.6%) | 42 (12.0%) |
Income Below Poverty Among Married-Couple vs Single-Parent Households in Woodfin
The poverty data for Woodfin shows that 85 of the married-couple family households (7.1%) and 48 of the single-parent households (10.9%) are living below the poverty level. Within the married-couple family households, those with 1 or 2 children have the highest poverty rate, with 30 households (8.6%) falling below the poverty line. Among the single-parent households, those with 3 or 4 children have the highest poverty rate, with 26 household (57.8%) living below poverty.
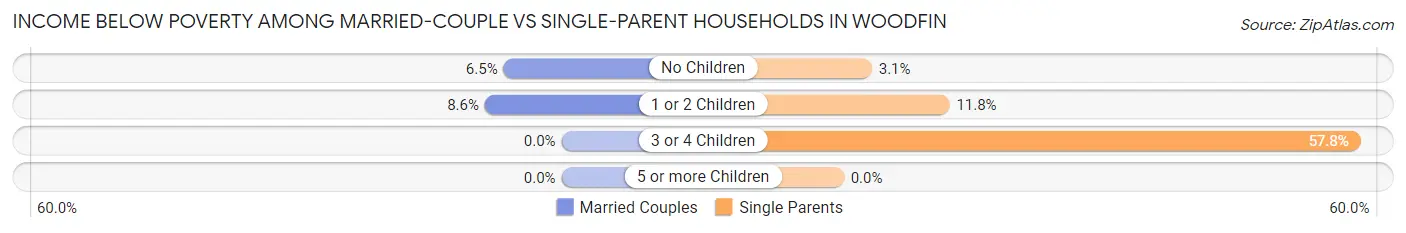
| Children | Married-Couple Families | Single-Parent Households |
| No Children | 55 (6.5%) | 9 (3.1%) |
| 1 or 2 Children | 30 (8.6%) | 13 (11.8%) |
| 3 or 4 Children | 0 (0.0%) | 26 (57.8%) |
| 5 or more Children | 0 (0.0%) | 0 (0.0%) |
| Total | 85 (7.1%) | 48 (10.9%) |
Race in Woodfin
The most populous races in Woodfin are White / Caucasian (6,898 | 87.3%), Hispanic or Latino (711 | 9.0%), and Two or more Races (422 | 5.3%).
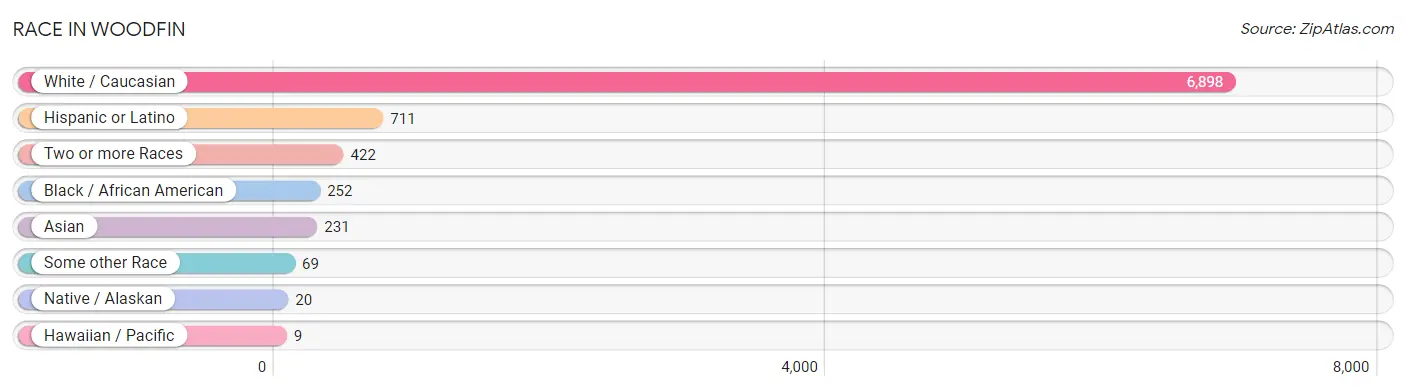
| Race | # Population | % Population |
| Asian | 231 | 2.9% |
| Black / African American | 252 | 3.2% |
| Hawaiian / Pacific | 9 | 0.1% |
| Hispanic or Latino | 711 | 9.0% |
| Native / Alaskan | 20 | 0.3% |
| White / Caucasian | 6,898 | 87.3% |
| Two or more Races | 422 | 5.3% |
| Some other Race | 69 | 0.9% |
| Total | 7,901 | 100.0% |
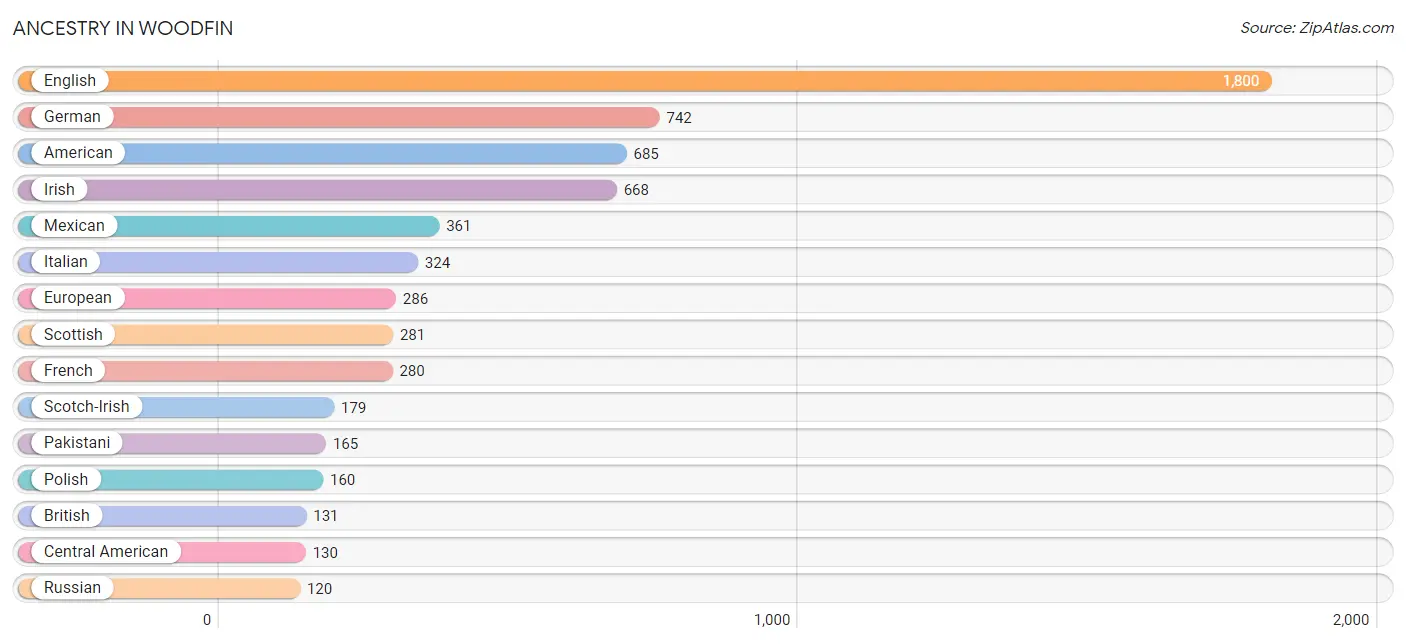
Ancestry in Woodfin
The most populous ancestries reported in Woodfin are English (1,800 | 22.8%), German (742 | 9.4%), American (685 | 8.7%), Irish (668 | 8.5%), and Mexican (361 | 4.6%), together accounting for 53.9% of all Woodfin residents.
| Ancestry | # Population | % Population |
| American | 685 | 8.7% |
| Arab | 2 | 0.0% |
| Austrian | 2 | 0.0% |
| Bhutanese | 61 | 0.8% |
| Blackfeet | 8 | 0.1% |
| British | 131 | 1.7% |
| Canadian | 10 | 0.1% |
| Celtic | 7 | 0.1% |
| Central American | 130 | 1.7% |
| Cherokee | 13 | 0.2% |
| Colombian | 45 | 0.6% |
| Czech | 39 | 0.5% |
| Dominican | 40 | 0.5% |
| Dutch | 30 | 0.4% |
| Eastern European | 24 | 0.3% |
| English | 1,800 | 22.8% |
| European | 286 | 3.6% |
| French | 280 | 3.5% |
| French Canadian | 18 | 0.2% |
| German | 742 | 9.4% |
| Greek | 76 | 1.0% |
| Guatemalan | 104 | 1.3% |
| Iranian | 58 | 0.7% |
| Irish | 668 | 8.5% |
| Italian | 324 | 4.1% |
| Korean | 9 | 0.1% |
| Lithuanian | 6 | 0.1% |
| Mexican | 361 | 4.6% |
| Mexican American Indian | 2 | 0.0% |
| Northern European | 15 | 0.2% |
| Norwegian | 68 | 0.9% |
| Pakistani | 165 | 2.1% |
| Panamanian | 6 | 0.1% |
| Polish | 160 | 2.0% |
| Russian | 120 | 1.5% |
| Salvadoran | 20 | 0.3% |
| Scandinavian | 4 | 0.1% |
| Scotch-Irish | 179 | 2.3% |
| Scottish | 281 | 3.6% |
| South American | 74 | 0.9% |
| Spaniard | 6 | 0.1% |
| Swedish | 77 | 1.0% |
| Swiss | 18 | 0.2% |
| Thai | 25 | 0.3% |
| Uruguayan | 29 | 0.4% |
| Welsh | 94 | 1.2% |
| Yaqui | 2 | 0.0% | View All 47 Rows |
Immigrants in Woodfin
The most numerous immigrant groups reported in Woodfin came from Latin America (348 | 4.4%), Central America (267 | 3.4%), Mexico (184 | 2.3%), Europe (167 | 2.1%), and Asia (138 | 1.8%), together accounting for 14.0% of all Woodfin residents.
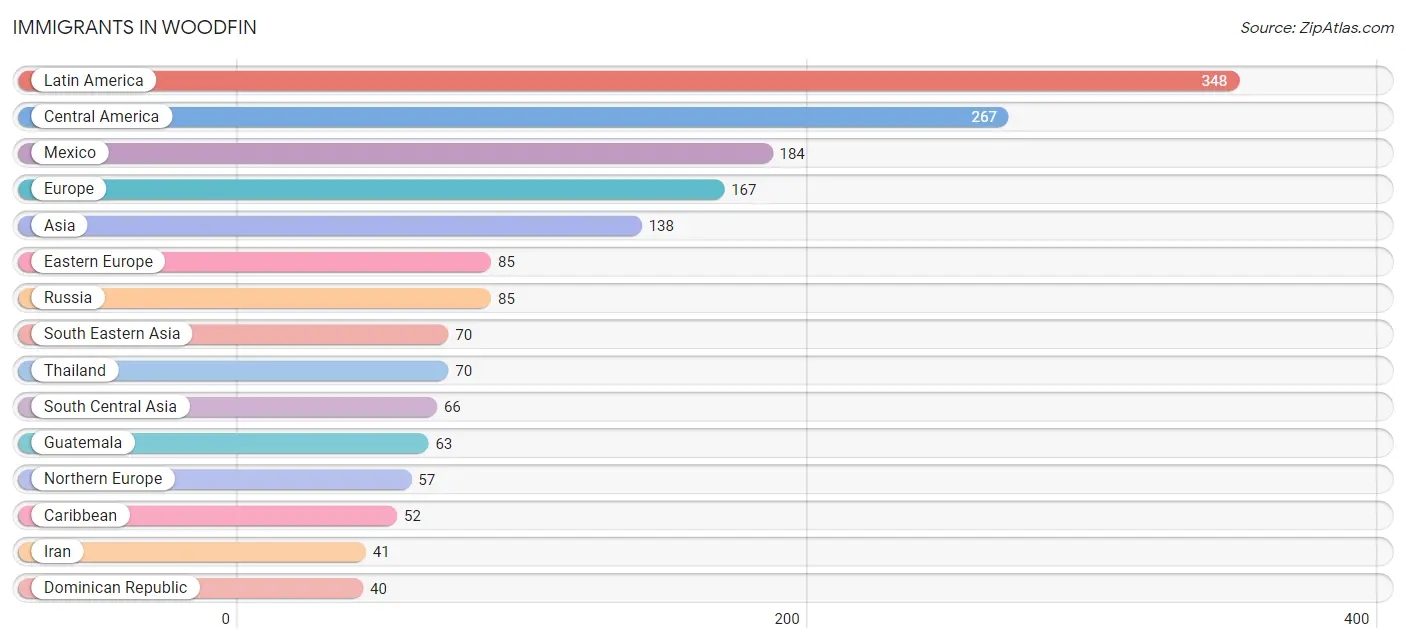
| Immigration Origin | # Population | % Population |
| Africa | 22 | 0.3% |
| Asia | 138 | 1.8% |
| Canada | 10 | 0.1% |
| Caribbean | 52 | 0.7% |
| Central America | 267 | 3.4% |
| Dominican Republic | 40 | 0.5% |
| Eastern Africa | 22 | 0.3% |
| Eastern Europe | 85 | 1.1% |
| El Salvador | 20 | 0.3% |
| Europe | 167 | 2.1% |
| Germany | 25 | 0.3% |
| Guatemala | 63 | 0.8% |
| Haiti | 12 | 0.2% |
| India | 25 | 0.3% |
| Iran | 41 | 0.5% |
| Ireland | 39 | 0.5% |
| Latin America | 348 | 4.4% |
| Mexico | 184 | 2.3% |
| Northern Europe | 57 | 0.7% |
| Norway | 7 | 0.1% |
| Oceania | 15 | 0.2% |
| Russia | 85 | 1.1% |
| South America | 29 | 0.4% |
| South Central Asia | 66 | 0.8% |
| South Eastern Asia | 70 | 0.9% |
| Thailand | 70 | 0.9% |
| Uruguay | 29 | 0.4% |
| Western Asia | 2 | 0.0% |
| Western Europe | 25 | 0.3% |
| Zimbabwe | 22 | 0.3% | View All 30 Rows |
Sex and Age in Woodfin
Sex and Age in Woodfin
The most populous age groups in Woodfin are 25 to 29 Years (480 | 11.3%) for men and 30 to 34 Years (378 | 10.4%) for women.
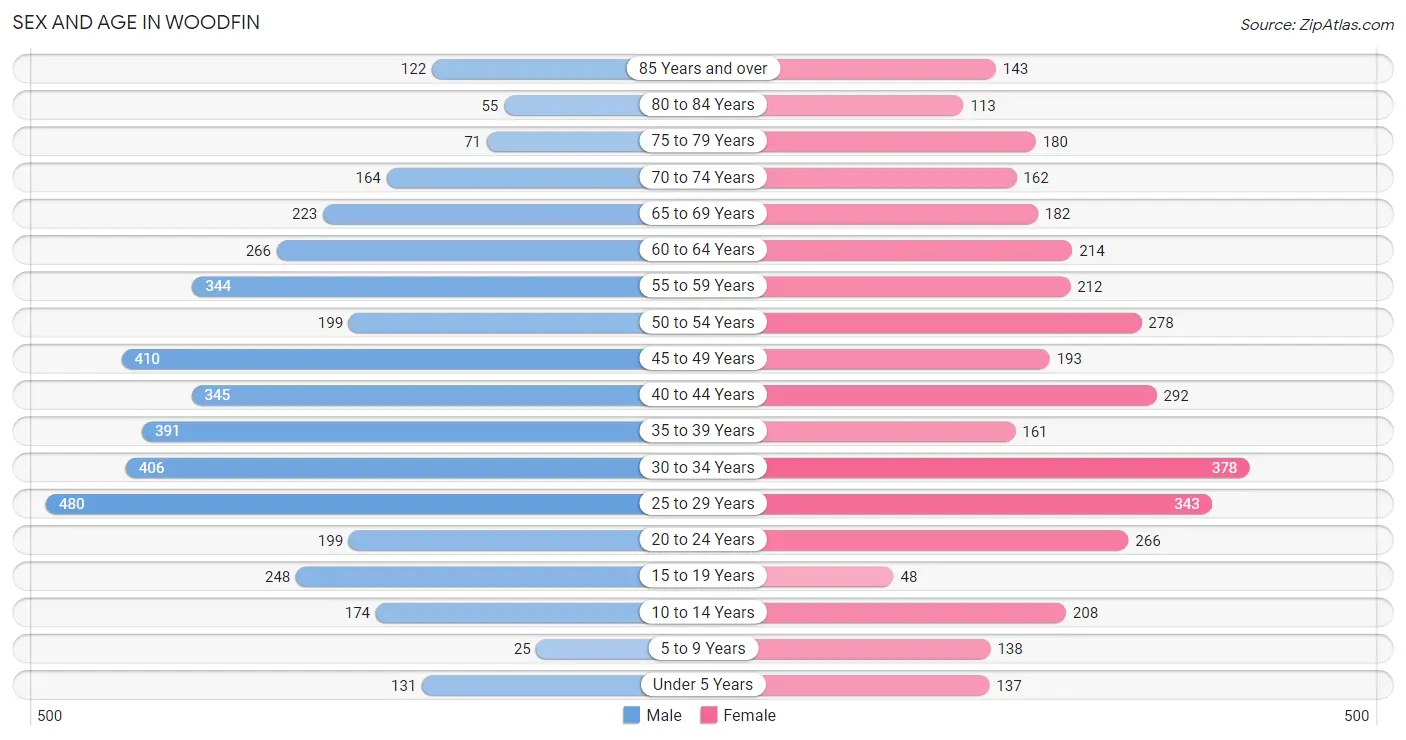
| Age Bracket | Male | Female |
| Under 5 Years | 131 (3.1%) | 137 (3.8%) |
| 5 to 9 Years | 25 (0.6%) | 138 (3.8%) |
| 10 to 14 Years | 174 (4.1%) | 208 (5.7%) |
| 15 to 19 Years | 248 (5.8%) | 48 (1.3%) |
| 20 to 24 Years | 199 (4.7%) | 266 (7.3%) |
| 25 to 29 Years | 480 (11.3%) | 343 (9.4%) |
| 30 to 34 Years | 406 (9.6%) | 378 (10.4%) |
| 35 to 39 Years | 391 (9.2%) | 161 (4.4%) |
| 40 to 44 Years | 345 (8.1%) | 292 (8.0%) |
| 45 to 49 Years | 410 (9.6%) | 193 (5.3%) |
| 50 to 54 Years | 199 (4.7%) | 278 (7.6%) |
| 55 to 59 Years | 344 (8.1%) | 212 (5.8%) |
| 60 to 64 Years | 266 (6.2%) | 214 (5.9%) |
| 65 to 69 Years | 223 (5.2%) | 182 (5.0%) |
| 70 to 74 Years | 164 (3.9%) | 162 (4.4%) |
| 75 to 79 Years | 71 (1.7%) | 180 (4.9%) |
| 80 to 84 Years | 55 (1.3%) | 113 (3.1%) |
| 85 Years and over | 122 (2.9%) | 143 (3.9%) |
| Total | 4,253 (100.0%) | 3,648 (100.0%) |
Families and Households in Woodfin
Median Family Size in Woodfin
The median family size in Woodfin is 2.95 persons per family, with single female/mother families (351 | 21.4%) accounting for the largest median family size of 3.53 persons per family. On the other hand, married-couple families (1,199 | 73.1%) represent the smallest median family size with 2.75 persons per family.
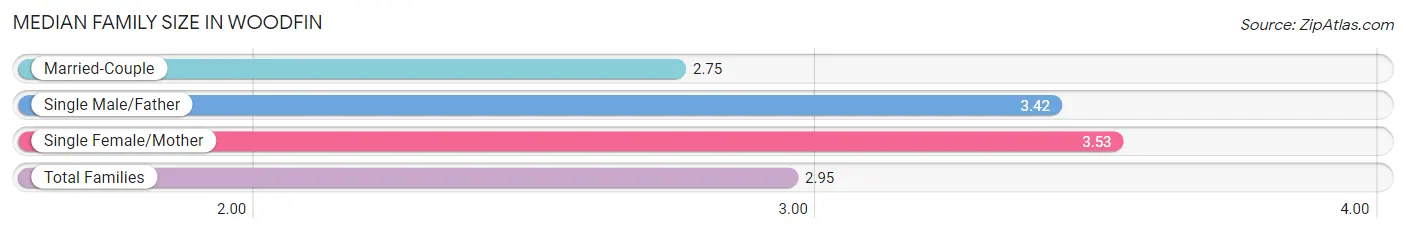
| Family Type | # Families | Family Size |
| Married-Couple | 1,199 (73.1%) | 2.75 |
| Single Male/Father | 91 (5.6%) | 3.42 |
| Single Female/Mother | 351 (21.4%) | 3.53 |
| Total Families | 1,641 (100.0%) | 2.95 |
Median Household Size in Woodfin
The median household size in Woodfin is 2.44 persons per household, with single male/father households (91 | 3.1%) accounting for the largest median household size of 4.09 persons per household. non-family households (1,317 | 44.5%) represent the smallest median household size with 1.67 persons per household.
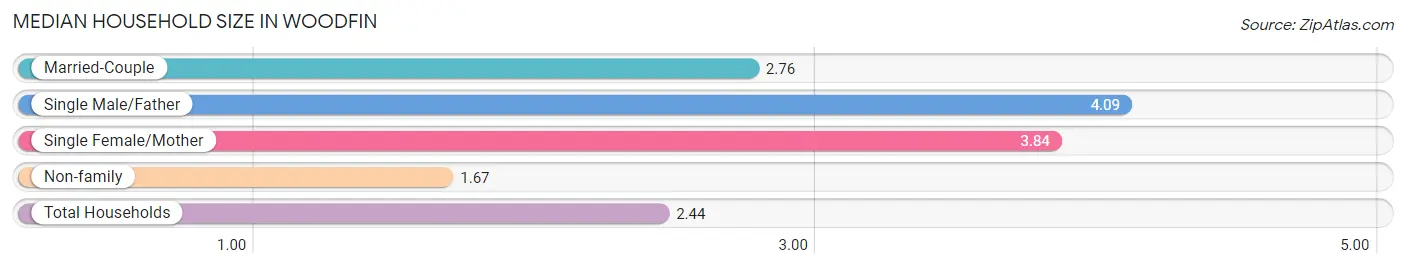
| Household Type | # Households | Household Size |
| Married-Couple | 1,199 (40.5%) | 2.76 |
| Single Male/Father | 91 (3.1%) | 4.09 |
| Single Female/Mother | 351 (11.9%) | 3.84 |
| Non-family | 1,317 (44.5%) | 1.67 |
| Total Households | 2,958 (100.0%) | 2.44 |
Household Size by Marriage Status in Woodfin
Out of a total of 2,958 households in Woodfin, 1,641 (55.5%) are family households, while 1,317 (44.5%) are nonfamily households. The most numerous type of family households are 2-person households, comprising 1,012, and the most common type of nonfamily households are 1-person households, comprising 838.
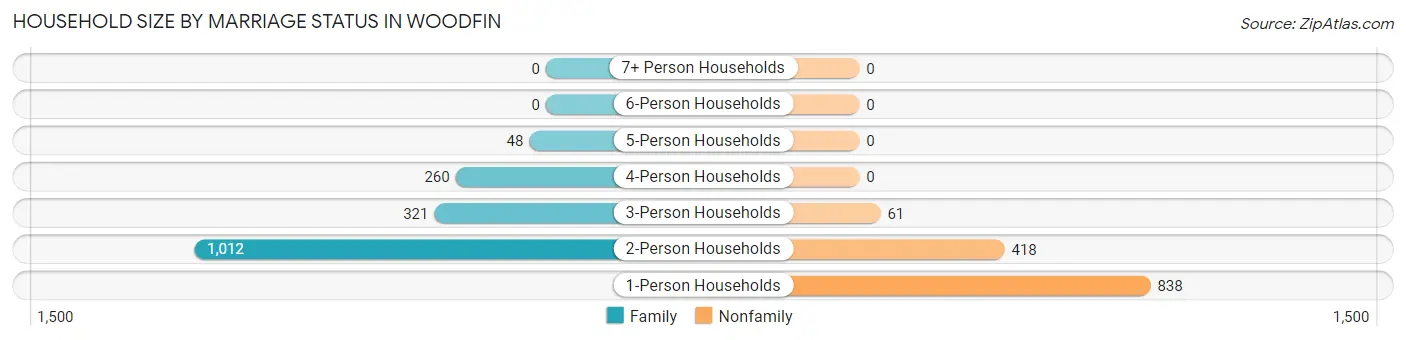
| Household Size | Family Households | Nonfamily Households |
| 1-Person Households | - | 838 (28.3%) |
| 2-Person Households | 1,012 (34.2%) | 418 (14.1%) |
| 3-Person Households | 321 (10.8%) | 61 (2.1%) |
| 4-Person Households | 260 (8.8%) | 0 (0.0%) |
| 5-Person Households | 48 (1.6%) | 0 (0.0%) |
| 6-Person Households | 0 (0.0%) | 0 (0.0%) |
| 7+ Person Households | 0 (0.0%) | 0 (0.0%) |
| Total | 1,641 (55.5%) | 1,317 (44.5%) |
Female Fertility in Woodfin
Fertility by Age in Woodfin
Average fertility rate in Woodfin is 30.0 births per 1,000 women. Women in the age bracket of 20 to 34 years have the highest fertility rate with 42.0 births per 1,000 women. Women in the age bracket of 20 to 34 years acount for 78.8% of all women with births.
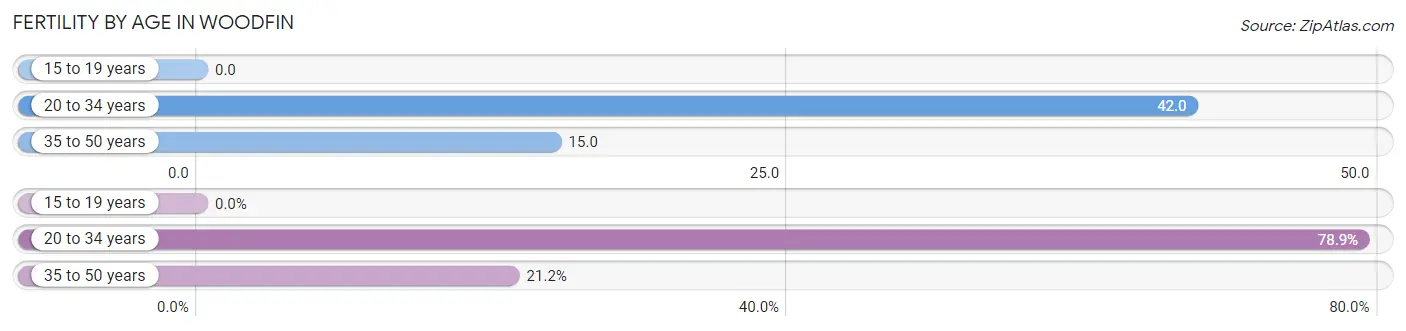
| Age Bracket | Women with Births | Births / 1,000 Women |
| 15 to 19 years | 0 (0.0%) | 0.0 |
| 20 to 34 years | 41 (78.8%) | 42.0 |
| 35 to 50 years | 11 (21.1%) | 15.0 |
| Total | 52 (100.0%) | 30.0 |
Fertility by Age by Marriage Status in Woodfin
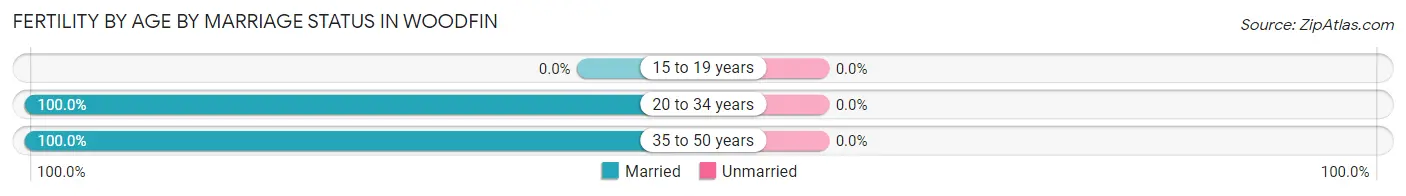
| Age Bracket | Married | Unmarried |
| 15 to 19 years | 0 (0.0%) | 0 (0.0%) |
| 20 to 34 years | 41 (100.0%) | 0 (0.0%) |
| 35 to 50 years | 11 (100.0%) | 0 (0.0%) |
| Total | 52 (100.0%) | 0 (0.0%) |
Fertility by Education in Woodfin
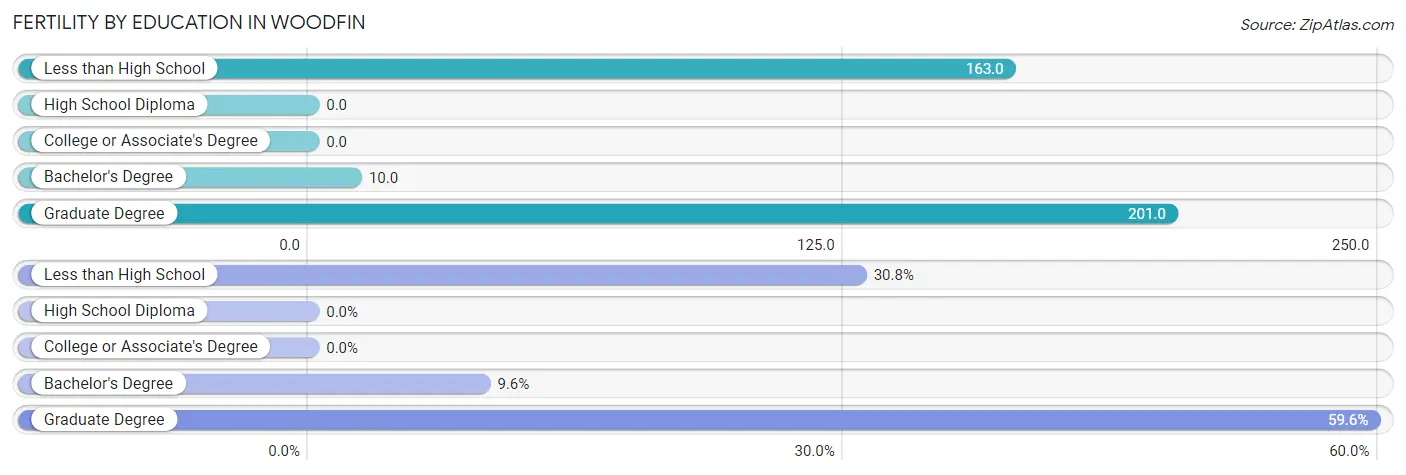
| Educational Attainment | Women with Births | Births / 1,000 Women |
| Less than High School | 16 (30.8%) | 163.0 |
| High School Diploma | 0 (0.0%) | 0.0 |
| College or Associate's Degree | 0 (0.0%) | 0.0 |
| Bachelor's Degree | 5 (9.6%) | 10.0 |
| Graduate Degree | 31 (59.6%) | 201.0 |
| Total | 52 (100.0%) | 30.0 |
Fertility by Education by Marriage Status in Woodfin
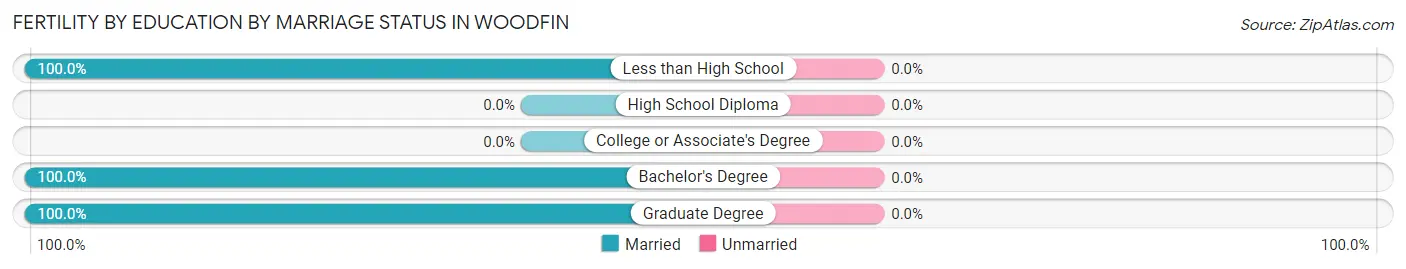
| Educational Attainment | Married | Unmarried |
| Less than High School | 16 (100.0%) | 0 (0.0%) |
| High School Diploma | 0 (0.0%) | 0 (0.0%) |
| College or Associate's Degree | 0 (0.0%) | 0 (0.0%) |
| Bachelor's Degree | 5 (100.0%) | 0 (0.0%) |
| Graduate Degree | 31 (100.0%) | 0 (0.0%) |
| Total | 52 (100.0%) | 0 (0.0%) |
Employment Characteristics in Woodfin
Employment by Class of Employer in Woodfin
Among the 3,829 employed individuals in Woodfin, private company employees (2,669 | 69.7%), self-employed (not incorporated) (296 | 7.7%), and not-for-profit organizations (236 | 6.2%) make up the most common classes of employment.
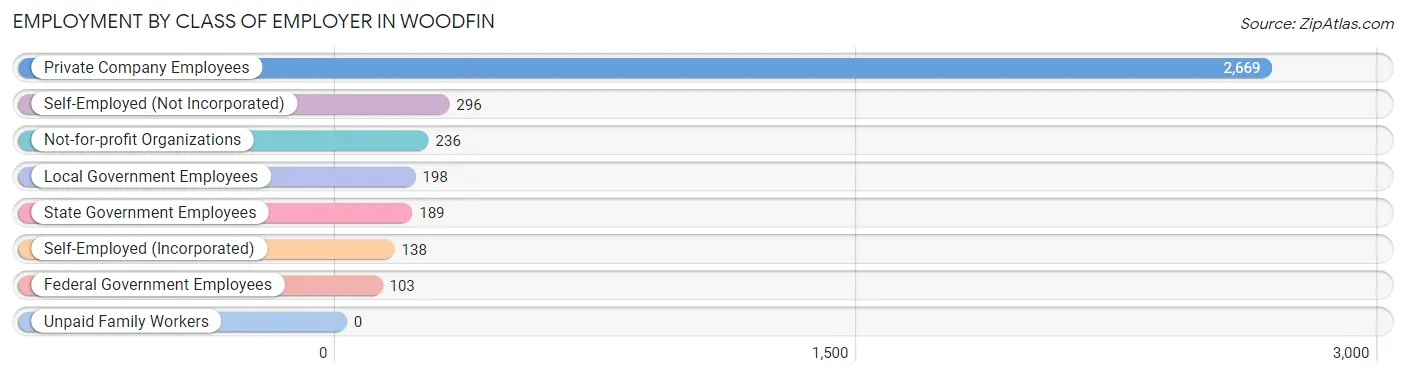
| Employer Class | # Employees | % Employees |
| Private Company Employees | 2,669 | 69.7% |
| Self-Employed (Incorporated) | 138 | 3.6% |
| Self-Employed (Not Incorporated) | 296 | 7.7% |
| Not-for-profit Organizations | 236 | 6.2% |
| Local Government Employees | 198 | 5.2% |
| State Government Employees | 189 | 4.9% |
| Federal Government Employees | 103 | 2.7% |
| Unpaid Family Workers | 0 | 0.0% |
| Total | 3,829 | 100.0% |
Employment Status by Age in Woodfin
According to the labor force statistics for Woodfin, out of the total population over 16 years of age (7,032), 56.0% or 3,938 individuals are in the labor force, with 2.0% or 79 of them unemployed. The age group with the highest labor force participation rate is 30 to 34 years, with 86.4% or 677 individuals in the labor force. Within the labor force, the 25 to 29 years age range has the highest percentage of unemployed individuals, with 6.6% or 42 of them being unemployed.
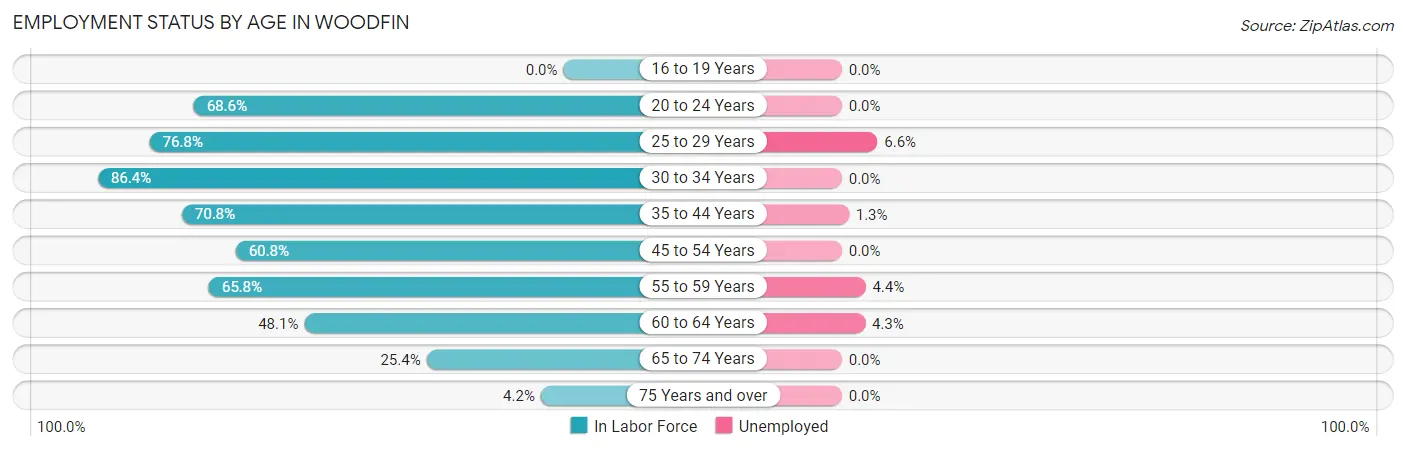
| Age Bracket | In Labor Force | Unemployed |
| 16 to 19 Years | 0 (0.0%) | 0 (0.0%) |
| 20 to 24 Years | 319 (68.6%) | 0 (0.0%) |
| 25 to 29 Years | 632 (76.8%) | 42 (6.6%) |
| 30 to 34 Years | 677 (86.4%) | 0 (0.0%) |
| 35 to 44 Years | 842 (70.8%) | 11 (1.3%) |
| 45 to 54 Years | 657 (60.8%) | 0 (0.0%) |
| 55 to 59 Years | 366 (65.8%) | 16 (4.4%) |
| 60 to 64 Years | 231 (48.1%) | 10 (4.3%) |
| 65 to 74 Years | 186 (25.4%) | 0 (0.0%) |
| 75 Years and over | 29 (4.2%) | 0 (0.0%) |
| Total | 3,938 (56.0%) | 79 (2.0%) |
Employment Status by Educational Attainment in Woodfin
According to labor force statistics for Woodfin, 69.3% of individuals (3,404) out of the total population between 25 and 64 years of age (4,912) are in the labor force, with 2.3% or 78 of them being unemployed. The group with the highest labor force participation rate are those with the educational attainment of bachelor's degree or higher, with 83.4% or 1,537 individuals in the labor force. Within the labor force, individuals with less than high school education have the highest percentage of unemployment, with 10.6% or 33 of them being unemployed.
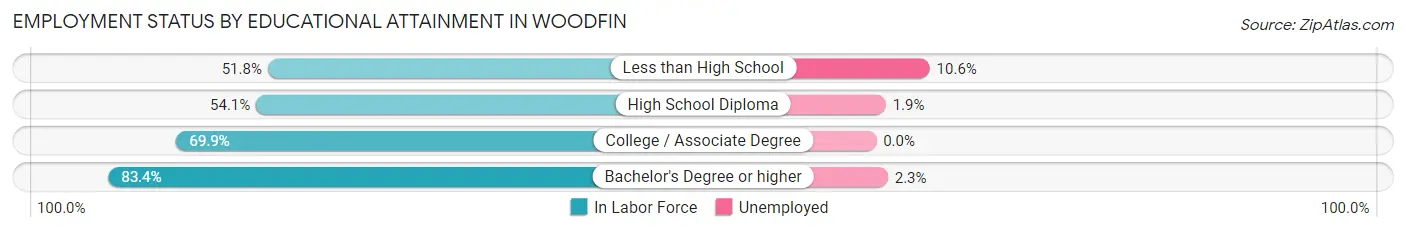
| Educational Attainment | In Labor Force | Unemployed |
| Less than High School | 311 (51.8%) | 64 (10.6%) |
| High School Diploma | 577 (54.1%) | 20 (1.9%) |
| College / Associate Degree | 981 (69.9%) | 0 (0.0%) |
| Bachelor's Degree or higher | 1,537 (83.4%) | 42 (2.3%) |
| Total | 3,404 (69.3%) | 113 (2.3%) |
Employment Occupations by Sex in Woodfin
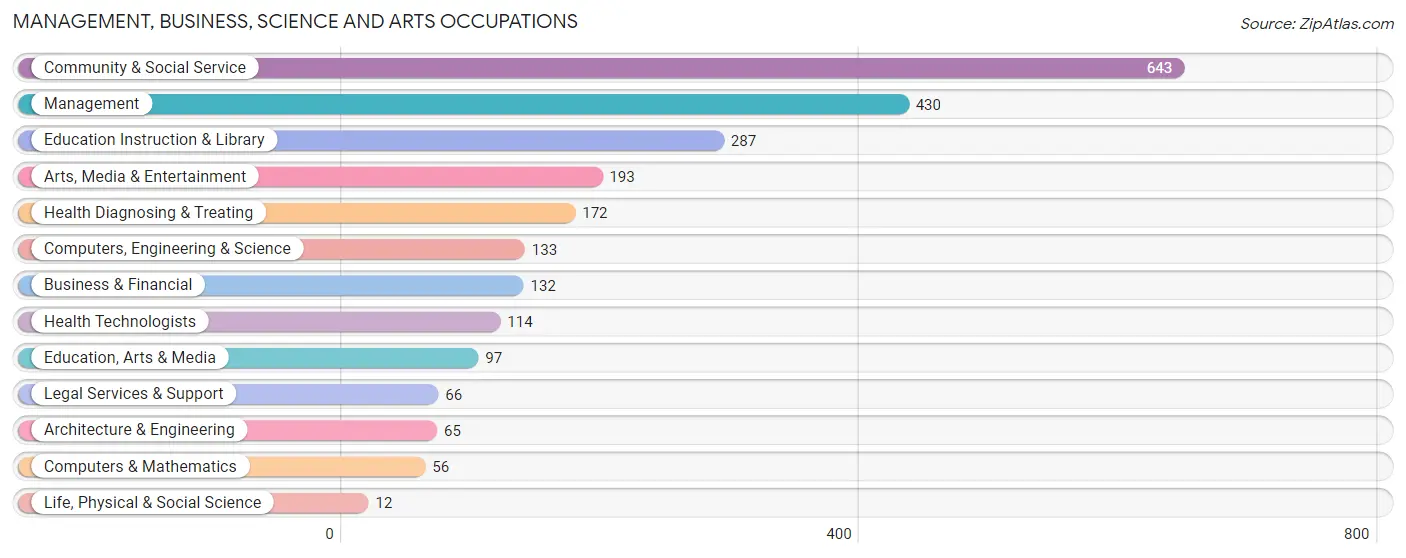
Management, Business, Science and Arts Occupations
The most common Management, Business, Science and Arts occupations in Woodfin are Community & Social Service (643 | 16.7%), Management (430 | 11.1%), Education Instruction & Library (287 | 7.4%), Arts, Media & Entertainment (193 | 5.0%), and Health Diagnosing & Treating (172 | 4.5%).
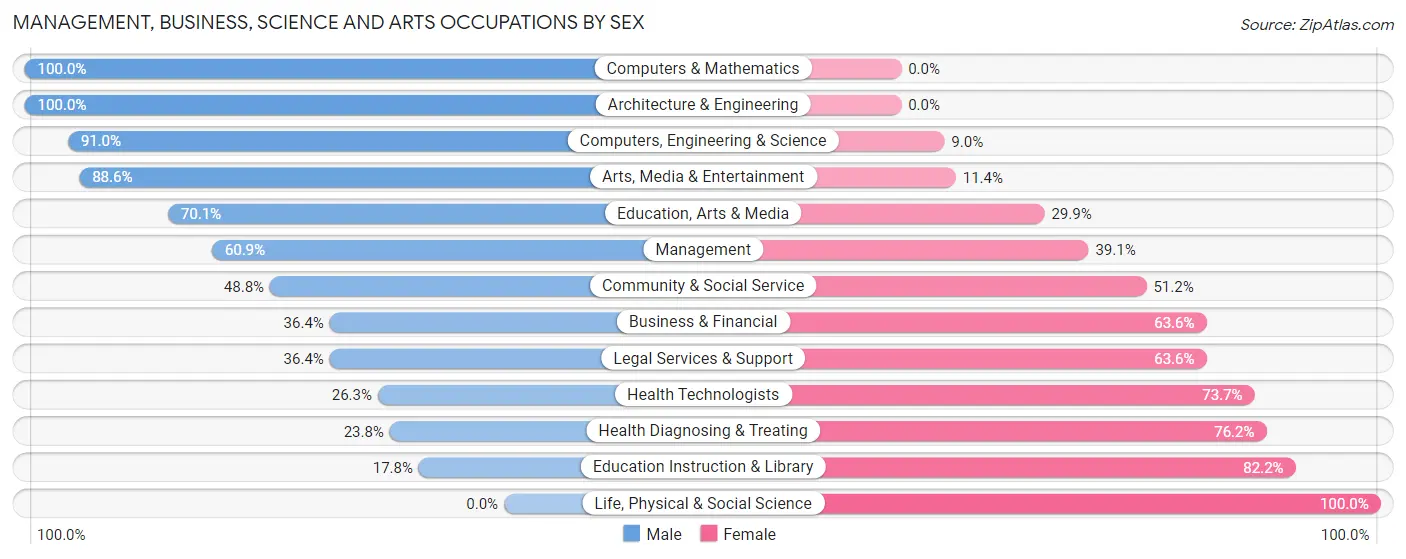
Management, Business, Science and Arts Occupations by Sex
Within the Management, Business, Science and Arts occupations in Woodfin, the most male-oriented occupations are Computers & Mathematics (100.0%), Architecture & Engineering (100.0%), and Computers, Engineering & Science (91.0%), while the most female-oriented occupations are Life, Physical & Social Science (100.0%), Education Instruction & Library (82.2%), and Health Diagnosing & Treating (76.2%).
| Occupation | Male | Female |
| Management | 262 (60.9%) | 168 (39.1%) |
| Business & Financial | 48 (36.4%) | 84 (63.6%) |
| Computers, Engineering & Science | 121 (91.0%) | 12 (9.0%) |
| Computers & Mathematics | 56 (100.0%) | 0 (0.0%) |
| Architecture & Engineering | 65 (100.0%) | 0 (0.0%) |
| Life, Physical & Social Science | 0 (0.0%) | 12 (100.0%) |
| Community & Social Service | 314 (48.8%) | 329 (51.2%) |
| Education, Arts & Media | 68 (70.1%) | 29 (29.9%) |
| Legal Services & Support | 24 (36.4%) | 42 (63.6%) |
| Education Instruction & Library | 51 (17.8%) | 236 (82.2%) |
| Arts, Media & Entertainment | 171 (88.6%) | 22 (11.4%) |
| Health Diagnosing & Treating | 41 (23.8%) | 131 (76.2%) |
| Health Technologists | 30 (26.3%) | 84 (73.7%) |
| Total (Category) | 786 (52.0%) | 724 (47.9%) |
| Total (Overall) | 2,163 (56.0%) | 1,697 (44.0%) |
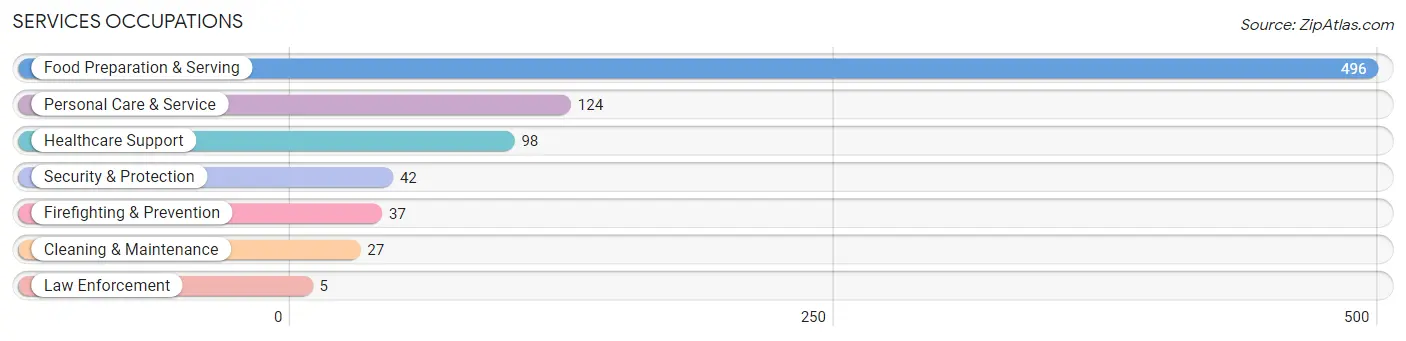
Services Occupations
The most common Services occupations in Woodfin are Food Preparation & Serving (496 | 12.9%), Personal Care & Service (124 | 3.2%), Healthcare Support (98 | 2.5%), Security & Protection (42 | 1.1%), and Firefighting & Prevention (37 | 1.0%).
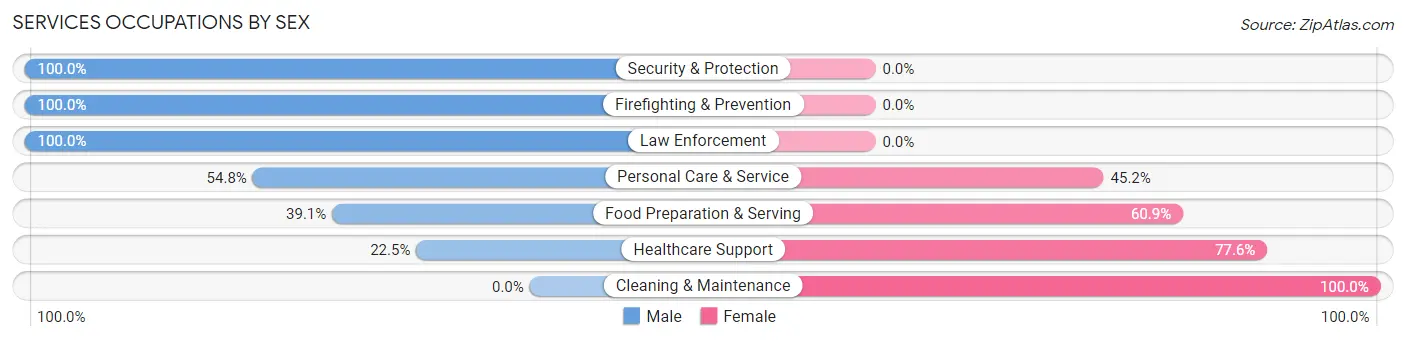
Services Occupations by Sex
Within the Services occupations in Woodfin, the most male-oriented occupations are Security & Protection (100.0%), Firefighting & Prevention (100.0%), and Law Enforcement (100.0%), while the most female-oriented occupations are Cleaning & Maintenance (100.0%), Healthcare Support (77.5%), and Food Preparation & Serving (60.9%).
| Occupation | Male | Female |
| Healthcare Support | 22 (22.5%) | 76 (77.5%) |
| Security & Protection | 42 (100.0%) | 0 (0.0%) |
| Firefighting & Prevention | 37 (100.0%) | 0 (0.0%) |
| Law Enforcement | 5 (100.0%) | 0 (0.0%) |
| Food Preparation & Serving | 194 (39.1%) | 302 (60.9%) |
| Cleaning & Maintenance | 0 (0.0%) | 27 (100.0%) |
| Personal Care & Service | 68 (54.8%) | 56 (45.2%) |
| Total (Category) | 326 (41.4%) | 461 (58.6%) |
| Total (Overall) | 2,163 (56.0%) | 1,697 (44.0%) |
Sales and Office Occupations
The most common Sales and Office occupations in Woodfin are Sales & Related (306 | 7.9%), and Office & Administration (300 | 7.8%).
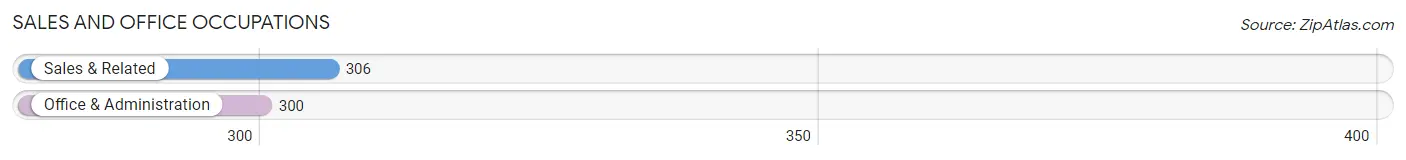
Sales and Office Occupations by Sex
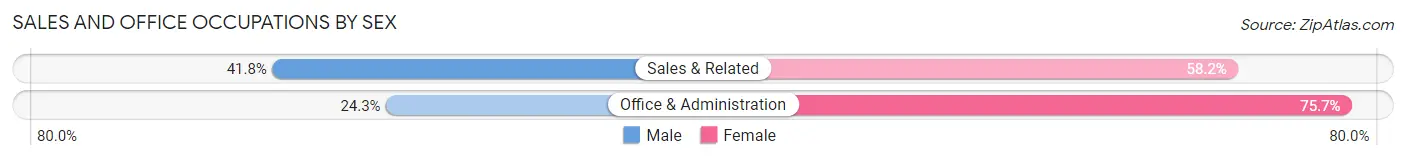
| Occupation | Male | Female |
| Sales & Related | 128 (41.8%) | 178 (58.2%) |
| Office & Administration | 73 (24.3%) | 227 (75.7%) |
| Total (Category) | 201 (33.2%) | 405 (66.8%) |
| Total (Overall) | 2,163 (56.0%) | 1,697 (44.0%) |
Natural Resources, Construction and Maintenance Occupations
The most common Natural Resources, Construction and Maintenance occupations in Woodfin are Construction & Extraction (251 | 6.5%), Installation, Maintenance & Repair (93 | 2.4%), and Farming, Fishing & Forestry (54 | 1.4%).
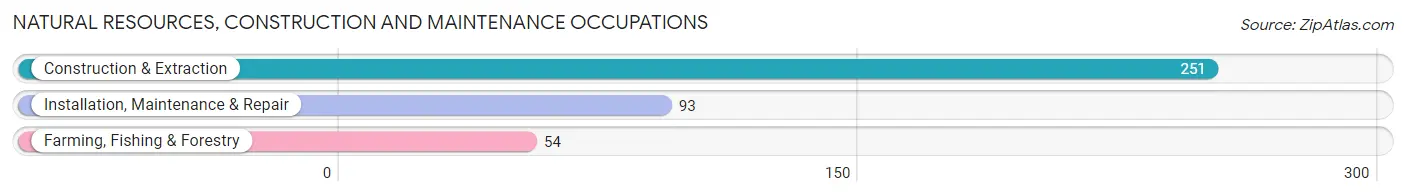
Natural Resources, Construction and Maintenance Occupations by Sex
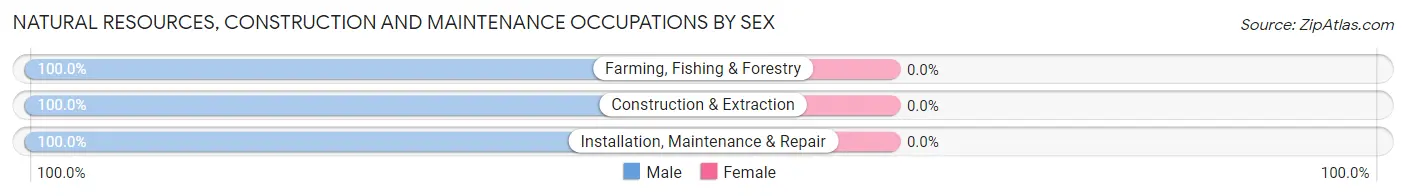
| Occupation | Male | Female |
| Farming, Fishing & Forestry | 54 (100.0%) | 0 (0.0%) |
| Construction & Extraction | 251 (100.0%) | 0 (0.0%) |
| Installation, Maintenance & Repair | 93 (100.0%) | 0 (0.0%) |
| Total (Category) | 398 (100.0%) | 0 (0.0%) |
| Total (Overall) | 2,163 (56.0%) | 1,697 (44.0%) |
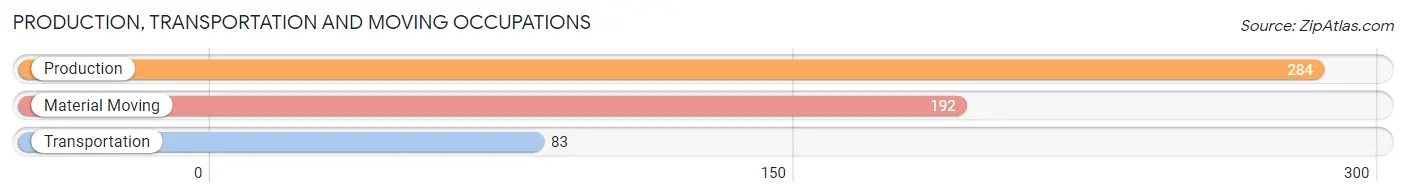
Production, Transportation and Moving Occupations
The most common Production, Transportation and Moving occupations in Woodfin are Production (284 | 7.4%), Material Moving (192 | 5.0%), and Transportation (83 | 2.1%).
Production, Transportation and Moving Occupations by Sex
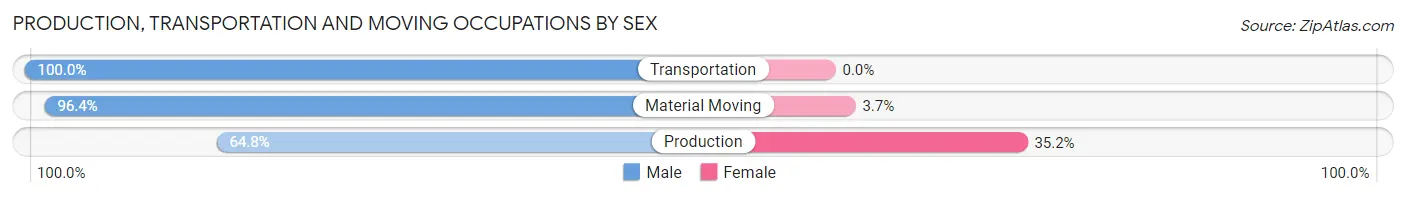
| Occupation | Male | Female |
| Production | 184 (64.8%) | 100 (35.2%) |
| Transportation | 83 (100.0%) | 0 (0.0%) |
| Material Moving | 185 (96.4%) | 7 (3.6%) |
| Total (Category) | 452 (80.9%) | 107 (19.1%) |
| Total (Overall) | 2,163 (56.0%) | 1,697 (44.0%) |
Employment Industries by Sex in Woodfin
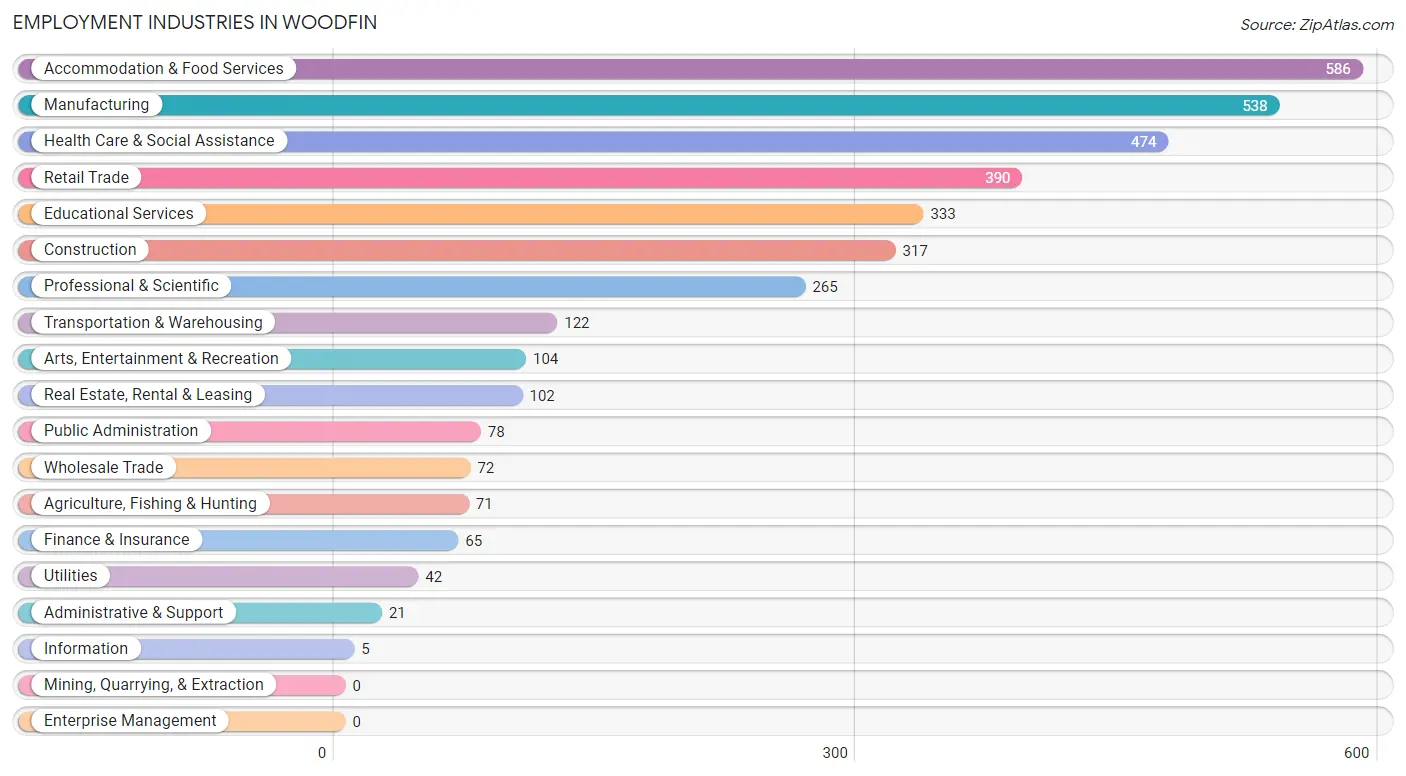
Employment Industries in Woodfin
The major employment industries in Woodfin include Accommodation & Food Services (586 | 15.2%), Manufacturing (538 | 13.9%), Health Care & Social Assistance (474 | 12.3%), Retail Trade (390 | 10.1%), and Educational Services (333 | 8.6%).
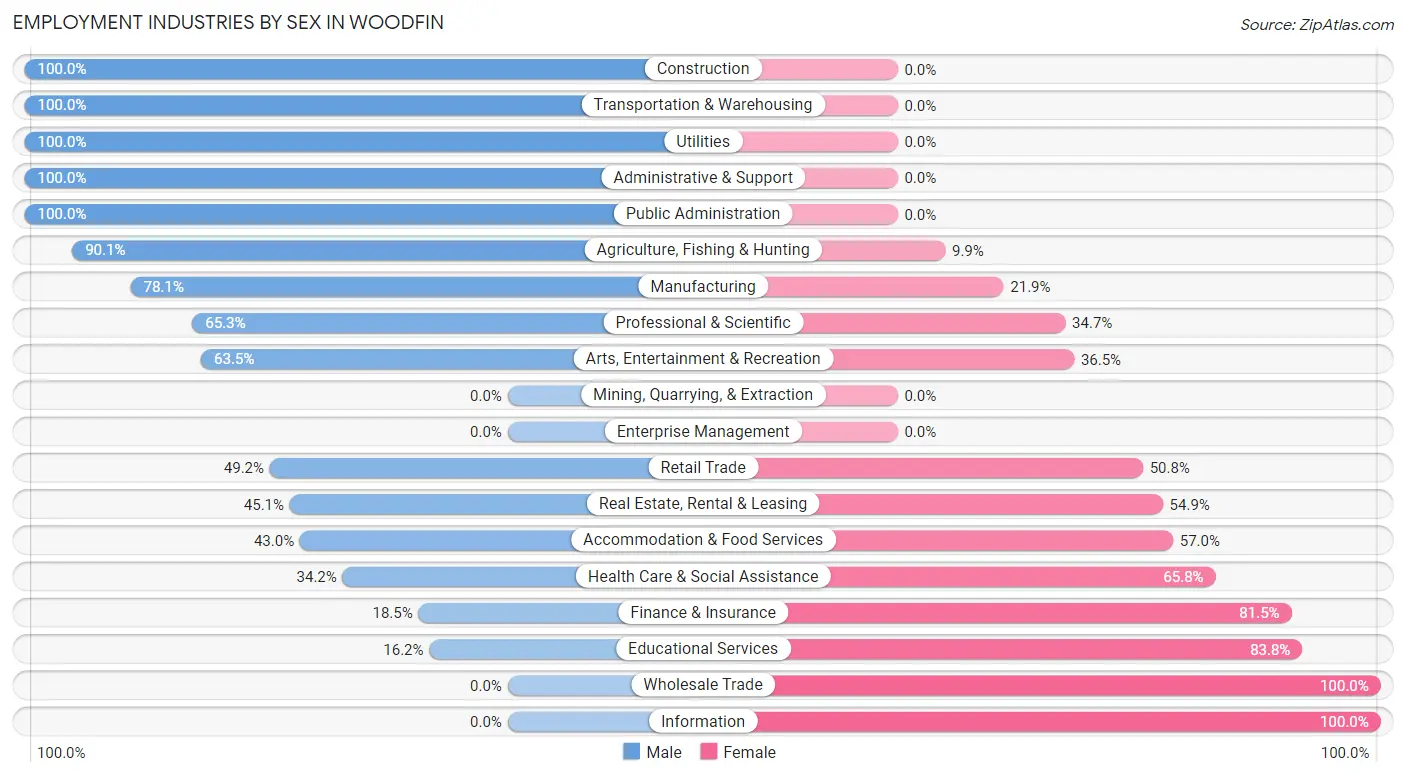
Employment Industries by Sex in Woodfin
The Woodfin industries that see more men than women are Construction (100.0%), Transportation & Warehousing (100.0%), and Utilities (100.0%), whereas the industries that tend to have a higher number of women are Wholesale Trade (100.0%), Information (100.0%), and Educational Services (83.8%).
| Industry | Male | Female |
| Agriculture, Fishing & Hunting | 64 (90.1%) | 7 (9.9%) |
| Mining, Quarrying, & Extraction | 0 (0.0%) | 0 (0.0%) |
| Construction | 317 (100.0%) | 0 (0.0%) |
| Manufacturing | 420 (78.1%) | 118 (21.9%) |
| Wholesale Trade | 0 (0.0%) | 72 (100.0%) |
| Retail Trade | 192 (49.2%) | 198 (50.8%) |
| Transportation & Warehousing | 122 (100.0%) | 0 (0.0%) |
| Utilities | 42 (100.0%) | 0 (0.0%) |
| Information | 0 (0.0%) | 5 (100.0%) |
| Finance & Insurance | 12 (18.5%) | 53 (81.5%) |
| Real Estate, Rental & Leasing | 46 (45.1%) | 56 (54.9%) |
| Professional & Scientific | 173 (65.3%) | 92 (34.7%) |
| Enterprise Management | 0 (0.0%) | 0 (0.0%) |
| Administrative & Support | 21 (100.0%) | 0 (0.0%) |
| Educational Services | 54 (16.2%) | 279 (83.8%) |
| Health Care & Social Assistance | 162 (34.2%) | 312 (65.8%) |
| Arts, Entertainment & Recreation | 66 (63.5%) | 38 (36.5%) |
| Accommodation & Food Services | 252 (43.0%) | 334 (57.0%) |
| Public Administration | 78 (100.0%) | 0 (0.0%) |
| Total | 2,163 (56.0%) | 1,697 (44.0%) |
Education in Woodfin
School Enrollment in Woodfin
The most common levels of schooling among the 1,300 students in Woodfin are middle school (342 | 26.3%), college / undergraduate (304 | 23.4%), and high school (258 | 19.9%).
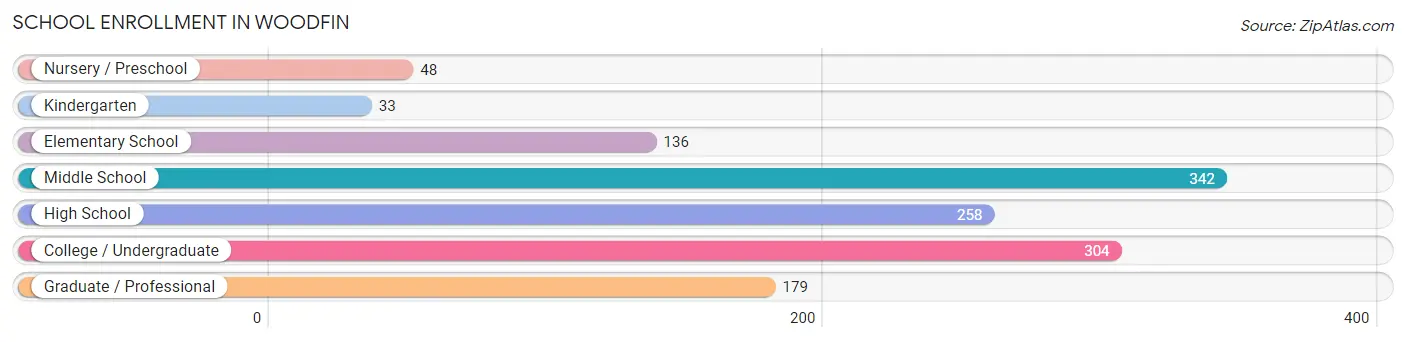
| School Level | # Students | % Students |
| Nursery / Preschool | 48 | 3.7% |
| Kindergarten | 33 | 2.5% |
| Elementary School | 136 | 10.5% |
| Middle School | 342 | 26.3% |
| High School | 258 | 19.9% |
| College / Undergraduate | 304 | 23.4% |
| Graduate / Professional | 179 | 13.8% |
| Total | 1,300 | 100.0% |
School Enrollment by Age by Funding Source in Woodfin
Out of a total of 1,300 students who are enrolled in schools in Woodfin, 270 (20.8%) attend a private institution, while the remaining 1,030 (79.2%) are enrolled in public schools. The age group of 3 to 4 year olds has the highest likelihood of being enrolled in private schools, with 38 (100.0% in the age bracket) enrolled. Conversely, the age group of 18 to 19 year olds has the lowest likelihood of being enrolled in a private school, with 82 (100.0% in the age bracket) attending a public institution.
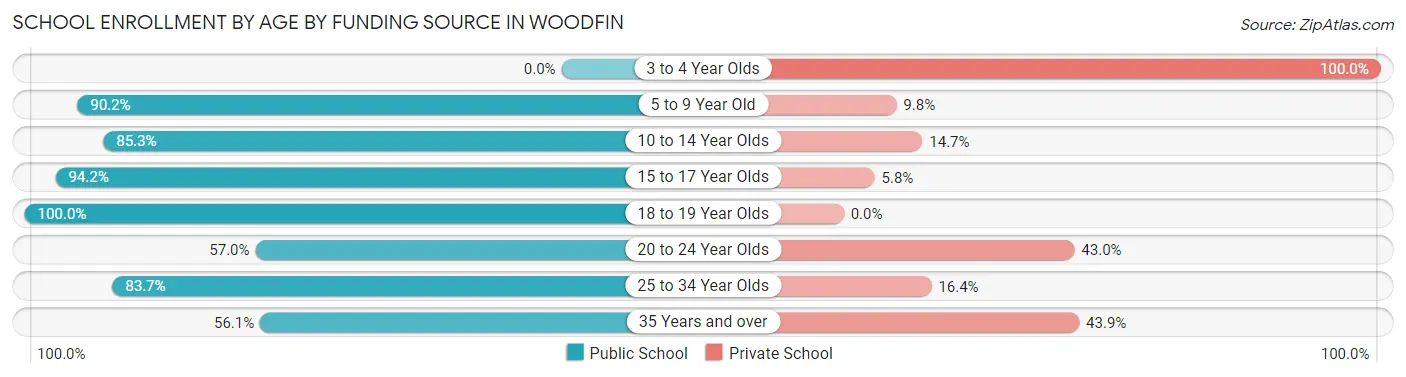
| Age Bracket | Public School | Private School |
| 3 to 4 Year Olds | 0 (0.0%) | 38 (100.0%) |
| 5 to 9 Year Old | 147 (90.2%) | 16 (9.8%) |
| 10 to 14 Year Olds | 326 (85.3%) | 56 (14.7%) |
| 15 to 17 Year Olds | 180 (94.2%) | 11 (5.8%) |
| 18 to 19 Year Olds | 82 (100.0%) | 0 (0.0%) |
| 20 to 24 Year Olds | 130 (57.0%) | 98 (43.0%) |
| 25 to 34 Year Olds | 133 (83.7%) | 26 (16.4%) |
| 35 Years and over | 32 (56.1%) | 25 (43.9%) |
| Total | 1,030 (79.2%) | 270 (20.8%) |
Educational Attainment by Field of Study in Woodfin
Social sciences (333 | 12.1%), visual & performing arts (325 | 11.9%), science & technology (281 | 10.2%), business (278 | 10.1%), and psychology (223 | 8.1%) are the most common fields of study among 2,741 individuals in Woodfin who have obtained a bachelor's degree or higher.
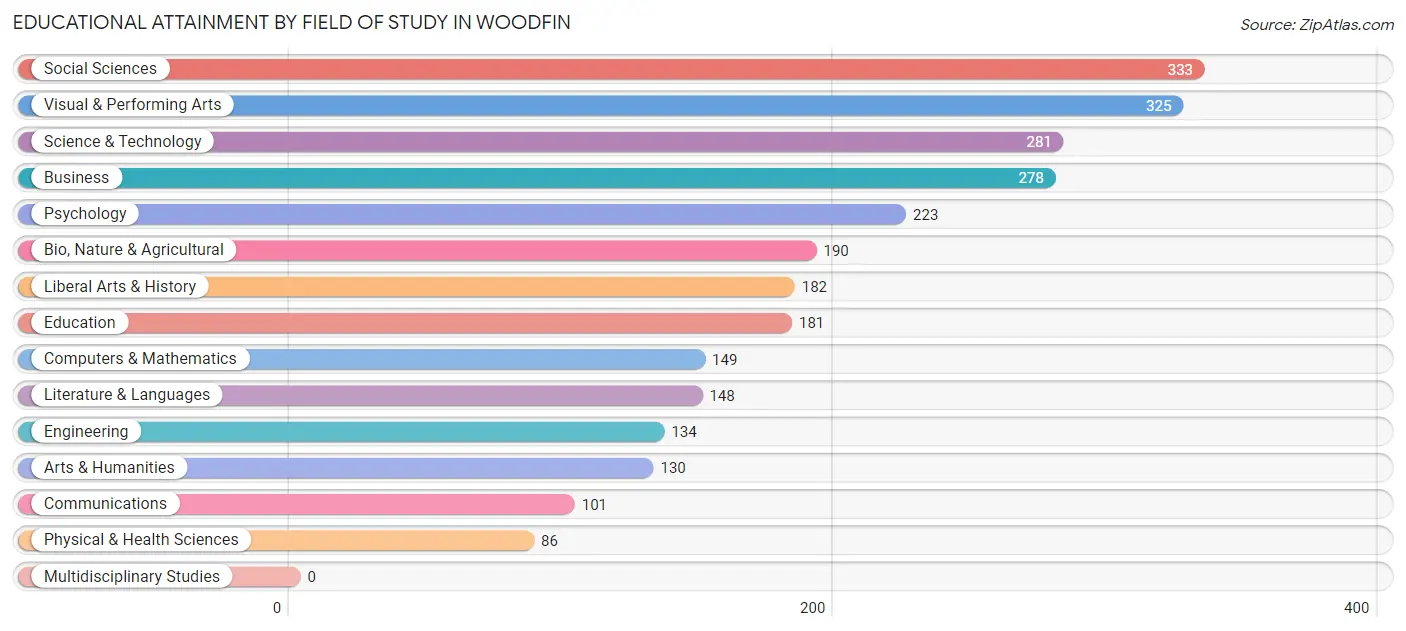
| Field of Study | # Graduates | % Graduates |
| Computers & Mathematics | 149 | 5.4% |
| Bio, Nature & Agricultural | 190 | 6.9% |
| Physical & Health Sciences | 86 | 3.1% |
| Psychology | 223 | 8.1% |
| Social Sciences | 333 | 12.1% |
| Engineering | 134 | 4.9% |
| Multidisciplinary Studies | 0 | 0.0% |
| Science & Technology | 281 | 10.2% |
| Business | 278 | 10.1% |
| Education | 181 | 6.6% |
| Literature & Languages | 148 | 5.4% |
| Liberal Arts & History | 182 | 6.6% |
| Visual & Performing Arts | 325 | 11.9% |
| Communications | 101 | 3.7% |
| Arts & Humanities | 130 | 4.7% |
| Total | 2,741 | 100.0% |
Transportation & Commute in Woodfin
Vehicle Availability by Sex in Woodfin
The most prevalent vehicle ownership categories in Woodfin are males with 2 vehicles (947, accounting for 44.0%) and females with 2 vehicles (892, making up 56.4%).
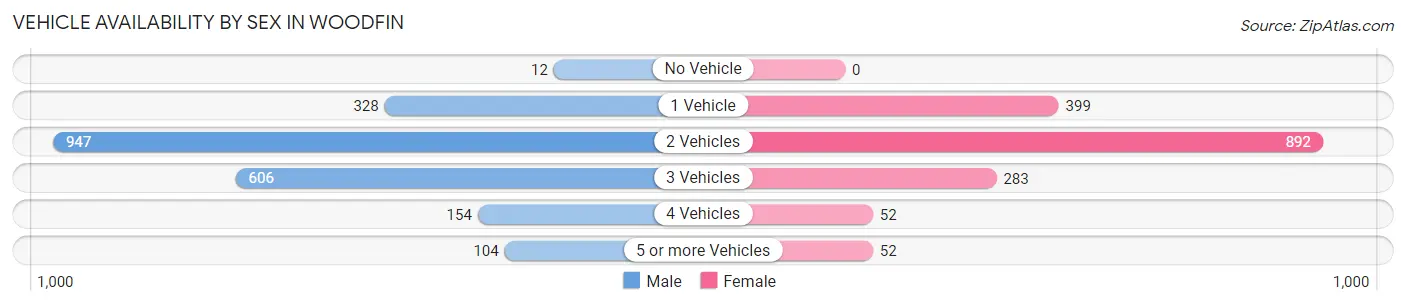
| Vehicles Available | Male | Female |
| No Vehicle | 12 (0.6%) | 0 (0.0%) |
| 1 Vehicle | 328 (15.2%) | 399 (23.8%) |
| 2 Vehicles | 947 (44.0%) | 892 (53.2%) |
| 3 Vehicles | 606 (28.2%) | 283 (16.9%) |
| 4 Vehicles | 154 (7.2%) | 52 (3.1%) |
| 5 or more Vehicles | 104 (4.8%) | 52 (3.1%) |
| Total | 2,151 (100.0%) | 1,678 (100.0%) |
Commute Time in Woodfin
The most frequently occuring commute durations in Woodfin are 15 to 19 minutes (828 commuters, 27.1%), 20 to 24 minutes (697 commuters, 22.8%), and 10 to 14 minutes (453 commuters, 14.8%).
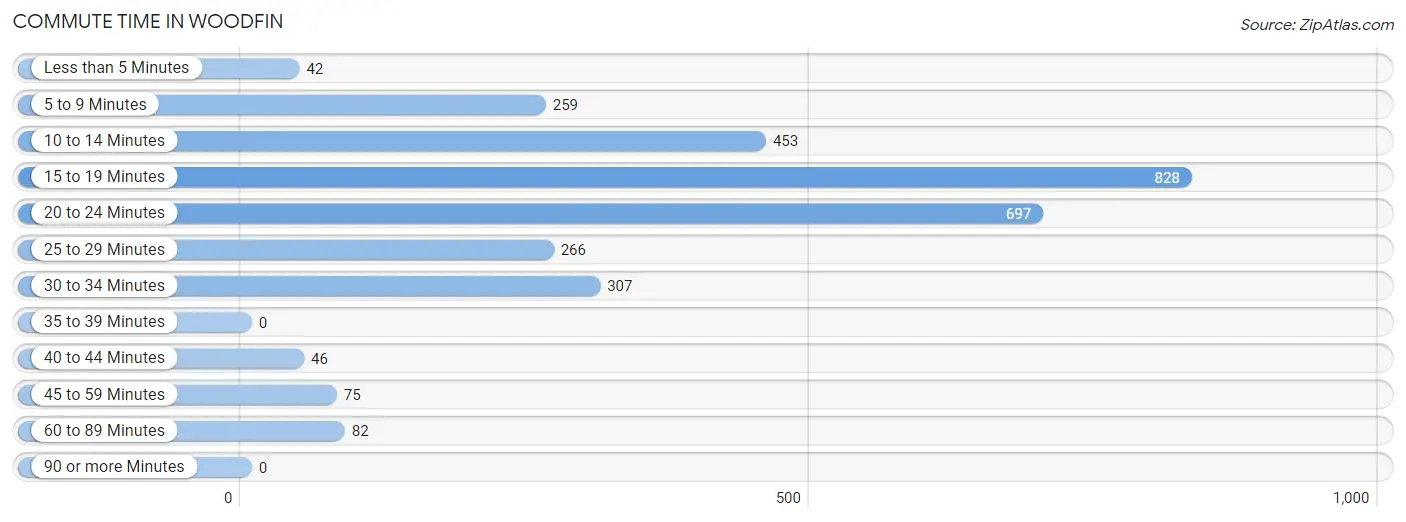
| Commute Time | # Commuters | % Commuters |
| Less than 5 Minutes | 42 | 1.4% |
| 5 to 9 Minutes | 259 | 8.5% |
| 10 to 14 Minutes | 453 | 14.8% |
| 15 to 19 Minutes | 828 | 27.1% |
| 20 to 24 Minutes | 697 | 22.8% |
| 25 to 29 Minutes | 266 | 8.7% |
| 30 to 34 Minutes | 307 | 10.1% |
| 35 to 39 Minutes | 0 | 0.0% |
| 40 to 44 Minutes | 46 | 1.5% |
| 45 to 59 Minutes | 75 | 2.5% |
| 60 to 89 Minutes | 82 | 2.7% |
| 90 or more Minutes | 0 | 0.0% |
Commute Time by Sex in Woodfin
The most common commute times in Woodfin are 15 to 19 minutes (499 commuters, 29.3%) for males and 20 to 24 minutes (347 commuters, 25.7%) for females.
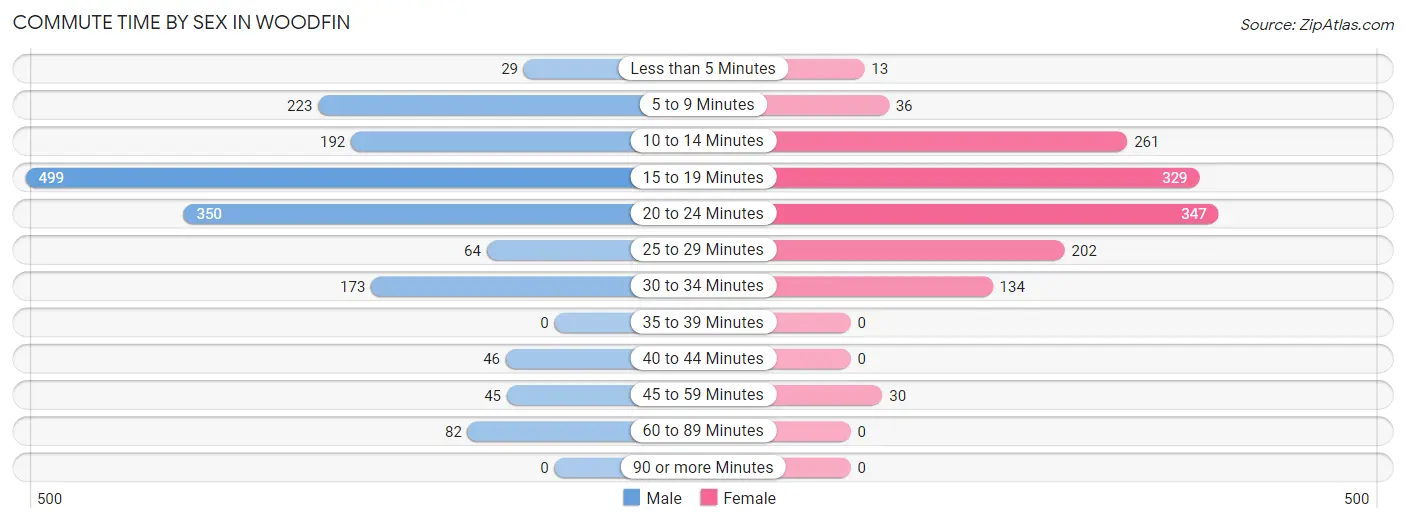
| Commute Time | Male | Female |
| Less than 5 Minutes | 29 (1.7%) | 13 (1.0%) |
| 5 to 9 Minutes | 223 (13.1%) | 36 (2.7%) |
| 10 to 14 Minutes | 192 (11.3%) | 261 (19.3%) |
| 15 to 19 Minutes | 499 (29.3%) | 329 (24.3%) |
| 20 to 24 Minutes | 350 (20.5%) | 347 (25.7%) |
| 25 to 29 Minutes | 64 (3.8%) | 202 (14.9%) |
| 30 to 34 Minutes | 173 (10.2%) | 134 (9.9%) |
| 35 to 39 Minutes | 0 (0.0%) | 0 (0.0%) |
| 40 to 44 Minutes | 46 (2.7%) | 0 (0.0%) |
| 45 to 59 Minutes | 45 (2.6%) | 30 (2.2%) |
| 60 to 89 Minutes | 82 (4.8%) | 0 (0.0%) |
| 90 or more Minutes | 0 (0.0%) | 0 (0.0%) |
Time of Departure to Work by Sex in Woodfin
The most frequent times of departure to work in Woodfin are 7:30 AM to 7:59 AM (382, 22.4%) for males and 8:00 AM to 8:29 AM (264, 19.5%) for females.
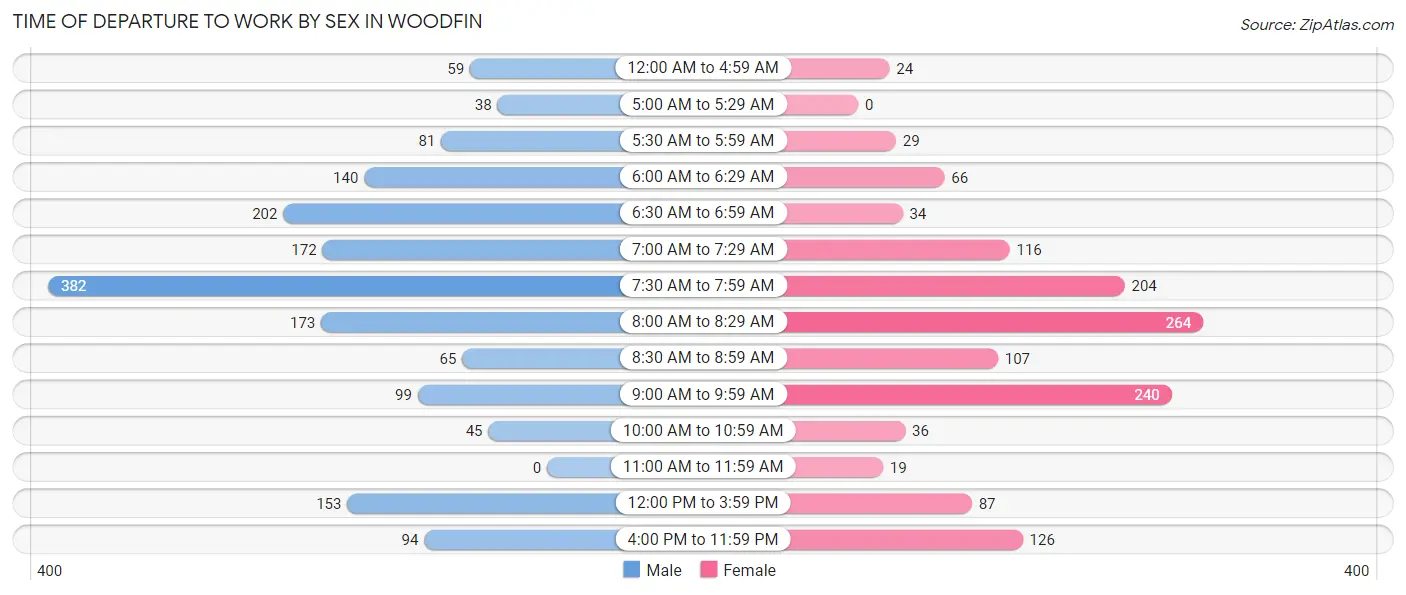
| Time of Departure | Male | Female |
| 12:00 AM to 4:59 AM | 59 (3.5%) | 24 (1.8%) |
| 5:00 AM to 5:29 AM | 38 (2.2%) | 0 (0.0%) |
| 5:30 AM to 5:59 AM | 81 (4.8%) | 29 (2.1%) |
| 6:00 AM to 6:29 AM | 140 (8.2%) | 66 (4.9%) |
| 6:30 AM to 6:59 AM | 202 (11.9%) | 34 (2.5%) |
| 7:00 AM to 7:29 AM | 172 (10.1%) | 116 (8.6%) |
| 7:30 AM to 7:59 AM | 382 (22.4%) | 204 (15.1%) |
| 8:00 AM to 8:29 AM | 173 (10.2%) | 264 (19.5%) |
| 8:30 AM to 8:59 AM | 65 (3.8%) | 107 (7.9%) |
| 9:00 AM to 9:59 AM | 99 (5.8%) | 240 (17.7%) |
| 10:00 AM to 10:59 AM | 45 (2.6%) | 36 (2.7%) |
| 11:00 AM to 11:59 AM | 0 (0.0%) | 19 (1.4%) |
| 12:00 PM to 3:59 PM | 153 (9.0%) | 87 (6.4%) |
| 4:00 PM to 11:59 PM | 94 (5.5%) | 126 (9.3%) |
| Total | 1,703 (100.0%) | 1,352 (100.0%) |
Housing Occupancy in Woodfin
Occupancy by Ownership in Woodfin
Of the total 2,958 dwellings in Woodfin, owner-occupied units account for 1,573 (53.2%), while renter-occupied units make up 1,385 (46.8%).
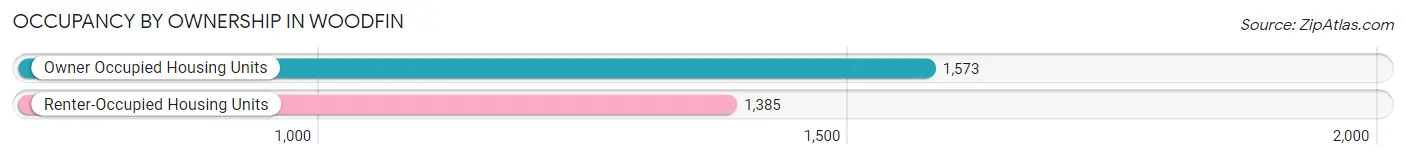
| Occupancy | # Housing Units | % Housing Units |
| Owner Occupied Housing Units | 1,573 | 53.2% |
| Renter-Occupied Housing Units | 1,385 | 46.8% |
| Total Occupied Housing Units | 2,958 | 100.0% |
Occupancy by Household Size in Woodfin
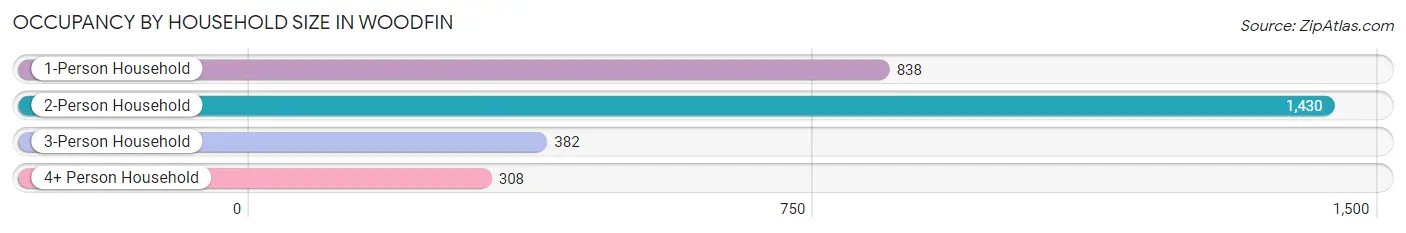
| Household Size | # Housing Units | % Housing Units |
| 1-Person Household | 838 | 28.3% |
| 2-Person Household | 1,430 | 48.3% |
| 3-Person Household | 382 | 12.9% |
| 4+ Person Household | 308 | 10.4% |
| Total Housing Units | 2,958 | 100.0% |
Occupancy by Ownership by Household Size in Woodfin
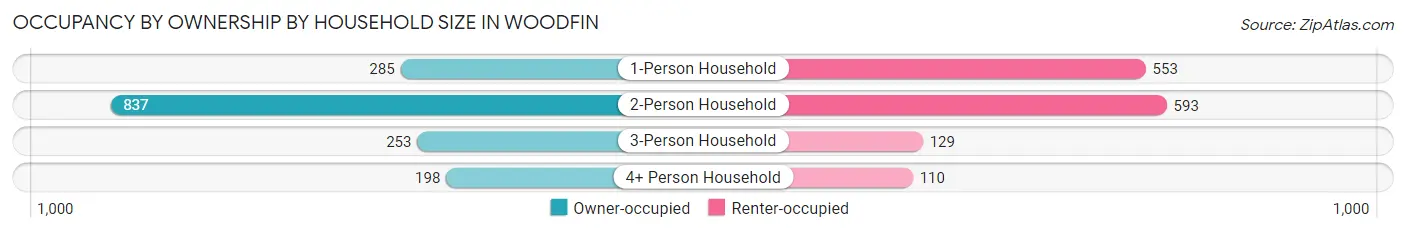
| Household Size | Owner-occupied | Renter-occupied |
| 1-Person Household | 285 (34.0%) | 553 (66.0%) |
| 2-Person Household | 837 (58.5%) | 593 (41.5%) |
| 3-Person Household | 253 (66.2%) | 129 (33.8%) |
| 4+ Person Household | 198 (64.3%) | 110 (35.7%) |
| Total Housing Units | 1,573 (53.2%) | 1,385 (46.8%) |
Occupancy by Educational Attainment in Woodfin
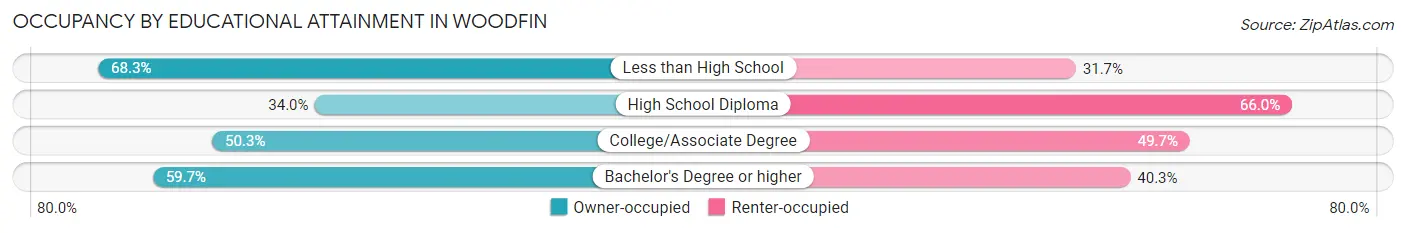
| Household Size | Owner-occupied | Renter-occupied |
| Less than High School | 205 (68.3%) | 95 (31.7%) |
| High School Diploma | 194 (34.0%) | 376 (66.0%) |
| College/Associate Degree | 385 (50.3%) | 381 (49.7%) |
| Bachelor's Degree or higher | 789 (59.7%) | 533 (40.3%) |
Occupancy by Age of Householder in Woodfin
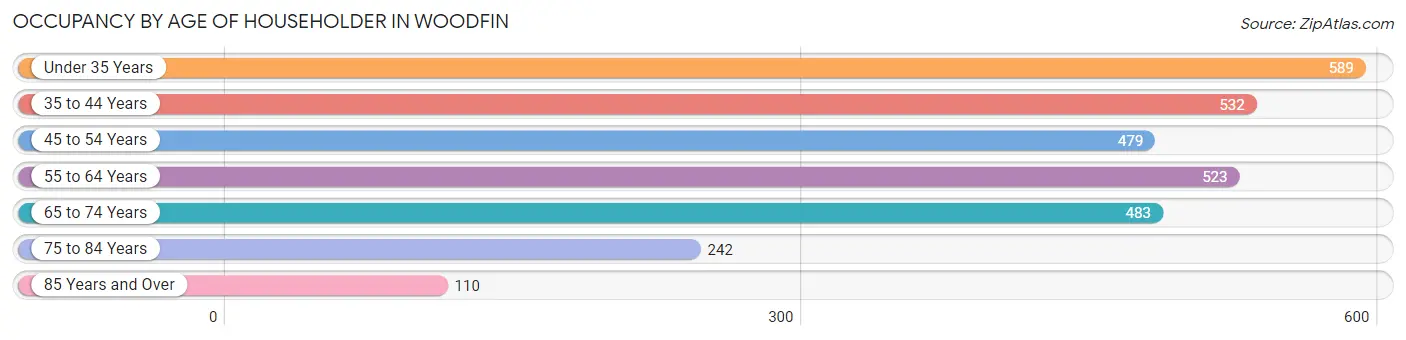
| Age Bracket | # Households | % Households |
| Under 35 Years | 589 | 19.9% |
| 35 to 44 Years | 532 | 18.0% |
| 45 to 54 Years | 479 | 16.2% |
| 55 to 64 Years | 523 | 17.7% |
| 65 to 74 Years | 483 | 16.3% |
| 75 to 84 Years | 242 | 8.2% |
| 85 Years and Over | 110 | 3.7% |
| Total | 2,958 | 100.0% |
Housing Finances in Woodfin
Median Income by Occupancy in Woodfin
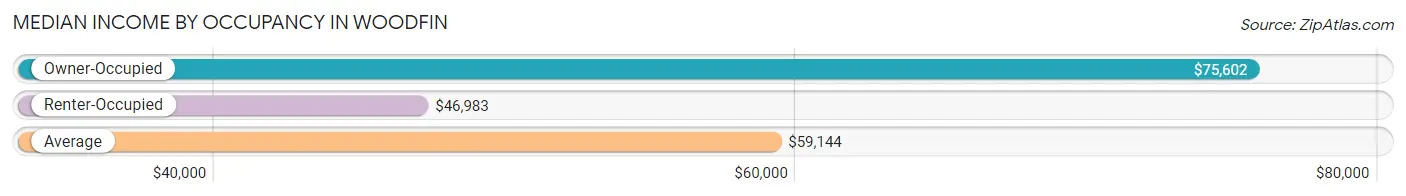
| Occupancy Type | # Households | Median Income |
| Owner-Occupied | 1,573 (53.2%) | $75,602 |
| Renter-Occupied | 1,385 (46.8%) | $46,983 |
| Average | 2,958 (100.0%) | $59,144 |
Occupancy by Householder Income Bracket in Woodfin
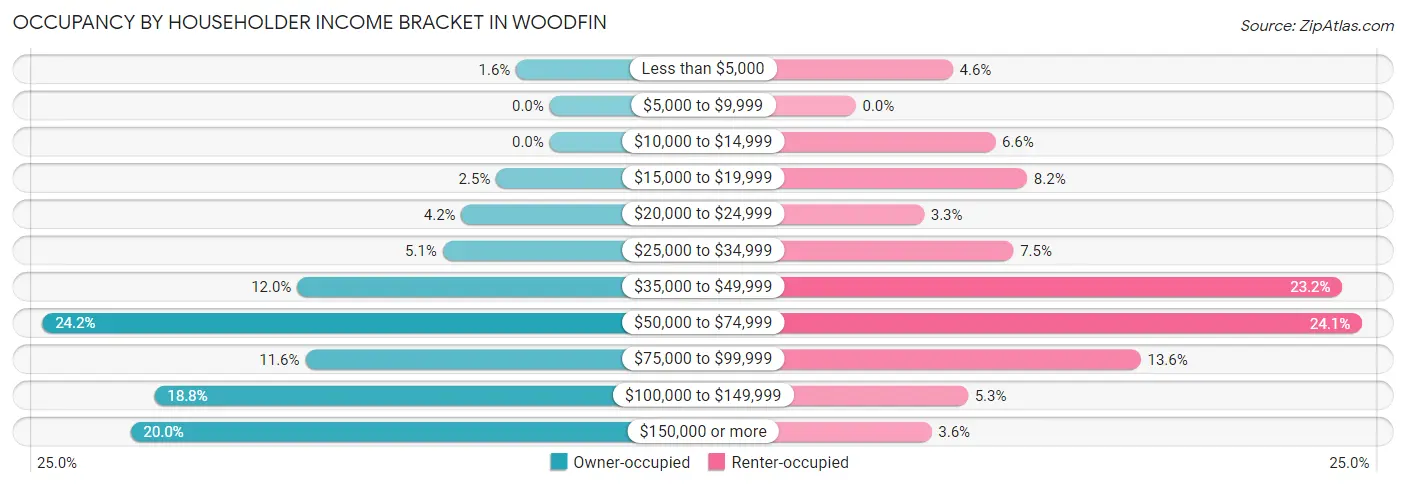
| Income Bracket | Owner-occupied | Renter-occupied |
| Less than $5,000 | 25 (1.6%) | 64 (4.6%) |
| $5,000 to $9,999 | 0 (0.0%) | 0 (0.0%) |
| $10,000 to $14,999 | 0 (0.0%) | 92 (6.6%) |
| $15,000 to $19,999 | 40 (2.5%) | 113 (8.2%) |
| $20,000 to $24,999 | 66 (4.2%) | 45 (3.3%) |
| $25,000 to $34,999 | 80 (5.1%) | 104 (7.5%) |
| $35,000 to $49,999 | 189 (12.0%) | 321 (23.2%) |
| $50,000 to $74,999 | 380 (24.2%) | 334 (24.1%) |
| $75,000 to $99,999 | 183 (11.6%) | 188 (13.6%) |
| $100,000 to $149,999 | 296 (18.8%) | 74 (5.3%) |
| $150,000 or more | 314 (20.0%) | 50 (3.6%) |
| Total | 1,573 (100.0%) | 1,385 (100.0%) |
Monthly Housing Cost Tiers in Woodfin
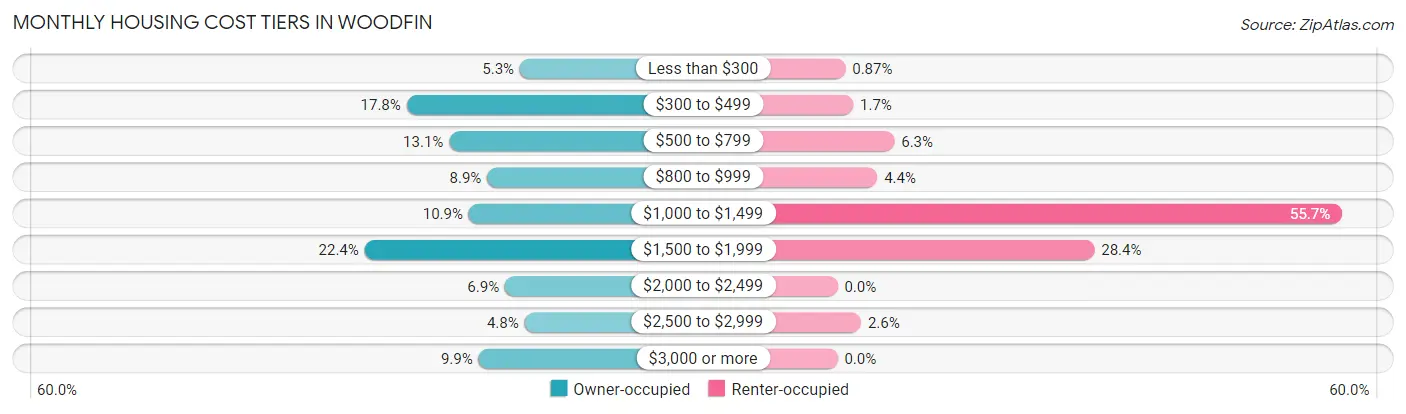
| Monthly Cost | Owner-occupied | Renter-occupied |
| Less than $300 | 83 (5.3%) | 12 (0.9%) |
| $300 to $499 | 280 (17.8%) | 24 (1.7%) |
| $500 to $799 | 206 (13.1%) | 87 (6.3%) |
| $800 to $999 | 140 (8.9%) | 61 (4.4%) |
| $1,000 to $1,499 | 172 (10.9%) | 772 (55.7%) |
| $1,500 to $1,999 | 353 (22.4%) | 393 (28.4%) |
| $2,000 to $2,499 | 109 (6.9%) | 0 (0.0%) |
| $2,500 to $2,999 | 75 (4.8%) | 36 (2.6%) |
| $3,000 or more | 155 (9.9%) | 0 (0.0%) |
| Total | 1,573 (100.0%) | 1,385 (100.0%) |
Physical Housing Characteristics in Woodfin
Housing Structures in Woodfin
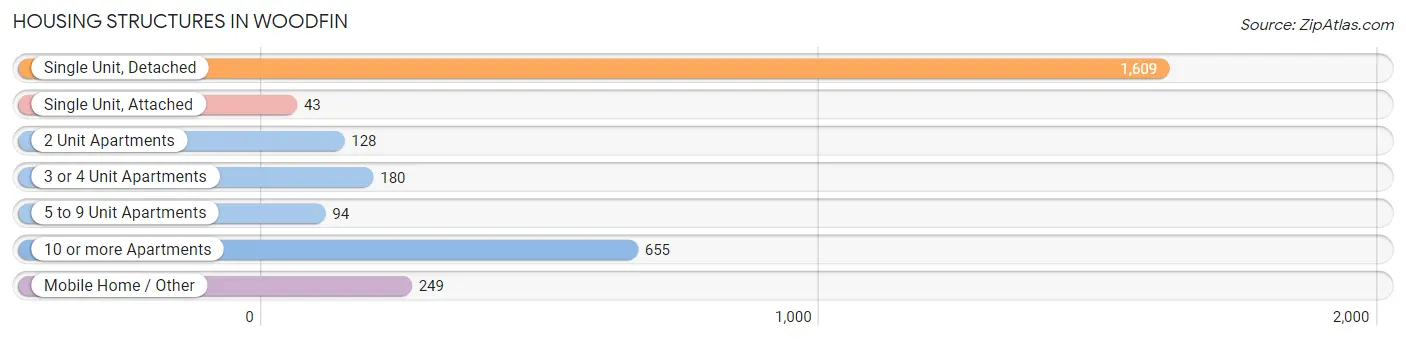
| Structure Type | # Housing Units | % Housing Units |
| Single Unit, Detached | 1,609 | 54.4% |
| Single Unit, Attached | 43 | 1.5% |
| 2 Unit Apartments | 128 | 4.3% |
| 3 or 4 Unit Apartments | 180 | 6.1% |
| 5 to 9 Unit Apartments | 94 | 3.2% |
| 10 or more Apartments | 655 | 22.1% |
| Mobile Home / Other | 249 | 8.4% |
| Total | 2,958 | 100.0% |
Housing Structures by Occupancy in Woodfin
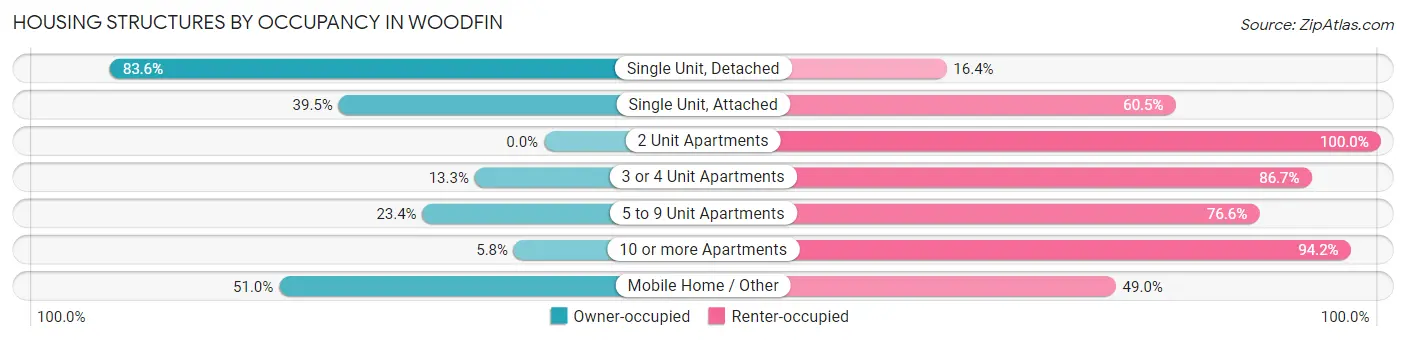
| Structure Type | Owner-occupied | Renter-occupied |
| Single Unit, Detached | 1,345 (83.6%) | 264 (16.4%) |
| Single Unit, Attached | 17 (39.5%) | 26 (60.5%) |
| 2 Unit Apartments | 0 (0.0%) | 128 (100.0%) |
| 3 or 4 Unit Apartments | 24 (13.3%) | 156 (86.7%) |
| 5 to 9 Unit Apartments | 22 (23.4%) | 72 (76.6%) |
| 10 or more Apartments | 38 (5.8%) | 617 (94.2%) |
| Mobile Home / Other | 127 (51.0%) | 122 (49.0%) |
| Total | 1,573 (53.2%) | 1,385 (46.8%) |
Housing Structures by Number of Rooms in Woodfin
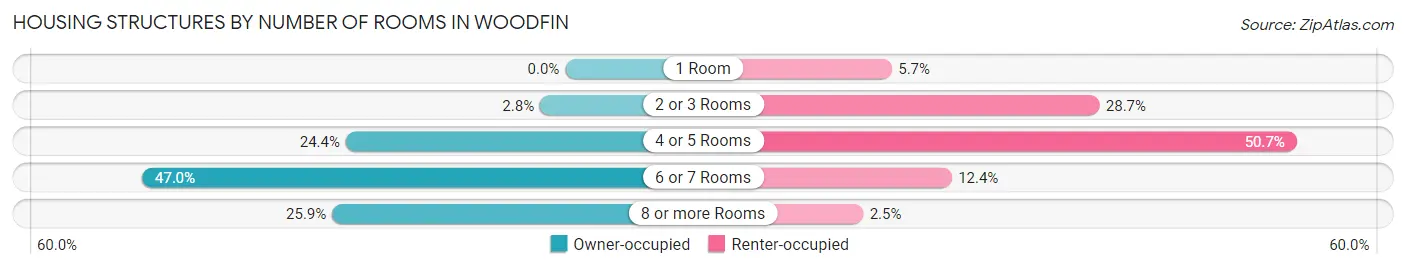
| Number of Rooms | Owner-occupied | Renter-occupied |
| 1 Room | 0 (0.0%) | 79 (5.7%) |
| 2 or 3 Rooms | 44 (2.8%) | 398 (28.7%) |
| 4 or 5 Rooms | 383 (24.3%) | 702 (50.7%) |
| 6 or 7 Rooms | 739 (47.0%) | 171 (12.3%) |
| 8 or more Rooms | 407 (25.9%) | 35 (2.5%) |
| Total | 1,573 (100.0%) | 1,385 (100.0%) |
Housing Structure by Heating Type in Woodfin
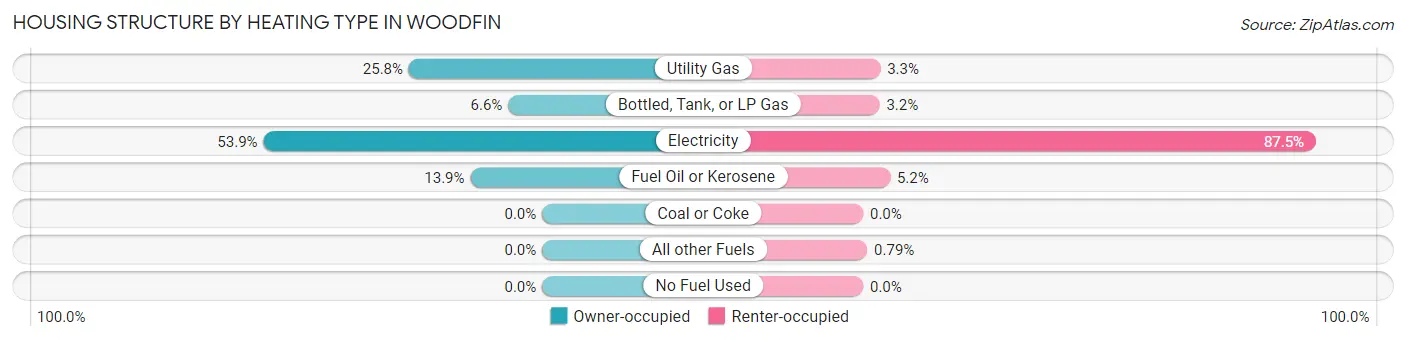
| Heating Type | Owner-occupied | Renter-occupied |
| Utility Gas | 405 (25.8%) | 46 (3.3%) |
| Bottled, Tank, or LP Gas | 103 (6.6%) | 44 (3.2%) |
| Electricity | 847 (53.8%) | 1,212 (87.5%) |
| Fuel Oil or Kerosene | 218 (13.9%) | 72 (5.2%) |
| Coal or Coke | 0 (0.0%) | 0 (0.0%) |
| All other Fuels | 0 (0.0%) | 11 (0.8%) |
| No Fuel Used | 0 (0.0%) | 0 (0.0%) |
| Total | 1,573 (100.0%) | 1,385 (100.0%) |
Household Vehicle Usage in Woodfin
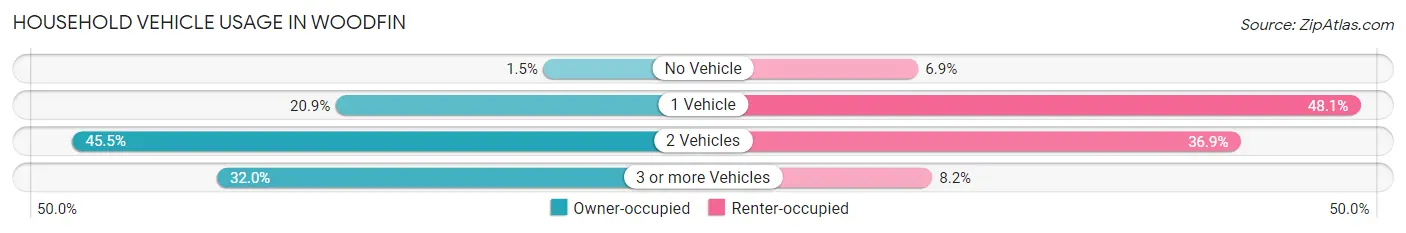
| Vehicles per Household | Owner-occupied | Renter-occupied |
| No Vehicle | 24 (1.5%) | 95 (6.9%) |
| 1 Vehicle | 329 (20.9%) | 666 (48.1%) |
| 2 Vehicles | 716 (45.5%) | 511 (36.9%) |
| 3 or more Vehicles | 504 (32.0%) | 113 (8.2%) |
| Total | 1,573 (100.0%) | 1,385 (100.0%) |
Real Estate & Mortgages in Woodfin
Real Estate and Mortgage Overview in Woodfin
| Characteristic | Without Mortgage | With Mortgage |
| Housing Units | 680 | 893 |
| Median Property Value | $237,000 | $353,300 |
| Median Household Income | $55,833 | $262 |
| Monthly Housing Costs | $485 | $140 |
| Real Estate Taxes | $1,781 | $11 |
Property Value by Mortgage Status in Woodfin
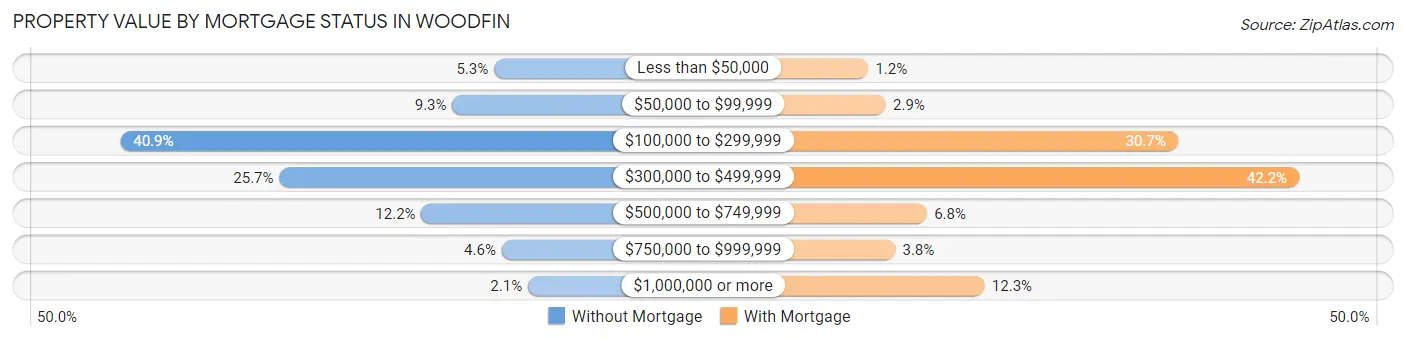
| Property Value | Without Mortgage | With Mortgage |
| Less than $50,000 | 36 (5.3%) | 11 (1.2%) |
| $50,000 to $99,999 | 63 (9.3%) | 26 (2.9%) |
| $100,000 to $299,999 | 278 (40.9%) | 274 (30.7%) |
| $300,000 to $499,999 | 175 (25.7%) | 377 (42.2%) |
| $500,000 to $749,999 | 83 (12.2%) | 61 (6.8%) |
| $750,000 to $999,999 | 31 (4.6%) | 34 (3.8%) |
| $1,000,000 or more | 14 (2.1%) | 110 (12.3%) |
| Total | 680 (100.0%) | 893 (100.0%) |
Household Income by Mortgage Status in Woodfin
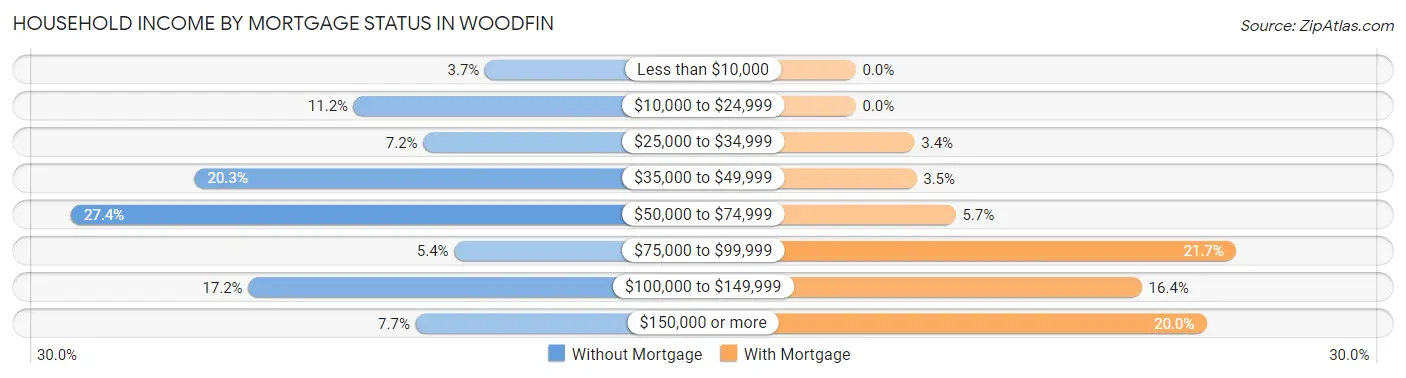
| Household Income | Without Mortgage | With Mortgage |
| Less than $10,000 | 25 (3.7%) | 0 (0.0%) |
| $10,000 to $24,999 | 76 (11.2%) | 0 (0.0%) |
| $25,000 to $34,999 | 49 (7.2%) | 30 (3.4%) |
| $35,000 to $49,999 | 138 (20.3%) | 31 (3.5%) |
| $50,000 to $74,999 | 186 (27.4%) | 51 (5.7%) |
| $75,000 to $99,999 | 37 (5.4%) | 194 (21.7%) |
| $100,000 to $149,999 | 117 (17.2%) | 146 (16.4%) |
| $150,000 or more | 52 (7.6%) | 179 (20.0%) |
| Total | 680 (100.0%) | 893 (100.0%) |
Property Value to Household Income Ratio in Woodfin
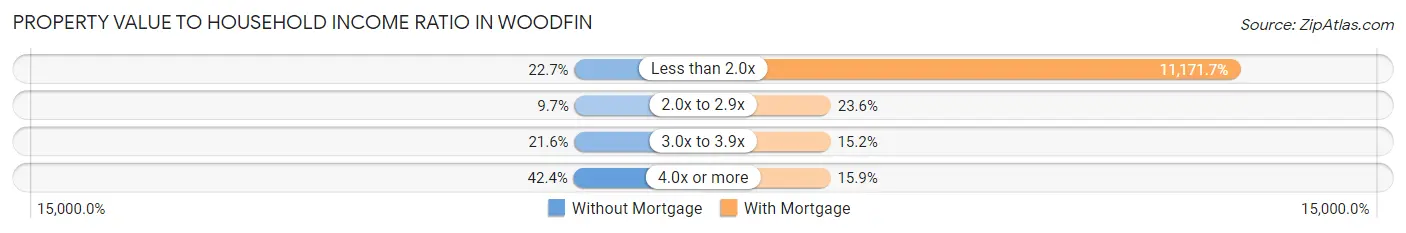
| Value-to-Income Ratio | Without Mortgage | With Mortgage |
| Less than 2.0x | 154 (22.7%) | 99,763 (11,171.7%) |
| 2.0x to 2.9x | 66 (9.7%) | 211 (23.6%) |
| 3.0x to 3.9x | 147 (21.6%) | 136 (15.2%) |
| 4.0x or more | 288 (42.3%) | 142 (15.9%) |
| Total | 680 (100.0%) | 893 (100.0%) |
Real Estate Taxes by Mortgage Status in Woodfin
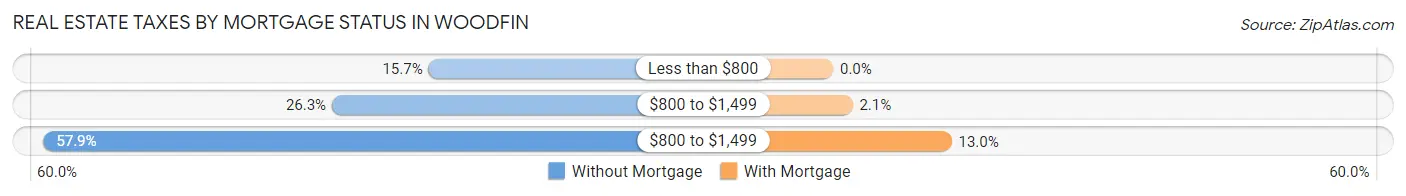
| Property Taxes | Without Mortgage | With Mortgage |
| Less than $800 | 107 (15.7%) | 0 (0.0%) |
| $800 to $1,499 | 179 (26.3%) | 19 (2.1%) |
| $800 to $1,499 | 394 (57.9%) | 116 (13.0%) |
| Total | 680 (100.0%) | 893 (100.0%) |
Health & Disability in Woodfin
Health Insurance Coverage by Age in Woodfin
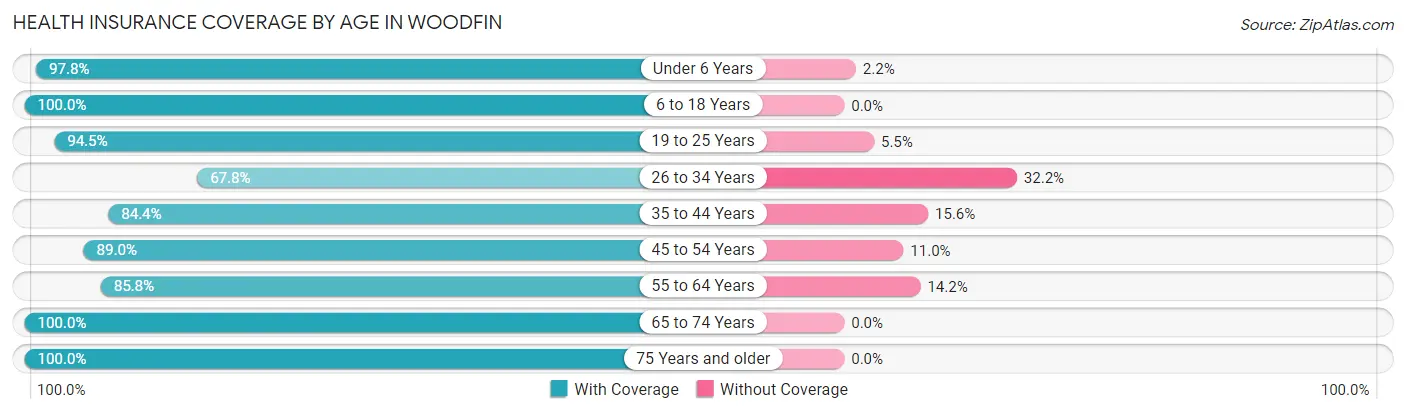
| Age Bracket | With Coverage | Without Coverage |
| Under 6 Years | 272 (97.8%) | 6 (2.2%) |
| 6 to 18 Years | 760 (100.0%) | 0 (0.0%) |
| 19 to 25 Years | 631 (94.5%) | 37 (5.5%) |
| 26 to 34 Years | 889 (67.8%) | 422 (32.2%) |
| 35 to 44 Years | 858 (84.4%) | 159 (15.6%) |
| 45 to 54 Years | 840 (89.0%) | 104 (11.0%) |
| 55 to 64 Years | 863 (85.8%) | 143 (14.2%) |
| 65 to 74 Years | 725 (100.0%) | 0 (0.0%) |
| 75 Years and older | 559 (100.0%) | 0 (0.0%) |
| Total | 6,397 (88.0%) | 871 (12.0%) |
Health Insurance Coverage by Citizenship Status in Woodfin
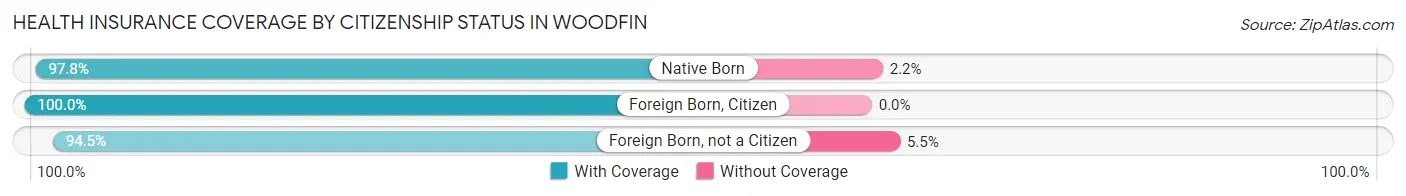
| Citizenship Status | With Coverage | Without Coverage |
| Native Born | 272 (97.8%) | 6 (2.2%) |
| Foreign Born, Citizen | 760 (100.0%) | 0 (0.0%) |
| Foreign Born, not a Citizen | 631 (94.5%) | 37 (5.5%) |
Health Insurance Coverage by Household Income in Woodfin
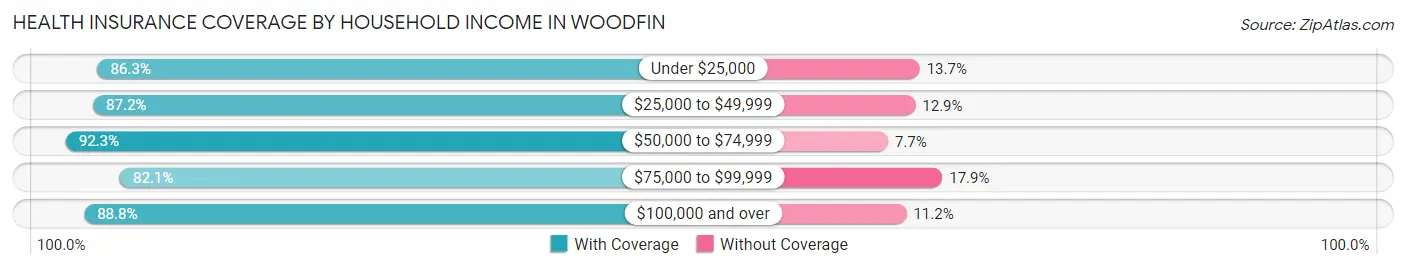
| Household Income | With Coverage | Without Coverage |
| Under $25,000 | 714 (86.3%) | 113 (13.7%) |
| $25,000 to $49,999 | 1,472 (87.2%) | 217 (12.9%) |
| $50,000 to $74,999 | 1,507 (92.3%) | 126 (7.7%) |
| $75,000 to $99,999 | 867 (82.1%) | 189 (17.9%) |
| $100,000 and over | 1,796 (88.8%) | 226 (11.2%) |
Public vs Private Health Insurance Coverage by Age in Woodfin
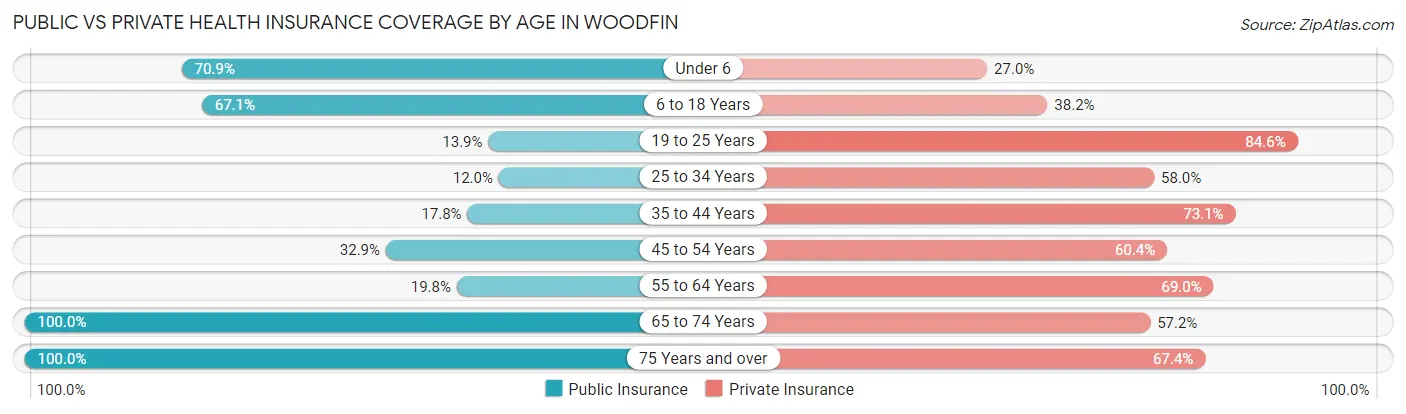
| Age Bracket | Public Insurance | Private Insurance |
| Under 6 | 197 (70.9%) | 75 (27.0%) |
| 6 to 18 Years | 510 (67.1%) | 290 (38.2%) |
| 19 to 25 Years | 93 (13.9%) | 565 (84.6%) |
| 25 to 34 Years | 157 (12.0%) | 760 (58.0%) |
| 35 to 44 Years | 181 (17.8%) | 743 (73.1%) |
| 45 to 54 Years | 311 (32.9%) | 570 (60.4%) |
| 55 to 64 Years | 199 (19.8%) | 694 (69.0%) |
| 65 to 74 Years | 725 (100.0%) | 415 (57.2%) |
| 75 Years and over | 559 (100.0%) | 377 (67.4%) |
| Total | 2,932 (40.3%) | 4,489 (61.8%) |
Disability Status by Sex by Age in Woodfin
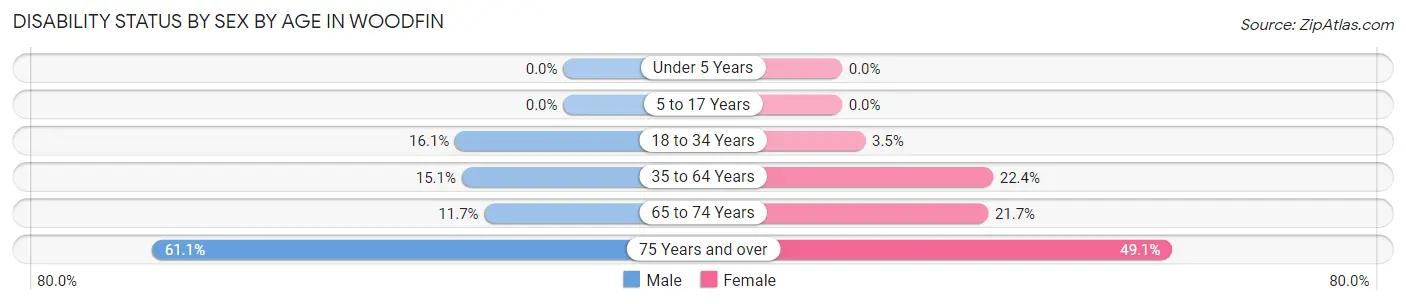
| Age Bracket | Male | Female |
| Under 5 Years | 0 (0.0%) | 0 (0.0%) |
| 5 to 17 Years | 0 (0.0%) | 0 (0.0%) |
| 18 to 34 Years | 165 (16.1%) | 34 (3.5%) |
| 35 to 64 Years | 247 (15.1%) | 298 (22.4%) |
| 65 to 74 Years | 45 (11.7%) | 74 (21.7%) |
| 75 Years and over | 110 (61.1%) | 186 (49.1%) |
Disability Class by Sex by Age in Woodfin
Disability Class: Hearing Difficulty
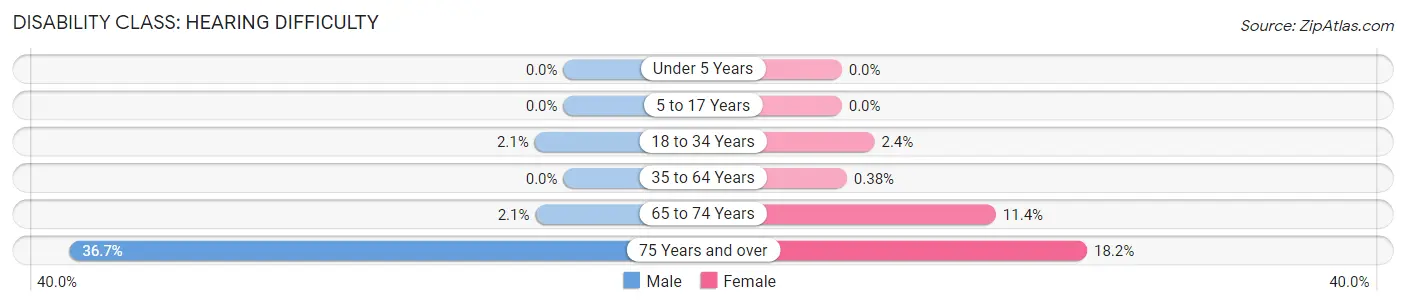
| Age Bracket | Male | Female |
| Under 5 Years | 0 (0.0%) | 0 (0.0%) |
| 5 to 17 Years | 0 (0.0%) | 0 (0.0%) |
| 18 to 34 Years | 22 (2.1%) | 24 (2.4%) |
| 35 to 64 Years | 0 (0.0%) | 5 (0.4%) |
| 65 to 74 Years | 8 (2.1%) | 39 (11.4%) |
| 75 Years and over | 66 (36.7%) | 69 (18.2%) |
Disability Class: Vision Difficulty
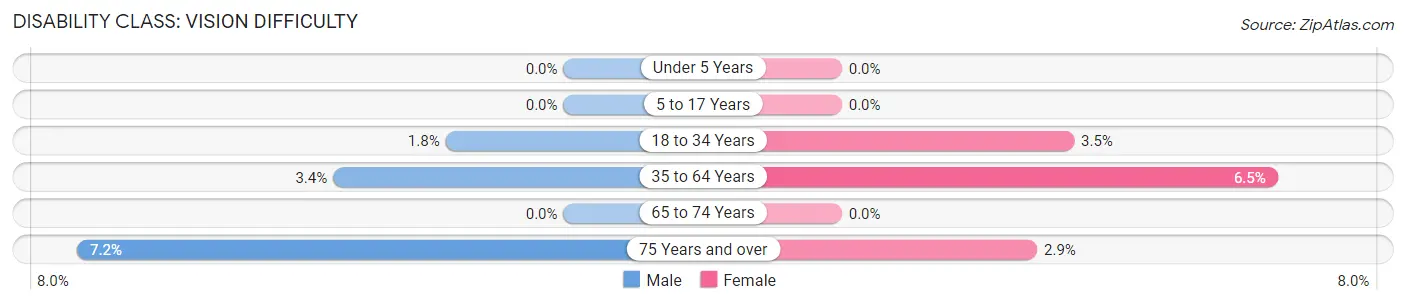
| Age Bracket | Male | Female |
| Under 5 Years | 0 (0.0%) | 0 (0.0%) |
| 5 to 17 Years | 0 (0.0%) | 0 (0.0%) |
| 18 to 34 Years | 18 (1.8%) | 34 (3.5%) |
| 35 to 64 Years | 56 (3.4%) | 86 (6.5%) |
| 65 to 74 Years | 0 (0.0%) | 0 (0.0%) |
| 75 Years and over | 13 (7.2%) | 11 (2.9%) |
Disability Class: Cognitive Difficulty
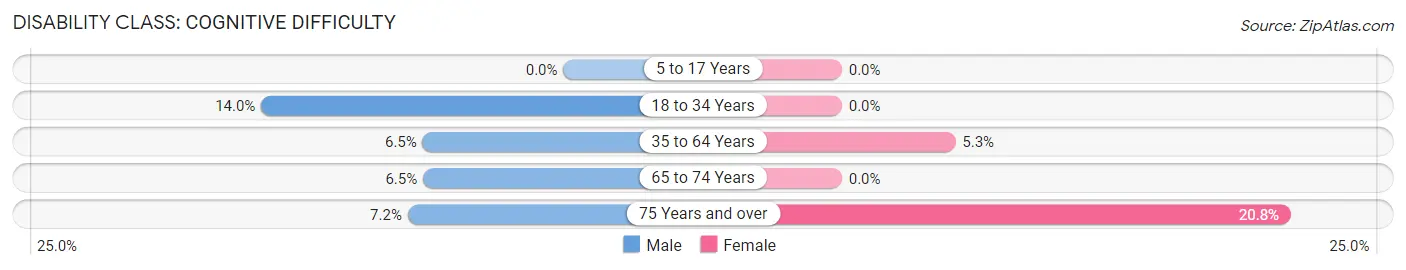
| Age Bracket | Male | Female |
| 5 to 17 Years | 0 (0.0%) | 0 (0.0%) |
| 18 to 34 Years | 144 (14.0%) | 0 (0.0%) |
| 35 to 64 Years | 107 (6.5%) | 70 (5.3%) |
| 65 to 74 Years | 25 (6.5%) | 0 (0.0%) |
| 75 Years and over | 13 (7.2%) | 79 (20.8%) |
Disability Class: Ambulatory Difficulty
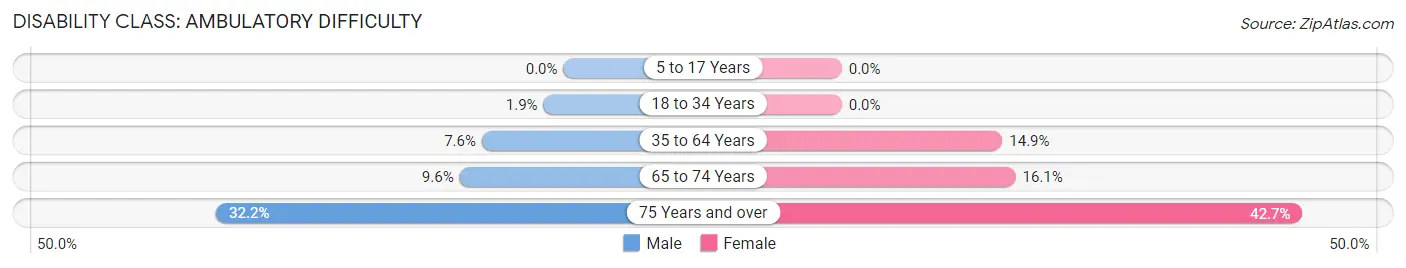
| Age Bracket | Male | Female |
| 5 to 17 Years | 0 (0.0%) | 0 (0.0%) |
| 18 to 34 Years | 19 (1.8%) | 0 (0.0%) |
| 35 to 64 Years | 124 (7.6%) | 198 (14.9%) |
| 65 to 74 Years | 37 (9.6%) | 55 (16.1%) |
| 75 Years and over | 58 (32.2%) | 162 (42.7%) |
Disability Class: Self-Care Difficulty
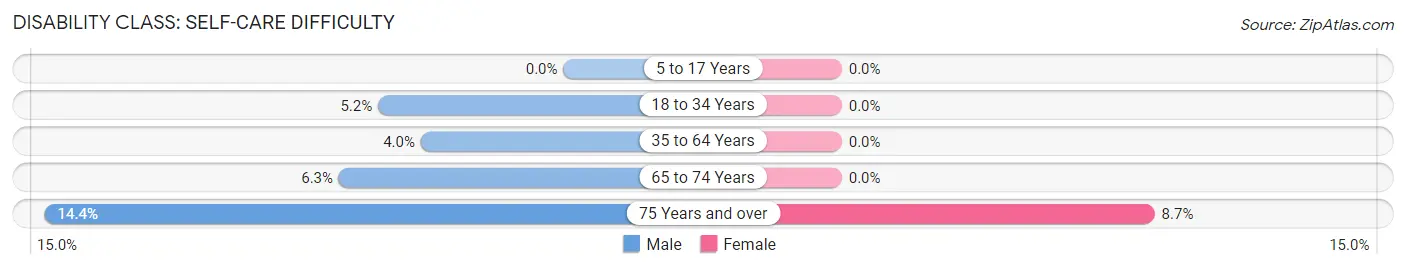
| Age Bracket | Male | Female |
| 5 to 17 Years | 0 (0.0%) | 0 (0.0%) |
| 18 to 34 Years | 53 (5.2%) | 0 (0.0%) |
| 35 to 64 Years | 65 (4.0%) | 0 (0.0%) |
| 65 to 74 Years | 24 (6.2%) | 0 (0.0%) |
| 75 Years and over | 26 (14.4%) | 33 (8.7%) |
Technology Access in Woodfin
Computing Device Access in Woodfin
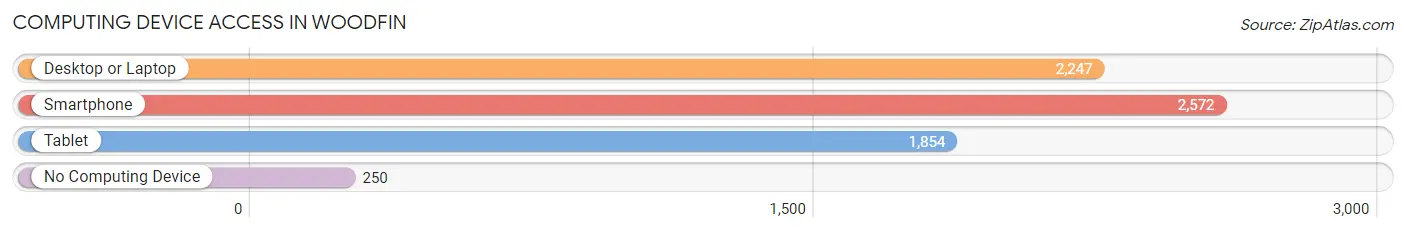
| Device Type | # Households | % Households |
| Desktop or Laptop | 2,247 | 76.0% |
| Smartphone | 2,572 | 87.0% |
| Tablet | 1,854 | 62.7% |
| No Computing Device | 250 | 8.5% |
| Total | 2,958 | 100.0% |
Internet Access in Woodfin
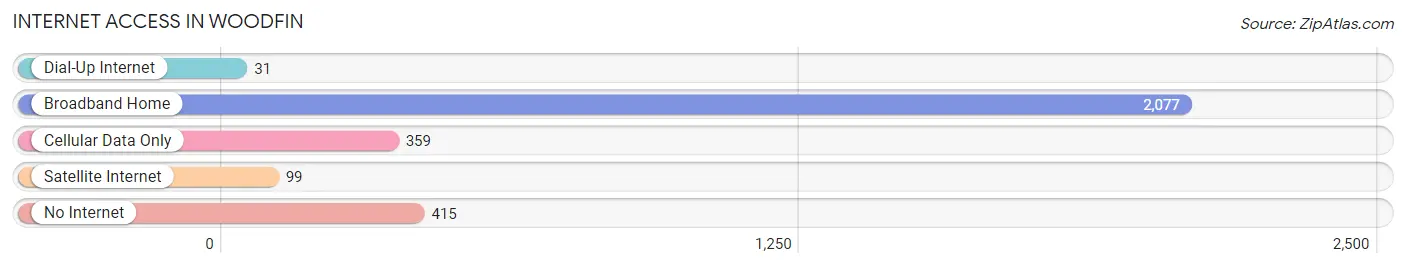
| Internet Type | # Households | % Households |
| Dial-Up Internet | 31 | 1.1% |
| Broadband Home | 2,077 | 70.2% |
| Cellular Data Only | 359 | 12.1% |
| Satellite Internet | 99 | 3.4% |
| No Internet | 415 | 14.0% |
| Total | 2,958 | 100.0% |
Woodfin Summary
Woodfin is a town located in Buncombe County, North Carolina. It is situated in the Blue Ridge Mountains, just north of Asheville. The town was founded in 1883 and was named after Colonel William Woodfin, a prominent local landowner. The population of Woodfin was 2,945 at the 2010 census.
Geography
Woodfin is located at 35°35'25" North, 82°35'25" West (35.590278, -82.590278). It is situated in the Blue Ridge Mountains, just north of Asheville. The town is located along the French Broad River, which is a major tributary of the Tennessee River. The elevation of Woodfin is 1,945 feet (592 m).
The town has a total area of 2.2 square miles (5.7 km2), all of which is land. The terrain is mostly hilly, with some flat areas along the river. The climate is humid subtropical, with hot summers and mild winters.
Demographics
As of the 2010 census, there were 2,945 people, 1,093 households, and 745 families residing in Woodfin. The population density was 1,338.6 people per square mile (517.7/km2). There were 1,093 housing units at an average density of 495.9 per square mile (191.5/km2). The racial makeup of the town was 92.2% White, 4.2% African American, 0.3% Native American, 0.7% Asian, 0.1% Pacific Islander, 1.2% from other races, and 1.4% from two or more races. Hispanic or Latino of any race were 3.2% of the population.
Economy
Woodfin is a small town with a limited economy. The town is home to several small businesses, including a grocery store, a hardware store, and a few restaurants. The town also has a few manufacturing companies, including a furniture factory and a paper mill. The town is also home to a few small farms, which produce a variety of crops.
The town is served by the Asheville Regional Airport, which is located just outside of town. The airport provides air service to several major cities in the region.
The town is also served by the Asheville Transit System, which provides bus service to the surrounding area.
Conclusion
Woodfin is a small town located in the Blue Ridge Mountains of North Carolina. The town was founded in 1883 and was named after Colonel William Woodfin, a prominent local landowner. The population of Woodfin was 2,945 at the 2010 census. The town has a limited economy, with several small businesses, manufacturing companies, and farms. The town is served by the Asheville Regional Airport and the Asheville Transit System.
Common Questions
What is Per Capita Income in Woodfin?
Per Capita income in Woodfin is $37,727.
What is the Median Family Income in Woodfin?
Median Family Income in Woodfin is $70,956.
What is the Median Household income in Woodfin?
Median Household Income in Woodfin is $59,144.
What is Income or Wage Gap in Woodfin?
Income or Wage Gap in Woodfin is 16.7%.
Women in Woodfin earn 83.3 cents for every dollar earned by a man.
What is Inequality or Gini Index in Woodfin?
Inequality or Gini Index in Woodfin is 0.45.
What is the Total Population of Woodfin?
Total Population of Woodfin is 7,901.
What is the Total Male Population of Woodfin?
Total Male Population of Woodfin is 4,253.
What is the Total Female Population of Woodfin?
Total Female Population of Woodfin is 3,648.
What is the Ratio of Males per 100 Females in Woodfin?
There are 116.58 Males per 100 Females in Woodfin.
What is the Ratio of Females per 100 Males in Woodfin?
There are 85.77 Females per 100 Males in Woodfin.
What is the Median Population Age in Woodfin?
Median Population Age in Woodfin is 42.3 Years.
What is the Average Family Size in Woodfin
Average Family Size in Woodfin is 3.0 People.
What is the Average Household Size in Woodfin
Average Household Size in Woodfin is 2.4 People.
How Large is the Labor Force in Woodfin?
There are 3,938 People in the Labor Forcein in Woodfin.
What is the Percentage of People in the Labor Force in Woodfin?
56.0% of People are in the Labor Force in Woodfin.
What is the Unemployment Rate in Woodfin?
Unemployment Rate in Woodfin is 2.0%.