Coinjock, NC Map & Demographics
Coinjock Map
Coinjock Overview
$22,731
PER CAPITA INCOME
$40,938
AVG HOUSEHOLD INCOME
26.7%
WAGE / INCOME GAP [ % ]
73.3¢/ $1
WAGE / INCOME GAP [ $ ]
0.27
INEQUALITY / GINI INDEX
301
TOTAL POPULATION
102
MALE POPULATION
199
FEMALE POPULATION
51.26
MALES / 100 FEMALES
195.10
FEMALES / 100 MALES
39.7
MEDIAN AGE
2.3
AVG FAMILY SIZE
2.1
AVG HOUSEHOLD SIZE
193
LABOR FORCE [ PEOPLE ]
69.4%
PERCENT IN LABOR FORCE
Coinjock Zip Codes
Coinjock Area Codes
Income in Coinjock
Income Overview in Coinjock
| Characteristic | Number | Measure |
| Per Capita Income | 301 | $22,731 |
| Median Family Income | 79 | $0 |
| Mean Family Income | 79 | $37,068 |
| Median Household Income | 144 | $40,938 |
| Mean Household Income | 144 | $45,175 |
| Income Deficit | 79 | $0 |
| Wage / Income Gap (%) | 301 | 26.70% |
| Wage / Income Gap ($) | 301 | 73.30¢ per $1 |
| Gini / Inequality Index | 301 | 0.27 |
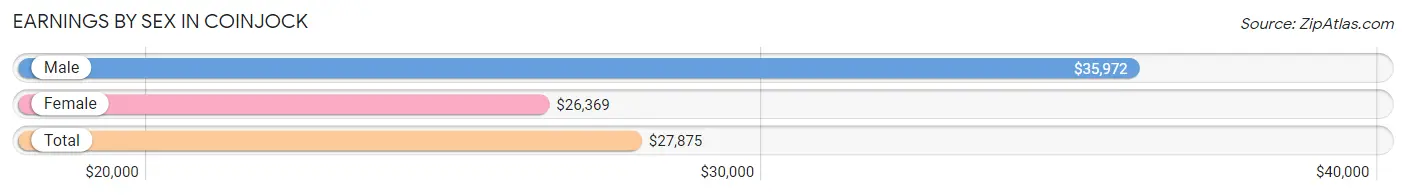
Earnings by Sex in Coinjock
Average Earnings in Coinjock are $27,875, $35,972 for men and $26,369 for women, a difference of 26.7%.
| Sex | Number | Average Earnings |
| Male | 59 (30.6%) | $35,972 |
| Female | 134 (69.4%) | $26,369 |
| Total | 193 (100.0%) | $27,875 |
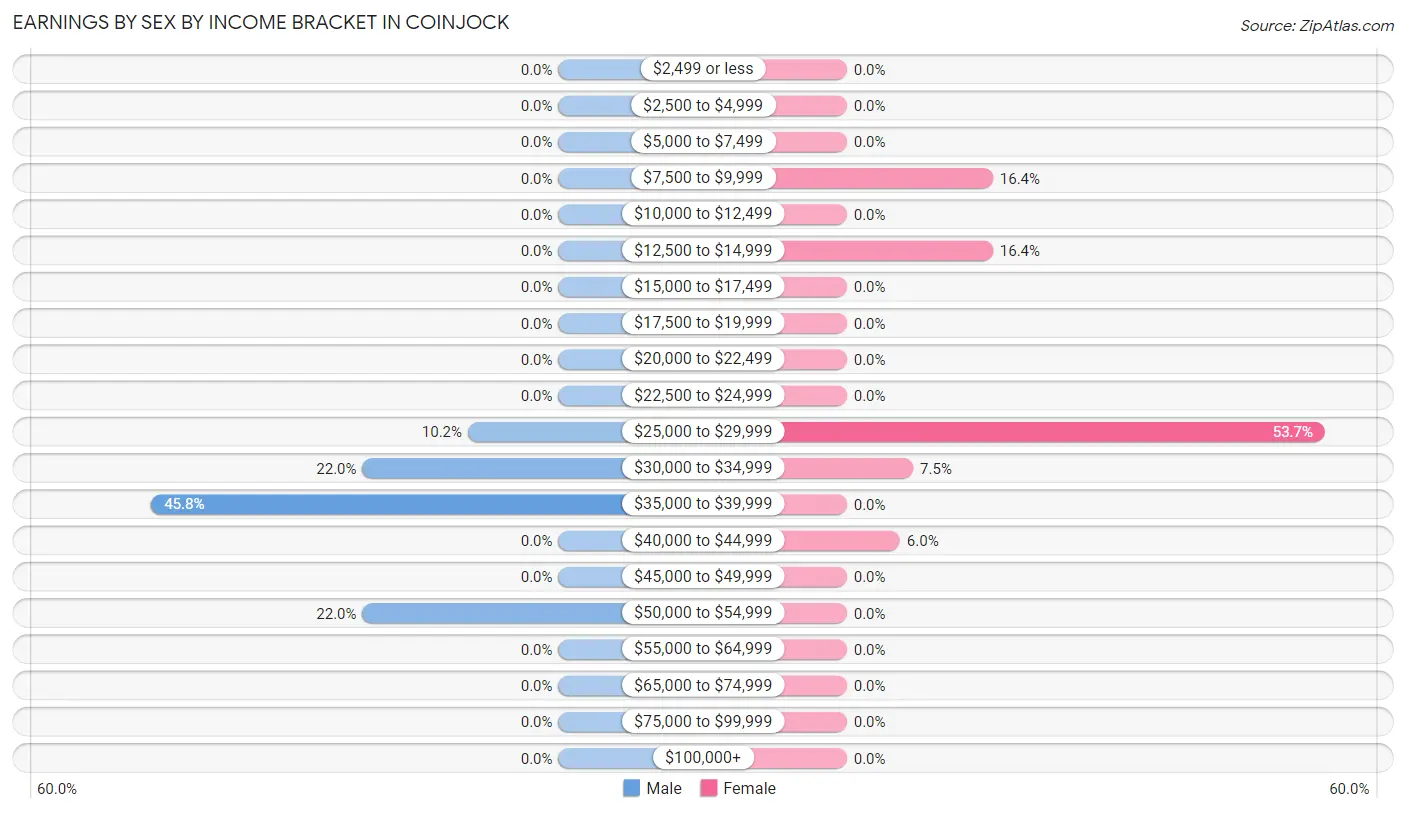
Earnings by Sex by Income Bracket in Coinjock
The most common earnings brackets in Coinjock are $35,000 to $39,999 for men (27 | 45.8%) and $25,000 to $29,999 for women (72 | 53.7%).
| Income | Male | Female |
| $2,499 or less | 0 (0.0%) | 0 (0.0%) |
| $2,500 to $4,999 | 0 (0.0%) | 0 (0.0%) |
| $5,000 to $7,499 | 0 (0.0%) | 0 (0.0%) |
| $7,500 to $9,999 | 0 (0.0%) | 22 (16.4%) |
| $10,000 to $12,499 | 0 (0.0%) | 0 (0.0%) |
| $12,500 to $14,999 | 0 (0.0%) | 22 (16.4%) |
| $15,000 to $17,499 | 0 (0.0%) | 0 (0.0%) |
| $17,500 to $19,999 | 0 (0.0%) | 0 (0.0%) |
| $20,000 to $22,499 | 0 (0.0%) | 0 (0.0%) |
| $22,500 to $24,999 | 0 (0.0%) | 0 (0.0%) |
| $25,000 to $29,999 | 6 (10.2%) | 72 (53.7%) |
| $30,000 to $34,999 | 13 (22.0%) | 10 (7.5%) |
| $35,000 to $39,999 | 27 (45.8%) | 0 (0.0%) |
| $40,000 to $44,999 | 0 (0.0%) | 8 (6.0%) |
| $45,000 to $49,999 | 0 (0.0%) | 0 (0.0%) |
| $50,000 to $54,999 | 13 (22.0%) | 0 (0.0%) |
| $55,000 to $64,999 | 0 (0.0%) | 0 (0.0%) |
| $65,000 to $74,999 | 0 (0.0%) | 0 (0.0%) |
| $75,000 to $99,999 | 0 (0.0%) | 0 (0.0%) |
| $100,000+ | 0 (0.0%) | 0 (0.0%) |
| Total | 59 (100.0%) | 134 (100.0%) |
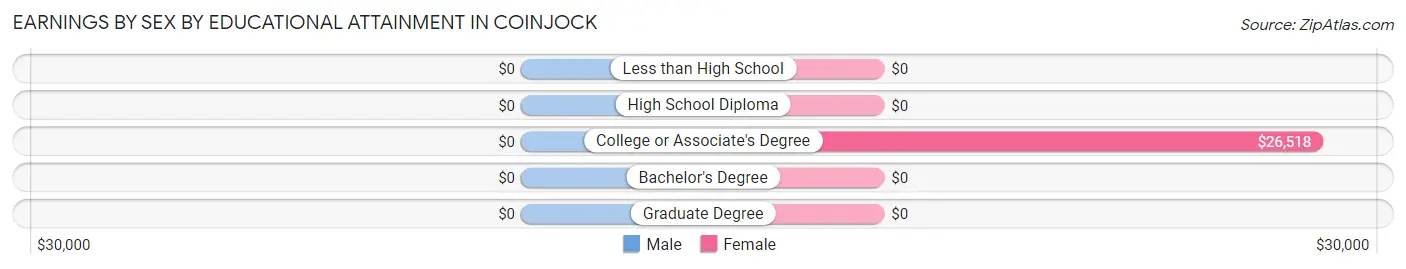
Earnings by Sex by Educational Attainment in Coinjock
| Educational Attainment | Male Income | Female Income |
| Less than High School | - | - |
| High School Diploma | - | - |
| College or Associate's Degree | - | - |
| Bachelor's Degree | - | - |
| Graduate Degree | - | - |
| Total | $35,972 | $27,024 |
Family Income in Coinjock
Family Income Brackets in Coinjock
According to the Coinjock family income data, there are 22 families falling into the $25,000 to $34,999 income range, which is the most common income bracket and makes up 27.9% of all families.
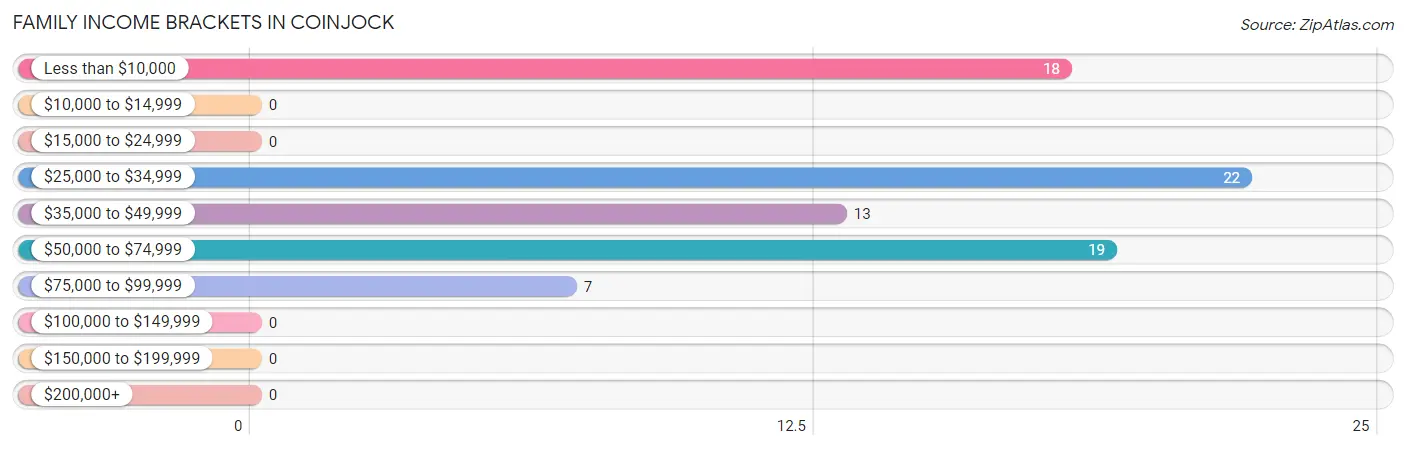
| Income Bracket | # Families | % Families |
| Less than $10,000 | 18 | 22.8% |
| $10,000 to $14,999 | 0 | 0.0% |
| $15,000 to $24,999 | 0 | 0.0% |
| $25,000 to $34,999 | 22 | 27.8% |
| $35,000 to $49,999 | 13 | 16.5% |
| $50,000 to $74,999 | 19 | 24.1% |
| $75,000 to $99,999 | 7 | 8.9% |
| $100,000 to $149,999 | 0 | 0.0% |
| $150,000 to $199,999 | 0 | 0.0% |
| $200,000+ | 0 | 0.0% |
Family Income by Famaliy Size in Coinjock
| Income Bracket | # Families | Median Income |
| 2-Person Families | 43 (54.4%) | $0 |
| 3-Person Families | 22 (27.9%) | $0 |
| 4-Person Families | 0 (0.0%) | $0 |
| 5-Person Families | 14 (17.7%) | $0 |
| 6-Person Families | 0 (0.0%) | $0 |
| 7+ Person Families | 0 (0.0%) | $0 |
| Total | 79 (100.0%) | $0 |
Family Income by Number of Earners in Coinjock
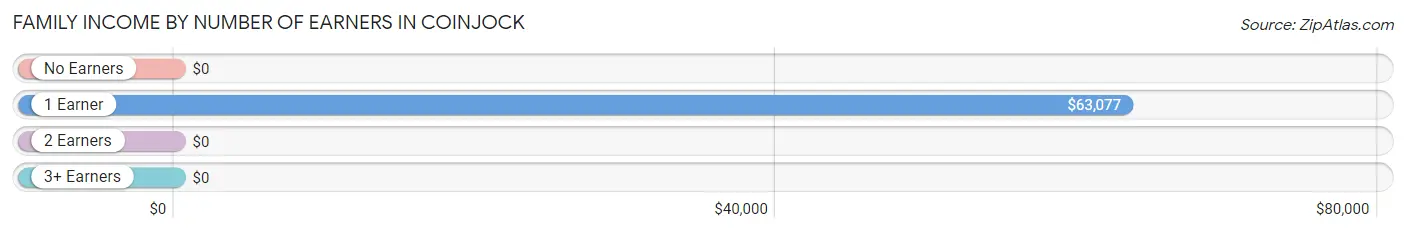
| Number of Earners | # Families | Median Income |
| No Earners | 25 (31.7%) | $0 |
| 1 Earner | 32 (40.5%) | $63,077 |
| 2 Earners | 22 (27.9%) | $0 |
| 3+ Earners | 0 (0.0%) | $0 |
| Total | 79 (100.0%) | $0 |
Household Income in Coinjock
Household Income Brackets in Coinjock
With 60 households falling in the category, the $50,000 to $74,999 income range is the most frequent in Coinjock, accounting for 41.7% of all households.
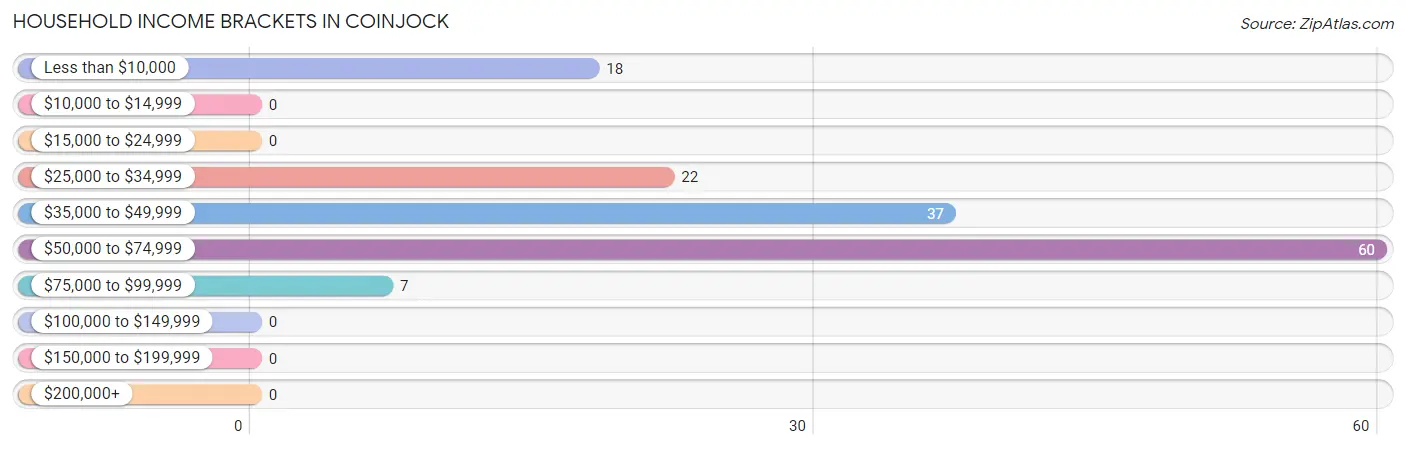
| Income Bracket | # Households | % Households |
| Less than $10,000 | 18 | 12.5% |
| $10,000 to $14,999 | 0 | 0.0% |
| $15,000 to $24,999 | 0 | 0.0% |
| $25,000 to $34,999 | 22 | 15.3% |
| $35,000 to $49,999 | 37 | 25.7% |
| $50,000 to $74,999 | 60 | 41.7% |
| $75,000 to $99,999 | 7 | 4.9% |
| $100,000 to $149,999 | 0 | 0.0% |
| $150,000 to $199,999 | 0 | 0.0% |
| $200,000+ | 0 | 0.0% |
Household Income by Householder Age in Coinjock
The median household income in Coinjock is $40,938, with the highest median household income of $61,435 found in the 25 to 44 years age bracket for the primary householder. A total of 75 households (52.1%) fall into this category.
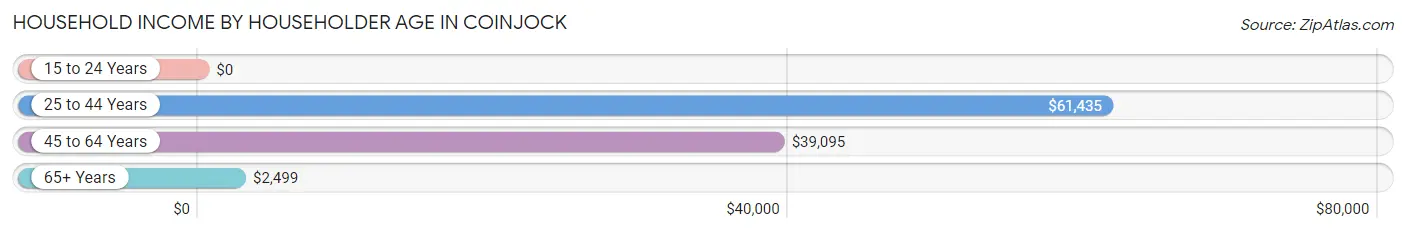
| Income Bracket | # Households | Median Income |
| 15 to 24 Years | 0 (0.0%) | $0 |
| 25 to 44 Years | 75 (52.1%) | $61,435 |
| 45 to 64 Years | 37 (25.7%) | $39,095 |
| 65+ Years | 32 (22.2%) | $2,499 |
| Total | 144 (100.0%) | $40,938 |
Poverty in Coinjock
Income Below Poverty by Sex and Age in Coinjock
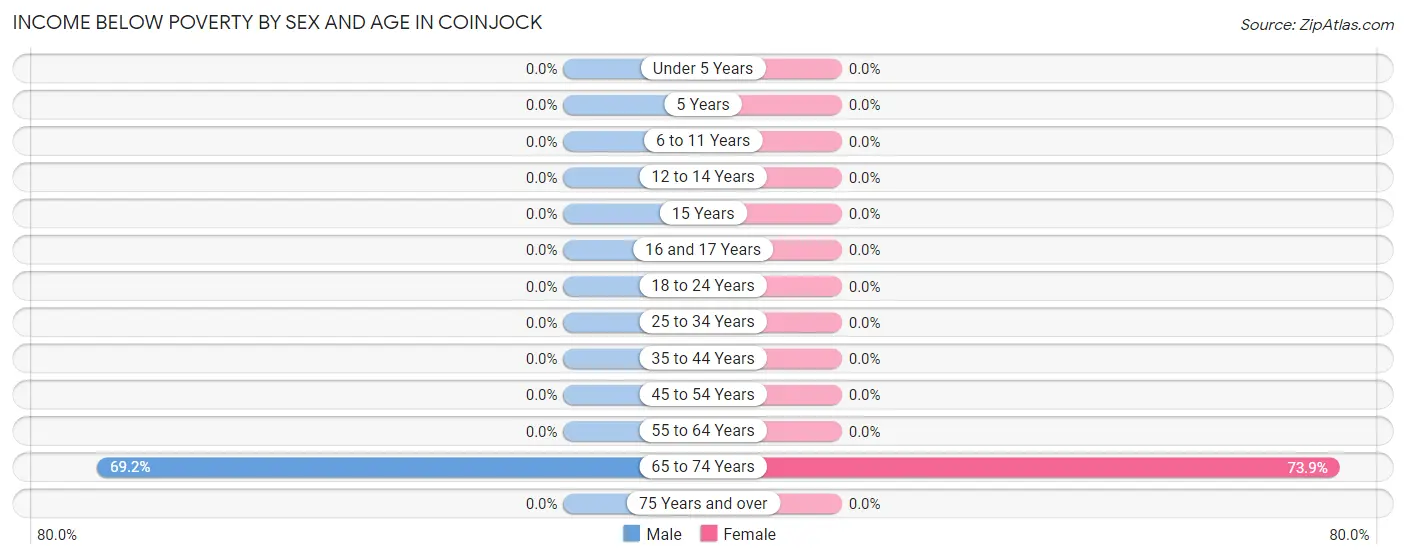
With 17.6% poverty level for males and 8.5% for females among the residents of Coinjock, 65 to 74 year old males and 65 to 74 year old females are the most vulnerable to poverty, with 18 males (69.2%) and 17 females (73.9%) in their respective age groups living below the poverty level.
| Age Bracket | Male | Female |
| Under 5 Years | 0 (0.0%) | 0 (0.0%) |
| 5 Years | 0 (0.0%) | 0 (0.0%) |
| 6 to 11 Years | 0 (0.0%) | 0 (0.0%) |
| 12 to 14 Years | 0 (0.0%) | 0 (0.0%) |
| 15 Years | 0 (0.0%) | 0 (0.0%) |
| 16 and 17 Years | 0 (0.0%) | 0 (0.0%) |
| 18 to 24 Years | 0 (0.0%) | 0 (0.0%) |
| 25 to 34 Years | 0 (0.0%) | 0 (0.0%) |
| 35 to 44 Years | 0 (0.0%) | 0 (0.0%) |
| 45 to 54 Years | 0 (0.0%) | 0 (0.0%) |
| 55 to 64 Years | 0 (0.0%) | 0 (0.0%) |
| 65 to 74 Years | 18 (69.2%) | 17 (73.9%) |
| 75 Years and over | 0 (0.0%) | 0 (0.0%) |
| Total | 18 (17.6%) | 17 (8.5%) |
Income Above Poverty by Sex and Age in Coinjock
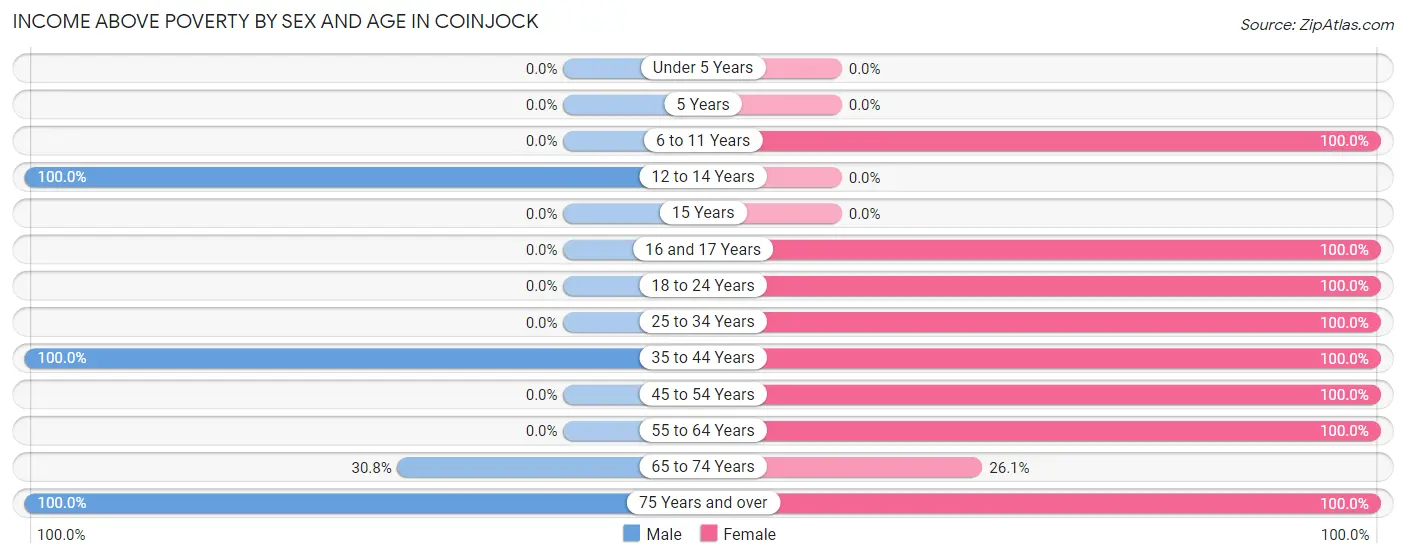
According to the poverty statistics in Coinjock, males aged 12 to 14 years and females aged 6 to 11 years are the age groups that are most secure financially, with 100.0% of males and 100.0% of females in these age groups living above the poverty line.
| Age Bracket | Male | Female |
| Under 5 Years | 0 (0.0%) | 0 (0.0%) |
| 5 Years | 0 (0.0%) | 0 (0.0%) |
| 6 to 11 Years | 0 (0.0%) | 18 (100.0%) |
| 12 to 14 Years | 5 (100.0%) | 0 (0.0%) |
| 15 Years | 0 (0.0%) | 0 (0.0%) |
| 16 and 17 Years | 0 (0.0%) | 3 (100.0%) |
| 18 to 24 Years | 0 (0.0%) | 23 (100.0%) |
| 25 to 34 Years | 0 (0.0%) | 52 (100.0%) |
| 35 to 44 Years | 65 (100.0%) | 32 (100.0%) |
| 45 to 54 Years | 0 (0.0%) | 1 (100.0%) |
| 55 to 64 Years | 0 (0.0%) | 38 (100.0%) |
| 65 to 74 Years | 8 (30.8%) | 6 (26.1%) |
| 75 Years and over | 6 (100.0%) | 9 (100.0%) |
| Total | 84 (82.4%) | 182 (91.5%) |
Income Below Poverty Among Married-Couple Families in Coinjock
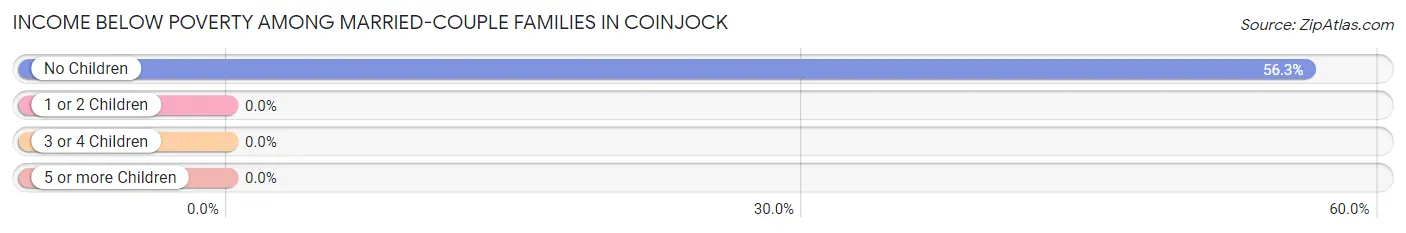
The poverty statistics for married-couple families in Coinjock show that 40.0% or 18 of the total 45 families live below the poverty line. Families with no children have the highest poverty rate of 56.2%, comprising of 18 families. On the other hand, families with 3 or 4 children have the lowest poverty rate of 0.0%, which includes 0 families.
| Children | Above Poverty | Below Poverty |
| No Children | 14 (43.8%) | 18 (56.2%) |
| 1 or 2 Children | 0 (0.0%) | 0 (0.0%) |
| 3 or 4 Children | 13 (100.0%) | 0 (0.0%) |
| 5 or more Children | 0 (0.0%) | 0 (0.0%) |
| Total | 27 (60.0%) | 18 (40.0%) |
Income Below Poverty Among Single-Parent Households in Coinjock
| Children | Single Father | Single Mother |
| No Children | 0 (0.0%) | 0 (0.0%) |
| 1 or 2 Children | 0 (0.0%) | 0 (0.0%) |
| 3 or 4 Children | 0 (0.0%) | 0 (0.0%) |
| 5 or more Children | 0 (0.0%) | 0 (0.0%) |
| Total | 0 (0.0%) | 0 (0.0%) |
Income Below Poverty Among Married-Couple vs Single-Parent Households in Coinjock
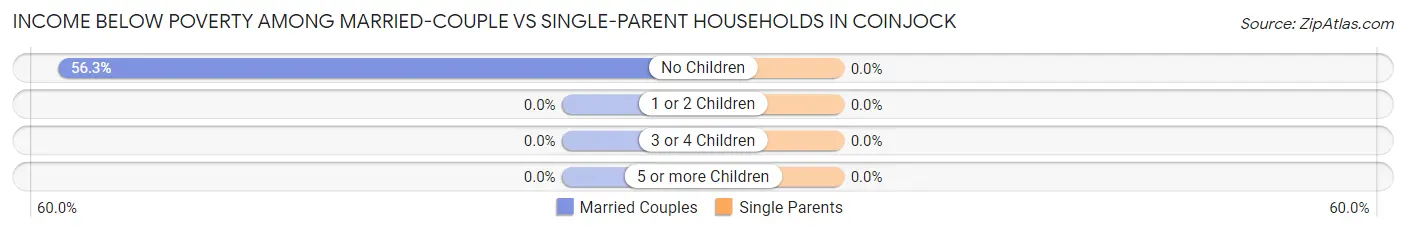
| Children | Married-Couple Families | Single-Parent Households |
| No Children | 18 (56.2%) | 0 (0.0%) |
| 1 or 2 Children | 0 (0.0%) | 0 (0.0%) |
| 3 or 4 Children | 0 (0.0%) | 0 (0.0%) |
| 5 or more Children | 0 (0.0%) | 0 (0.0%) |
| Total | 18 (40.0%) | 0 (0.0%) |
Race in Coinjock
The most populous races in Coinjock are White / Caucasian (229 | 76.1%), Hispanic or Latino (39 | 13.0%), and Some other Race (35 | 11.6%).
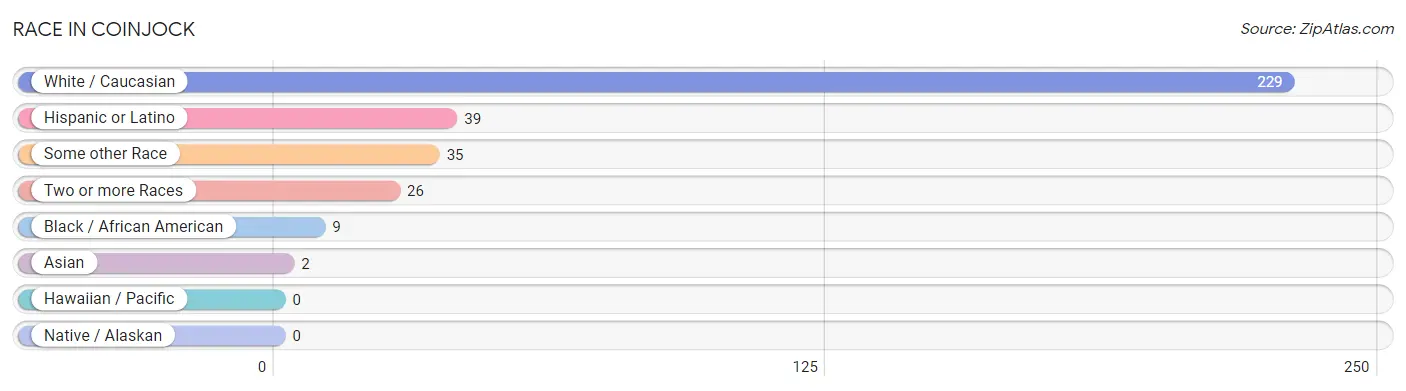
| Race | # Population | % Population |
| Asian | 2 | 0.7% |
| Black / African American | 9 | 3.0% |
| Hawaiian / Pacific | 0 | 0.0% |
| Hispanic or Latino | 39 | 13.0% |
| Native / Alaskan | 0 | 0.0% |
| White / Caucasian | 229 | 76.1% |
| Two or more Races | 26 | 8.6% |
| Some other Race | 35 | 11.6% |
| Total | 301 | 100.0% |
Ancestry in Coinjock
The most populous ancestries reported in Coinjock are American (94 | 31.2%), German (94 | 31.2%), Irish (55 | 18.3%), Scotch-Irish (28 | 9.3%), and Puerto Rican (25 | 8.3%), together accounting for 98.3% of all Coinjock residents.
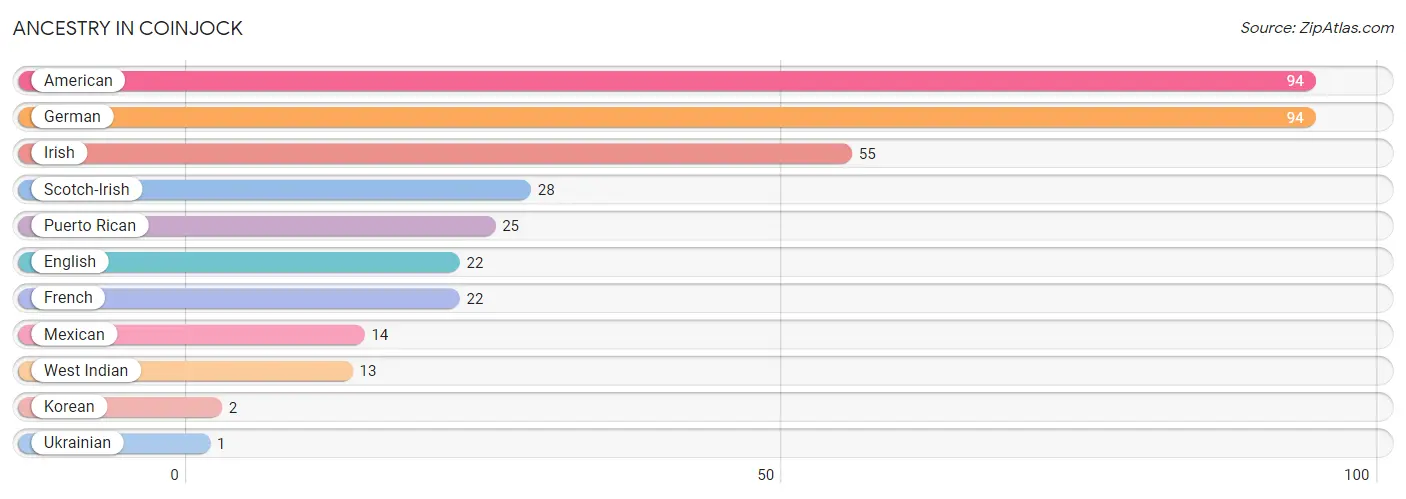
| Ancestry | # Population | % Population |
| American | 94 | 31.2% |
| English | 22 | 7.3% |
| French | 22 | 7.3% |
| German | 94 | 31.2% |
| Irish | 55 | 18.3% |
| Korean | 2 | 0.7% |
| Mexican | 14 | 4.6% |
| Puerto Rican | 25 | 8.3% |
| Scotch-Irish | 28 | 9.3% |
| Ukrainian | 1 | 0.3% |
| West Indian | 13 | 4.3% | View All 11 Rows |
Immigrants in Coinjock
The most numerous immigrant groups reported in Coinjock came from Asia (2 | 0.7%), Philippines (2 | 0.7%), South Eastern Asia (2 | 0.7%), Eastern Europe (1 | 0.3%), and Europe (1 | 0.3%), together accounting for 2.6% of all Coinjock residents.
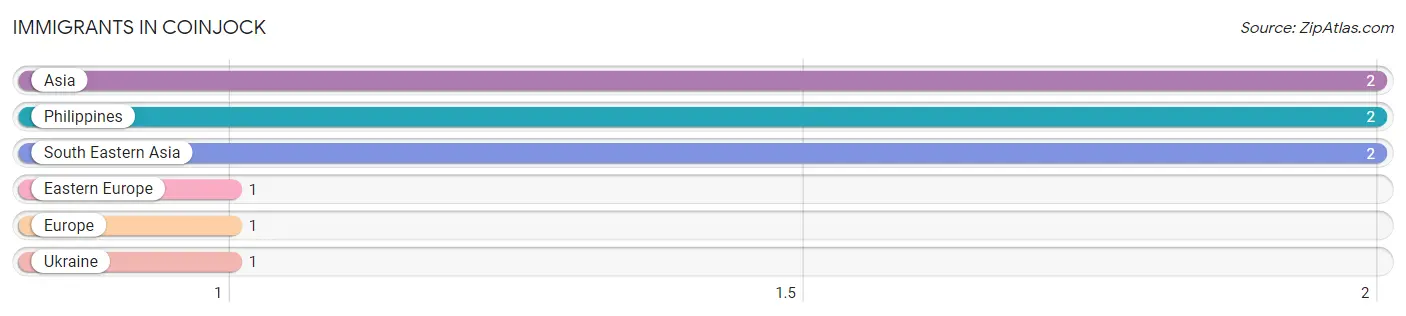
| Immigration Origin | # Population | % Population |
| Asia | 2 | 0.7% |
| Eastern Europe | 1 | 0.3% |
| Europe | 1 | 0.3% |
| Philippines | 2 | 0.7% |
| South Eastern Asia | 2 | 0.7% |
| Ukraine | 1 | 0.3% | View All 6 Rows |
Sex and Age in Coinjock
Sex and Age in Coinjock
The most populous age groups in Coinjock are 35 to 39 Years (52 | 51.0%) for men and 25 to 29 Years (42 | 21.1%) for women.
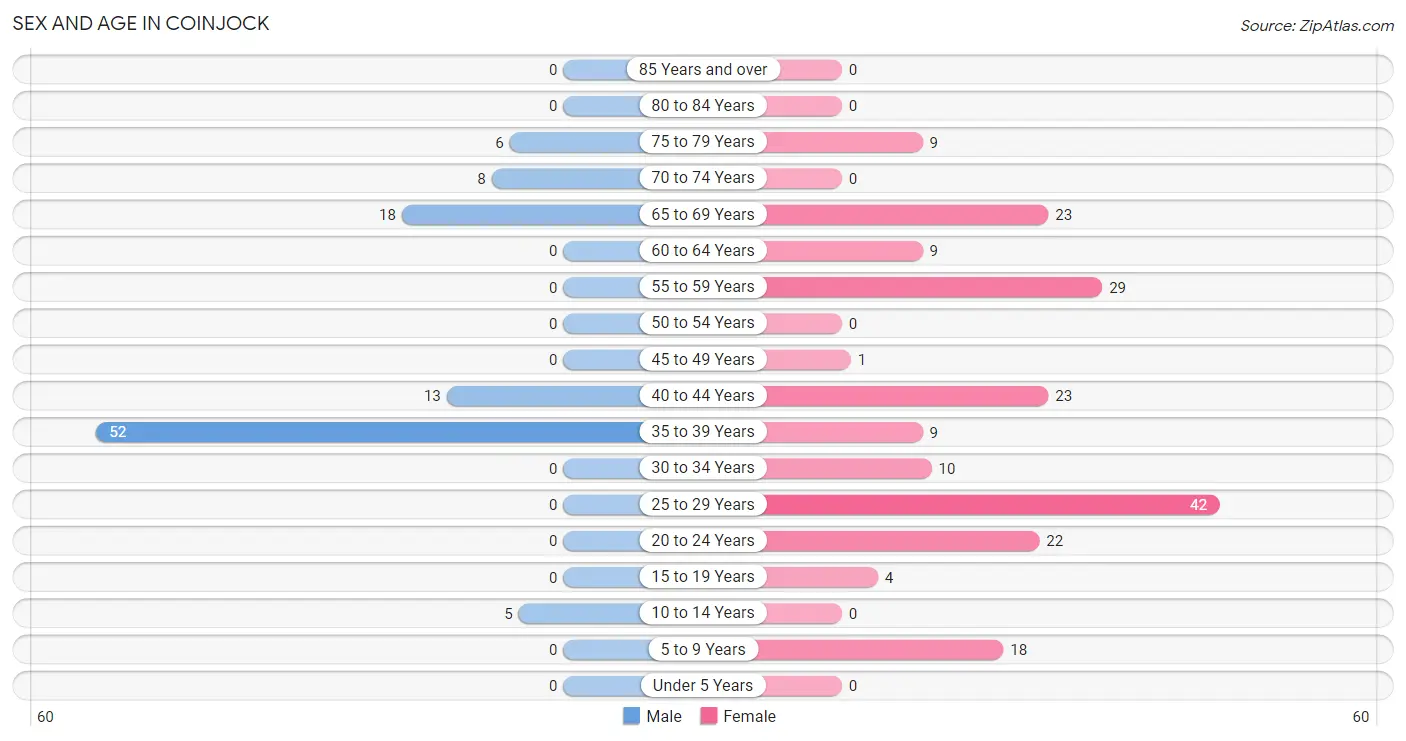
| Age Bracket | Male | Female |
| Under 5 Years | 0 (0.0%) | 0 (0.0%) |
| 5 to 9 Years | 0 (0.0%) | 18 (9.0%) |
| 10 to 14 Years | 5 (4.9%) | 0 (0.0%) |
| 15 to 19 Years | 0 (0.0%) | 4 (2.0%) |
| 20 to 24 Years | 0 (0.0%) | 22 (11.1%) |
| 25 to 29 Years | 0 (0.0%) | 42 (21.1%) |
| 30 to 34 Years | 0 (0.0%) | 10 (5.0%) |
| 35 to 39 Years | 52 (51.0%) | 9 (4.5%) |
| 40 to 44 Years | 13 (12.8%) | 23 (11.6%) |
| 45 to 49 Years | 0 (0.0%) | 1 (0.5%) |
| 50 to 54 Years | 0 (0.0%) | 0 (0.0%) |
| 55 to 59 Years | 0 (0.0%) | 29 (14.6%) |
| 60 to 64 Years | 0 (0.0%) | 9 (4.5%) |
| 65 to 69 Years | 18 (17.6%) | 23 (11.6%) |
| 70 to 74 Years | 8 (7.8%) | 0 (0.0%) |
| 75 to 79 Years | 6 (5.9%) | 9 (4.5%) |
| 80 to 84 Years | 0 (0.0%) | 0 (0.0%) |
| 85 Years and over | 0 (0.0%) | 0 (0.0%) |
| Total | 102 (100.0%) | 199 (100.0%) |
Families and Households in Coinjock
Median Family Size in Coinjock
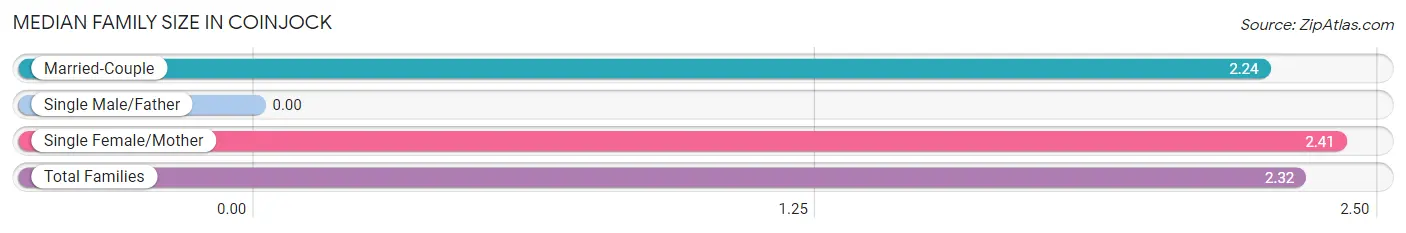
| Family Type | # Families | Family Size |
| Married-Couple | 45 (57.0%) | 2.24 |
| Single Male/Father | 0 (0.0%) | - |
| Single Female/Mother | 34 (43.0%) | 2.41 |
| Total Families | 79 (100.0%) | 2.32 |
Median Household Size in Coinjock
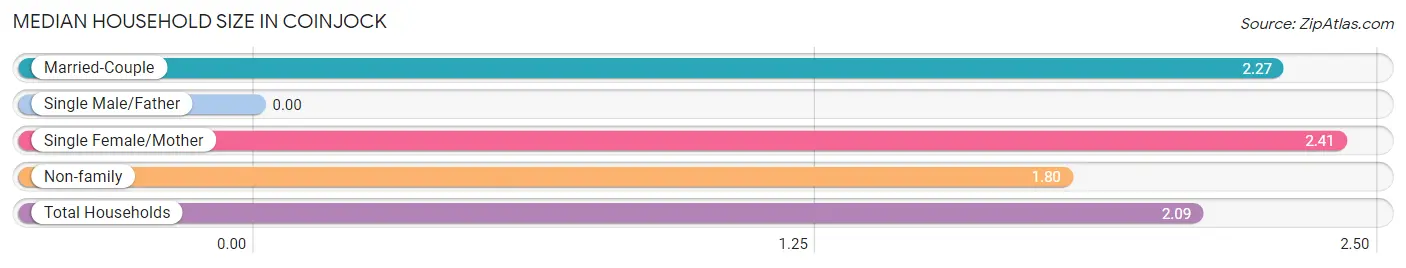
| Household Type | # Households | Household Size |
| Married-Couple | 45 (31.2%) | 2.27 |
| Single Male/Father | 0 (0.0%) | - |
| Single Female/Mother | 34 (23.6%) | 2.41 |
| Non-family | 65 (45.1%) | 1.80 |
| Total Households | 144 (100.0%) | 2.09 |
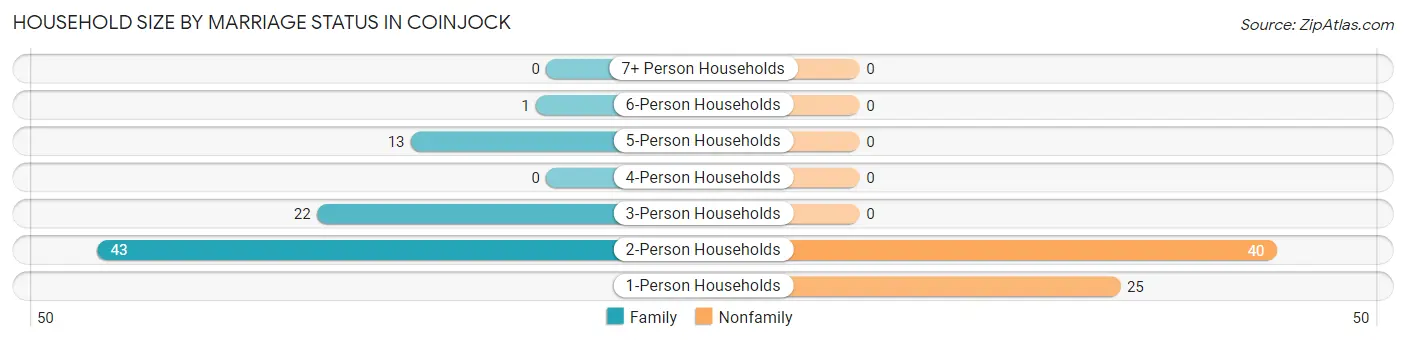
Household Size by Marriage Status in Coinjock
Out of a total of 144 households in Coinjock, 79 (54.9%) are family households, while 65 (45.1%) are nonfamily households. The most numerous type of family households are 2-person households, comprising 43, and the most common type of nonfamily households are 2-person households, comprising 40.
| Household Size | Family Households | Nonfamily Households |
| 1-Person Households | - | 25 (17.4%) |
| 2-Person Households | 43 (29.9%) | 40 (27.8%) |
| 3-Person Households | 22 (15.3%) | 0 (0.0%) |
| 4-Person Households | 0 (0.0%) | 0 (0.0%) |
| 5-Person Households | 13 (9.0%) | 0 (0.0%) |
| 6-Person Households | 1 (0.7%) | 0 (0.0%) |
| 7+ Person Households | 0 (0.0%) | 0 (0.0%) |
| Total | 79 (54.9%) | 65 (45.1%) |
Female Fertility in Coinjock
Fertility by Age in Coinjock
| Age Bracket | Women with Births | Births / 1,000 Women |
| 15 to 19 years | 0 (0.0%) | 0.0 |
| 20 to 34 years | 0 (0.0%) | 0.0 |
| 35 to 50 years | 0 (0.0%) | 0.0 |
| Total | 0 (0.0%) | 0.0 |
Fertility by Age by Marriage Status in Coinjock
| Age Bracket | Married | Unmarried |
| 15 to 19 years | 0 (0.0%) | 0 (0.0%) |
| 20 to 34 years | 0 (0.0%) | 0 (0.0%) |
| 35 to 50 years | 0 (0.0%) | 0 (0.0%) |
| Total | 0 (0.0%) | 0 (0.0%) |
Fertility by Education in Coinjock
| Educational Attainment | Women with Births | Births / 1,000 Women |
| Less than High School | 0 (0.0%) | 0.0 |
| High School Diploma | 0 (0.0%) | 0.0 |
| College or Associate's Degree | 0 (0.0%) | 0.0 |
| Bachelor's Degree | 0 (0.0%) | 0.0 |
| Graduate Degree | 0 (0.0%) | 0.0 |
| Total | 0 (0.0%) | 0.0 |
Fertility by Education by Marriage Status in Coinjock
| Educational Attainment | Married | Unmarried |
| Less than High School | 0 (0.0%) | 0 (0.0%) |
| High School Diploma | 0 (0.0%) | 0 (0.0%) |
| College or Associate's Degree | 0 (0.0%) | 0 (0.0%) |
| Bachelor's Degree | 0 (0.0%) | 0 (0.0%) |
| Graduate Degree | 0 (0.0%) | 0 (0.0%) |
| Total | 0 (0.0%) | 0 (0.0%) |
Employment Characteristics in Coinjock
Employment by Class of Employer in Coinjock
Among the 193 employed individuals in Coinjock, private company employees (117 | 60.6%), self-employed (not incorporated) (41 | 21.2%), and local government employees (13 | 6.7%) make up the most common classes of employment.
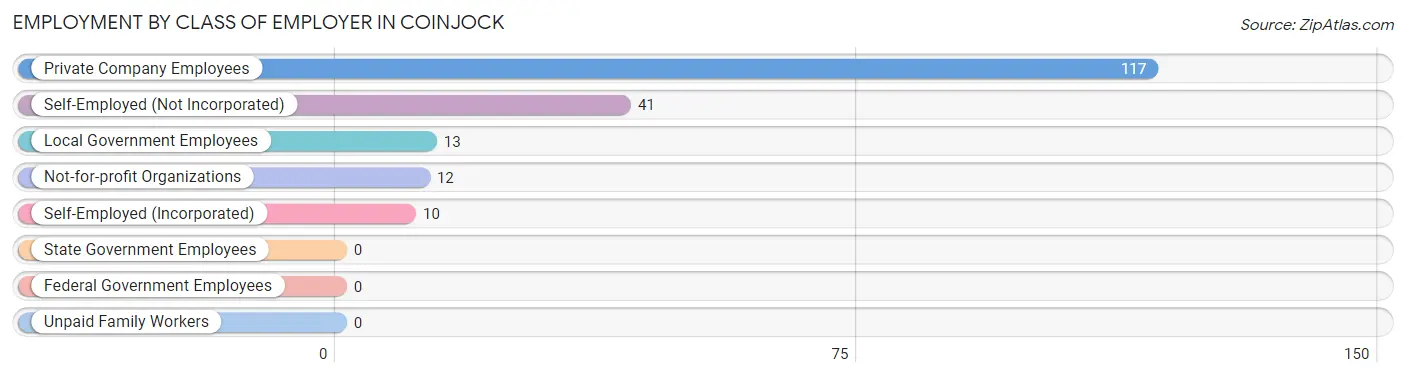
| Employer Class | # Employees | % Employees |
| Private Company Employees | 117 | 60.6% |
| Self-Employed (Incorporated) | 10 | 5.2% |
| Self-Employed (Not Incorporated) | 41 | 21.2% |
| Not-for-profit Organizations | 12 | 6.2% |
| Local Government Employees | 13 | 6.7% |
| State Government Employees | 0 | 0.0% |
| Federal Government Employees | 0 | 0.0% |
| Unpaid Family Workers | 0 | 0.0% |
| Total | 193 | 100.0% |
Employment Status by Age in Coinjock
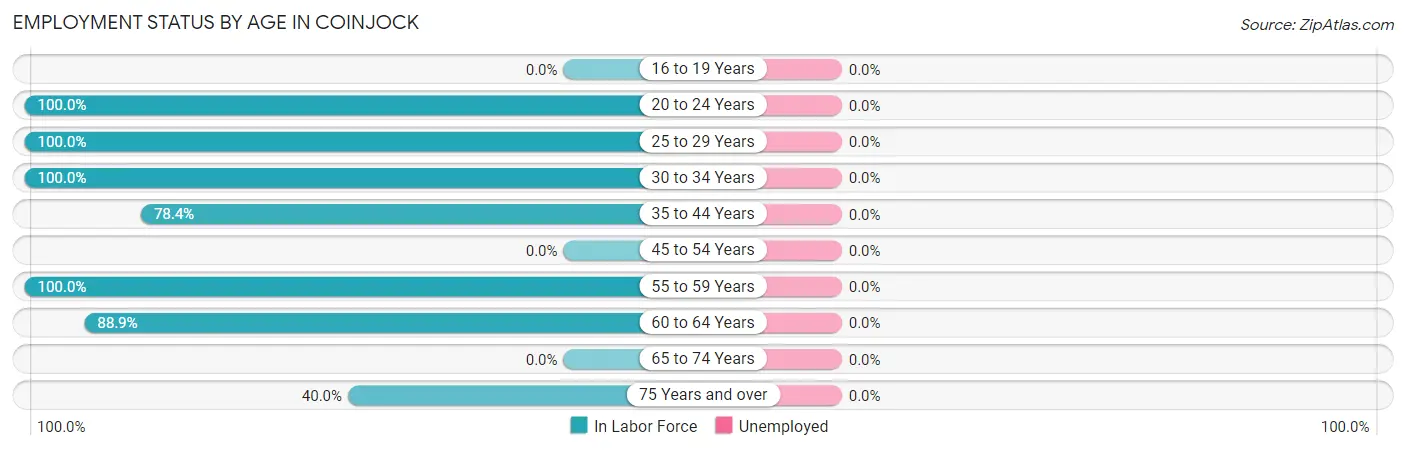
| Age Bracket | In Labor Force | Unemployed |
| 16 to 19 Years | 0 (0.0%) | 0 (0.0%) |
| 20 to 24 Years | 22 (100.0%) | 0 (0.0%) |
| 25 to 29 Years | 42 (100.0%) | 0 (0.0%) |
| 30 to 34 Years | 10 (100.0%) | 0 (0.0%) |
| 35 to 44 Years | 76 (78.4%) | 0 (0.0%) |
| 45 to 54 Years | 0 (0.0%) | 0 (0.0%) |
| 55 to 59 Years | 29 (100.0%) | 0 (0.0%) |
| 60 to 64 Years | 8 (88.9%) | 0 (0.0%) |
| 65 to 74 Years | 0 (0.0%) | 0 (0.0%) |
| 75 Years and over | 6 (40.0%) | 0 (0.0%) |
| Total | 193 (69.4%) | 0 (0.0%) |
Employment Status by Educational Attainment in Coinjock
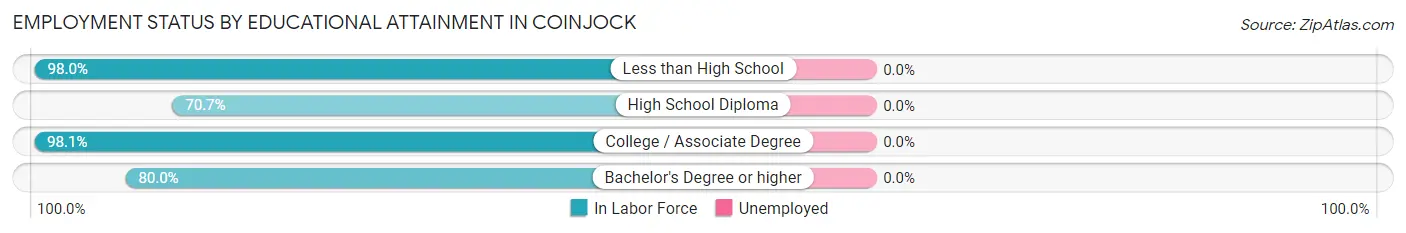
| Educational Attainment | In Labor Force | Unemployed |
| Less than High School | 49 (98.0%) | 0 (0.0%) |
| High School Diploma | 29 (70.7%) | 0 (0.0%) |
| College / Associate Degree | 51 (98.1%) | 0 (0.0%) |
| Bachelor's Degree or higher | 36 (80.0%) | 0 (0.0%) |
| Total | 165 (87.8%) | 0 (0.0%) |
Employment Occupations by Sex in Coinjock
Management, Business, Science and Arts Occupations
The most common Management, Business, Science and Arts occupations in Coinjock are Management (27 | 14.0%), and Business & Financial (13 | 6.7%).
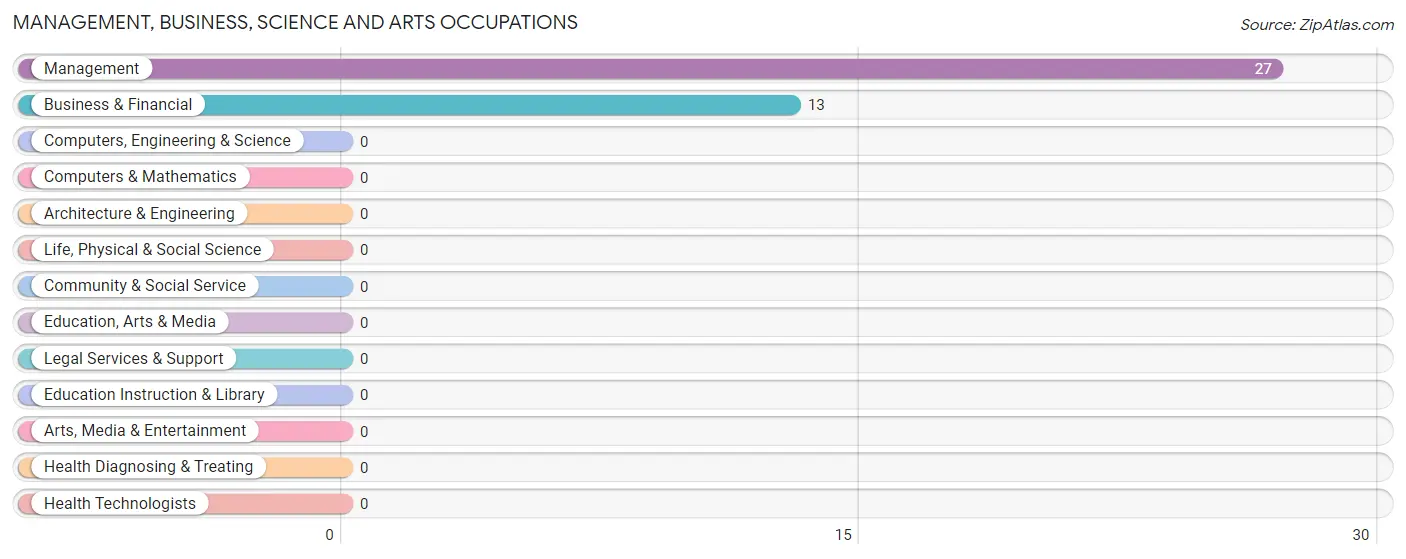
Management, Business, Science and Arts Occupations by Sex
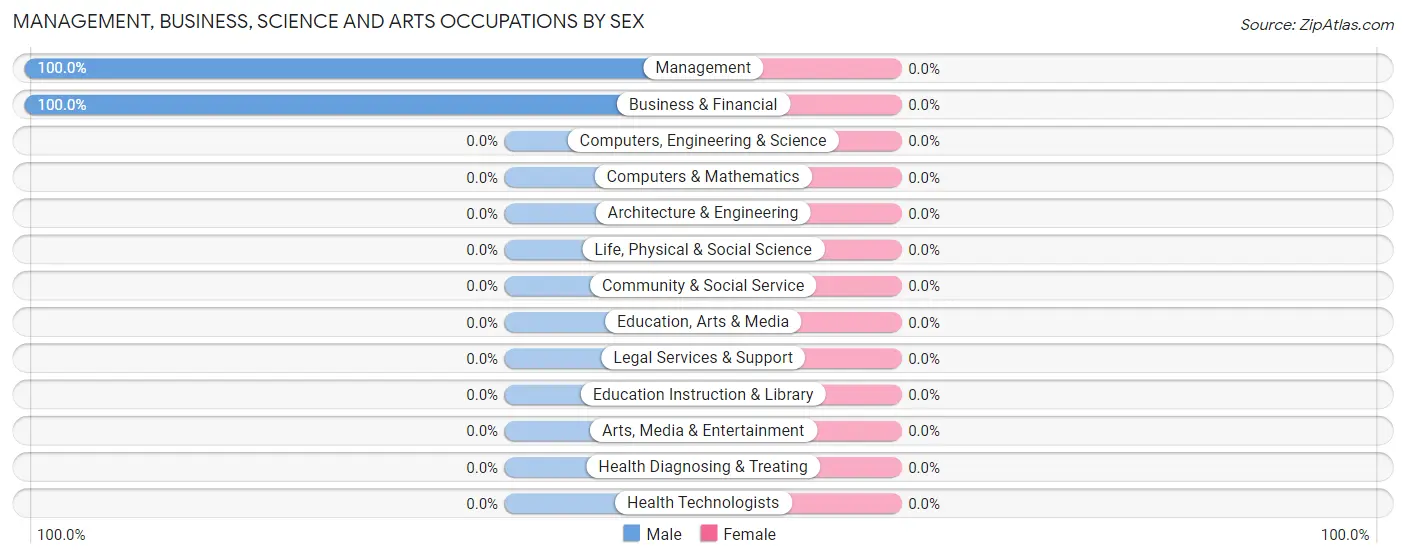
| Occupation | Male | Female |
| Management | 27 (100.0%) | 0 (0.0%) |
| Business & Financial | 13 (100.0%) | 0 (0.0%) |
| Computers, Engineering & Science | 0 (0.0%) | 0 (0.0%) |
| Computers & Mathematics | 0 (0.0%) | 0 (0.0%) |
| Architecture & Engineering | 0 (0.0%) | 0 (0.0%) |
| Life, Physical & Social Science | 0 (0.0%) | 0 (0.0%) |
| Community & Social Service | 0 (0.0%) | 0 (0.0%) |
| Education, Arts & Media | 0 (0.0%) | 0 (0.0%) |
| Legal Services & Support | 0 (0.0%) | 0 (0.0%) |
| Education Instruction & Library | 0 (0.0%) | 0 (0.0%) |
| Arts, Media & Entertainment | 0 (0.0%) | 0 (0.0%) |
| Health Diagnosing & Treating | 0 (0.0%) | 0 (0.0%) |
| Health Technologists | 0 (0.0%) | 0 (0.0%) |
| Total (Category) | 40 (100.0%) | 0 (0.0%) |
| Total (Overall) | 59 (30.6%) | 134 (69.4%) |
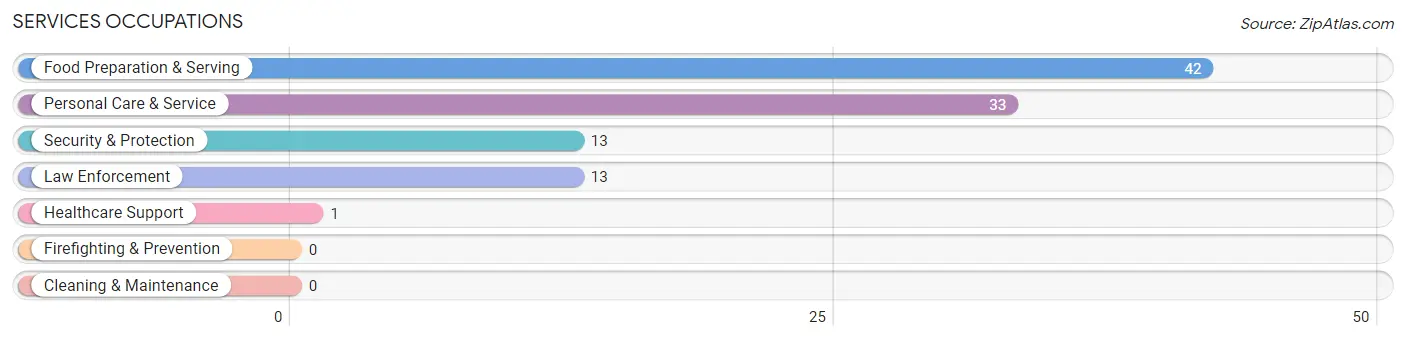
Services Occupations
The most common Services occupations in Coinjock are Food Preparation & Serving (42 | 21.8%), Personal Care & Service (33 | 17.1%), Security & Protection (13 | 6.7%), Law Enforcement (13 | 6.7%), and Healthcare Support (1 | 0.5%).
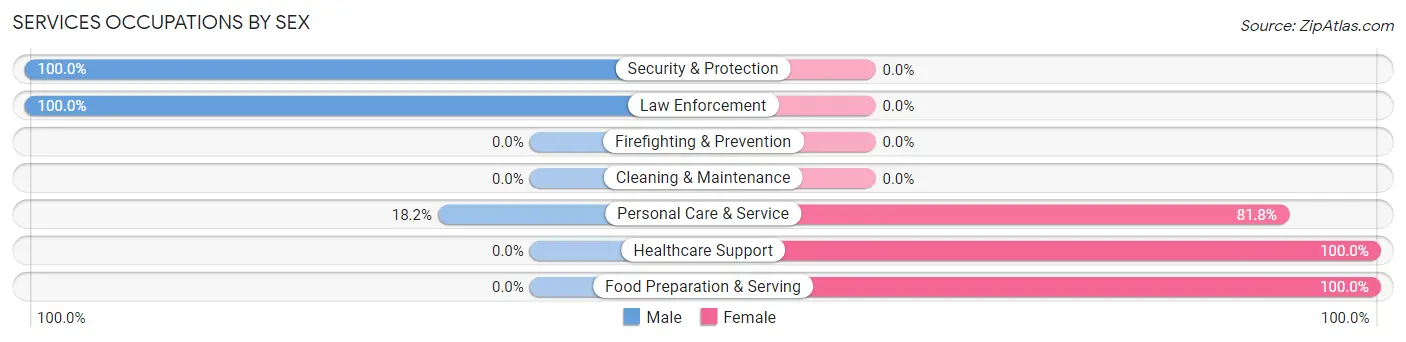
Services Occupations by Sex
Within the Services occupations in Coinjock, the most male-oriented occupations are Security & Protection (100.0%), Law Enforcement (100.0%), and Personal Care & Service (18.2%), while the most female-oriented occupations are Healthcare Support (100.0%), Food Preparation & Serving (100.0%), and Personal Care & Service (81.8%).
| Occupation | Male | Female |
| Healthcare Support | 0 (0.0%) | 1 (100.0%) |
| Security & Protection | 13 (100.0%) | 0 (0.0%) |
| Firefighting & Prevention | 0 (0.0%) | 0 (0.0%) |
| Law Enforcement | 13 (100.0%) | 0 (0.0%) |
| Food Preparation & Serving | 0 (0.0%) | 42 (100.0%) |
| Cleaning & Maintenance | 0 (0.0%) | 0 (0.0%) |
| Personal Care & Service | 6 (18.2%) | 27 (81.8%) |
| Total (Category) | 19 (21.3%) | 70 (78.6%) |
| Total (Overall) | 59 (30.6%) | 134 (69.4%) |
Sales and Office Occupations
The most common Sales and Office occupations in Coinjock are , and Sales & Related (56 | 29.0%).
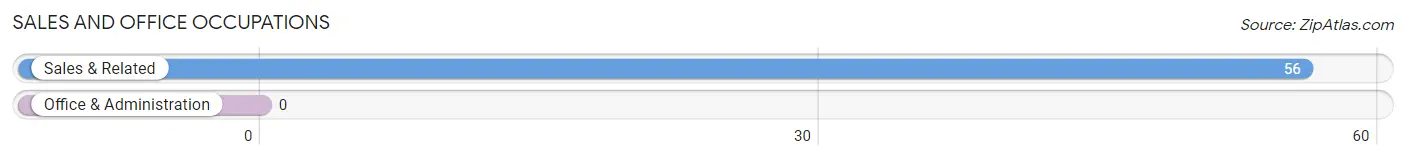
Sales and Office Occupations by Sex
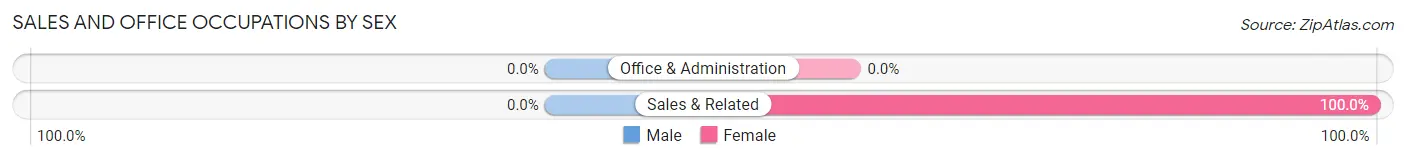
| Occupation | Male | Female |
| Sales & Related | 0 (0.0%) | 56 (100.0%) |
| Office & Administration | 0 (0.0%) | 0 (0.0%) |
| Total (Category) | 0 (0.0%) | 56 (100.0%) |
| Total (Overall) | 59 (30.6%) | 134 (69.4%) |
Natural Resources, Construction and Maintenance Occupations
The most common Natural Resources, Construction and Maintenance occupations in Coinjock are , and Installation, Maintenance & Repair (8 | 4.2%).
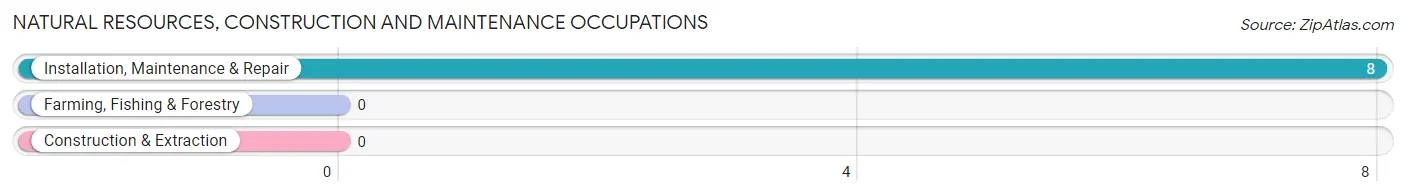
Natural Resources, Construction and Maintenance Occupations by Sex
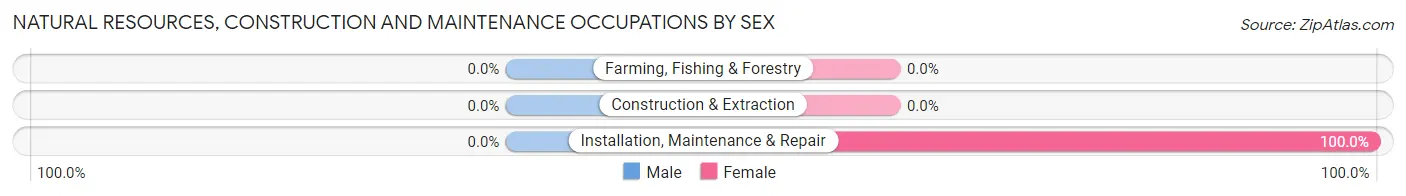
| Occupation | Male | Female |
| Farming, Fishing & Forestry | 0 (0.0%) | 0 (0.0%) |
| Construction & Extraction | 0 (0.0%) | 0 (0.0%) |
| Installation, Maintenance & Repair | 0 (0.0%) | 8 (100.0%) |
| Total (Category) | 0 (0.0%) | 8 (100.0%) |
| Total (Overall) | 59 (30.6%) | 134 (69.4%) |
Production, Transportation and Moving Occupations
Production, Transportation and Moving Occupations by Sex
| Occupation | Male | Female |
| Production | 0 (0.0%) | 0 (0.0%) |
| Transportation | 0 (0.0%) | 0 (0.0%) |
| Material Moving | 0 (0.0%) | 0 (0.0%) |
| Total (Category) | 0 (0.0%) | 0 (0.0%) |
| Total (Overall) | 59 (30.6%) | 134 (69.4%) |
Employment Industries by Sex in Coinjock
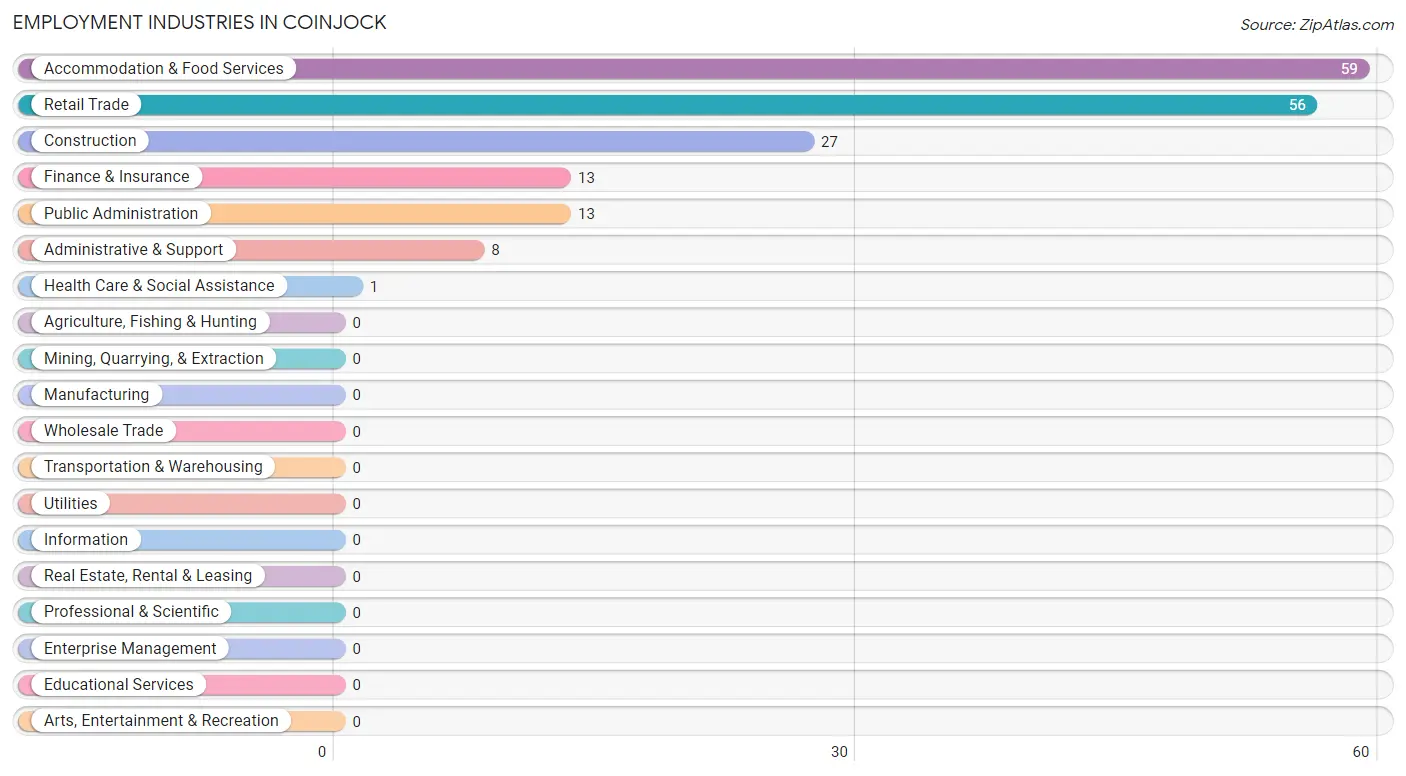
Employment Industries in Coinjock
The major employment industries in Coinjock include Accommodation & Food Services (59 | 30.6%), Retail Trade (56 | 29.0%), Construction (27 | 14.0%), Finance & Insurance (13 | 6.7%), and Public Administration (13 | 6.7%).
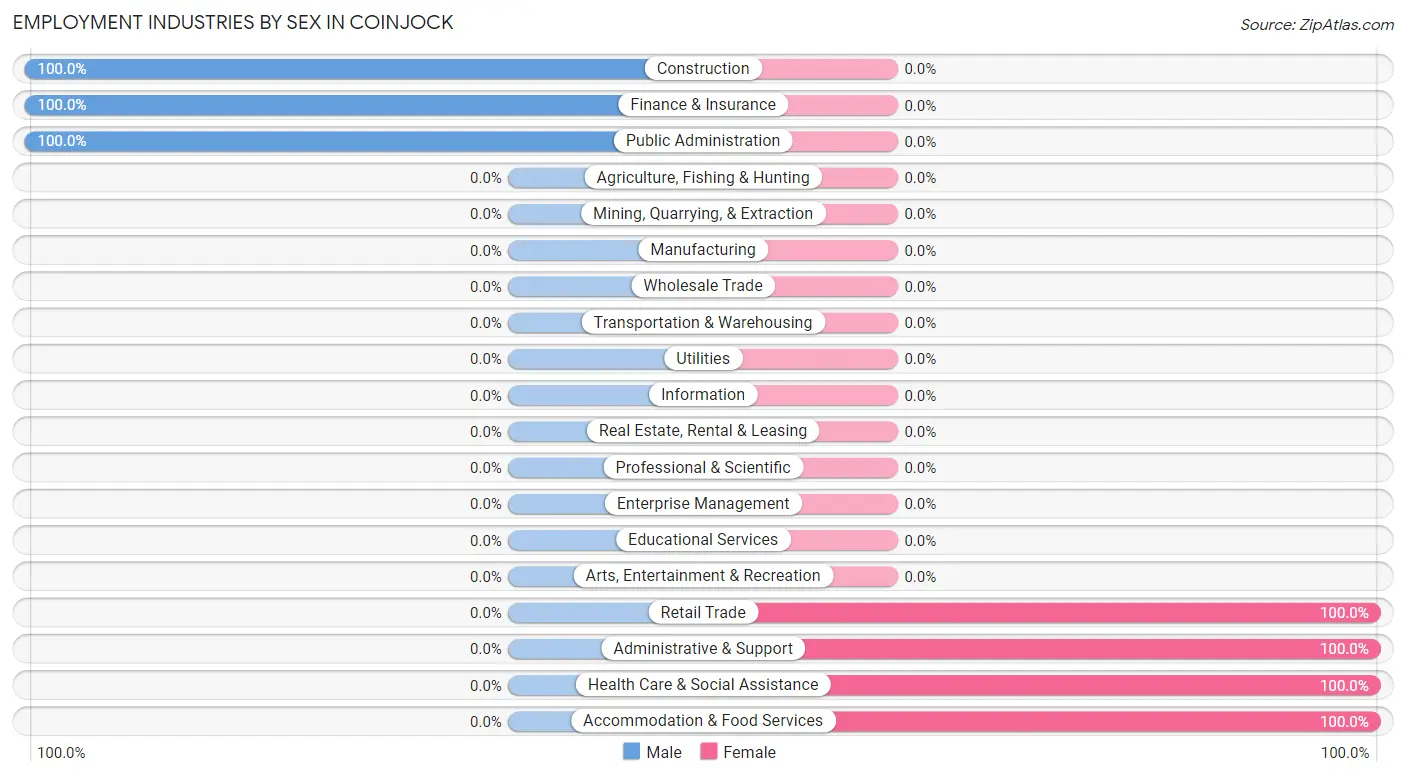
Employment Industries by Sex in Coinjock
The Coinjock industries that see more men than women are Construction (100.0%), Finance & Insurance (100.0%), and Public Administration (100.0%), whereas the industries that tend to have a higher number of women are Retail Trade (100.0%), Administrative & Support (100.0%), and Health Care & Social Assistance (100.0%).
| Industry | Male | Female |
| Agriculture, Fishing & Hunting | 0 (0.0%) | 0 (0.0%) |
| Mining, Quarrying, & Extraction | 0 (0.0%) | 0 (0.0%) |
| Construction | 27 (100.0%) | 0 (0.0%) |
| Manufacturing | 0 (0.0%) | 0 (0.0%) |
| Wholesale Trade | 0 (0.0%) | 0 (0.0%) |
| Retail Trade | 0 (0.0%) | 56 (100.0%) |
| Transportation & Warehousing | 0 (0.0%) | 0 (0.0%) |
| Utilities | 0 (0.0%) | 0 (0.0%) |
| Information | 0 (0.0%) | 0 (0.0%) |
| Finance & Insurance | 13 (100.0%) | 0 (0.0%) |
| Real Estate, Rental & Leasing | 0 (0.0%) | 0 (0.0%) |
| Professional & Scientific | 0 (0.0%) | 0 (0.0%) |
| Enterprise Management | 0 (0.0%) | 0 (0.0%) |
| Administrative & Support | 0 (0.0%) | 8 (100.0%) |
| Educational Services | 0 (0.0%) | 0 (0.0%) |
| Health Care & Social Assistance | 0 (0.0%) | 1 (100.0%) |
| Arts, Entertainment & Recreation | 0 (0.0%) | 0 (0.0%) |
| Accommodation & Food Services | 0 (0.0%) | 59 (100.0%) |
| Public Administration | 13 (100.0%) | 0 (0.0%) |
| Total | 59 (30.6%) | 134 (69.4%) |
Education in Coinjock
School Enrollment in Coinjock
The most common levels of schooling among the 27 students in Coinjock are elementary school (18 | 66.7%), middle school (5 | 18.5%), and high school (3 | 11.1%).
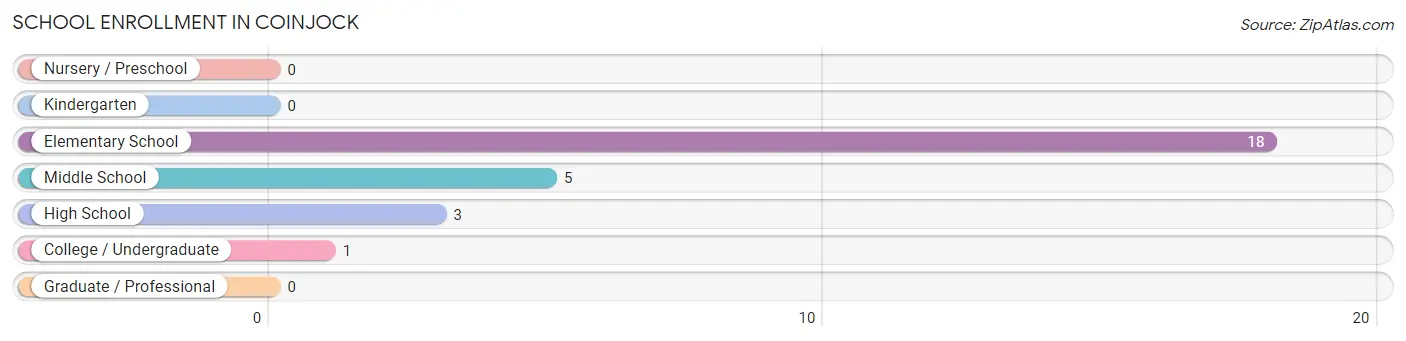
| School Level | # Students | % Students |
| Nursery / Preschool | 0 | 0.0% |
| Kindergarten | 0 | 0.0% |
| Elementary School | 18 | 66.7% |
| Middle School | 5 | 18.5% |
| High School | 3 | 11.1% |
| College / Undergraduate | 1 | 3.7% |
| Graduate / Professional | 0 | 0.0% |
| Total | 27 | 100.0% |
School Enrollment by Age by Funding Source in Coinjock
Out of a total of 27 students who are enrolled in schools in Coinjock, 13 (48.1%) attend a private institution, while the remaining 14 (51.9%) are enrolled in public schools. The age group of 10 to 14 year olds has the highest likelihood of being enrolled in private schools, with 5 (100.0% in the age bracket) enrolled. Conversely, the age group of 5 to 9 year old has the lowest likelihood of being enrolled in a private school, with 14 (77.8% in the age bracket) attending a public institution.
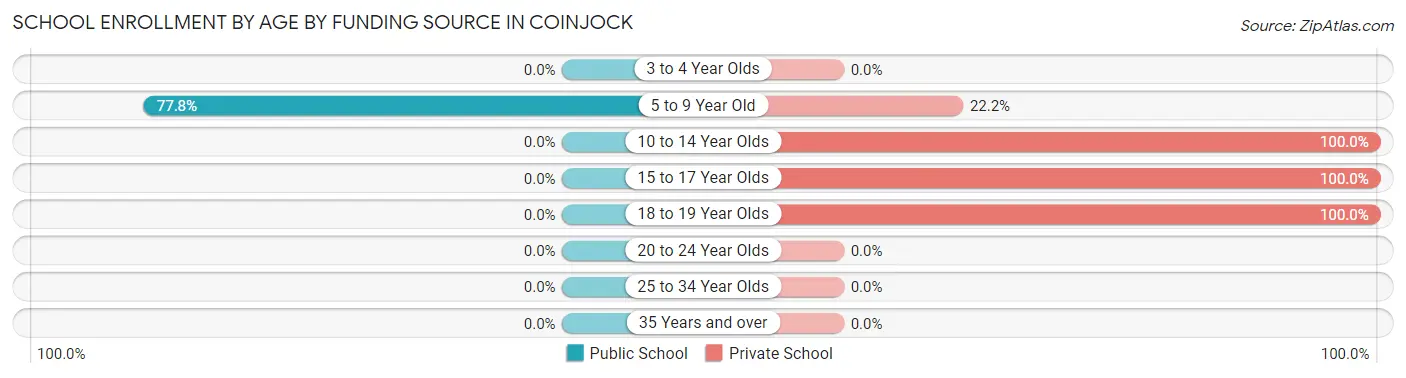
| Age Bracket | Public School | Private School |
| 3 to 4 Year Olds | 0 (0.0%) | 0 (0.0%) |
| 5 to 9 Year Old | 14 (77.8%) | 4 (22.2%) |
| 10 to 14 Year Olds | 0 (0.0%) | 5 (100.0%) |
| 15 to 17 Year Olds | 0 (0.0%) | 3 (100.0%) |
| 18 to 19 Year Olds | 0 (0.0%) | 1 (100.0%) |
| 20 to 24 Year Olds | 0 (0.0%) | 0 (0.0%) |
| 25 to 34 Year Olds | 0 (0.0%) | 0 (0.0%) |
| 35 Years and over | 0 (0.0%) | 0 (0.0%) |
| Total | 14 (51.9%) | 13 (48.1%) |
Educational Attainment by Field of Study in Coinjock
Business (13 | 24.1%), visual & performing arts (13 | 24.1%), education (10 | 18.5%), literature & languages (9 | 16.7%), and communications (9 | 16.7%) are the most common fields of study among 54 individuals in Coinjock who have obtained a bachelor's degree or higher.
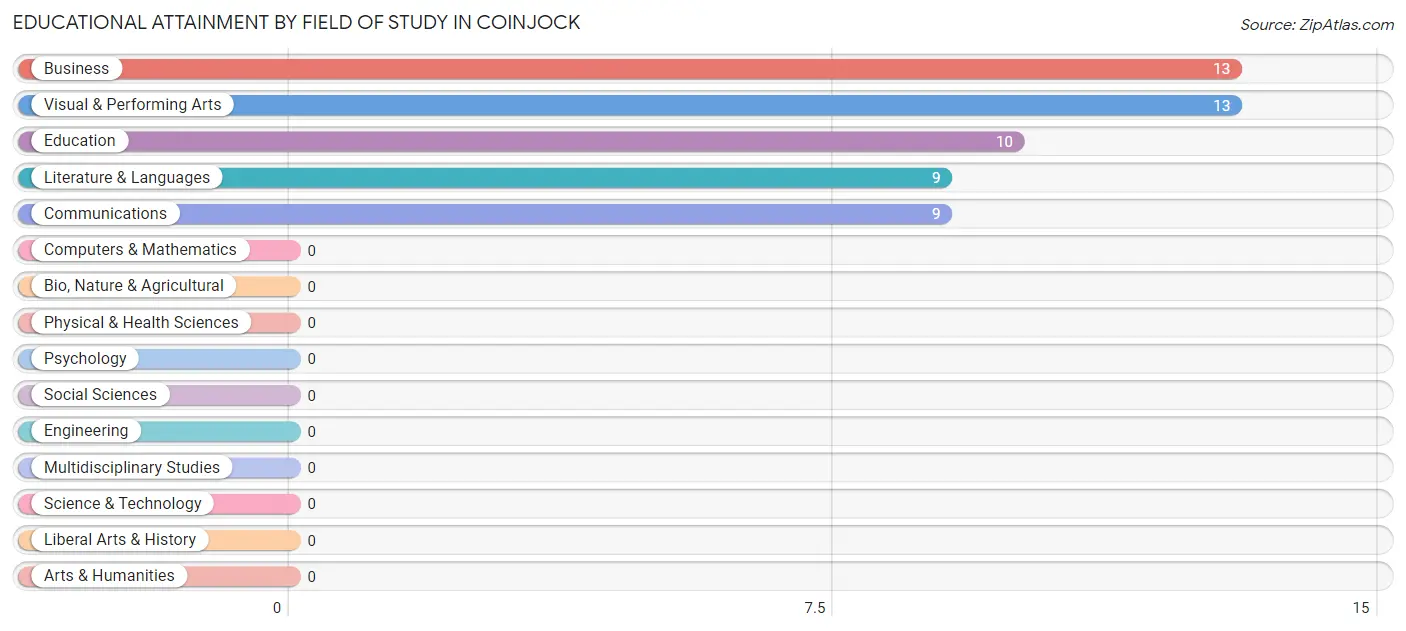
| Field of Study | # Graduates | % Graduates |
| Computers & Mathematics | 0 | 0.0% |
| Bio, Nature & Agricultural | 0 | 0.0% |
| Physical & Health Sciences | 0 | 0.0% |
| Psychology | 0 | 0.0% |
| Social Sciences | 0 | 0.0% |
| Engineering | 0 | 0.0% |
| Multidisciplinary Studies | 0 | 0.0% |
| Science & Technology | 0 | 0.0% |
| Business | 13 | 24.1% |
| Education | 10 | 18.5% |
| Literature & Languages | 9 | 16.7% |
| Liberal Arts & History | 0 | 0.0% |
| Visual & Performing Arts | 13 | 24.1% |
| Communications | 9 | 16.7% |
| Arts & Humanities | 0 | 0.0% |
| Total | 54 | 100.0% |
Transportation & Commute in Coinjock
Vehicle Availability by Sex in Coinjock
The most prevalent vehicle ownership categories in Coinjock are males with 3 vehicles (46, accounting for 78.0%) and females with 3 vehicles (60, making up 34.3%).
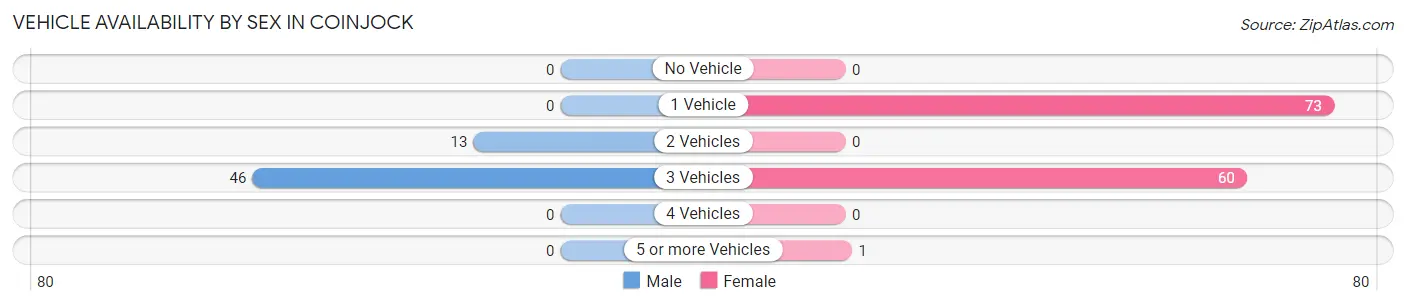
| Vehicles Available | Male | Female |
| No Vehicle | 0 (0.0%) | 0 (0.0%) |
| 1 Vehicle | 0 (0.0%) | 73 (54.5%) |
| 2 Vehicles | 13 (22.0%) | 0 (0.0%) |
| 3 Vehicles | 46 (78.0%) | 60 (44.8%) |
| 4 Vehicles | 0 (0.0%) | 0 (0.0%) |
| 5 or more Vehicles | 0 (0.0%) | 1 (0.7%) |
| Total | 59 (100.0%) | 134 (100.0%) |
Commute Time in Coinjock
The most frequently occuring commute durations in Coinjock are 15 to 19 minutes (42 commuters, 25.3%), 30 to 34 minutes (39 commuters, 23.5%), and 10 to 14 minutes (36 commuters, 21.7%).
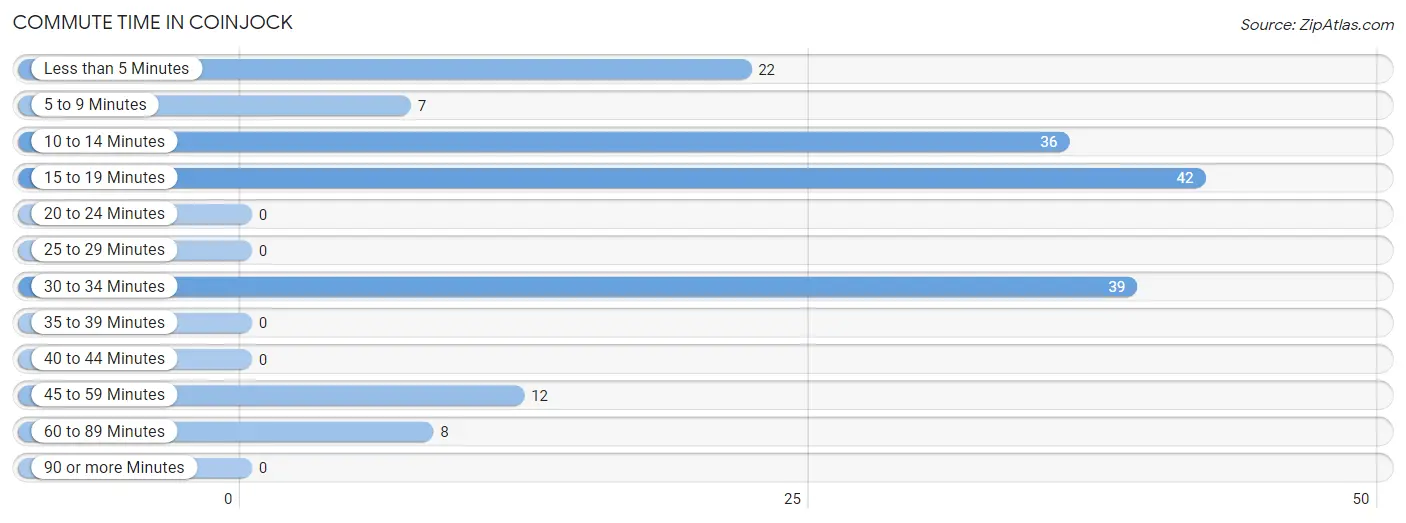
| Commute Time | # Commuters | % Commuters |
| Less than 5 Minutes | 22 | 13.3% |
| 5 to 9 Minutes | 7 | 4.2% |
| 10 to 14 Minutes | 36 | 21.7% |
| 15 to 19 Minutes | 42 | 25.3% |
| 20 to 24 Minutes | 0 | 0.0% |
| 25 to 29 Minutes | 0 | 0.0% |
| 30 to 34 Minutes | 39 | 23.5% |
| 35 to 39 Minutes | 0 | 0.0% |
| 40 to 44 Minutes | 0 | 0.0% |
| 45 to 59 Minutes | 12 | 7.2% |
| 60 to 89 Minutes | 8 | 4.8% |
| 90 or more Minutes | 0 | 0.0% |
Commute Time by Sex in Coinjock
The most common commute times in Coinjock are 10 to 14 minutes (26 commuters, 81.2%) for males and 15 to 19 minutes (42 commuters, 31.3%) for females.
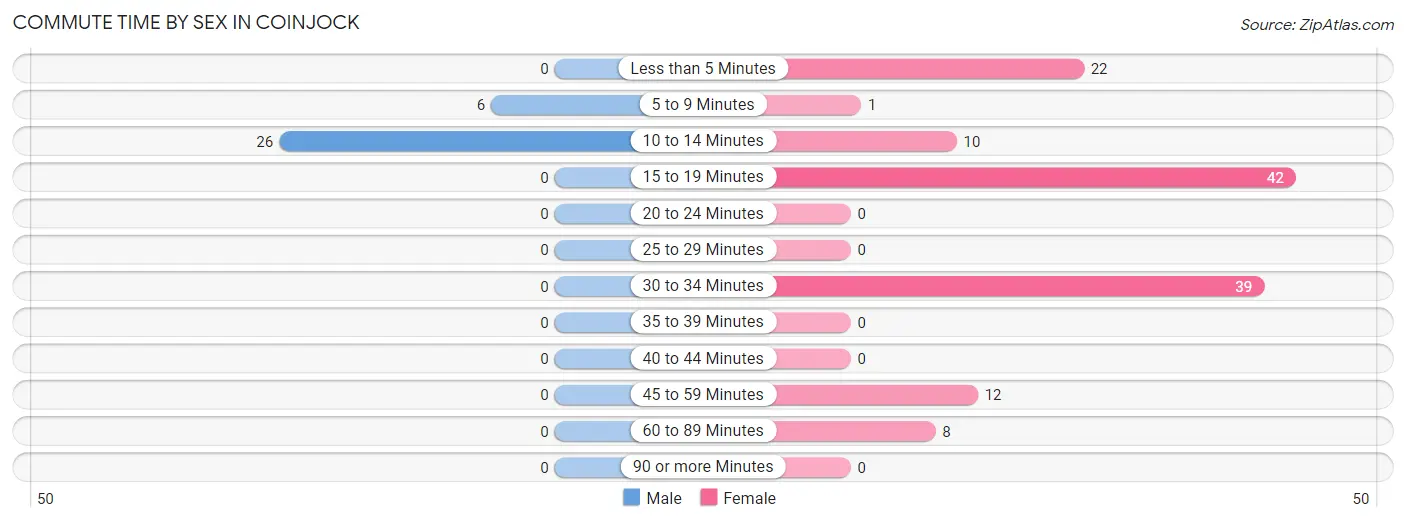
| Commute Time | Male | Female |
| Less than 5 Minutes | 0 (0.0%) | 22 (16.4%) |
| 5 to 9 Minutes | 6 (18.8%) | 1 (0.7%) |
| 10 to 14 Minutes | 26 (81.2%) | 10 (7.5%) |
| 15 to 19 Minutes | 0 (0.0%) | 42 (31.3%) |
| 20 to 24 Minutes | 0 (0.0%) | 0 (0.0%) |
| 25 to 29 Minutes | 0 (0.0%) | 0 (0.0%) |
| 30 to 34 Minutes | 0 (0.0%) | 39 (29.1%) |
| 35 to 39 Minutes | 0 (0.0%) | 0 (0.0%) |
| 40 to 44 Minutes | 0 (0.0%) | 0 (0.0%) |
| 45 to 59 Minutes | 0 (0.0%) | 12 (9.0%) |
| 60 to 89 Minutes | 0 (0.0%) | 8 (6.0%) |
| 90 or more Minutes | 0 (0.0%) | 0 (0.0%) |
Time of Departure to Work by Sex in Coinjock
The most frequent times of departure to work in Coinjock are 7:30 AM to 7:59 AM (13, 40.6%) for males and 6:00 AM to 6:29 AM (50, 37.3%) for females.
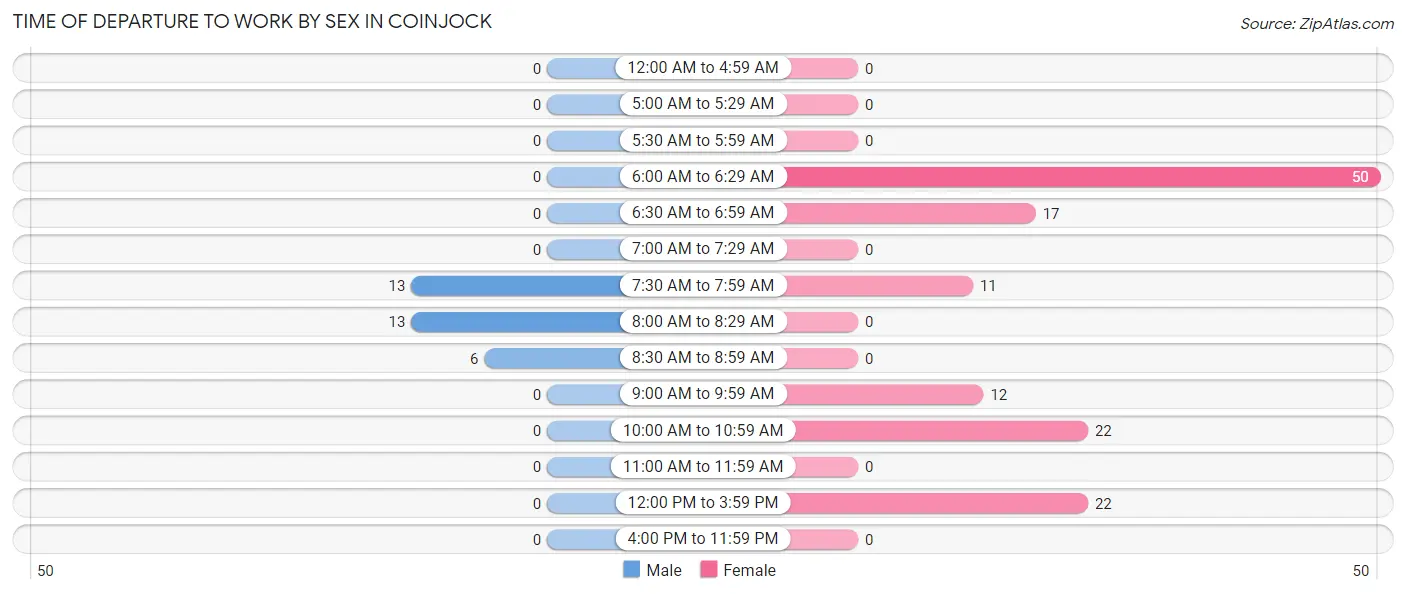
| Time of Departure | Male | Female |
| 12:00 AM to 4:59 AM | 0 (0.0%) | 0 (0.0%) |
| 5:00 AM to 5:29 AM | 0 (0.0%) | 0 (0.0%) |
| 5:30 AM to 5:59 AM | 0 (0.0%) | 0 (0.0%) |
| 6:00 AM to 6:29 AM | 0 (0.0%) | 50 (37.3%) |
| 6:30 AM to 6:59 AM | 0 (0.0%) | 17 (12.7%) |
| 7:00 AM to 7:29 AM | 0 (0.0%) | 0 (0.0%) |
| 7:30 AM to 7:59 AM | 13 (40.6%) | 11 (8.2%) |
| 8:00 AM to 8:29 AM | 13 (40.6%) | 0 (0.0%) |
| 8:30 AM to 8:59 AM | 6 (18.8%) | 0 (0.0%) |
| 9:00 AM to 9:59 AM | 0 (0.0%) | 12 (9.0%) |
| 10:00 AM to 10:59 AM | 0 (0.0%) | 22 (16.4%) |
| 11:00 AM to 11:59 AM | 0 (0.0%) | 0 (0.0%) |
| 12:00 PM to 3:59 PM | 0 (0.0%) | 22 (16.4%) |
| 4:00 PM to 11:59 PM | 0 (0.0%) | 0 (0.0%) |
| Total | 32 (100.0%) | 134 (100.0%) |
Housing Occupancy in Coinjock
Occupancy by Ownership in Coinjock
Of the total 144 dwellings in Coinjock, owner-occupied units account for 105 (72.9%), while renter-occupied units make up 39 (27.1%).
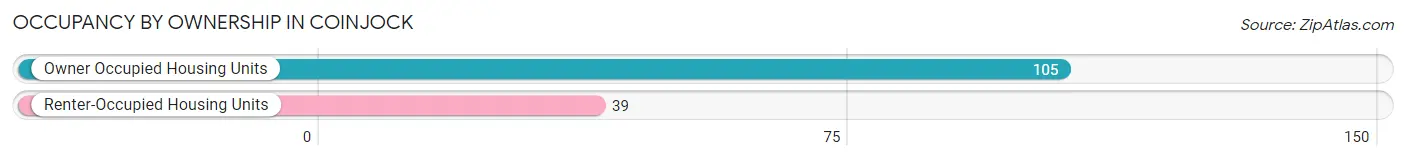
| Occupancy | # Housing Units | % Housing Units |
| Owner Occupied Housing Units | 105 | 72.9% |
| Renter-Occupied Housing Units | 39 | 27.1% |
| Total Occupied Housing Units | 144 | 100.0% |
Occupancy by Household Size in Coinjock
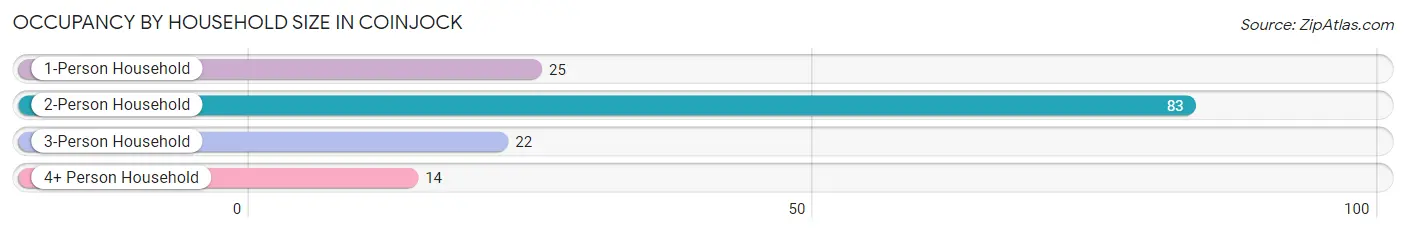
| Household Size | # Housing Units | % Housing Units |
| 1-Person Household | 25 | 17.4% |
| 2-Person Household | 83 | 57.6% |
| 3-Person Household | 22 | 15.3% |
| 4+ Person Household | 14 | 9.7% |
| Total Housing Units | 144 | 100.0% |
Occupancy by Ownership by Household Size in Coinjock
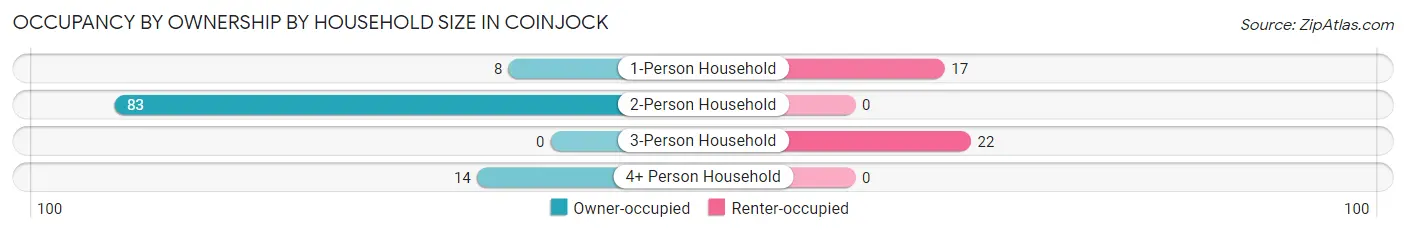
| Household Size | Owner-occupied | Renter-occupied |
| 1-Person Household | 8 (32.0%) | 17 (68.0%) |
| 2-Person Household | 83 (100.0%) | 0 (0.0%) |
| 3-Person Household | 0 (0.0%) | 22 (100.0%) |
| 4+ Person Household | 14 (100.0%) | 0 (0.0%) |
| Total Housing Units | 105 (72.9%) | 39 (27.1%) |
Occupancy by Educational Attainment in Coinjock
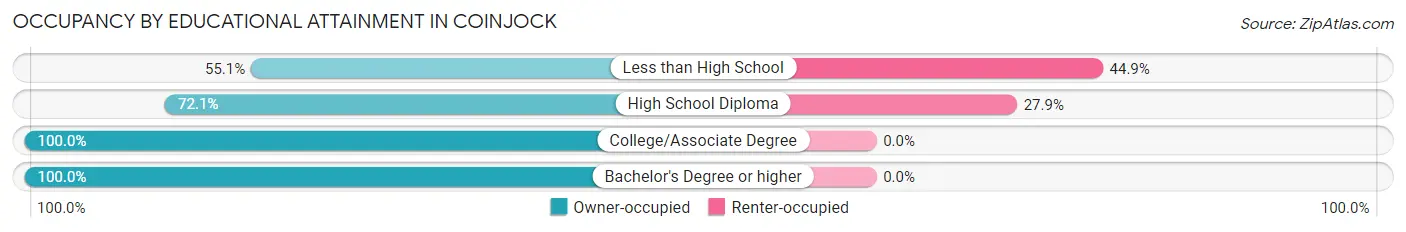
| Household Size | Owner-occupied | Renter-occupied |
| Less than High School | 27 (55.1%) | 22 (44.9%) |
| High School Diploma | 44 (72.1%) | 17 (27.9%) |
| College/Associate Degree | 8 (100.0%) | 0 (0.0%) |
| Bachelor's Degree or higher | 26 (100.0%) | 0 (0.0%) |
Occupancy by Age of Householder in Coinjock
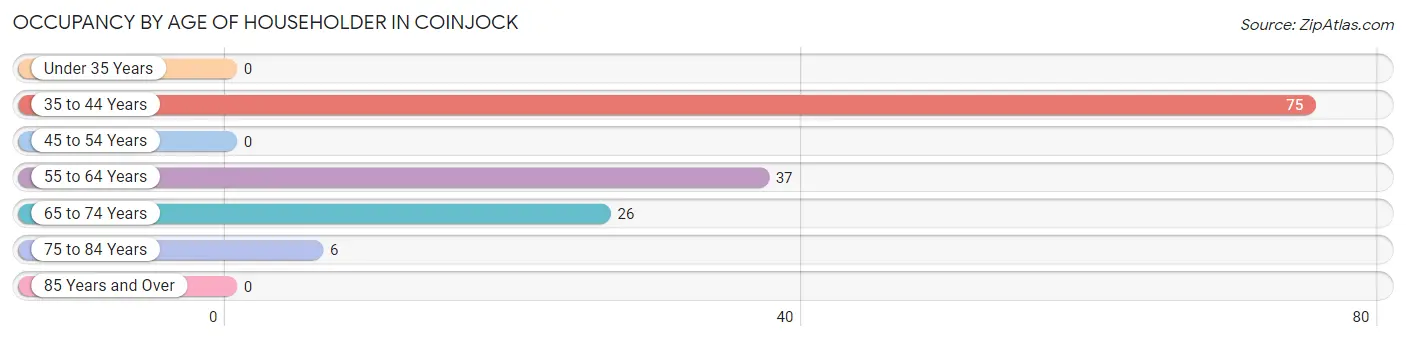
| Age Bracket | # Households | % Households |
| Under 35 Years | 0 | 0.0% |
| 35 to 44 Years | 75 | 52.1% |
| 45 to 54 Years | 0 | 0.0% |
| 55 to 64 Years | 37 | 25.7% |
| 65 to 74 Years | 26 | 18.1% |
| 75 to 84 Years | 6 | 4.2% |
| 85 Years and Over | 0 | 0.0% |
| Total | 144 | 100.0% |
Housing Finances in Coinjock
Median Income by Occupancy in Coinjock
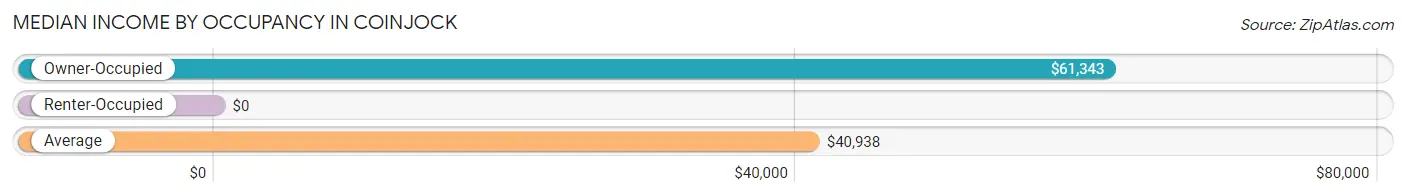
| Occupancy Type | # Households | Median Income |
| Owner-Occupied | 105 (72.9%) | $61,343 |
| Renter-Occupied | 39 (27.1%) | $0 |
| Average | 144 (100.0%) | $40,938 |
Occupancy by Householder Income Bracket in Coinjock
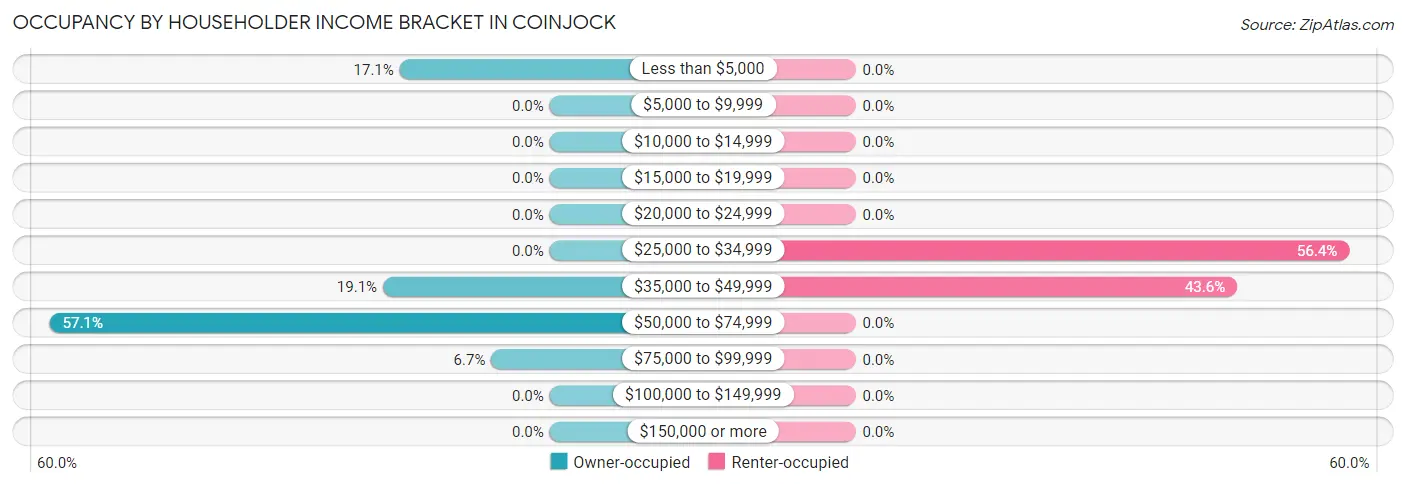
| Income Bracket | Owner-occupied | Renter-occupied |
| Less than $5,000 | 18 (17.1%) | 0 (0.0%) |
| $5,000 to $9,999 | 0 (0.0%) | 0 (0.0%) |
| $10,000 to $14,999 | 0 (0.0%) | 0 (0.0%) |
| $15,000 to $19,999 | 0 (0.0%) | 0 (0.0%) |
| $20,000 to $24,999 | 0 (0.0%) | 0 (0.0%) |
| $25,000 to $34,999 | 0 (0.0%) | 22 (56.4%) |
| $35,000 to $49,999 | 20 (19.1%) | 17 (43.6%) |
| $50,000 to $74,999 | 60 (57.1%) | 0 (0.0%) |
| $75,000 to $99,999 | 7 (6.7%) | 0 (0.0%) |
| $100,000 to $149,999 | 0 (0.0%) | 0 (0.0%) |
| $150,000 or more | 0 (0.0%) | 0 (0.0%) |
| Total | 105 (100.0%) | 39 (100.0%) |
Monthly Housing Cost Tiers in Coinjock
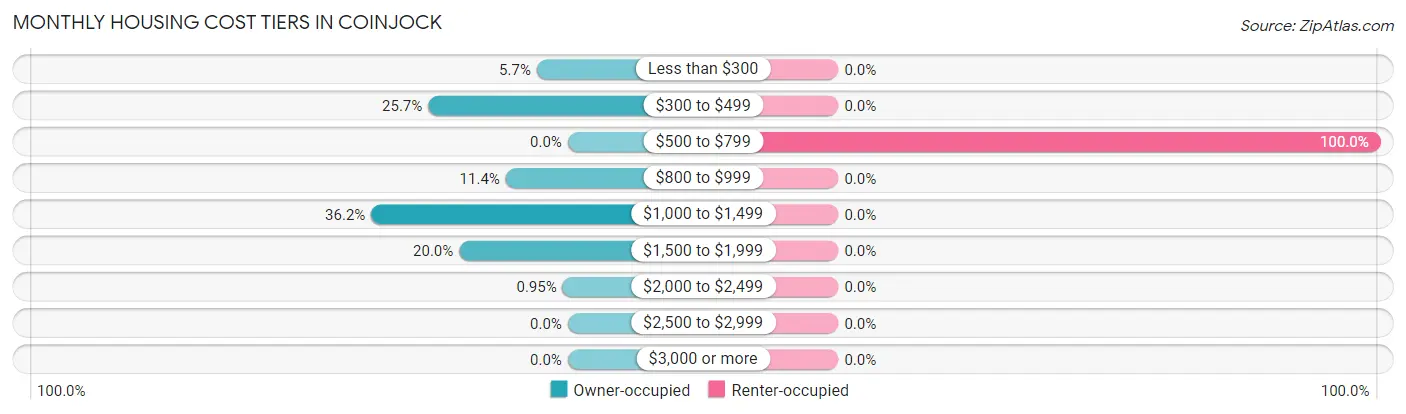
| Monthly Cost | Owner-occupied | Renter-occupied |
| Less than $300 | 6 (5.7%) | 0 (0.0%) |
| $300 to $499 | 27 (25.7%) | 0 (0.0%) |
| $500 to $799 | 0 (0.0%) | 39 (100.0%) |
| $800 to $999 | 12 (11.4%) | 0 (0.0%) |
| $1,000 to $1,499 | 38 (36.2%) | 0 (0.0%) |
| $1,500 to $1,999 | 21 (20.0%) | 0 (0.0%) |
| $2,000 to $2,499 | 1 (0.9%) | 0 (0.0%) |
| $2,500 to $2,999 | 0 (0.0%) | 0 (0.0%) |
| $3,000 or more | 0 (0.0%) | 0 (0.0%) |
| Total | 105 (100.0%) | 39 (100.0%) |
Physical Housing Characteristics in Coinjock
Housing Structures in Coinjock
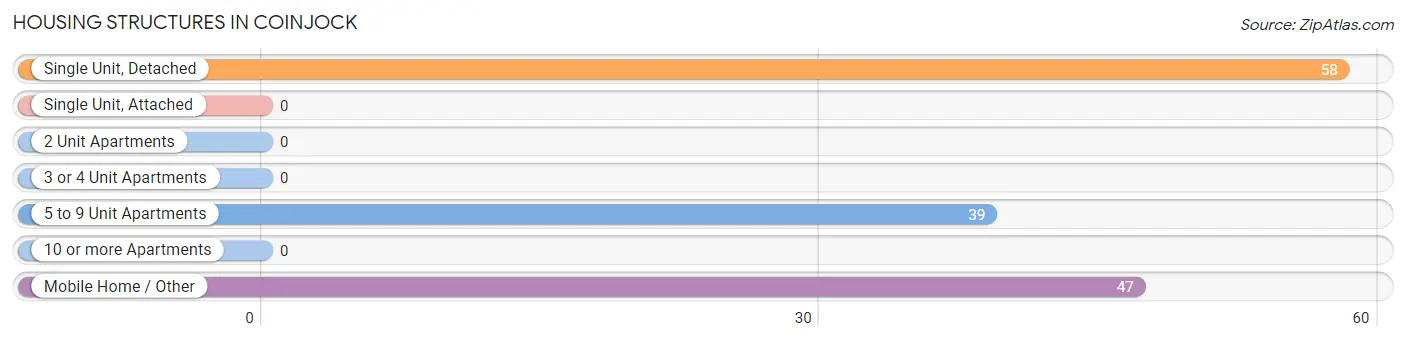
| Structure Type | # Housing Units | % Housing Units |
| Single Unit, Detached | 58 | 40.3% |
| Single Unit, Attached | 0 | 0.0% |
| 2 Unit Apartments | 0 | 0.0% |
| 3 or 4 Unit Apartments | 0 | 0.0% |
| 5 to 9 Unit Apartments | 39 | 27.1% |
| 10 or more Apartments | 0 | 0.0% |
| Mobile Home / Other | 47 | 32.6% |
| Total | 144 | 100.0% |
Housing Structures by Occupancy in Coinjock
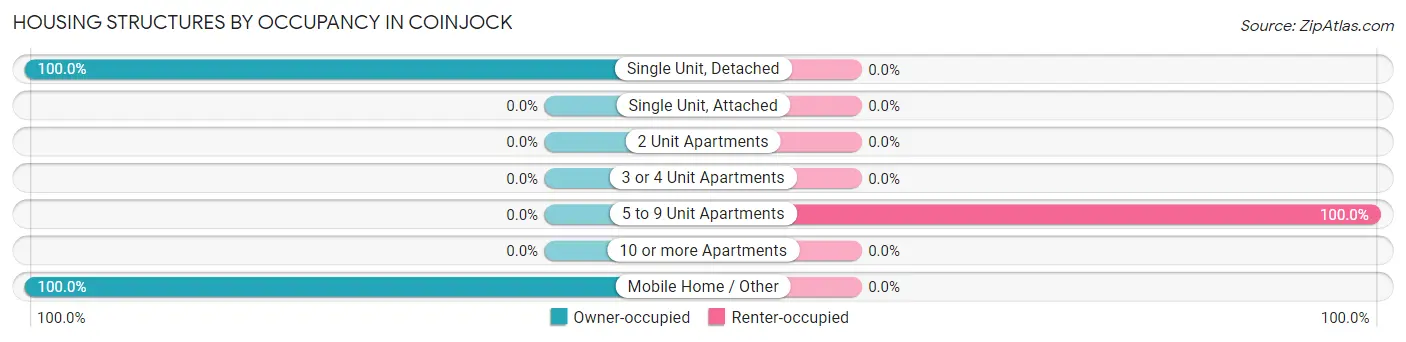
| Structure Type | Owner-occupied | Renter-occupied |
| Single Unit, Detached | 58 (100.0%) | 0 (0.0%) |
| Single Unit, Attached | 0 (0.0%) | 0 (0.0%) |
| 2 Unit Apartments | 0 (0.0%) | 0 (0.0%) |
| 3 or 4 Unit Apartments | 0 (0.0%) | 0 (0.0%) |
| 5 to 9 Unit Apartments | 0 (0.0%) | 39 (100.0%) |
| 10 or more Apartments | 0 (0.0%) | 0 (0.0%) |
| Mobile Home / Other | 47 (100.0%) | 0 (0.0%) |
| Total | 105 (72.9%) | 39 (27.1%) |
Housing Structures by Number of Rooms in Coinjock
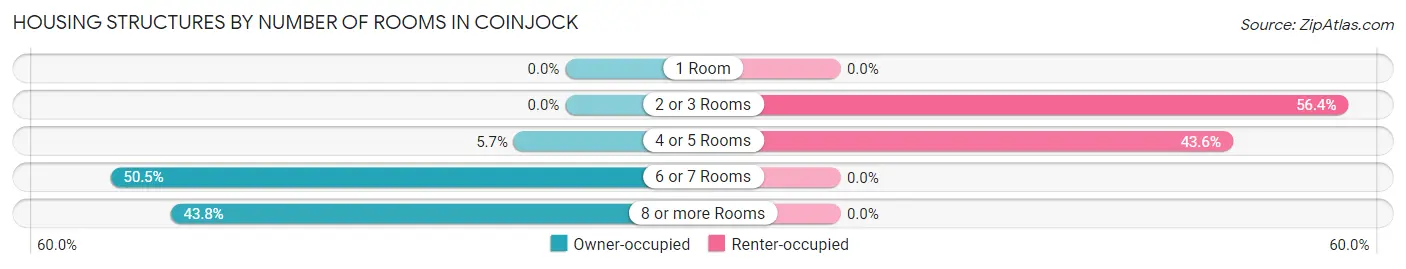
| Number of Rooms | Owner-occupied | Renter-occupied |
| 1 Room | 0 (0.0%) | 0 (0.0%) |
| 2 or 3 Rooms | 0 (0.0%) | 22 (56.4%) |
| 4 or 5 Rooms | 6 (5.7%) | 17 (43.6%) |
| 6 or 7 Rooms | 53 (50.5%) | 0 (0.0%) |
| 8 or more Rooms | 46 (43.8%) | 0 (0.0%) |
| Total | 105 (100.0%) | 39 (100.0%) |
Housing Structure by Heating Type in Coinjock
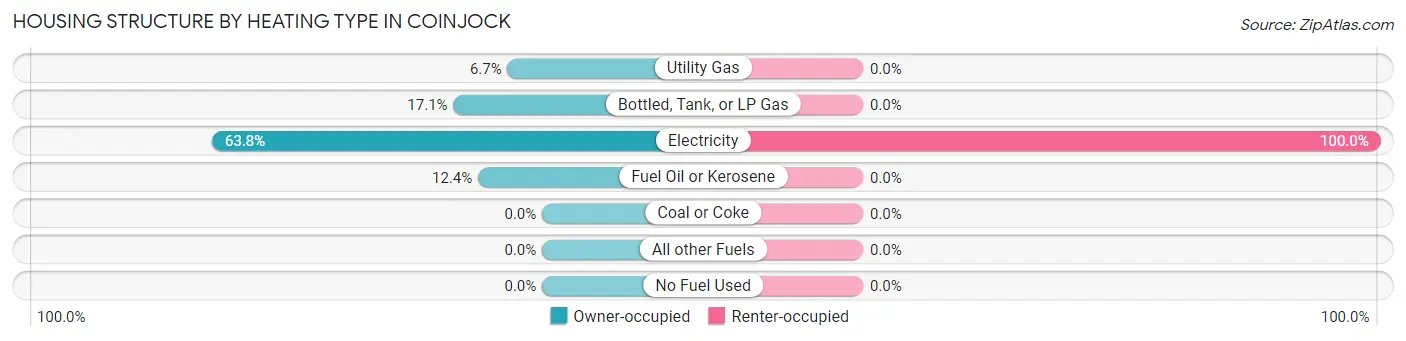
| Heating Type | Owner-occupied | Renter-occupied |
| Utility Gas | 7 (6.7%) | 0 (0.0%) |
| Bottled, Tank, or LP Gas | 18 (17.1%) | 0 (0.0%) |
| Electricity | 67 (63.8%) | 39 (100.0%) |
| Fuel Oil or Kerosene | 13 (12.4%) | 0 (0.0%) |
| Coal or Coke | 0 (0.0%) | 0 (0.0%) |
| All other Fuels | 0 (0.0%) | 0 (0.0%) |
| No Fuel Used | 0 (0.0%) | 0 (0.0%) |
| Total | 105 (100.0%) | 39 (100.0%) |
Household Vehicle Usage in Coinjock
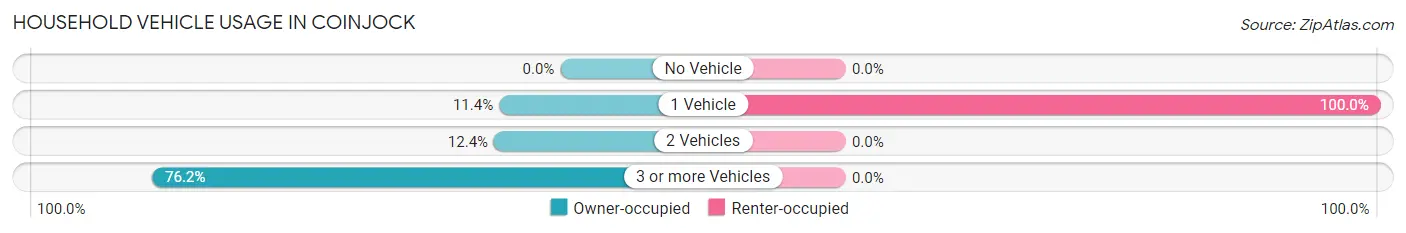
| Vehicles per Household | Owner-occupied | Renter-occupied |
| No Vehicle | 0 (0.0%) | 0 (0.0%) |
| 1 Vehicle | 12 (11.4%) | 39 (100.0%) |
| 2 Vehicles | 13 (12.4%) | 0 (0.0%) |
| 3 or more Vehicles | 80 (76.2%) | 0 (0.0%) |
| Total | 105 (100.0%) | 39 (100.0%) |
Real Estate & Mortgages in Coinjock
Real Estate and Mortgage Overview in Coinjock
| Characteristic | Without Mortgage | With Mortgage |
| Housing Units | 33 | 72 |
| Median Property Value | - | - |
| Median Household Income | - | - |
| Monthly Housing Costs | - | - |
| Real Estate Taxes | - | - |
Property Value by Mortgage Status in Coinjock
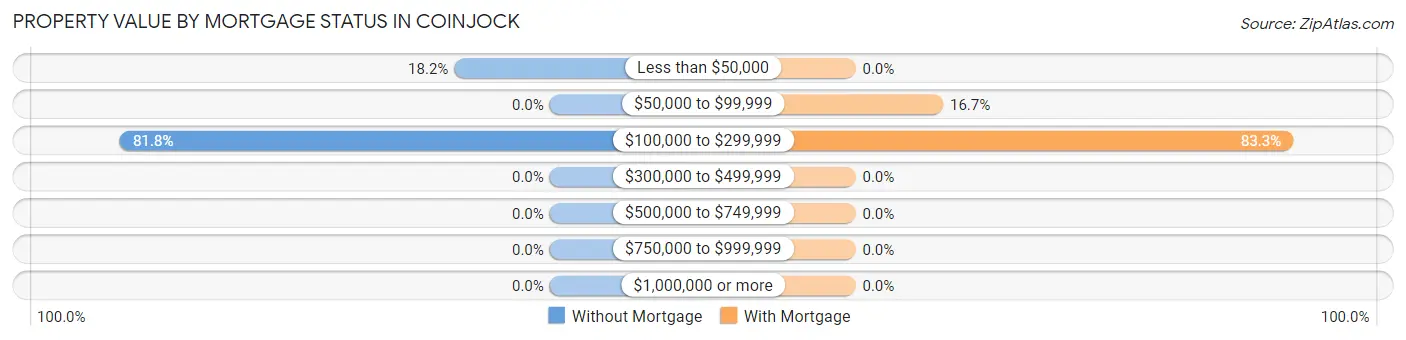
| Property Value | Without Mortgage | With Mortgage |
| Less than $50,000 | 6 (18.2%) | 0 (0.0%) |
| $50,000 to $99,999 | 0 (0.0%) | 12 (16.7%) |
| $100,000 to $299,999 | 27 (81.8%) | 60 (83.3%) |
| $300,000 to $499,999 | 0 (0.0%) | 0 (0.0%) |
| $500,000 to $749,999 | 0 (0.0%) | 0 (0.0%) |
| $750,000 to $999,999 | 0 (0.0%) | 0 (0.0%) |
| $1,000,000 or more | 0 (0.0%) | 0 (0.0%) |
| Total | 33 (100.0%) | 72 (100.0%) |
Household Income by Mortgage Status in Coinjock
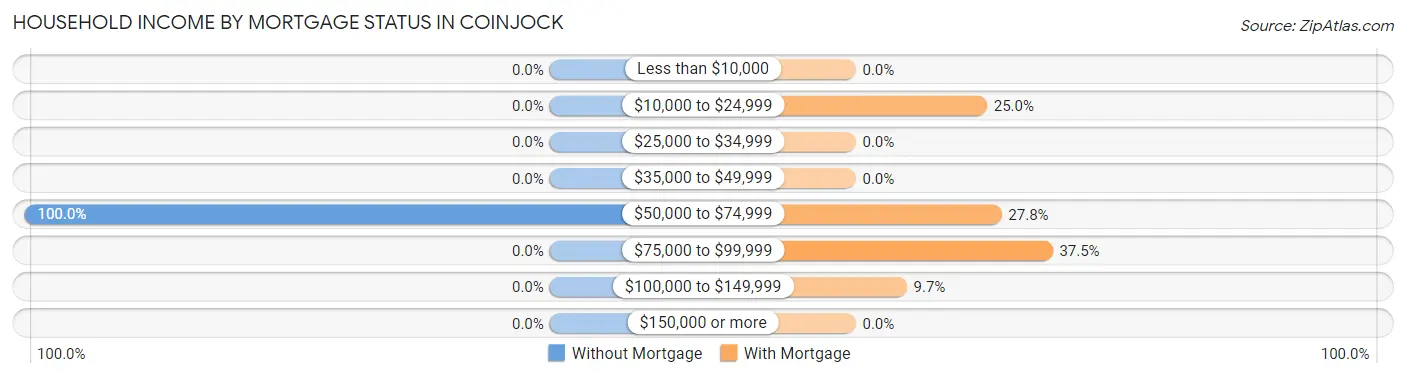
| Household Income | Without Mortgage | With Mortgage |
| Less than $10,000 | 0 (0.0%) | 0 (0.0%) |
| $10,000 to $24,999 | 0 (0.0%) | 18 (25.0%) |
| $25,000 to $34,999 | 0 (0.0%) | 0 (0.0%) |
| $35,000 to $49,999 | 0 (0.0%) | 0 (0.0%) |
| $50,000 to $74,999 | 33 (100.0%) | 20 (27.8%) |
| $75,000 to $99,999 | 0 (0.0%) | 27 (37.5%) |
| $100,000 to $149,999 | 0 (0.0%) | 7 (9.7%) |
| $150,000 or more | 0 (0.0%) | 0 (0.0%) |
| Total | 33 (100.0%) | 72 (100.0%) |
Property Value to Household Income Ratio in Coinjock
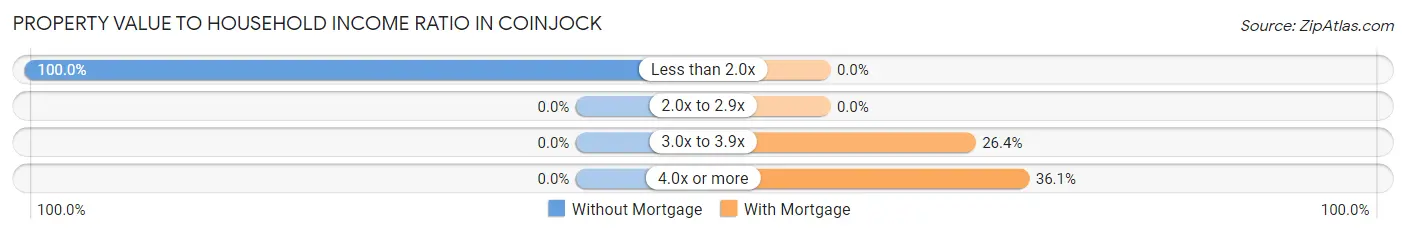
| Value-to-Income Ratio | Without Mortgage | With Mortgage |
| Less than 2.0x | 33 (100.0%) | 0 (0.0%) |
| 2.0x to 2.9x | 0 (0.0%) | 0 (0.0%) |
| 3.0x to 3.9x | 0 (0.0%) | 19 (26.4%) |
| 4.0x or more | 0 (0.0%) | 26 (36.1%) |
| Total | 33 (100.0%) | 72 (100.0%) |
Real Estate Taxes by Mortgage Status in Coinjock
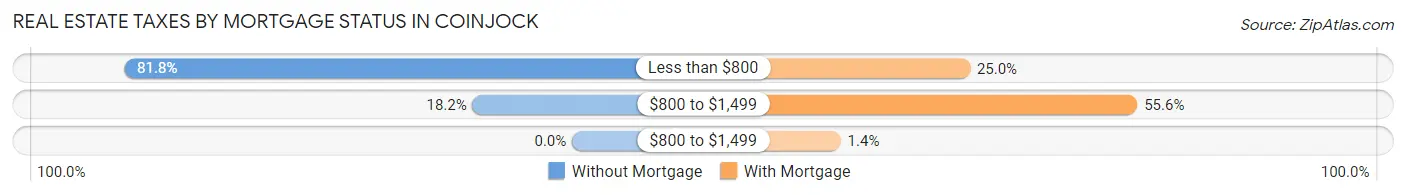
| Property Taxes | Without Mortgage | With Mortgage |
| Less than $800 | 27 (81.8%) | 18 (25.0%) |
| $800 to $1,499 | 6 (18.2%) | 40 (55.6%) |
| $800 to $1,499 | 0 (0.0%) | 1 (1.4%) |
| Total | 33 (100.0%) | 72 (100.0%) |
Health & Disability in Coinjock
Health Insurance Coverage by Age in Coinjock
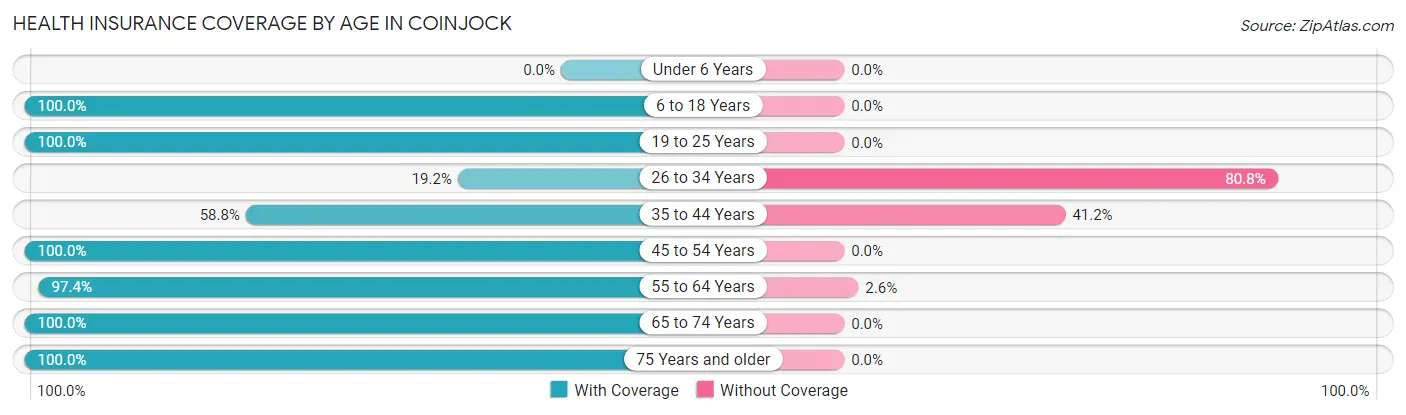
| Age Bracket | With Coverage | Without Coverage |
| Under 6 Years | 0 (0.0%) | 0 (0.0%) |
| 6 to 18 Years | 26 (100.0%) | 0 (0.0%) |
| 19 to 25 Years | 23 (100.0%) | 0 (0.0%) |
| 26 to 34 Years | 10 (19.2%) | 42 (80.8%) |
| 35 to 44 Years | 57 (58.8%) | 40 (41.2%) |
| 45 to 54 Years | 1 (100.0%) | 0 (0.0%) |
| 55 to 64 Years | 37 (97.4%) | 1 (2.6%) |
| 65 to 74 Years | 49 (100.0%) | 0 (0.0%) |
| 75 Years and older | 15 (100.0%) | 0 (0.0%) |
| Total | 218 (72.4%) | 83 (27.6%) |
Health Insurance Coverage by Citizenship Status in Coinjock
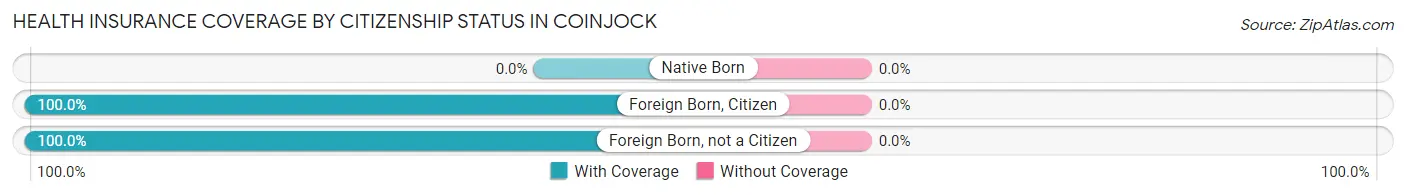
| Citizenship Status | With Coverage | Without Coverage |
| Native Born | 0 (0.0%) | 0 (0.0%) |
| Foreign Born, Citizen | 26 (100.0%) | 0 (0.0%) |
| Foreign Born, not a Citizen | 23 (100.0%) | 0 (0.0%) |
Health Insurance Coverage by Household Income in Coinjock
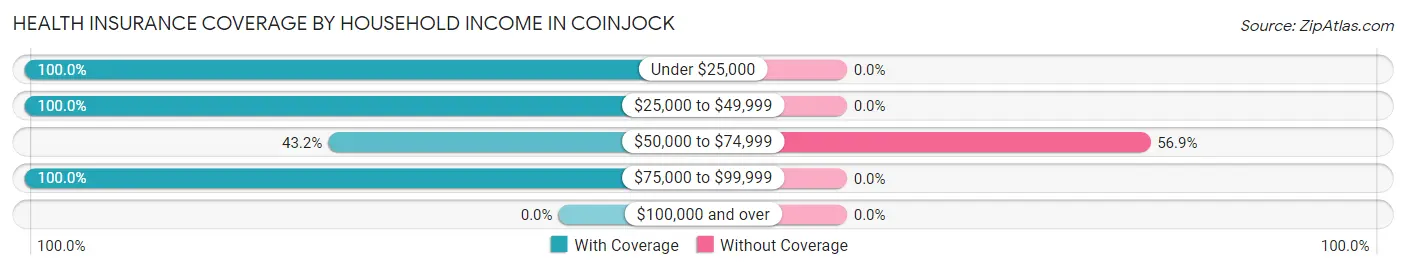
| Household Income | With Coverage | Without Coverage |
| Under $25,000 | 35 (100.0%) | 0 (0.0%) |
| $25,000 to $49,999 | 107 (100.0%) | 0 (0.0%) |
| $50,000 to $74,999 | 63 (43.1%) | 83 (56.9%) |
| $75,000 to $99,999 | 13 (100.0%) | 0 (0.0%) |
| $100,000 and over | 0 (0.0%) | 0 (0.0%) |
Public vs Private Health Insurance Coverage by Age in Coinjock
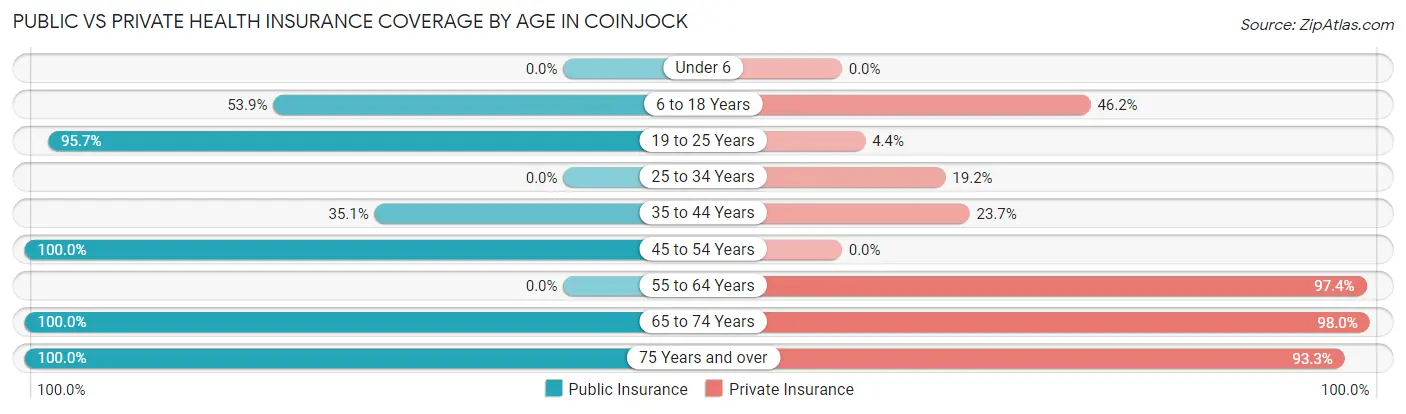
| Age Bracket | Public Insurance | Private Insurance |
| Under 6 | 0 (0.0%) | 0 (0.0%) |
| 6 to 18 Years | 14 (53.8%) | 12 (46.2%) |
| 19 to 25 Years | 22 (95.7%) | 1 (4.3%) |
| 25 to 34 Years | 0 (0.0%) | 10 (19.2%) |
| 35 to 44 Years | 34 (35.0%) | 23 (23.7%) |
| 45 to 54 Years | 1 (100.0%) | 0 (0.0%) |
| 55 to 64 Years | 0 (0.0%) | 37 (97.4%) |
| 65 to 74 Years | 49 (100.0%) | 48 (98.0%) |
| 75 Years and over | 15 (100.0%) | 14 (93.3%) |
| Total | 135 (44.9%) | 145 (48.2%) |
Disability Status by Sex by Age in Coinjock
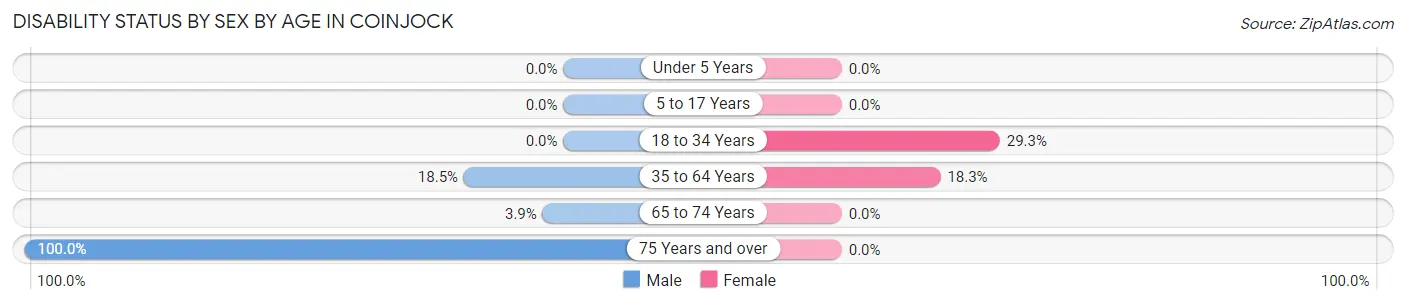
| Age Bracket | Male | Female |
| Under 5 Years | 0 (0.0%) | 0 (0.0%) |
| 5 to 17 Years | 0 (0.0%) | 0 (0.0%) |
| 18 to 34 Years | 0 (0.0%) | 22 (29.3%) |
| 35 to 64 Years | 12 (18.5%) | 13 (18.3%) |
| 65 to 74 Years | 1 (3.8%) | 0 (0.0%) |
| 75 Years and over | 6 (100.0%) | 0 (0.0%) |
Disability Class by Sex by Age in Coinjock
Disability Class: Hearing Difficulty
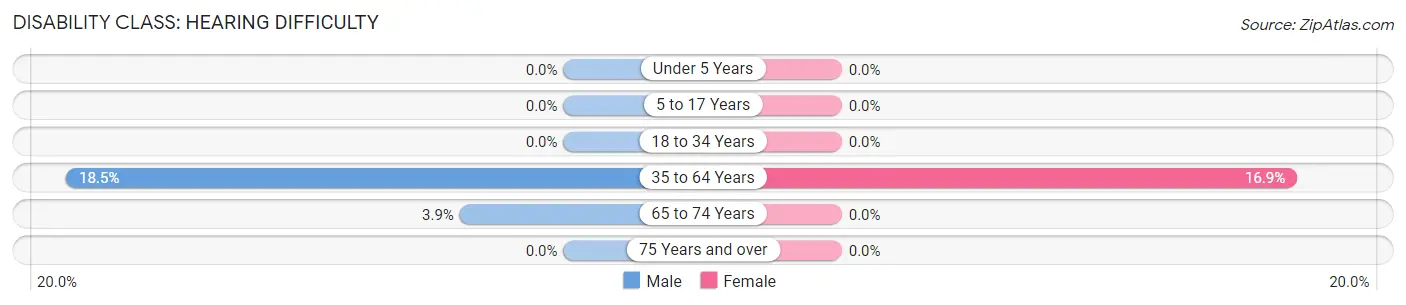
| Age Bracket | Male | Female |
| Under 5 Years | 0 (0.0%) | 0 (0.0%) |
| 5 to 17 Years | 0 (0.0%) | 0 (0.0%) |
| 18 to 34 Years | 0 (0.0%) | 0 (0.0%) |
| 35 to 64 Years | 12 (18.5%) | 12 (16.9%) |
| 65 to 74 Years | 1 (3.8%) | 0 (0.0%) |
| 75 Years and over | 0 (0.0%) | 0 (0.0%) |
Disability Class: Vision Difficulty
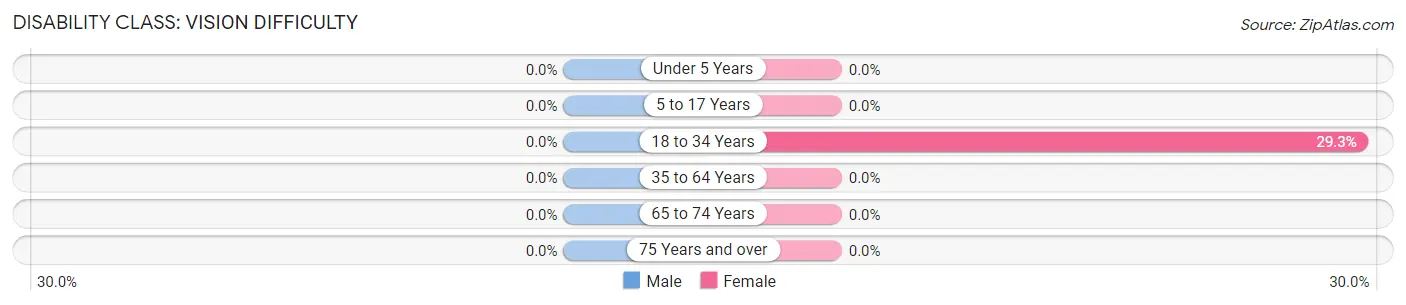
| Age Bracket | Male | Female |
| Under 5 Years | 0 (0.0%) | 0 (0.0%) |
| 5 to 17 Years | 0 (0.0%) | 0 (0.0%) |
| 18 to 34 Years | 0 (0.0%) | 22 (29.3%) |
| 35 to 64 Years | 0 (0.0%) | 0 (0.0%) |
| 65 to 74 Years | 0 (0.0%) | 0 (0.0%) |
| 75 Years and over | 0 (0.0%) | 0 (0.0%) |
Disability Class: Cognitive Difficulty
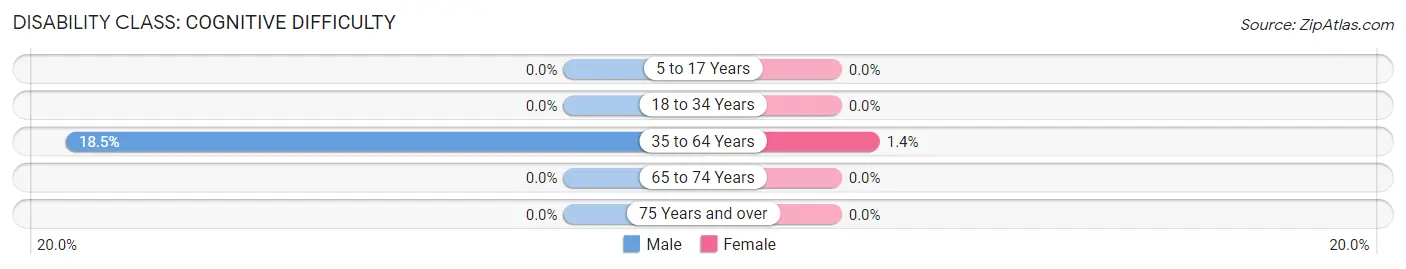
| Age Bracket | Male | Female |
| 5 to 17 Years | 0 (0.0%) | 0 (0.0%) |
| 18 to 34 Years | 0 (0.0%) | 0 (0.0%) |
| 35 to 64 Years | 12 (18.5%) | 1 (1.4%) |
| 65 to 74 Years | 0 (0.0%) | 0 (0.0%) |
| 75 Years and over | 0 (0.0%) | 0 (0.0%) |
Disability Class: Ambulatory Difficulty
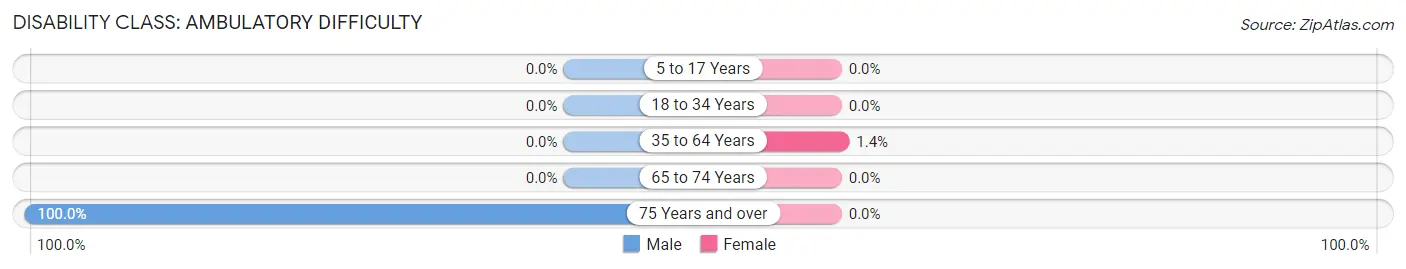
| Age Bracket | Male | Female |
| 5 to 17 Years | 0 (0.0%) | 0 (0.0%) |
| 18 to 34 Years | 0 (0.0%) | 0 (0.0%) |
| 35 to 64 Years | 0 (0.0%) | 1 (1.4%) |
| 65 to 74 Years | 0 (0.0%) | 0 (0.0%) |
| 75 Years and over | 6 (100.0%) | 0 (0.0%) |
Disability Class: Self-Care Difficulty

| Age Bracket | Male | Female |
| 5 to 17 Years | 0 (0.0%) | 0 (0.0%) |
| 18 to 34 Years | 0 (0.0%) | 0 (0.0%) |
| 35 to 64 Years | 0 (0.0%) | 1 (1.4%) |
| 65 to 74 Years | 0 (0.0%) | 0 (0.0%) |
| 75 Years and over | 0 (0.0%) | 0 (0.0%) |
Technology Access in Coinjock
Computing Device Access in Coinjock
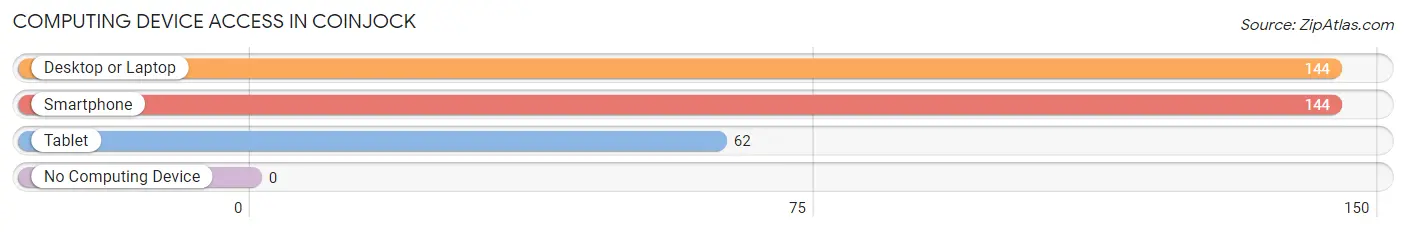
| Device Type | # Households | % Households |
| Desktop or Laptop | 144 | 100.0% |
| Smartphone | 144 | 100.0% |
| Tablet | 62 | 43.1% |
| No Computing Device | 0 | 0.0% |
| Total | 144 | 100.0% |
Internet Access in Coinjock
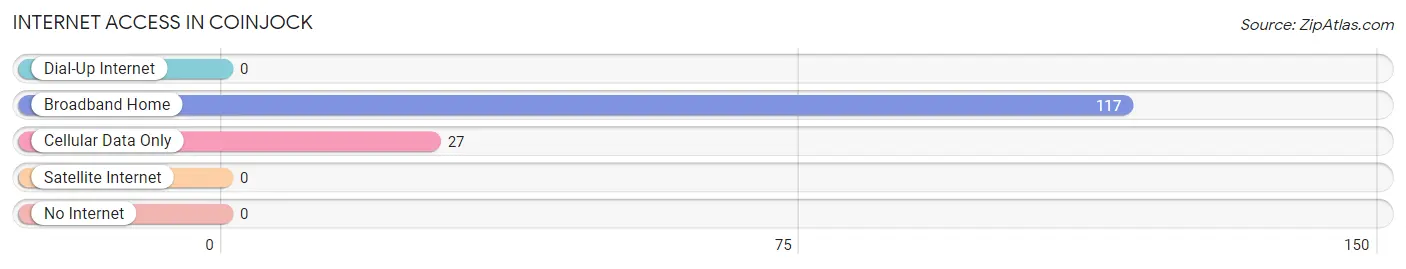
| Internet Type | # Households | % Households |
| Dial-Up Internet | 0 | 0.0% |
| Broadband Home | 117 | 81.2% |
| Cellular Data Only | 27 | 18.8% |
| Satellite Internet | 0 | 0.0% |
| No Internet | 0 | 0.0% |
| Total | 144 | 100.0% |
Coinjock Summary
Coinjock is a small unincorporated community located in Currituck County, North Carolina. It is situated on the northern shore of the Currituck Sound, just south of the Virginia state line. The community is part of the Outer Banks region of North Carolina and is home to a population of approximately 500 people.
History
Coinjock was first settled in the late 1700s by a group of settlers from the nearby town of Currituck. The settlers were attracted to the area due to its abundance of natural resources, including fish, oysters, and timber. The town was originally known as “Coinjock Landing” and was a popular stop for ships traveling between Norfolk, Virginia and the Outer Banks.
In the early 1800s, the town was renamed “Coinjock” after a local Native American chief. The town was incorporated in 1883 and was home to a variety of businesses, including a general store, a post office, a sawmill, and a boatyard.
Geography
Coinjock is located in the northern part of Currituck County, just south of the Virginia state line. The town is situated on the northern shore of the Currituck Sound, which is part of the Atlantic Intracoastal Waterway. The town is bordered by the Currituck National Wildlife Refuge to the north and the Currituck Sound to the south.
The town is located approximately 30 miles south of the Outer Banks and is accessible by boat or by car via US Highway 158. The nearest major cities are Norfolk, Virginia (50 miles to the north) and Elizabeth City, North Carolina (30 miles to the south).
Economy
Coinjock’s economy is largely based on tourism and fishing. The town is home to a variety of restaurants, shops, and marinas that cater to visitors and locals alike. The town is also home to a number of charter fishing companies that offer deep-sea fishing trips.
Coinjock is also home to a number of small businesses, including a boatyard, a general store, and a post office. The town is also home to a number of seafood processing plants, which provide employment for many of the town’s residents.
Demographics
As of the 2010 census, Coinjock had a population of 498 people. The racial makeup of the town was 94.4% White, 2.2% African American, 0.2% Native American, 0.4% Asian, 0.2% Pacific Islander, and 2.6% from other races. The median household income was $37,500 and the median family income was $45,000.
Coinjock is home to a variety of religious denominations, including Baptist, Methodist, and Catholic. The town is also home to a number of civic organizations, including the Coinjock Volunteer Fire Department and the Coinjock Lions Club.
Conclusion
Coinjock is a small unincorporated community located in Currituck County, North Carolina. It is situated on the northern shore of the Currituck Sound, just south of the Virginia state line. The town was first settled in the late 1700s and was incorporated in 1883. The town’s economy is largely based on tourism and fishing, and it is home to a variety of restaurants, shops, and marinas. As of the 2010 census, Coinjock had a population of 498 people. The town is home to a variety of religious denominations and civic organizations.
Common Questions
What is Per Capita Income in Coinjock?
Per Capita income in Coinjock is $22,731.
What is the Median Household income in Coinjock?
Median Household Income in Coinjock is $40,938.
What is Income or Wage Gap in Coinjock?
Income or Wage Gap in Coinjock is 26.7%.
Women in Coinjock earn 73.3 cents for every dollar earned by a man.
What is Inequality or Gini Index in Coinjock?
Inequality or Gini Index in Coinjock is 0.27.
What is the Total Population of Coinjock?
Total Population of Coinjock is 301.
What is the Total Male Population of Coinjock?
Total Male Population of Coinjock is 102.
What is the Total Female Population of Coinjock?
Total Female Population of Coinjock is 199.
What is the Ratio of Males per 100 Females in Coinjock?
There are 51.26 Males per 100 Females in Coinjock.
What is the Ratio of Females per 100 Males in Coinjock?
There are 195.10 Females per 100 Males in Coinjock.
What is the Median Population Age in Coinjock?
Median Population Age in Coinjock is 39.7 Years.
What is the Average Family Size in Coinjock
Average Family Size in Coinjock is 2.3 People.
What is the Average Household Size in Coinjock
Average Household Size in Coinjock is 2.1 People.
How Large is the Labor Force in Coinjock?
There are 193 People in the Labor Forcein in Coinjock.
What is the Percentage of People in the Labor Force in Coinjock?
69.4% of People are in the Labor Force in Coinjock.