Wingate, NC Map & Demographics
Wingate Map
Wingate Overview
$18,518
PER CAPITA INCOME
$85,878
AVG FAMILY INCOME
$72,188
AVG HOUSEHOLD INCOME
68.3%
WAGE / INCOME GAP [ % ]
31.7¢/ $1
WAGE / INCOME GAP [ $ ]
0.46
INEQUALITY / GINI INDEX
4,061
TOTAL POPULATION
1,750
MALE POPULATION
2,311
FEMALE POPULATION
75.72
MALES / 100 FEMALES
132.06
FEMALES / 100 MALES
21.4
MEDIAN AGE
4.0
AVG FAMILY SIZE
3.1
AVG HOUSEHOLD SIZE
1,788
LABOR FORCE [ PEOPLE ]
54.2%
PERCENT IN LABOR FORCE
0.6%
UNEMPLOYMENT RATE
Wingate Zip Codes
Wingate Area Codes
Income in Wingate
Income Overview in Wingate
Per Capita Income in Wingate is $18,518, while median incomes of families and households are $85,878 and $72,188 respectively.
| Characteristic | Number | Measure |
| Per Capita Income | 4,061 | $18,518 |
| Median Family Income | 569 | $85,878 |
| Mean Family Income | 569 | $108,271 |
| Median Household Income | 904 | $72,188 |
| Mean Household Income | 904 | $80,599 |
| Income Deficit | 569 | $0 |
| Wage / Income Gap (%) | 4,061 | 68.28% |
| Wage / Income Gap ($) | 4,061 | 31.72¢ per $1 |
| Gini / Inequality Index | 4,061 | 0.46 |
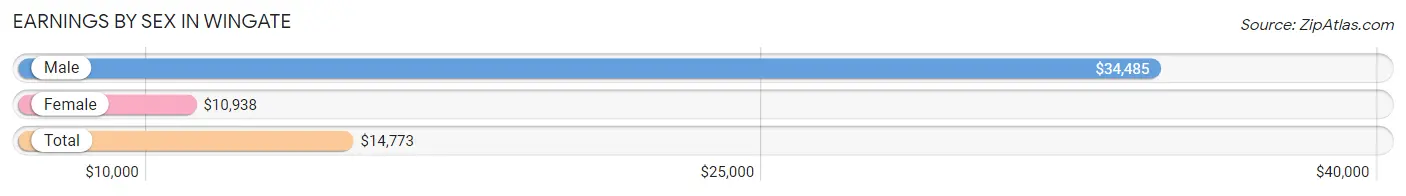
Earnings by Sex in Wingate
Average Earnings in Wingate are $14,773, $34,485 for men and $10,938 for women, a difference of 68.3%.
| Sex | Number | Average Earnings |
| Male | 901 (45.0%) | $34,485 |
| Female | 1,101 (55.0%) | $10,938 |
| Total | 2,002 (100.0%) | $14,773 |
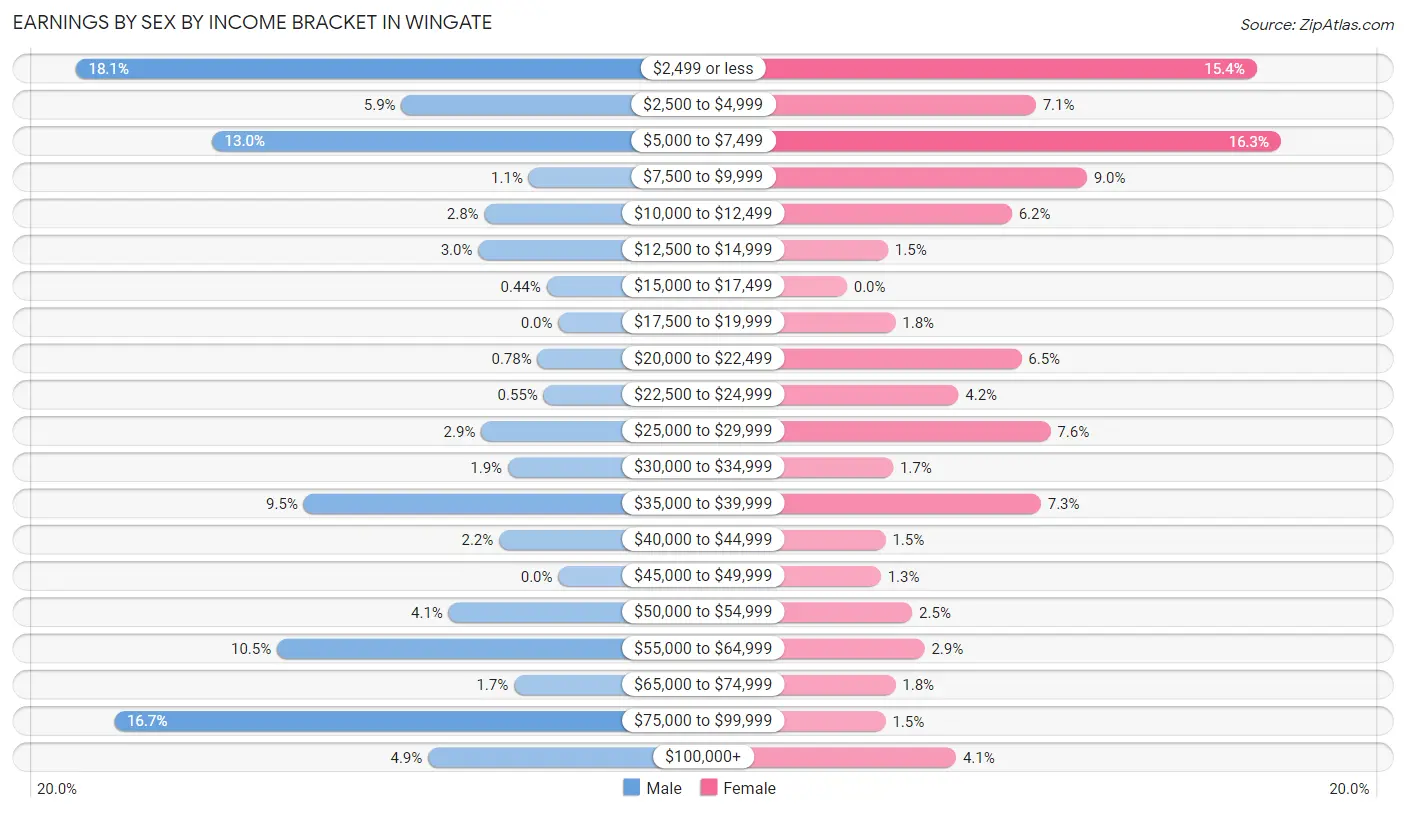
Earnings by Sex by Income Bracket in Wingate
The most common earnings brackets in Wingate are $2,499 or less for men (163 | 18.1%) and $5,000 to $7,499 for women (179 | 16.3%).
| Income | Male | Female |
| $2,499 or less | 163 (18.1%) | 169 (15.3%) |
| $2,500 to $4,999 | 53 (5.9%) | 78 (7.1%) |
| $5,000 to $7,499 | 117 (13.0%) | 179 (16.3%) |
| $7,500 to $9,999 | 10 (1.1%) | 99 (9.0%) |
| $10,000 to $12,499 | 25 (2.8%) | 68 (6.2%) |
| $12,500 to $14,999 | 27 (3.0%) | 17 (1.5%) |
| $15,000 to $17,499 | 4 (0.4%) | 0 (0.0%) |
| $17,500 to $19,999 | 0 (0.0%) | 20 (1.8%) |
| $20,000 to $22,499 | 7 (0.8%) | 72 (6.5%) |
| $22,500 to $24,999 | 5 (0.5%) | 46 (4.2%) |
| $25,000 to $29,999 | 26 (2.9%) | 84 (7.6%) |
| $30,000 to $34,999 | 17 (1.9%) | 19 (1.7%) |
| $35,000 to $39,999 | 86 (9.5%) | 80 (7.3%) |
| $40,000 to $44,999 | 20 (2.2%) | 16 (1.5%) |
| $45,000 to $49,999 | 0 (0.0%) | 14 (1.3%) |
| $50,000 to $54,999 | 37 (4.1%) | 27 (2.5%) |
| $55,000 to $64,999 | 95 (10.5%) | 32 (2.9%) |
| $65,000 to $74,999 | 15 (1.7%) | 20 (1.8%) |
| $75,000 to $99,999 | 150 (16.7%) | 16 (1.5%) |
| $100,000+ | 44 (4.9%) | 45 (4.1%) |
| Total | 901 (100.0%) | 1,101 (100.0%) |
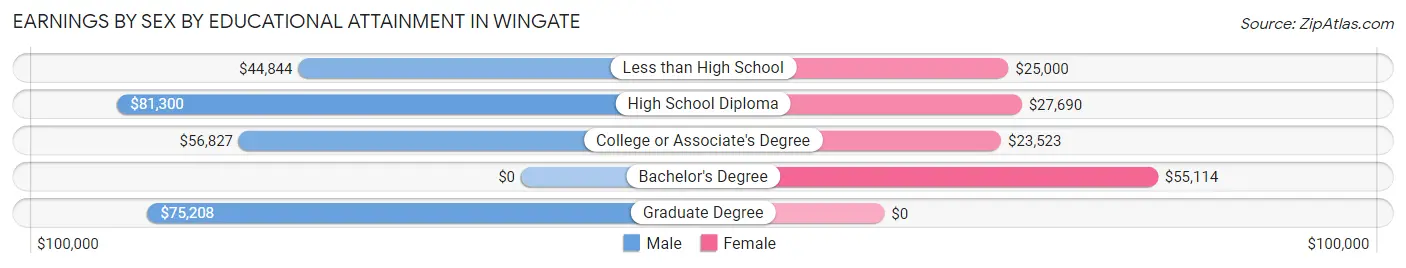
Earnings by Sex by Educational Attainment in Wingate
Average earnings in Wingate are $58,750 for men and $29,325 for women, a difference of 50.1%. Men with an educational attainment of high school diploma enjoy the highest average annual earnings of $81,300, while those with less than high school education earn the least with $44,844. Women with an educational attainment of bachelor's degree earn the most with the average annual earnings of $55,114, while those with college or associate's degree education have the smallest earnings of $23,523.
| Educational Attainment | Male Income | Female Income |
| Less than High School | $44,844 | $25,000 |
| High School Diploma | $81,300 | $27,690 |
| College or Associate's Degree | $56,827 | $23,523 |
| Bachelor's Degree | - | - |
| Graduate Degree | $75,208 | $0 |
| Total | $58,750 | $29,325 |
Family Income in Wingate
Family Income Brackets in Wingate
According to the Wingate family income data, there are 162 families falling into the $75,000 to $99,999 income range, which is the most common income bracket and makes up 28.5% of all families.
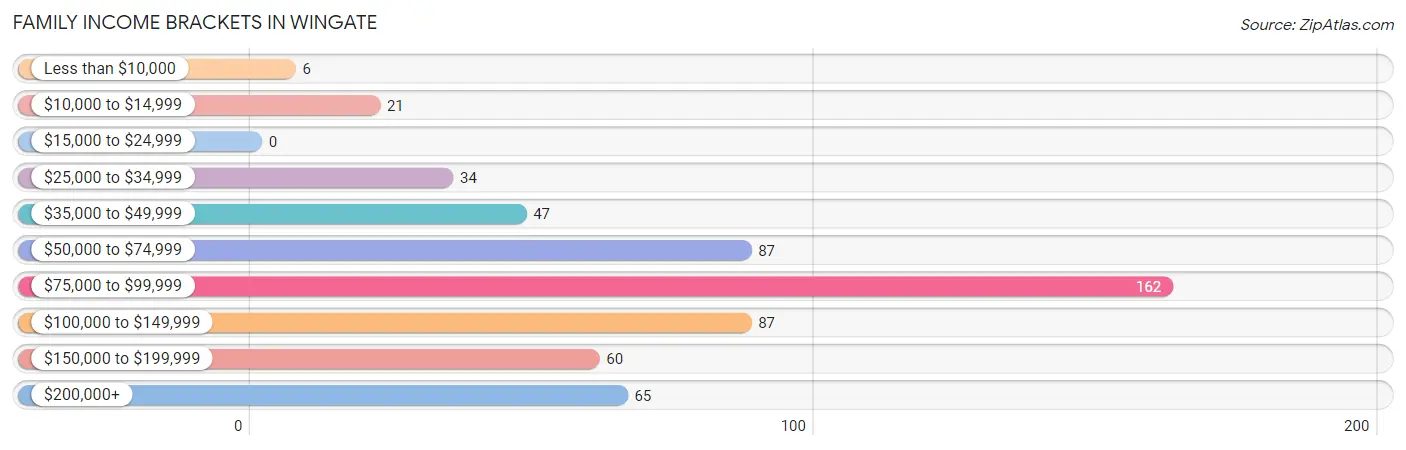
| Income Bracket | # Families | % Families |
| Less than $10,000 | 6 | 1.1% |
| $10,000 to $14,999 | 21 | 3.7% |
| $15,000 to $24,999 | 0 | 0.0% |
| $25,000 to $34,999 | 34 | 6.0% |
| $35,000 to $49,999 | 47 | 8.3% |
| $50,000 to $74,999 | 87 | 15.3% |
| $75,000 to $99,999 | 162 | 28.5% |
| $100,000 to $149,999 | 87 | 15.3% |
| $150,000 to $199,999 | 60 | 10.5% |
| $200,000+ | 65 | 11.4% |
Family Income by Famaliy Size in Wingate
3-person families (77 | 13.5%) account for the highest median family income in Wingate with $105,208 per family, while 2-person families (235 | 41.3%) have the highest median income of $36,746 per family member.
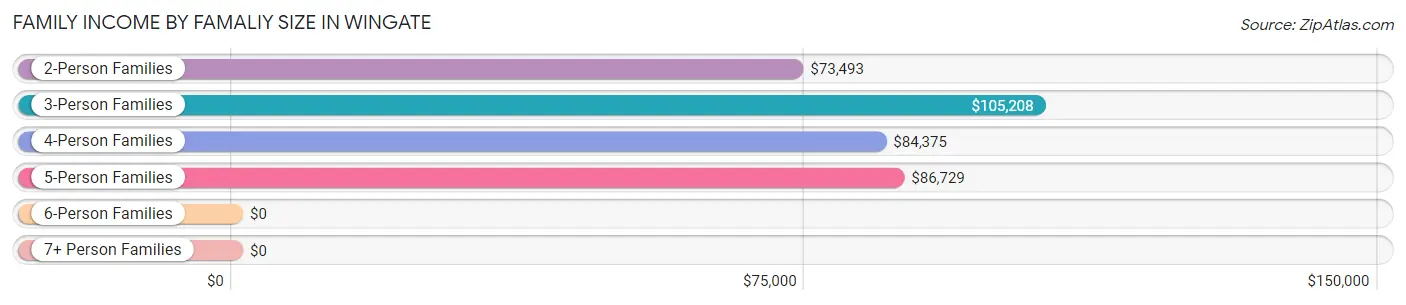
| Income Bracket | # Families | Median Income |
| 2-Person Families | 235 (41.3%) | $73,493 |
| 3-Person Families | 77 (13.5%) | $105,208 |
| 4-Person Families | 54 (9.5%) | $84,375 |
| 5-Person Families | 109 (19.2%) | $86,729 |
| 6-Person Families | 29 (5.1%) | $0 |
| 7+ Person Families | 65 (11.4%) | $0 |
| Total | 569 (100.0%) | $85,878 |
Family Income by Number of Earners in Wingate
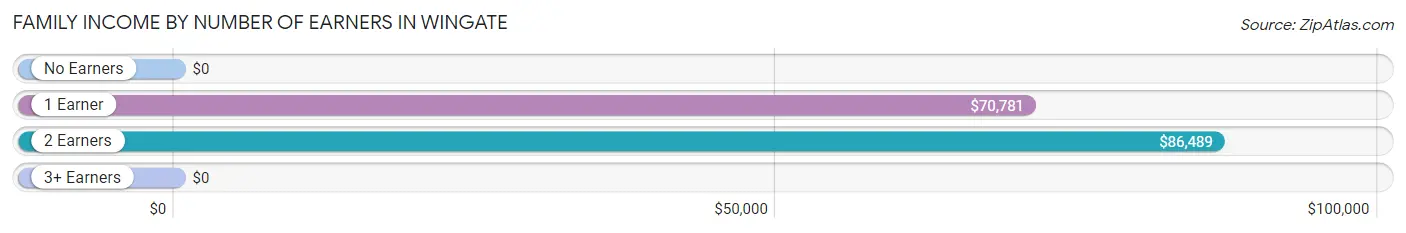
| Number of Earners | # Families | Median Income |
| No Earners | 25 (4.4%) | $0 |
| 1 Earner | 117 (20.6%) | $70,781 |
| 2 Earners | 318 (55.9%) | $86,489 |
| 3+ Earners | 109 (19.2%) | $0 |
| Total | 569 (100.0%) | $85,878 |
Household Income in Wingate
Household Income Brackets in Wingate
With 166 households falling in the category, the $75,000 to $99,999 income range is the most frequent in Wingate, accounting for 18.4% of all households. In contrast, only 30 households (3.3%) fall into the less than $10,000 income bracket, making it the least populous group.
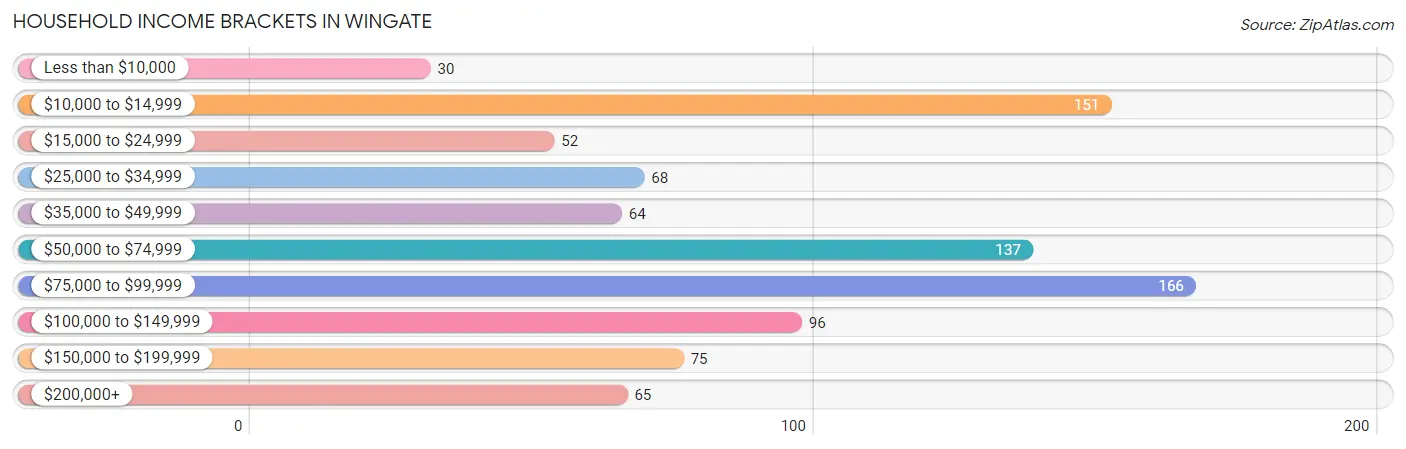
| Income Bracket | # Households | % Households |
| Less than $10,000 | 30 | 3.3% |
| $10,000 to $14,999 | 151 | 16.7% |
| $15,000 to $24,999 | 52 | 5.8% |
| $25,000 to $34,999 | 68 | 7.5% |
| $35,000 to $49,999 | 64 | 7.1% |
| $50,000 to $74,999 | 137 | 15.2% |
| $75,000 to $99,999 | 166 | 18.4% |
| $100,000 to $149,999 | 96 | 10.6% |
| $150,000 to $199,999 | 75 | 8.3% |
| $200,000+ | 65 | 7.2% |
Household Income by Householder Age in Wingate
The median household income in Wingate is $72,188, with the highest median household income of $86,543 found in the 25 to 44 years age bracket for the primary householder. A total of 296 households (32.7%) fall into this category. Meanwhile, the 15 to 24 years age bracket for the primary householder has the lowest median household income of $0, with 137 households (15.1%) in this group.
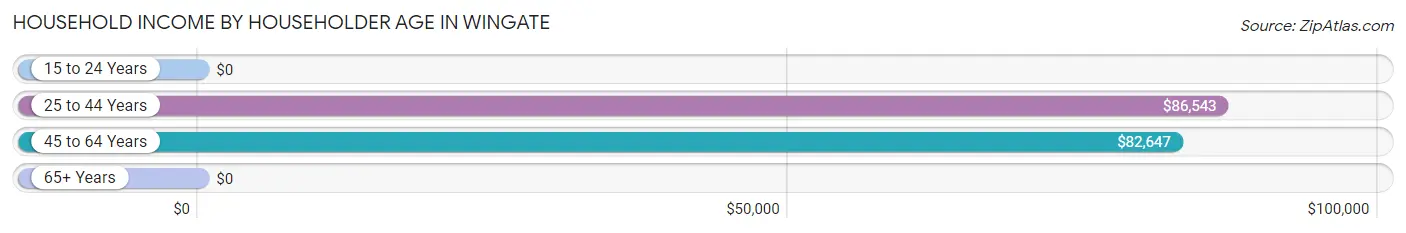
| Income Bracket | # Households | Median Income |
| 15 to 24 Years | 137 (15.1%) | $0 |
| 25 to 44 Years | 296 (32.7%) | $86,543 |
| 45 to 64 Years | 220 (24.3%) | $82,647 |
| 65+ Years | 251 (27.8%) | $0 |
| Total | 904 (100.0%) | $72,188 |
Poverty in Wingate
Income Below Poverty by Sex and Age in Wingate
With 11.4% poverty level for males and 15.9% for females among the residents of Wingate, 12 to 14 year old males and 75 year old and over females are the most vulnerable to poverty, with 7 males (70.0%) and 100 females (74.6%) in their respective age groups living below the poverty level.
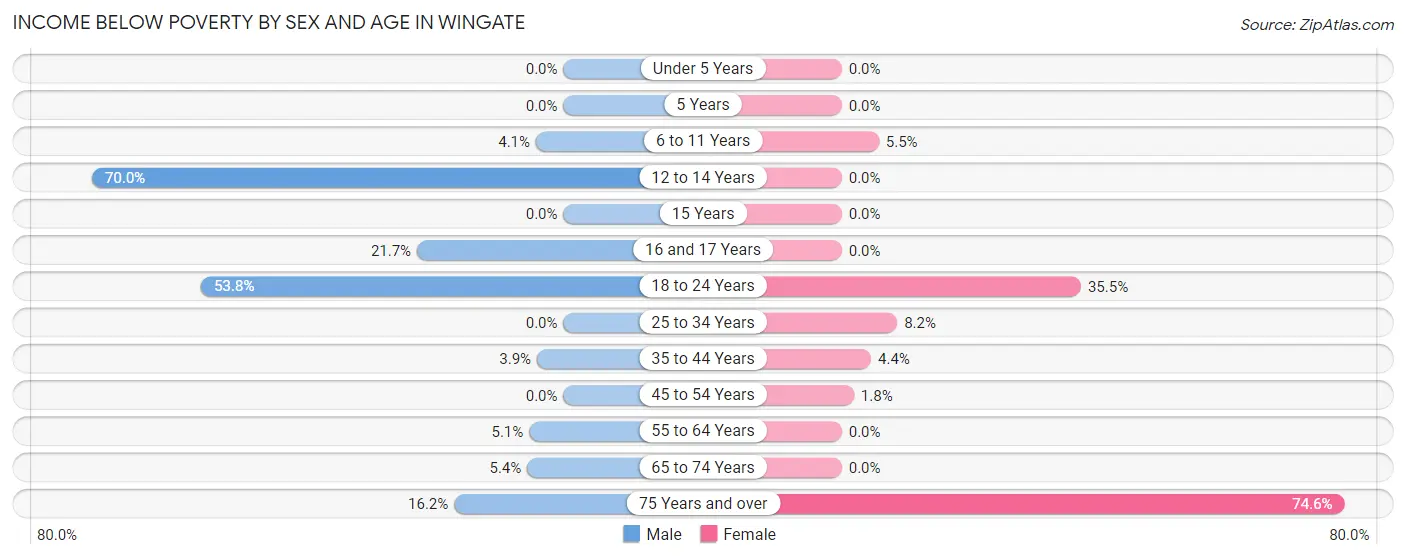
| Age Bracket | Male | Female |
| Under 5 Years | 0 (0.0%) | 0 (0.0%) |
| 5 Years | 0 (0.0%) | 0 (0.0%) |
| 6 to 11 Years | 6 (4.1%) | 6 (5.5%) |
| 12 to 14 Years | 7 (70.0%) | 0 (0.0%) |
| 15 Years | 0 (0.0%) | 0 (0.0%) |
| 16 and 17 Years | 5 (21.7%) | 0 (0.0%) |
| 18 to 24 Years | 92 (53.8%) | 130 (35.5%) |
| 25 to 34 Years | 0 (0.0%) | 19 (8.2%) |
| 35 to 44 Years | 6 (3.9%) | 9 (4.3%) |
| 45 to 54 Years | 0 (0.0%) | 2 (1.8%) |
| 55 to 64 Years | 3 (5.1%) | 0 (0.0%) |
| 65 to 74 Years | 5 (5.4%) | 0 (0.0%) |
| 75 Years and over | 6 (16.2%) | 100 (74.6%) |
| Total | 130 (11.4%) | 266 (15.9%) |
Income Above Poverty by Sex and Age in Wingate
According to the poverty statistics in Wingate, males aged under 5 years and females aged under 5 years are the age groups that are most secure financially, with 100.0% of males and 100.0% of females in these age groups living above the poverty line.
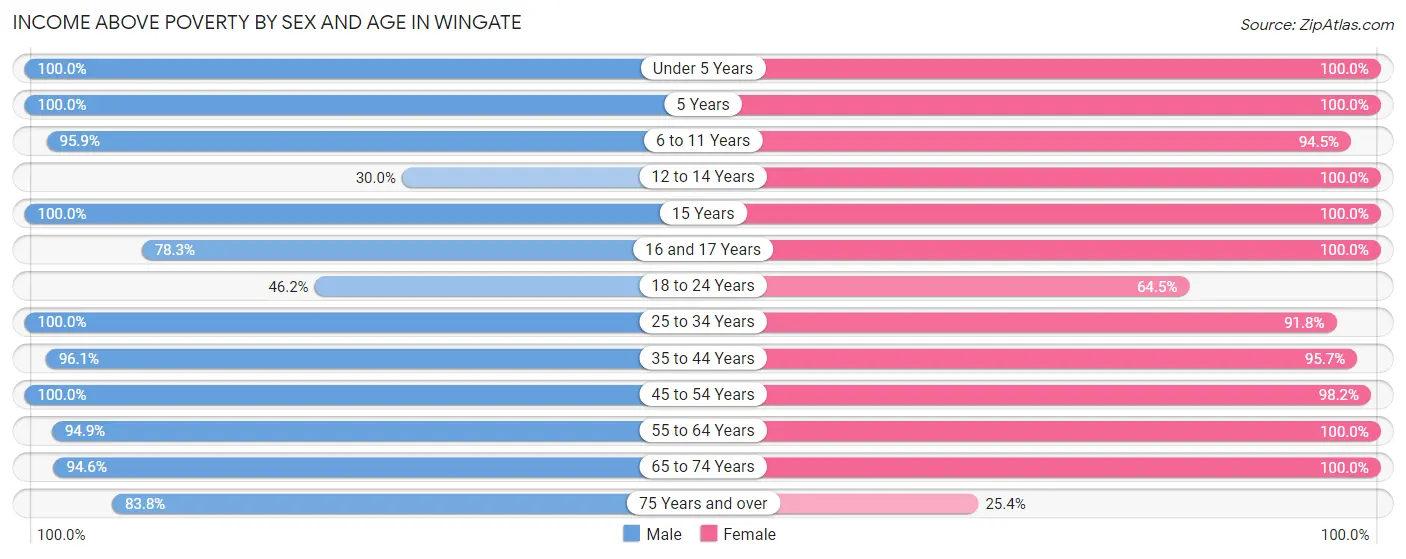
| Age Bracket | Male | Female |
| Under 5 Years | 118 (100.0%) | 86 (100.0%) |
| 5 Years | 56 (100.0%) | 25 (100.0%) |
| 6 to 11 Years | 141 (95.9%) | 103 (94.5%) |
| 12 to 14 Years | 3 (30.0%) | 93 (100.0%) |
| 15 Years | 7 (100.0%) | 112 (100.0%) |
| 16 and 17 Years | 18 (78.3%) | 28 (100.0%) |
| 18 to 24 Years | 79 (46.2%) | 236 (64.5%) |
| 25 to 34 Years | 111 (100.0%) | 212 (91.8%) |
| 35 to 44 Years | 147 (96.1%) | 198 (95.7%) |
| 45 to 54 Years | 152 (100.0%) | 109 (98.2%) |
| 55 to 64 Years | 56 (94.9%) | 83 (100.0%) |
| 65 to 74 Years | 88 (94.6%) | 84 (100.0%) |
| 75 Years and over | 31 (83.8%) | 34 (25.4%) |
| Total | 1,007 (88.6%) | 1,403 (84.1%) |
Income Below Poverty Among Married-Couple Families in Wingate
The poverty statistics for married-couple families in Wingate show that 2.8% or 12 of the total 431 families live below the poverty line. Families with 3 or 4 children have the highest poverty rate of 5.3%, comprising of 6 families. On the other hand, families with 1 or 2 children have the lowest poverty rate of 0.0%, which includes 0 families.
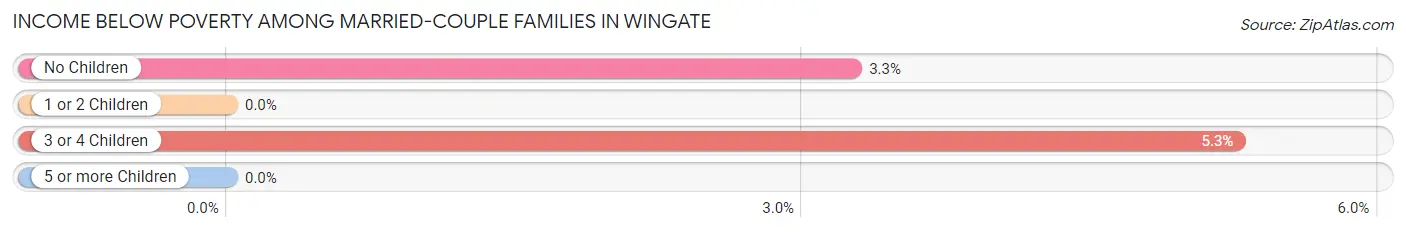
| Children | Above Poverty | Below Poverty |
| No Children | 178 (96.7%) | 6 (3.3%) |
| 1 or 2 Children | 118 (100.0%) | 0 (0.0%) |
| 3 or 4 Children | 108 (94.7%) | 6 (5.3%) |
| 5 or more Children | 15 (100.0%) | 0 (0.0%) |
| Total | 419 (97.2%) | 12 (2.8%) |
Income Below Poverty Among Single-Parent Households in Wingate
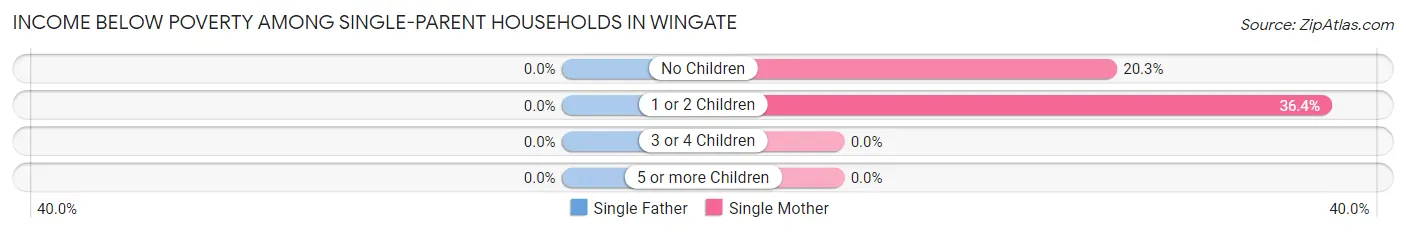
| Children | Single Father | Single Mother |
| No Children | 0 (0.0%) | 13 (20.3%) |
| 1 or 2 Children | 0 (0.0%) | 8 (36.4%) |
| 3 or 4 Children | 0 (0.0%) | 0 (0.0%) |
| 5 or more Children | 0 (0.0%) | 0 (0.0%) |
| Total | 0 (0.0%) | 21 (24.4%) |
Income Below Poverty Among Married-Couple vs Single-Parent Households in Wingate
The poverty data for Wingate shows that 12 of the married-couple family households (2.8%) and 21 of the single-parent households (15.2%) are living below the poverty level. Within the married-couple family households, those with 3 or 4 children have the highest poverty rate, with 6 households (5.3%) falling below the poverty line. Among the single-parent households, those with no children have the highest poverty rate, with 13 household (18.3%) living below poverty.
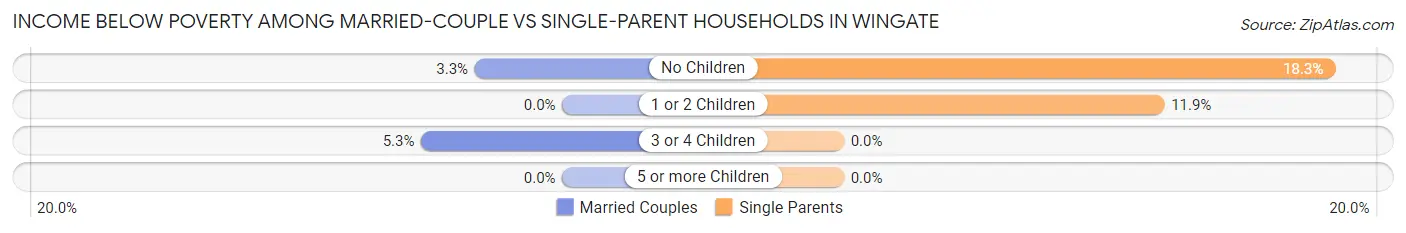
| Children | Married-Couple Families | Single-Parent Households |
| No Children | 6 (3.3%) | 13 (18.3%) |
| 1 or 2 Children | 0 (0.0%) | 8 (11.9%) |
| 3 or 4 Children | 6 (5.3%) | 0 (0.0%) |
| 5 or more Children | 0 (0.0%) | 0 (0.0%) |
| Total | 12 (2.8%) | 21 (15.2%) |
Race in Wingate
The most populous races in Wingate are White / Caucasian (2,486 | 61.2%), Hispanic or Latino (1,220 | 30.0%), and Black / African American (802 | 19.8%).
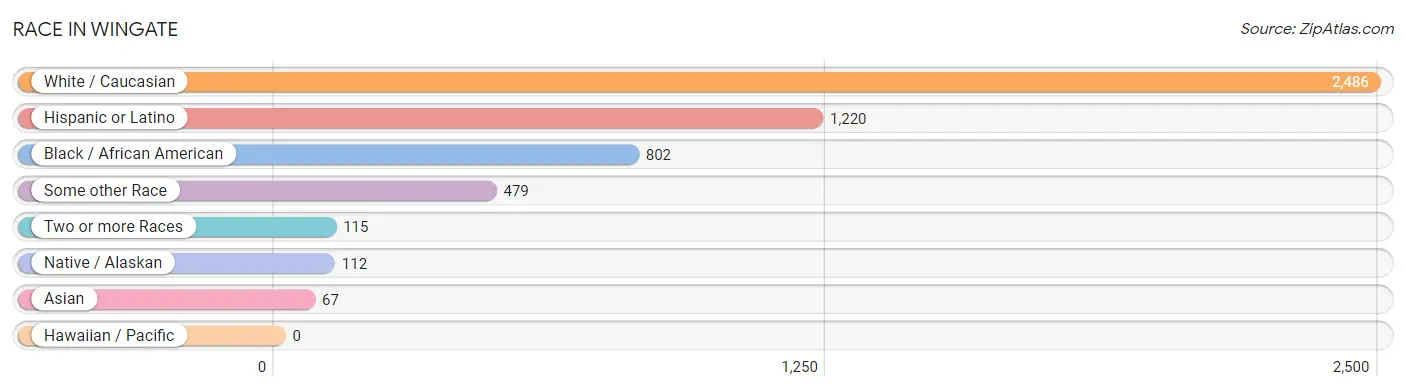
| Race | # Population | % Population |
| Asian | 67 | 1.7% |
| Black / African American | 802 | 19.8% |
| Hawaiian / Pacific | 0 | 0.0% |
| Hispanic or Latino | 1,220 | 30.0% |
| Native / Alaskan | 112 | 2.8% |
| White / Caucasian | 2,486 | 61.2% |
| Two or more Races | 115 | 2.8% |
| Some other Race | 479 | 11.8% |
| Total | 4,061 | 100.0% |
Ancestry in Wingate
The most populous ancestries reported in Wingate are Mexican (796 | 19.6%), Central American (282 | 6.9%), Honduran (269 | 6.6%), English (148 | 3.6%), and Scotch-Irish (137 | 3.4%), together accounting for 40.2% of all Wingate residents.
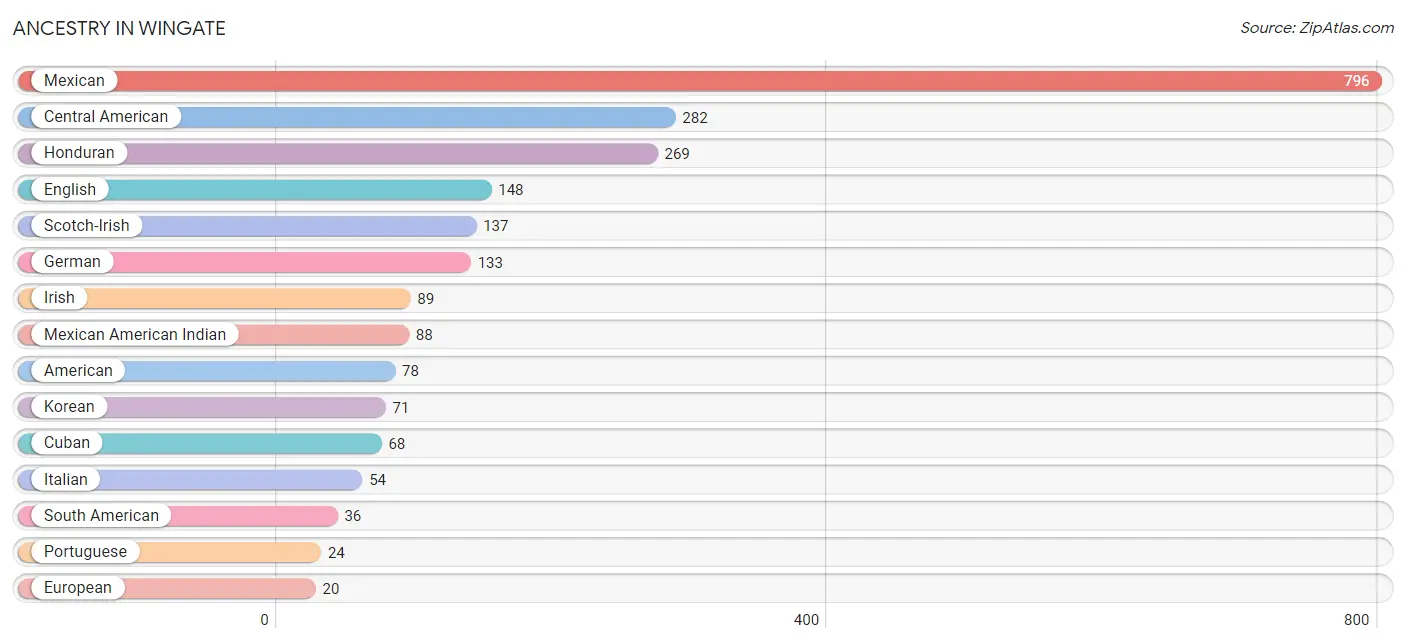
| Ancestry | # Population | % Population |
| African | 7 | 0.2% |
| American | 78 | 1.9% |
| Blackfeet | 6 | 0.2% |
| Bolivian | 8 | 0.2% |
| Canadian | 2 | 0.1% |
| Central American | 282 | 6.9% |
| Cherokee | 5 | 0.1% |
| Cuban | 68 | 1.7% |
| Czech | 3 | 0.1% |
| Dutch | 10 | 0.3% |
| English | 148 | 3.6% |
| European | 20 | 0.5% |
| Filipino | 17 | 0.4% |
| French | 9 | 0.2% |
| German | 133 | 3.3% |
| Ghanaian | 4 | 0.1% |
| Honduran | 269 | 6.6% |
| Indian (Asian) | 2 | 0.1% |
| Irish | 89 | 2.2% |
| Italian | 54 | 1.3% |
| Korean | 71 | 1.8% |
| Mexican | 796 | 19.6% |
| Mexican American Indian | 88 | 2.2% |
| Norwegian | 5 | 0.1% |
| Peruvian | 14 | 0.3% |
| Polish | 7 | 0.2% |
| Portuguese | 24 | 0.6% |
| Romanian | 15 | 0.4% |
| Salvadoran | 13 | 0.3% |
| Scotch-Irish | 137 | 3.4% |
| Scottish | 13 | 0.3% |
| South African | 3 | 0.1% |
| South American | 36 | 0.9% |
| Subsaharan African | 14 | 0.3% |
| Swedish | 7 | 0.2% |
| Venezuelan | 14 | 0.3% |
| Welsh | 5 | 0.1% |
| West Indian | 6 | 0.2% | View All 38 Rows |
Immigrants in Wingate
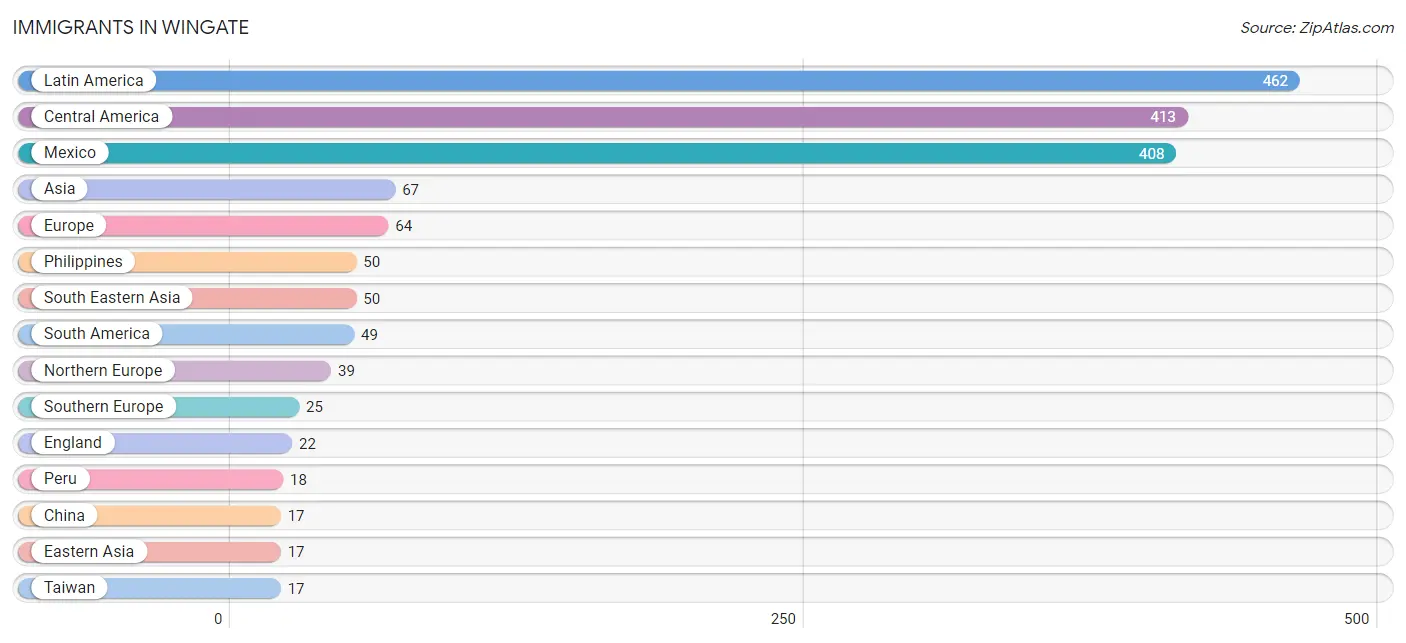
The most numerous immigrant groups reported in Wingate came from Latin America (462 | 11.4%), Central America (413 | 10.2%), Mexico (408 | 10.1%), Asia (67 | 1.7%), and Europe (64 | 1.6%), together accounting for 34.8% of all Wingate residents.
| Immigration Origin | # Population | % Population |
| Africa | 3 | 0.1% |
| Asia | 67 | 1.7% |
| Bolivia | 3 | 0.1% |
| Brazil | 14 | 0.3% |
| Central America | 413 | 10.2% |
| China | 17 | 0.4% |
| Denmark | 7 | 0.2% |
| Eastern Asia | 17 | 0.4% |
| El Salvador | 5 | 0.1% |
| England | 22 | 0.5% |
| Europe | 64 | 1.6% |
| Italy | 14 | 0.3% |
| Latin America | 462 | 11.4% |
| Mexico | 408 | 10.1% |
| Northern Europe | 39 | 1.0% |
| Peru | 18 | 0.4% |
| Philippines | 50 | 1.2% |
| Portugal | 11 | 0.3% |
| South Africa | 3 | 0.1% |
| South America | 49 | 1.2% |
| South Eastern Asia | 50 | 1.2% |
| Southern Europe | 25 | 0.6% |
| Sweden | 7 | 0.2% |
| Taiwan | 17 | 0.4% |
| Venezuela | 14 | 0.3% | View All 25 Rows |
Sex and Age in Wingate
Sex and Age in Wingate
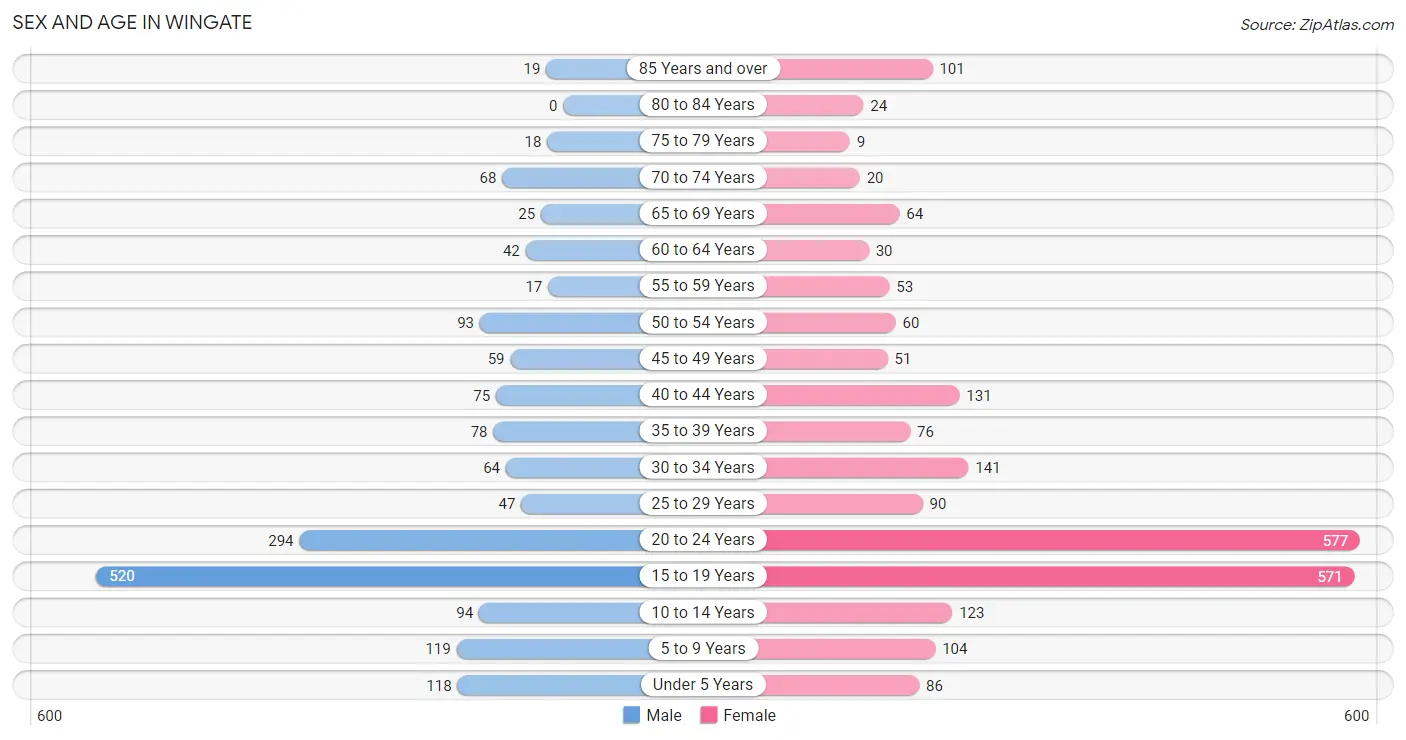
The most populous age groups in Wingate are 15 to 19 Years (520 | 29.7%) for men and 20 to 24 Years (577 | 25.0%) for women.
| Age Bracket | Male | Female |
| Under 5 Years | 118 (6.7%) | 86 (3.7%) |
| 5 to 9 Years | 119 (6.8%) | 104 (4.5%) |
| 10 to 14 Years | 94 (5.4%) | 123 (5.3%) |
| 15 to 19 Years | 520 (29.7%) | 571 (24.7%) |
| 20 to 24 Years | 294 (16.8%) | 577 (25.0%) |
| 25 to 29 Years | 47 (2.7%) | 90 (3.9%) |
| 30 to 34 Years | 64 (3.7%) | 141 (6.1%) |
| 35 to 39 Years | 78 (4.5%) | 76 (3.3%) |
| 40 to 44 Years | 75 (4.3%) | 131 (5.7%) |
| 45 to 49 Years | 59 (3.4%) | 51 (2.2%) |
| 50 to 54 Years | 93 (5.3%) | 60 (2.6%) |
| 55 to 59 Years | 17 (1.0%) | 53 (2.3%) |
| 60 to 64 Years | 42 (2.4%) | 30 (1.3%) |
| 65 to 69 Years | 25 (1.4%) | 64 (2.8%) |
| 70 to 74 Years | 68 (3.9%) | 20 (0.9%) |
| 75 to 79 Years | 18 (1.0%) | 9 (0.4%) |
| 80 to 84 Years | 0 (0.0%) | 24 (1.0%) |
| 85 Years and over | 19 (1.1%) | 101 (4.4%) |
| Total | 1,750 (100.0%) | 2,311 (100.0%) |
Families and Households in Wingate
Median Family Size in Wingate
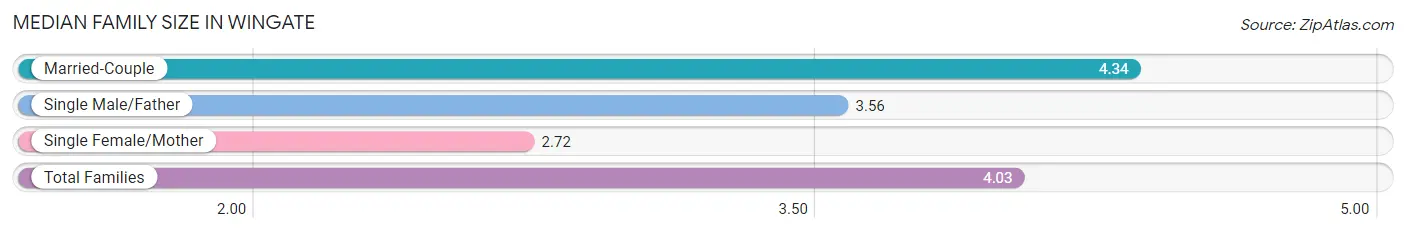
The median family size in Wingate is 4.03 persons per family, with married-couple families (431 | 75.7%) accounting for the largest median family size of 4.34 persons per family. On the other hand, single female/mother families (86 | 15.1%) represent the smallest median family size with 2.72 persons per family.
| Family Type | # Families | Family Size |
| Married-Couple | 431 (75.7%) | 4.34 |
| Single Male/Father | 52 (9.1%) | 3.56 |
| Single Female/Mother | 86 (15.1%) | 2.72 |
| Total Families | 569 (100.0%) | 4.03 |
Median Household Size in Wingate
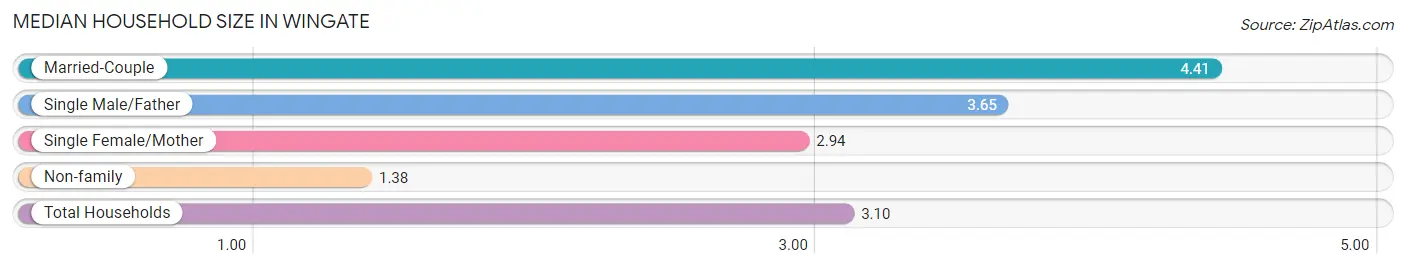
The median household size in Wingate is 3.10 persons per household, with married-couple households (431 | 47.7%) accounting for the largest median household size of 4.41 persons per household. non-family households (335 | 37.1%) represent the smallest median household size with 1.38 persons per household.
| Household Type | # Households | Household Size |
| Married-Couple | 431 (47.7%) | 4.41 |
| Single Male/Father | 52 (5.8%) | 3.65 |
| Single Female/Mother | 86 (9.5%) | 2.94 |
| Non-family | 335 (37.1%) | 1.38 |
| Total Households | 904 (100.0%) | 3.10 |
Household Size by Marriage Status in Wingate
Out of a total of 904 households in Wingate, 569 (62.9%) are family households, while 335 (37.1%) are nonfamily households. The most numerous type of family households are 2-person households, comprising 217, and the most common type of nonfamily households are 1-person households, comprising 278.
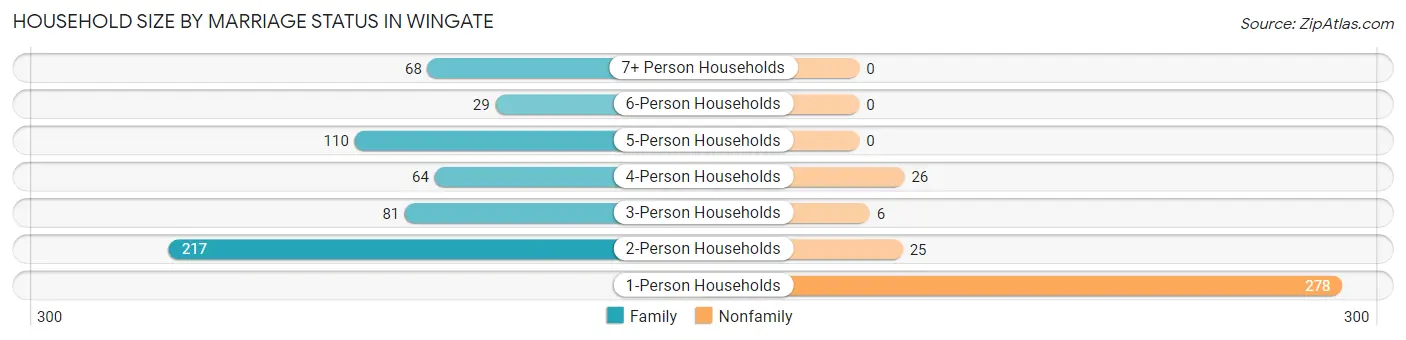
| Household Size | Family Households | Nonfamily Households |
| 1-Person Households | - | 278 (30.7%) |
| 2-Person Households | 217 (24.0%) | 25 (2.8%) |
| 3-Person Households | 81 (9.0%) | 6 (0.7%) |
| 4-Person Households | 64 (7.1%) | 26 (2.9%) |
| 5-Person Households | 110 (12.2%) | 0 (0.0%) |
| 6-Person Households | 29 (3.2%) | 0 (0.0%) |
| 7+ Person Households | 68 (7.5%) | 0 (0.0%) |
| Total | 569 (62.9%) | 335 (37.1%) |
Female Fertility in Wingate
Fertility by Age in Wingate
Average fertility rate in Wingate is 46.0 births per 1,000 women. Women in the age bracket of 20 to 34 years have the highest fertility rate with 75.0 births per 1,000 women. Women in the age bracket of 20 to 34 years acount for 79.2% of all women with births.
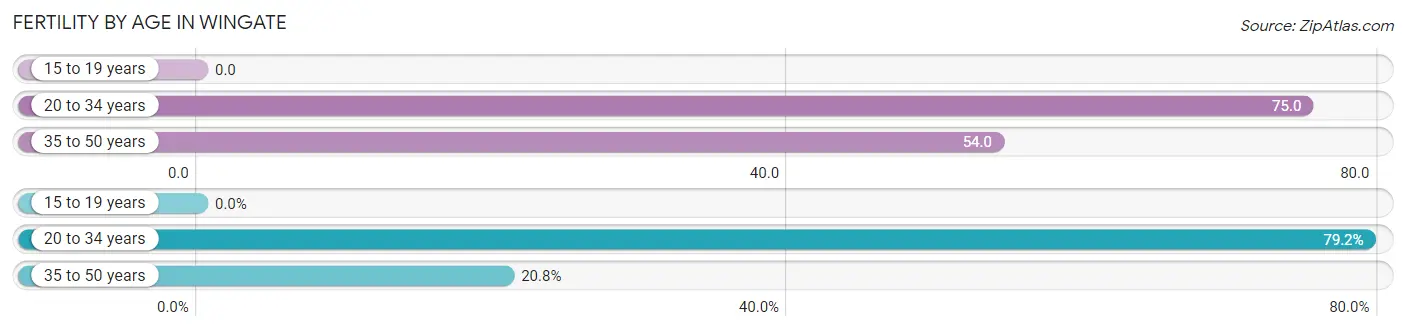
| Age Bracket | Women with Births | Births / 1,000 Women |
| 15 to 19 years | 0 (0.0%) | 0.0 |
| 20 to 34 years | 61 (79.2%) | 75.0 |
| 35 to 50 years | 16 (20.8%) | 54.0 |
| Total | 77 (100.0%) | 46.0 |
Fertility by Age by Marriage Status in Wingate
37.7% of women with births (77) in Wingate are married. The highest percentage of unmarried women with births falls into 35 to 50 years age bracket with 100.0% of them unmarried at the time of birth, while the lowest percentage of unmarried women with births belong to 20 to 34 years age bracket with 52.5% of them unmarried.
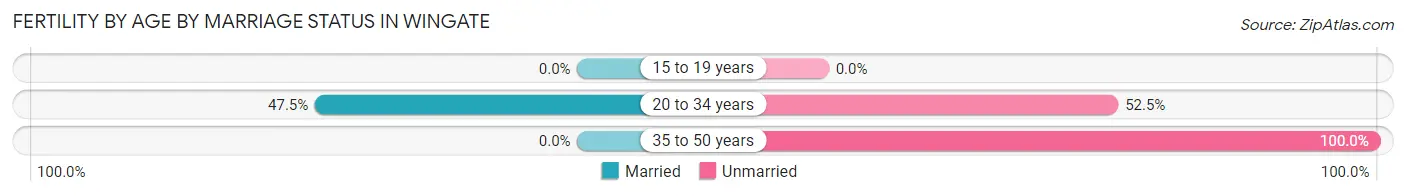
| Age Bracket | Married | Unmarried |
| 15 to 19 years | 0 (0.0%) | 0 (0.0%) |
| 20 to 34 years | 29 (47.5%) | 32 (52.5%) |
| 35 to 50 years | 0 (0.0%) | 16 (100.0%) |
| Total | 29 (37.7%) | 48 (62.3%) |
Fertility by Education in Wingate
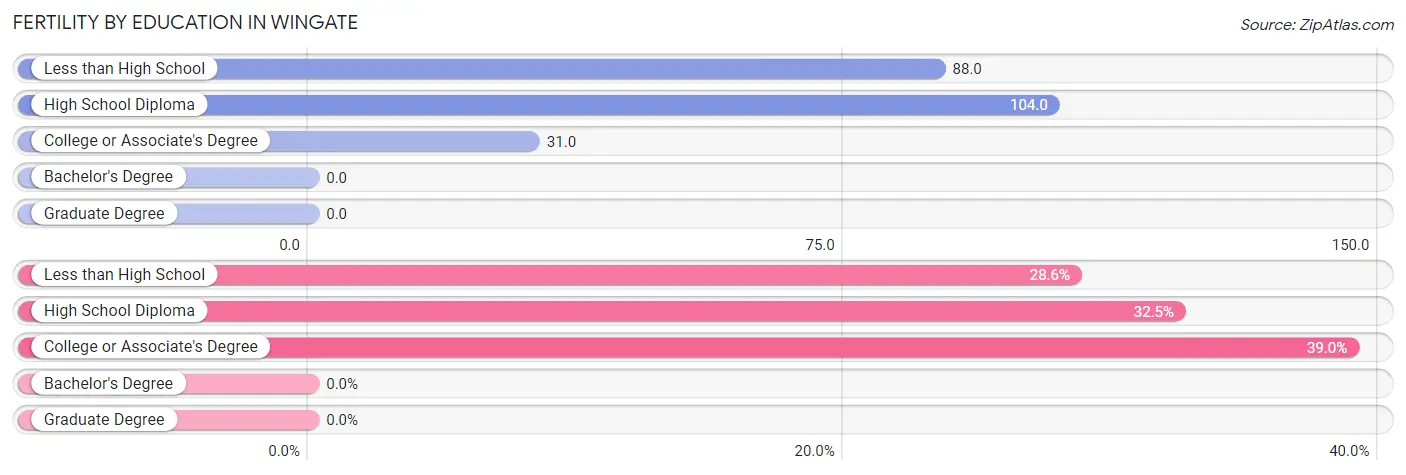
| Educational Attainment | Women with Births | Births / 1,000 Women |
| Less than High School | 22 (28.6%) | 88.0 |
| High School Diploma | 25 (32.5%) | 104.0 |
| College or Associate's Degree | 30 (39.0%) | 31.0 |
| Bachelor's Degree | 0 (0.0%) | 0.0 |
| Graduate Degree | 0 (0.0%) | 0.0 |
| Total | 77 (100.0%) | 46.0 |
Fertility by Education by Marriage Status in Wingate
62.3% of women with births in Wingate are unmarried. Women with the educational attainment of college or associate's degree are most likely to be married with 50.0% of them married at childbirth, while women with the educational attainment of less than high school are least likely to be married with 77.3% of them unmarried at childbirth.
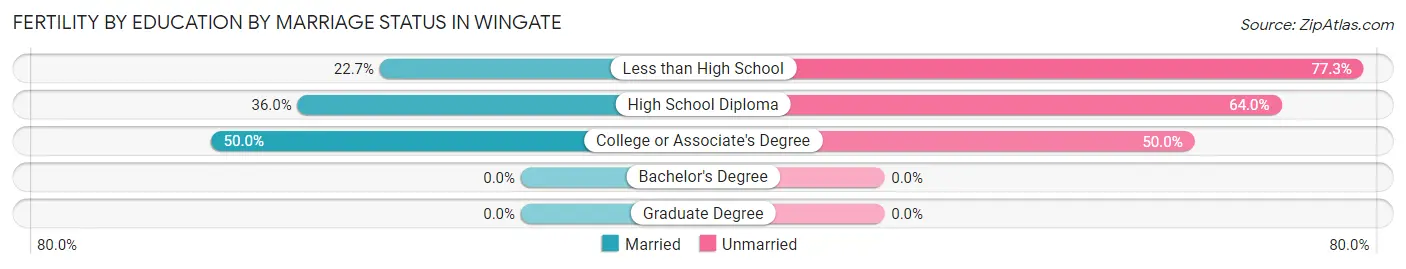
| Educational Attainment | Married | Unmarried |
| Less than High School | 5 (22.7%) | 17 (77.3%) |
| High School Diploma | 9 (36.0%) | 16 (64.0%) |
| College or Associate's Degree | 15 (50.0%) | 15 (50.0%) |
| Bachelor's Degree | 0 (0.0%) | 0 (0.0%) |
| Graduate Degree | 0 (0.0%) | 0 (0.0%) |
| Total | 29 (37.7%) | 48 (62.3%) |
Employment Characteristics in Wingate
Employment by Class of Employer in Wingate
Among the 1,668 employed individuals in Wingate, private company employees (1,274 | 76.4%), local government employees (105 | 6.3%), and federal government employees (88 | 5.3%) make up the most common classes of employment.
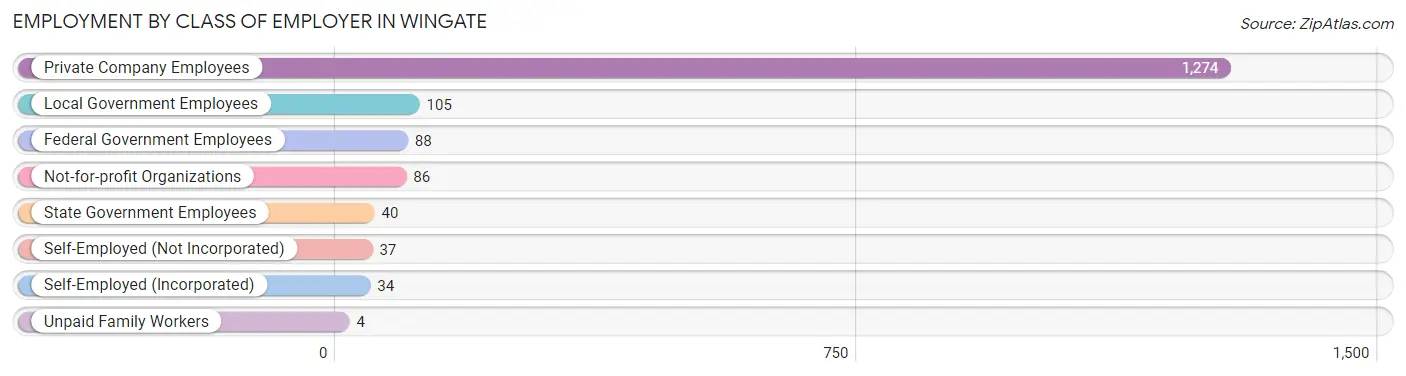
| Employer Class | # Employees | % Employees |
| Private Company Employees | 1,274 | 76.4% |
| Self-Employed (Incorporated) | 34 | 2.0% |
| Self-Employed (Not Incorporated) | 37 | 2.2% |
| Not-for-profit Organizations | 86 | 5.2% |
| Local Government Employees | 105 | 6.3% |
| State Government Employees | 40 | 2.4% |
| Federal Government Employees | 88 | 5.3% |
| Unpaid Family Workers | 4 | 0.2% |
| Total | 1,668 | 100.0% |
Employment Status by Age in Wingate
According to the labor force statistics for Wingate, out of the total population over 16 years of age (3,298), 54.2% or 1,788 individuals are in the labor force, with 0.6% or 11 of them unemployed. The age group with the highest labor force participation rate is 25 to 29 years, with 93.4% or 128 individuals in the labor force. Within the labor force, the 16 to 19 years age range has the highest percentage of unemployed individuals, with 1.5% or 4 of them being unemployed.
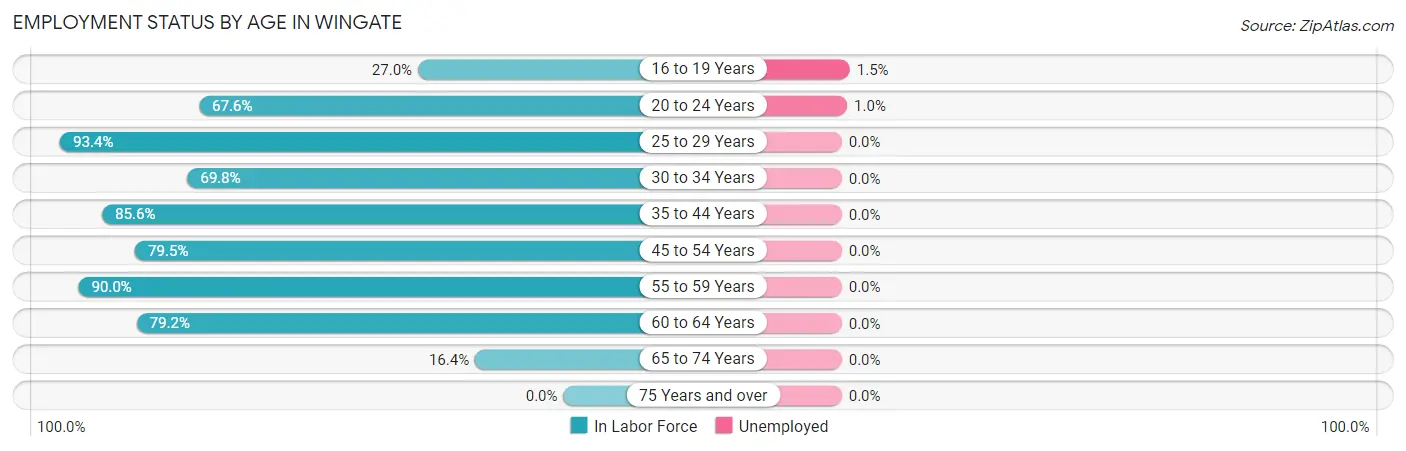
| Age Bracket | In Labor Force | Unemployed |
| 16 to 19 Years | 262 (27.0%) | 4 (1.5%) |
| 20 to 24 Years | 589 (67.6%) | 6 (1.0%) |
| 25 to 29 Years | 128 (93.4%) | 0 (0.0%) |
| 30 to 34 Years | 143 (69.8%) | 0 (0.0%) |
| 35 to 44 Years | 308 (85.6%) | 0 (0.0%) |
| 45 to 54 Years | 209 (79.5%) | 0 (0.0%) |
| 55 to 59 Years | 63 (90.0%) | 0 (0.0%) |
| 60 to 64 Years | 57 (79.2%) | 0 (0.0%) |
| 65 to 74 Years | 29 (16.4%) | 0 (0.0%) |
| 75 Years and over | 0 (0.0%) | 0 (0.0%) |
| Total | 1,788 (54.2%) | 11 (0.6%) |
Employment Status by Educational Attainment in Wingate
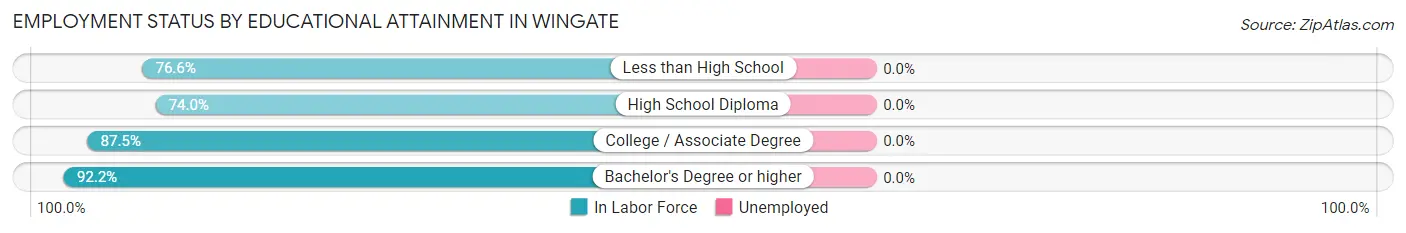
| Educational Attainment | In Labor Force | Unemployed |
| Less than High School | 203 (76.6%) | 0 (0.0%) |
| High School Diploma | 231 (74.0%) | 0 (0.0%) |
| College / Associate Degree | 274 (87.5%) | 0 (0.0%) |
| Bachelor's Degree or higher | 200 (92.2%) | 0 (0.0%) |
| Total | 908 (82.0%) | 0 (0.0%) |
Employment Occupations by Sex in Wingate
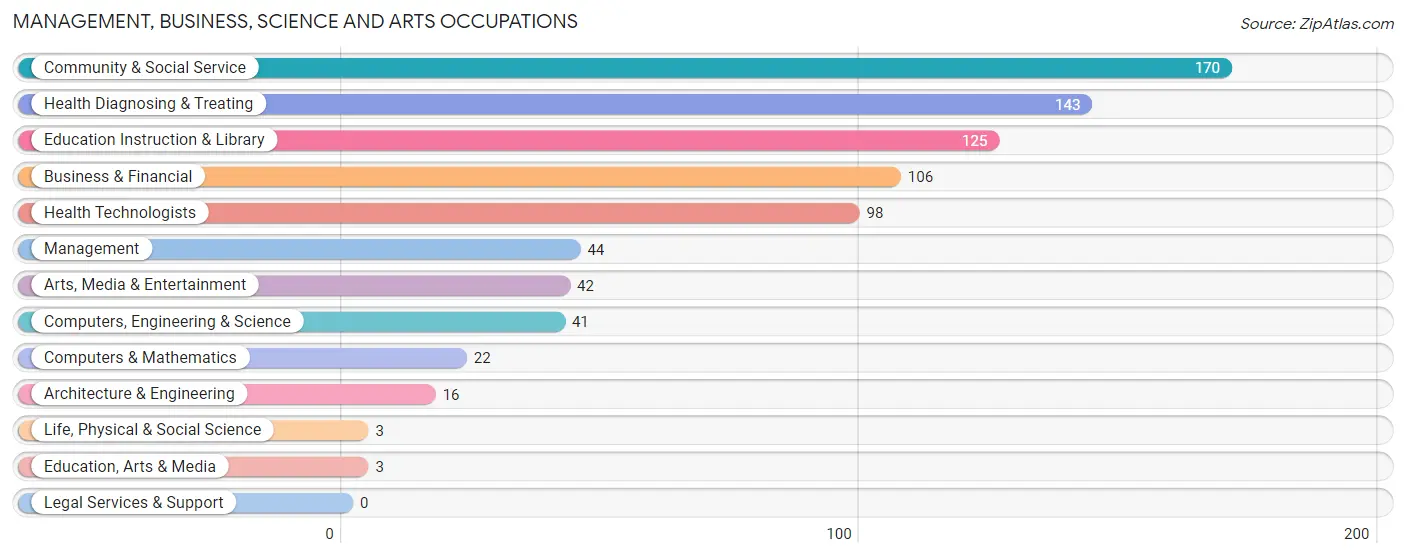
Management, Business, Science and Arts Occupations
The most common Management, Business, Science and Arts occupations in Wingate are Community & Social Service (170 | 9.6%), Health Diagnosing & Treating (143 | 8.0%), Education Instruction & Library (125 | 7.0%), Business & Financial (106 | 6.0%), and Health Technologists (98 | 5.5%).
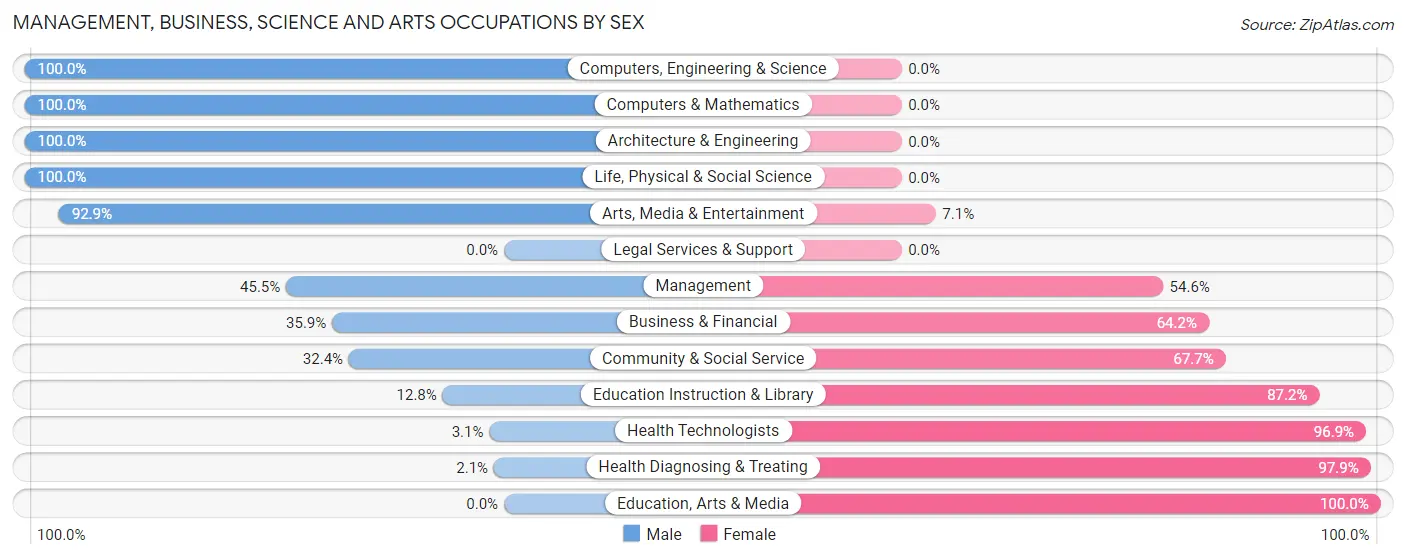
Management, Business, Science and Arts Occupations by Sex
Within the Management, Business, Science and Arts occupations in Wingate, the most male-oriented occupations are Computers, Engineering & Science (100.0%), Computers & Mathematics (100.0%), and Architecture & Engineering (100.0%), while the most female-oriented occupations are Education, Arts & Media (100.0%), Health Diagnosing & Treating (97.9%), and Health Technologists (96.9%).
| Occupation | Male | Female |
| Management | 20 (45.5%) | 24 (54.5%) |
| Business & Financial | 38 (35.8%) | 68 (64.1%) |
| Computers, Engineering & Science | 41 (100.0%) | 0 (0.0%) |
| Computers & Mathematics | 22 (100.0%) | 0 (0.0%) |
| Architecture & Engineering | 16 (100.0%) | 0 (0.0%) |
| Life, Physical & Social Science | 3 (100.0%) | 0 (0.0%) |
| Community & Social Service | 55 (32.4%) | 115 (67.6%) |
| Education, Arts & Media | 0 (0.0%) | 3 (100.0%) |
| Legal Services & Support | 0 (0.0%) | 0 (0.0%) |
| Education Instruction & Library | 16 (12.8%) | 109 (87.2%) |
| Arts, Media & Entertainment | 39 (92.9%) | 3 (7.1%) |
| Health Diagnosing & Treating | 3 (2.1%) | 140 (97.9%) |
| Health Technologists | 3 (3.1%) | 95 (96.9%) |
| Total (Category) | 157 (31.1%) | 347 (68.9%) |
| Total (Overall) | 778 (43.8%) | 1,000 (56.2%) |
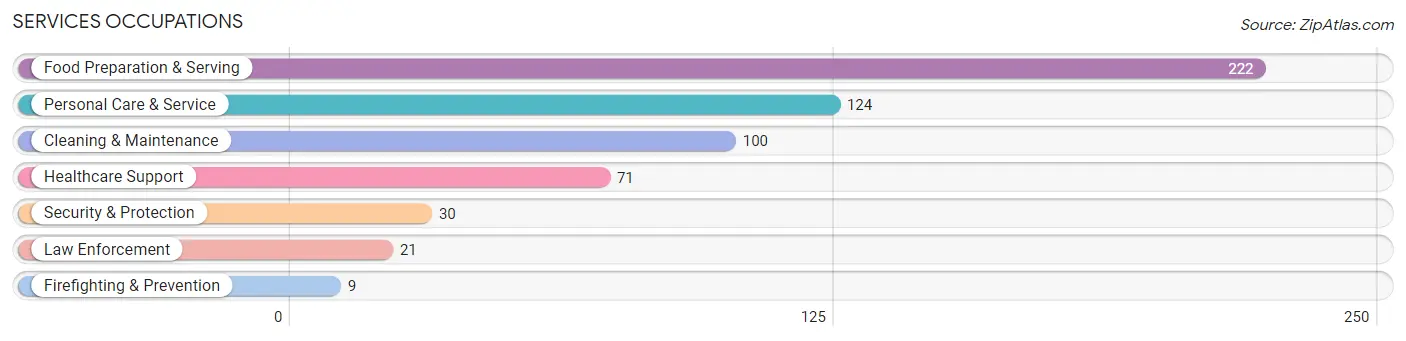
Services Occupations
The most common Services occupations in Wingate are Food Preparation & Serving (222 | 12.5%), Personal Care & Service (124 | 7.0%), Cleaning & Maintenance (100 | 5.6%), Healthcare Support (71 | 4.0%), and Security & Protection (30 | 1.7%).
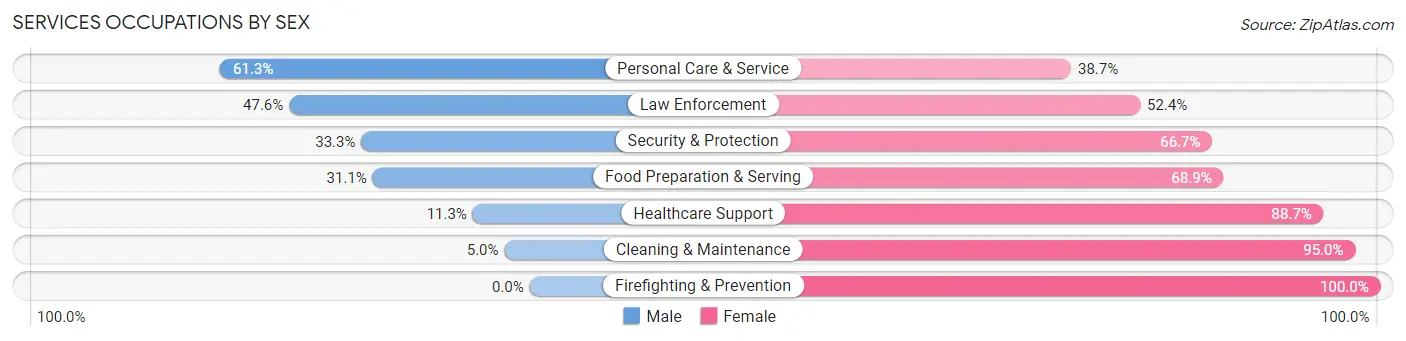
Services Occupations by Sex
Within the Services occupations in Wingate, the most male-oriented occupations are Personal Care & Service (61.3%), Law Enforcement (47.6%), and Security & Protection (33.3%), while the most female-oriented occupations are Firefighting & Prevention (100.0%), Cleaning & Maintenance (95.0%), and Healthcare Support (88.7%).
| Occupation | Male | Female |
| Healthcare Support | 8 (11.3%) | 63 (88.7%) |
| Security & Protection | 10 (33.3%) | 20 (66.7%) |
| Firefighting & Prevention | 0 (0.0%) | 9 (100.0%) |
| Law Enforcement | 10 (47.6%) | 11 (52.4%) |
| Food Preparation & Serving | 69 (31.1%) | 153 (68.9%) |
| Cleaning & Maintenance | 5 (5.0%) | 95 (95.0%) |
| Personal Care & Service | 76 (61.3%) | 48 (38.7%) |
| Total (Category) | 168 (30.7%) | 379 (69.3%) |
| Total (Overall) | 778 (43.8%) | 1,000 (56.2%) |
Sales and Office Occupations
The most common Sales and Office occupations in Wingate are Office & Administration (204 | 11.5%), and Sales & Related (139 | 7.8%).
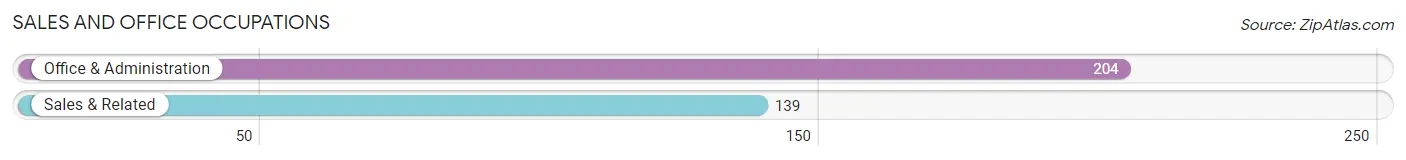
Sales and Office Occupations by Sex
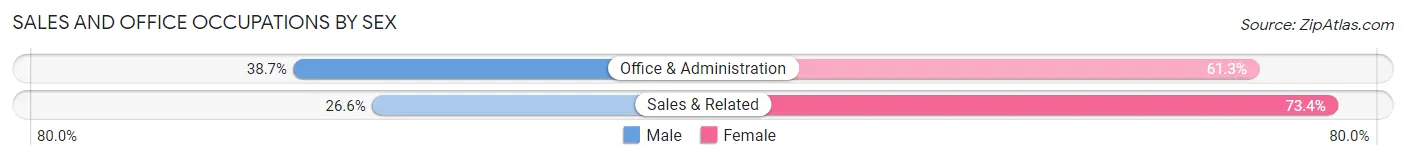
| Occupation | Male | Female |
| Sales & Related | 37 (26.6%) | 102 (73.4%) |
| Office & Administration | 79 (38.7%) | 125 (61.3%) |
| Total (Category) | 116 (33.8%) | 227 (66.2%) |
| Total (Overall) | 778 (43.8%) | 1,000 (56.2%) |
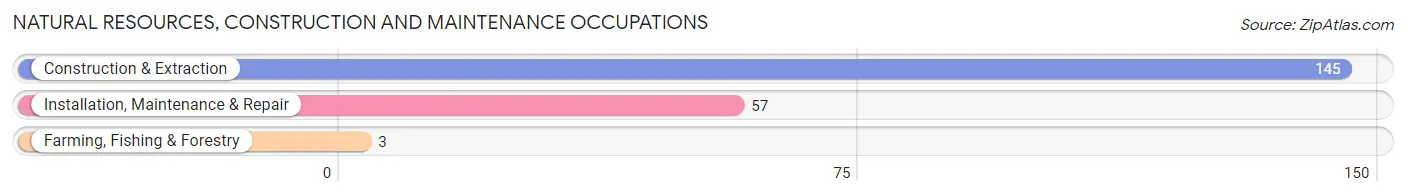
Natural Resources, Construction and Maintenance Occupations
The most common Natural Resources, Construction and Maintenance occupations in Wingate are Construction & Extraction (145 | 8.2%), Installation, Maintenance & Repair (57 | 3.2%), and Farming, Fishing & Forestry (3 | 0.2%).
Natural Resources, Construction and Maintenance Occupations by Sex
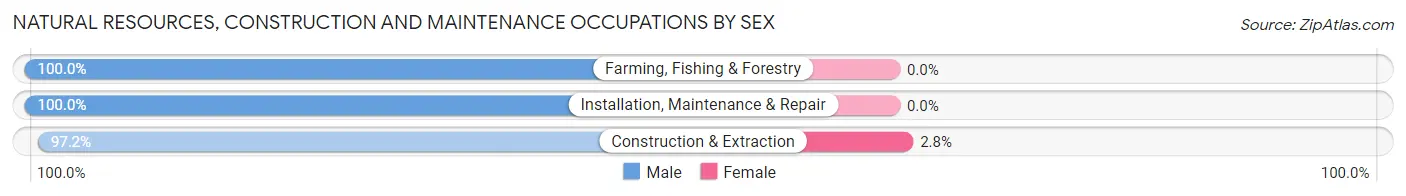
| Occupation | Male | Female |
| Farming, Fishing & Forestry | 3 (100.0%) | 0 (0.0%) |
| Construction & Extraction | 141 (97.2%) | 4 (2.8%) |
| Installation, Maintenance & Repair | 57 (100.0%) | 0 (0.0%) |
| Total (Category) | 201 (98.1%) | 4 (1.9%) |
| Total (Overall) | 778 (43.8%) | 1,000 (56.2%) |
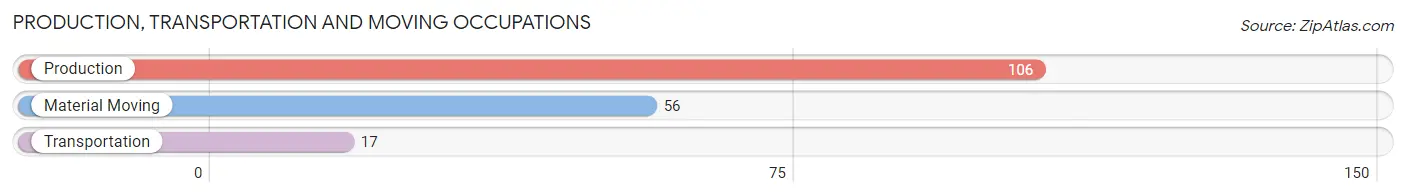
Production, Transportation and Moving Occupations
The most common Production, Transportation and Moving occupations in Wingate are Production (106 | 6.0%), Material Moving (56 | 3.2%), and Transportation (17 | 1.0%).
Production, Transportation and Moving Occupations by Sex
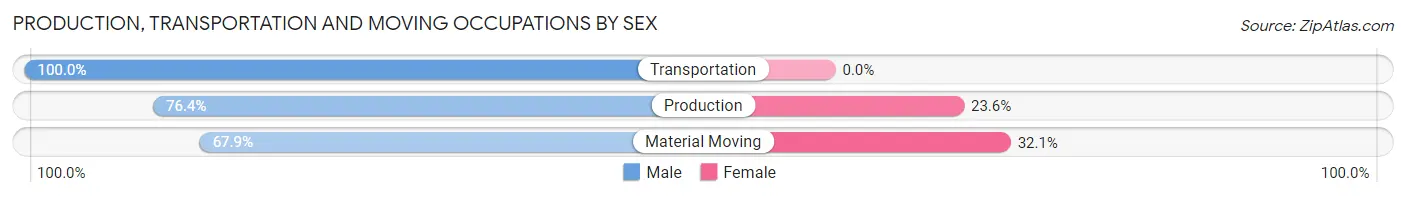
| Occupation | Male | Female |
| Production | 81 (76.4%) | 25 (23.6%) |
| Transportation | 17 (100.0%) | 0 (0.0%) |
| Material Moving | 38 (67.9%) | 18 (32.1%) |
| Total (Category) | 136 (76.0%) | 43 (24.0%) |
| Total (Overall) | 778 (43.8%) | 1,000 (56.2%) |
Employment Industries by Sex in Wingate
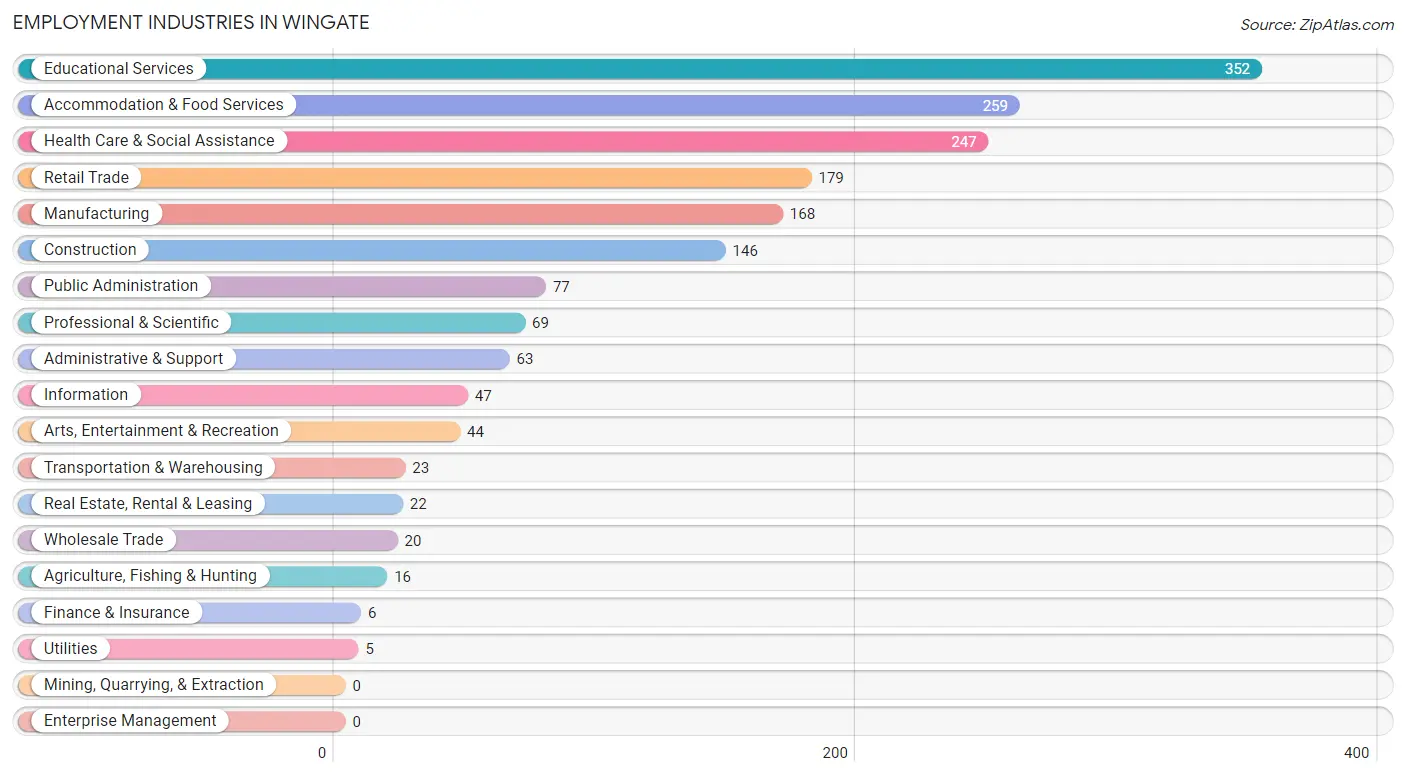
Employment Industries in Wingate
The major employment industries in Wingate include Educational Services (352 | 19.8%), Accommodation & Food Services (259 | 14.6%), Health Care & Social Assistance (247 | 13.9%), Retail Trade (179 | 10.1%), and Manufacturing (168 | 9.5%).
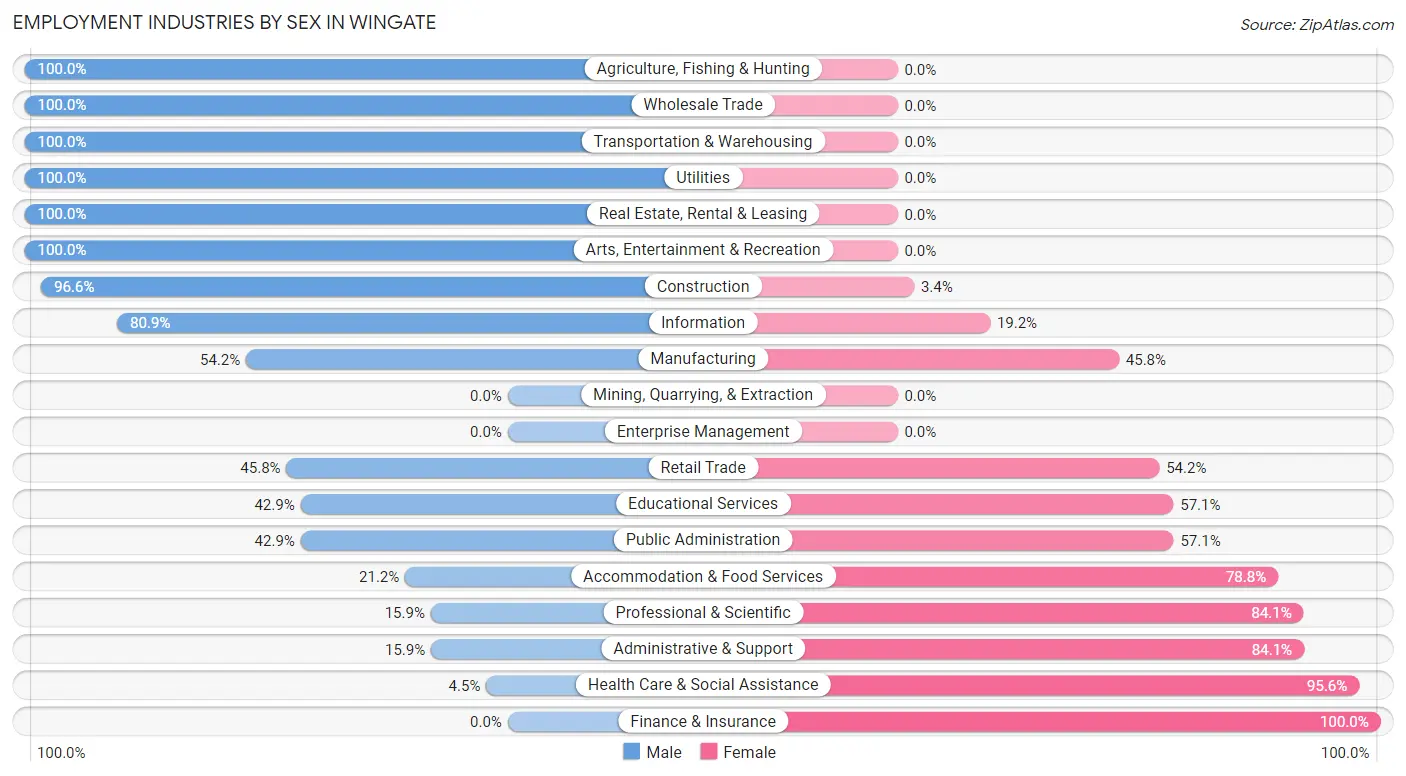
Employment Industries by Sex in Wingate
The Wingate industries that see more men than women are Agriculture, Fishing & Hunting (100.0%), Wholesale Trade (100.0%), and Transportation & Warehousing (100.0%), whereas the industries that tend to have a higher number of women are Finance & Insurance (100.0%), Health Care & Social Assistance (95.6%), and Administrative & Support (84.1%).
| Industry | Male | Female |
| Agriculture, Fishing & Hunting | 16 (100.0%) | 0 (0.0%) |
| Mining, Quarrying, & Extraction | 0 (0.0%) | 0 (0.0%) |
| Construction | 141 (96.6%) | 5 (3.4%) |
| Manufacturing | 91 (54.2%) | 77 (45.8%) |
| Wholesale Trade | 20 (100.0%) | 0 (0.0%) |
| Retail Trade | 82 (45.8%) | 97 (54.2%) |
| Transportation & Warehousing | 23 (100.0%) | 0 (0.0%) |
| Utilities | 5 (100.0%) | 0 (0.0%) |
| Information | 38 (80.8%) | 9 (19.2%) |
| Finance & Insurance | 0 (0.0%) | 6 (100.0%) |
| Real Estate, Rental & Leasing | 22 (100.0%) | 0 (0.0%) |
| Professional & Scientific | 11 (15.9%) | 58 (84.1%) |
| Enterprise Management | 0 (0.0%) | 0 (0.0%) |
| Administrative & Support | 10 (15.9%) | 53 (84.1%) |
| Educational Services | 151 (42.9%) | 201 (57.1%) |
| Health Care & Social Assistance | 11 (4.4%) | 236 (95.6%) |
| Arts, Entertainment & Recreation | 44 (100.0%) | 0 (0.0%) |
| Accommodation & Food Services | 55 (21.2%) | 204 (78.8%) |
| Public Administration | 33 (42.9%) | 44 (57.1%) |
| Total | 778 (43.8%) | 1,000 (56.2%) |
Education in Wingate
School Enrollment in Wingate
The most common levels of schooling among the 2,241 students in Wingate are college / undergraduate (1,533 | 68.4%), middle school (255 | 11.4%), and high school (159 | 7.1%).
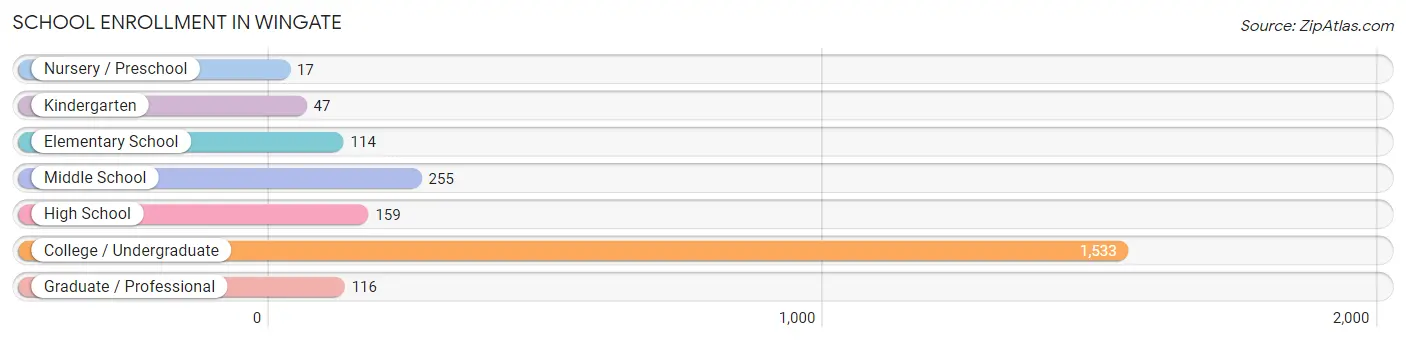
| School Level | # Students | % Students |
| Nursery / Preschool | 17 | 0.8% |
| Kindergarten | 47 | 2.1% |
| Elementary School | 114 | 5.1% |
| Middle School | 255 | 11.4% |
| High School | 159 | 7.1% |
| College / Undergraduate | 1,533 | 68.4% |
| Graduate / Professional | 116 | 5.2% |
| Total | 2,241 | 100.0% |
School Enrollment by Age by Funding Source in Wingate
Out of a total of 2,241 students who are enrolled in schools in Wingate, 1,450 (64.7%) attend a private institution, while the remaining 791 (35.3%) are enrolled in public schools. The age group of 18 to 19 year olds has the highest likelihood of being enrolled in private schools, with 851 (94.5% in the age bracket) enrolled. Conversely, the age group of 3 to 4 year olds has the lowest likelihood of being enrolled in a private school, with 11 (100.0% in the age bracket) attending a public institution.
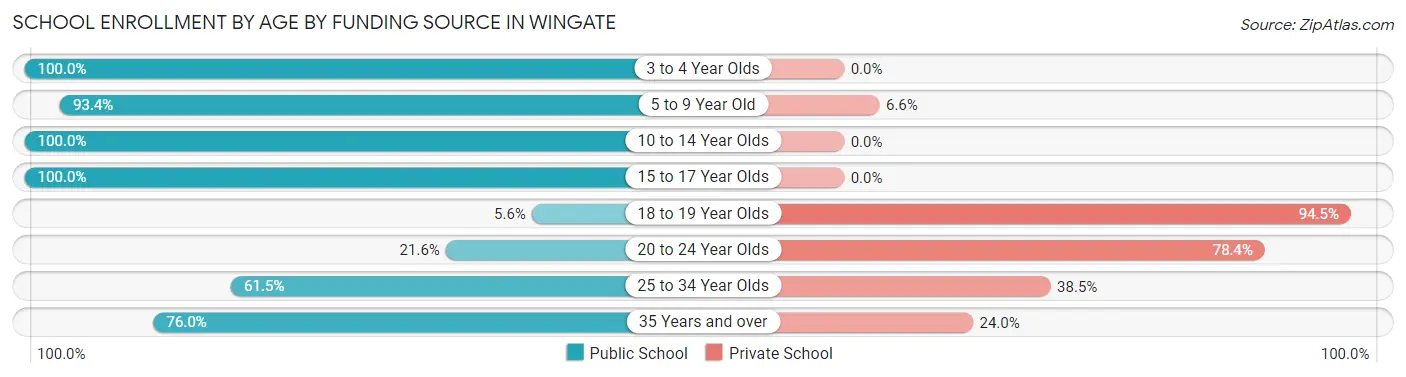
| Age Bracket | Public School | Private School |
| 3 to 4 Year Olds | 11 (100.0%) | 0 (0.0%) |
| 5 to 9 Year Old | 156 (93.4%) | 11 (6.6%) |
| 10 to 14 Year Olds | 217 (100.0%) | 0 (0.0%) |
| 15 to 17 Year Olds | 170 (100.0%) | 0 (0.0%) |
| 18 to 19 Year Olds | 50 (5.6%) | 851 (94.5%) |
| 20 to 24 Year Olds | 159 (21.6%) | 578 (78.4%) |
| 25 to 34 Year Olds | 8 (61.5%) | 5 (38.5%) |
| 35 Years and over | 19 (76.0%) | 6 (24.0%) |
| Total | 791 (35.3%) | 1,450 (64.7%) |
Educational Attainment by Field of Study in Wingate
Arts & humanities (95 | 22.2%), science & technology (73 | 17.1%), bio, nature & agricultural (65 | 15.2%), education (56 | 13.1%), and social sciences (31 | 7.2%) are the most common fields of study among 428 individuals in Wingate who have obtained a bachelor's degree or higher.
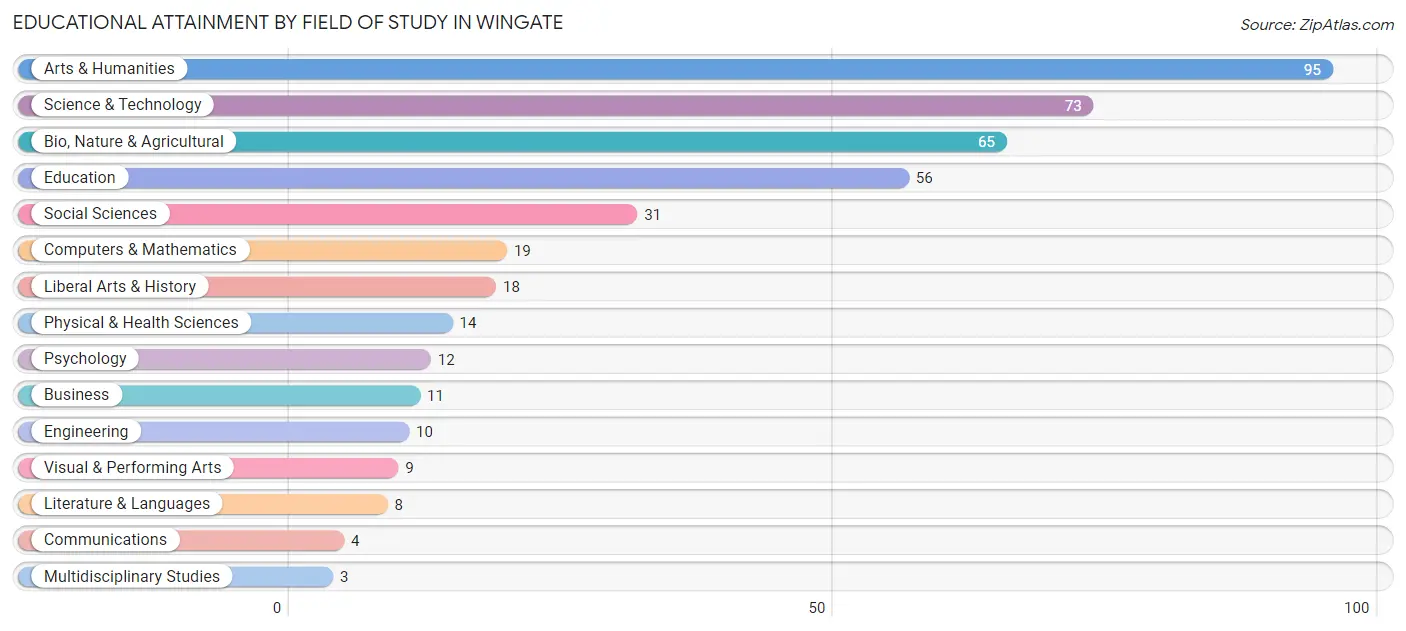
| Field of Study | # Graduates | % Graduates |
| Computers & Mathematics | 19 | 4.4% |
| Bio, Nature & Agricultural | 65 | 15.2% |
| Physical & Health Sciences | 14 | 3.3% |
| Psychology | 12 | 2.8% |
| Social Sciences | 31 | 7.2% |
| Engineering | 10 | 2.3% |
| Multidisciplinary Studies | 3 | 0.7% |
| Science & Technology | 73 | 17.1% |
| Business | 11 | 2.6% |
| Education | 56 | 13.1% |
| Literature & Languages | 8 | 1.9% |
| Liberal Arts & History | 18 | 4.2% |
| Visual & Performing Arts | 9 | 2.1% |
| Communications | 4 | 0.9% |
| Arts & Humanities | 95 | 22.2% |
| Total | 428 | 100.0% |
Transportation & Commute in Wingate
Vehicle Availability by Sex in Wingate
The most prevalent vehicle ownership categories in Wingate are males with 2 vehicles (233, accounting for 39.6%) and females with 2 vehicles (323, making up 31.7%).
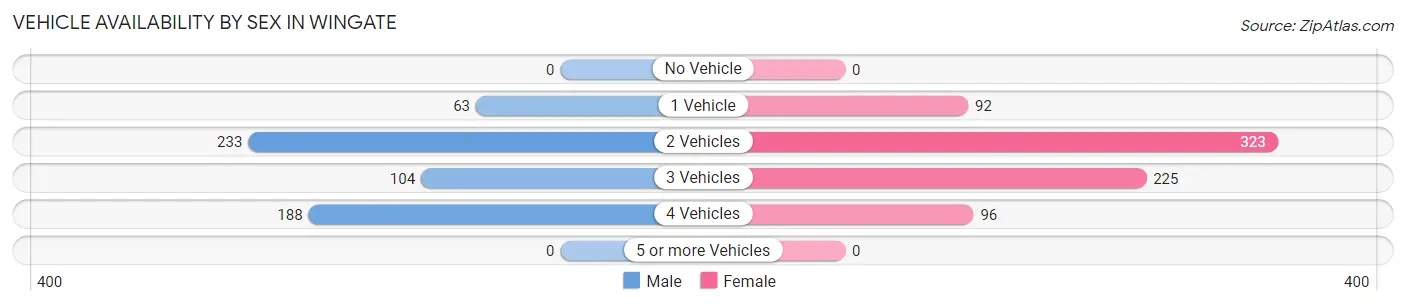
| Vehicles Available | Male | Female |
| No Vehicle | 0 (0.0%) | 0 (0.0%) |
| 1 Vehicle | 63 (10.7%) | 92 (12.5%) |
| 2 Vehicles | 233 (39.6%) | 323 (43.9%) |
| 3 Vehicles | 104 (17.7%) | 225 (30.6%) |
| 4 Vehicles | 188 (32.0%) | 96 (13.0%) |
| 5 or more Vehicles | 0 (0.0%) | 0 (0.0%) |
| Total | 588 (100.0%) | 736 (100.0%) |
Commute Time in Wingate
The most frequently occuring commute durations in Wingate are 5 to 9 minutes (293 commuters, 20.7%), 15 to 19 minutes (174 commuters, 12.3%), and less than 5 minutes (166 commuters, 11.8%).
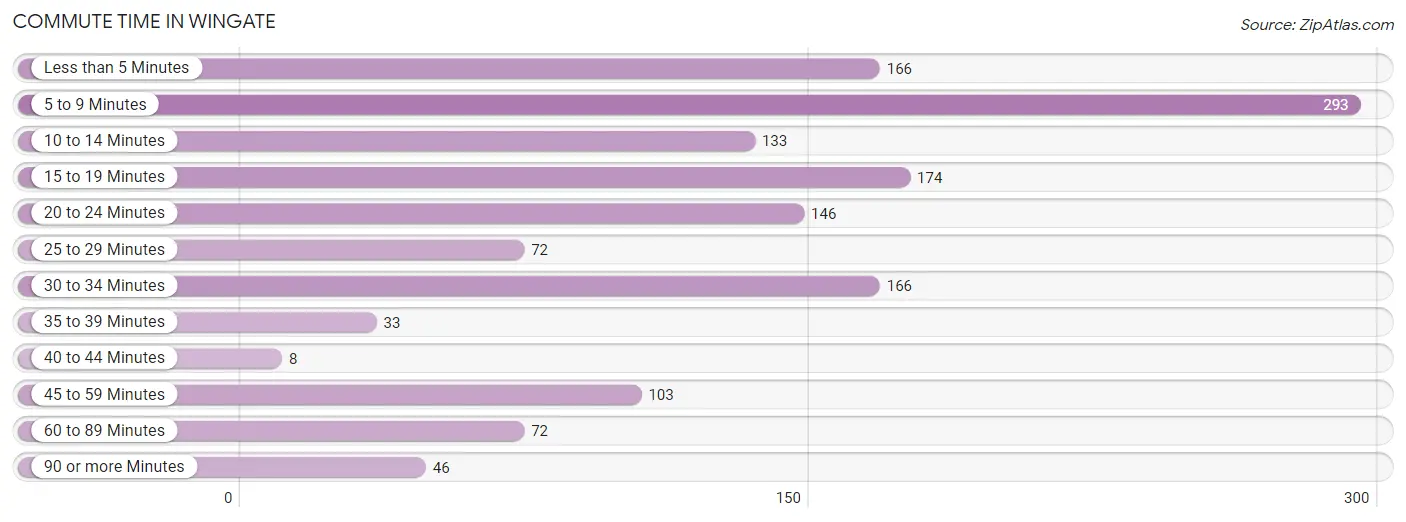
| Commute Time | # Commuters | % Commuters |
| Less than 5 Minutes | 166 | 11.8% |
| 5 to 9 Minutes | 293 | 20.7% |
| 10 to 14 Minutes | 133 | 9.4% |
| 15 to 19 Minutes | 174 | 12.3% |
| 20 to 24 Minutes | 146 | 10.3% |
| 25 to 29 Minutes | 72 | 5.1% |
| 30 to 34 Minutes | 166 | 11.8% |
| 35 to 39 Minutes | 33 | 2.3% |
| 40 to 44 Minutes | 8 | 0.6% |
| 45 to 59 Minutes | 103 | 7.3% |
| 60 to 89 Minutes | 72 | 5.1% |
| 90 or more Minutes | 46 | 3.3% |
Commute Time by Sex in Wingate
The most common commute times in Wingate are 5 to 9 minutes (144 commuters, 23.0%) for males and 5 to 9 minutes (149 commuters, 18.9%) for females.
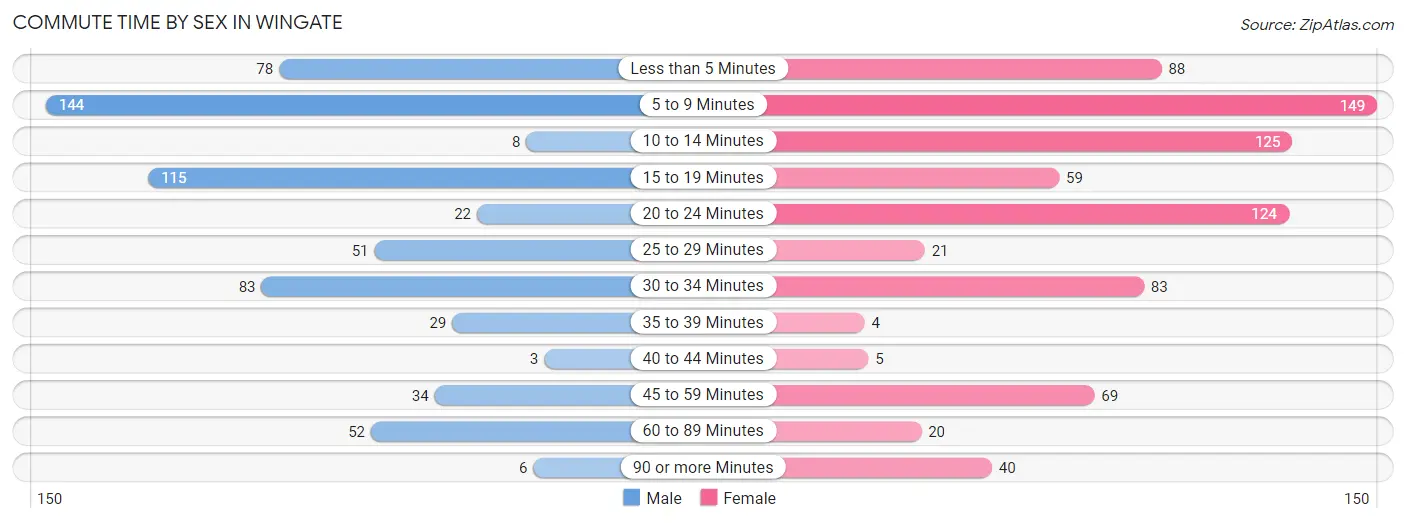
| Commute Time | Male | Female |
| Less than 5 Minutes | 78 (12.5%) | 88 (11.2%) |
| 5 to 9 Minutes | 144 (23.0%) | 149 (18.9%) |
| 10 to 14 Minutes | 8 (1.3%) | 125 (15.9%) |
| 15 to 19 Minutes | 115 (18.4%) | 59 (7.5%) |
| 20 to 24 Minutes | 22 (3.5%) | 124 (15.8%) |
| 25 to 29 Minutes | 51 (8.2%) | 21 (2.7%) |
| 30 to 34 Minutes | 83 (13.3%) | 83 (10.5%) |
| 35 to 39 Minutes | 29 (4.6%) | 4 (0.5%) |
| 40 to 44 Minutes | 3 (0.5%) | 5 (0.6%) |
| 45 to 59 Minutes | 34 (5.4%) | 69 (8.8%) |
| 60 to 89 Minutes | 52 (8.3%) | 20 (2.5%) |
| 90 or more Minutes | 6 (1.0%) | 40 (5.1%) |
Time of Departure to Work by Sex in Wingate
The most frequent times of departure to work in Wingate are 4:00 PM to 11:59 PM (165, 26.4%) for males and 7:30 AM to 7:59 AM (157, 20.0%) for females.
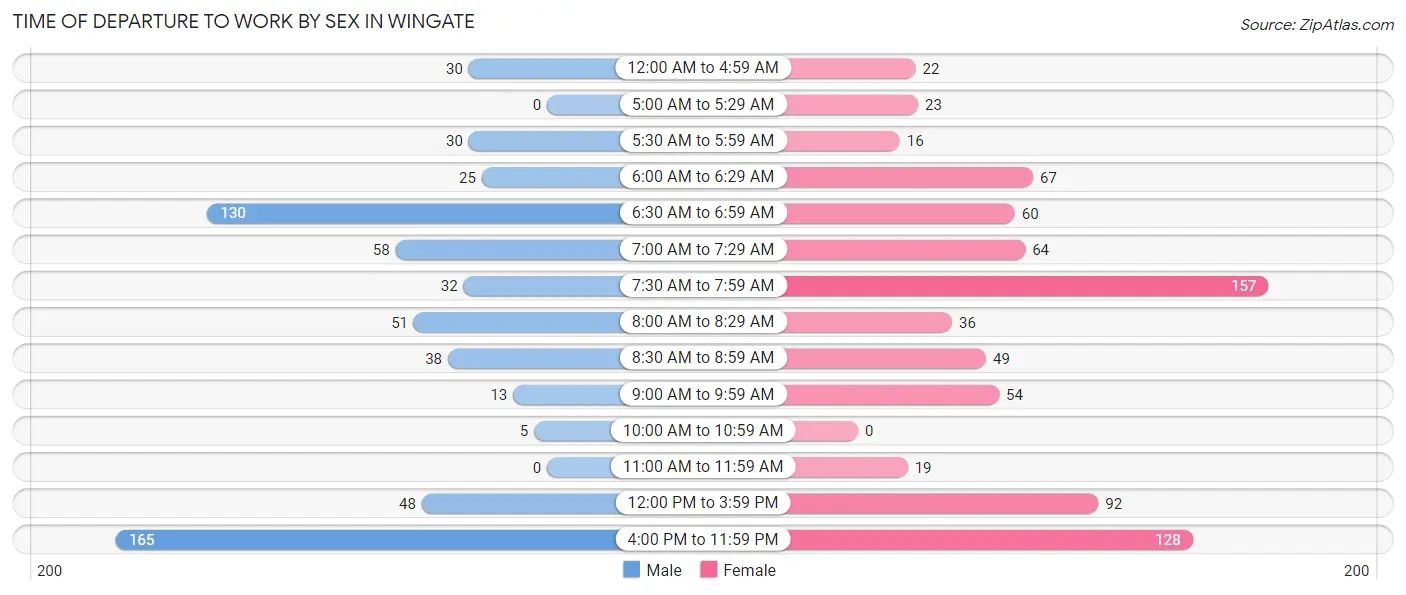
| Time of Departure | Male | Female |
| 12:00 AM to 4:59 AM | 30 (4.8%) | 22 (2.8%) |
| 5:00 AM to 5:29 AM | 0 (0.0%) | 23 (2.9%) |
| 5:30 AM to 5:59 AM | 30 (4.8%) | 16 (2.0%) |
| 6:00 AM to 6:29 AM | 25 (4.0%) | 67 (8.5%) |
| 6:30 AM to 6:59 AM | 130 (20.8%) | 60 (7.6%) |
| 7:00 AM to 7:29 AM | 58 (9.3%) | 64 (8.1%) |
| 7:30 AM to 7:59 AM | 32 (5.1%) | 157 (20.0%) |
| 8:00 AM to 8:29 AM | 51 (8.2%) | 36 (4.6%) |
| 8:30 AM to 8:59 AM | 38 (6.1%) | 49 (6.2%) |
| 9:00 AM to 9:59 AM | 13 (2.1%) | 54 (6.9%) |
| 10:00 AM to 10:59 AM | 5 (0.8%) | 0 (0.0%) |
| 11:00 AM to 11:59 AM | 0 (0.0%) | 19 (2.4%) |
| 12:00 PM to 3:59 PM | 48 (7.7%) | 92 (11.7%) |
| 4:00 PM to 11:59 PM | 165 (26.4%) | 128 (16.3%) |
| Total | 625 (100.0%) | 787 (100.0%) |
Housing Occupancy in Wingate
Occupancy by Ownership in Wingate
Of the total 904 dwellings in Wingate, owner-occupied units account for 604 (66.8%), while renter-occupied units make up 300 (33.2%).
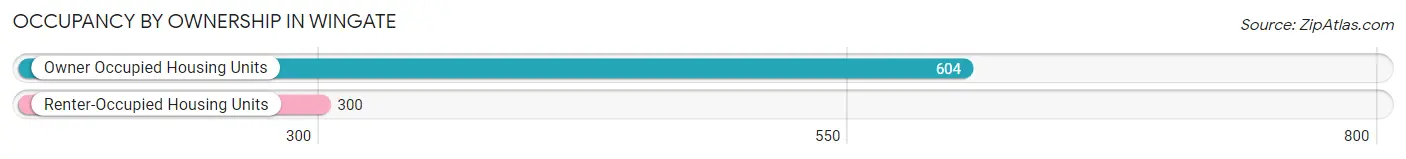
| Occupancy | # Housing Units | % Housing Units |
| Owner Occupied Housing Units | 604 | 66.8% |
| Renter-Occupied Housing Units | 300 | 33.2% |
| Total Occupied Housing Units | 904 | 100.0% |
Occupancy by Household Size in Wingate
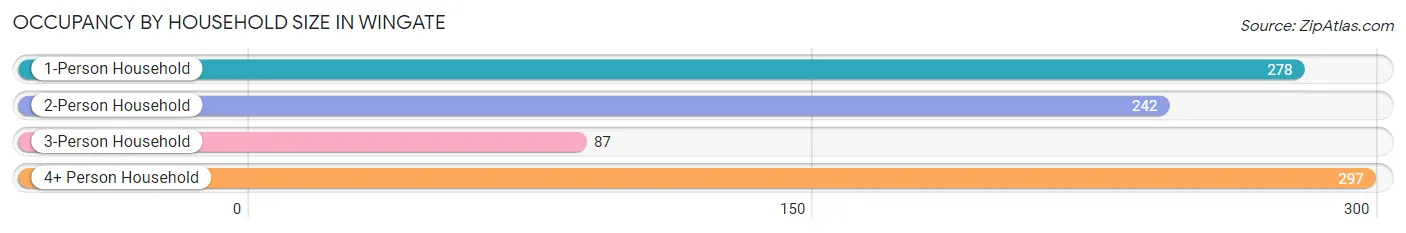
| Household Size | # Housing Units | % Housing Units |
| 1-Person Household | 278 | 30.7% |
| 2-Person Household | 242 | 26.8% |
| 3-Person Household | 87 | 9.6% |
| 4+ Person Household | 297 | 32.9% |
| Total Housing Units | 904 | 100.0% |
Occupancy by Ownership by Household Size in Wingate
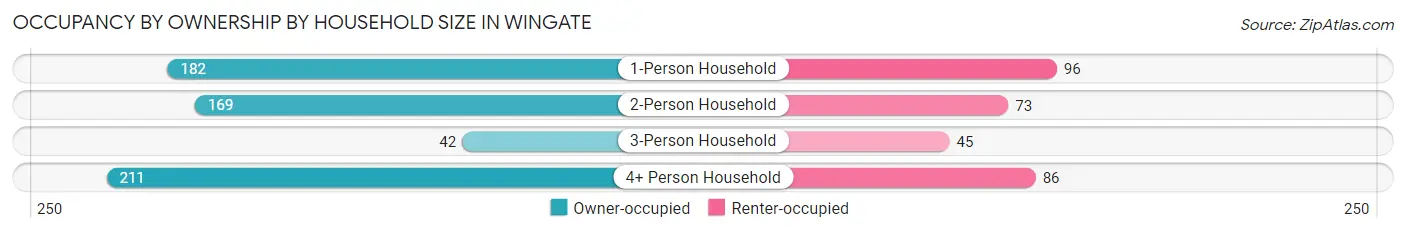
| Household Size | Owner-occupied | Renter-occupied |
| 1-Person Household | 182 (65.5%) | 96 (34.5%) |
| 2-Person Household | 169 (69.8%) | 73 (30.2%) |
| 3-Person Household | 42 (48.3%) | 45 (51.7%) |
| 4+ Person Household | 211 (71.0%) | 86 (29.0%) |
| Total Housing Units | 604 (66.8%) | 300 (33.2%) |
Occupancy by Educational Attainment in Wingate
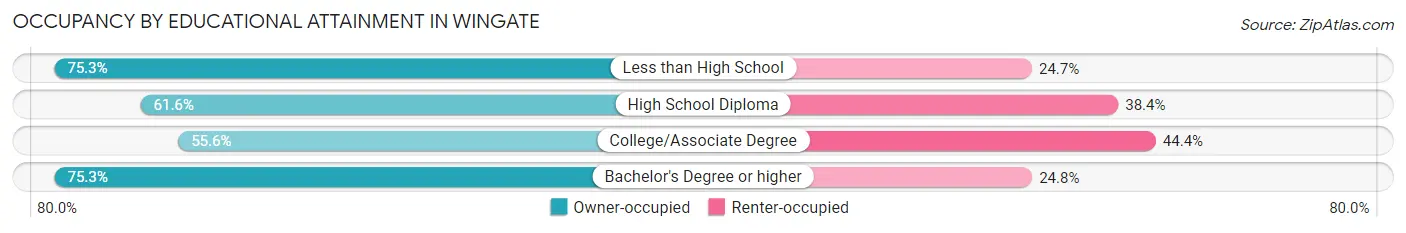
| Household Size | Owner-occupied | Renter-occupied |
| Less than High School | 134 (75.3%) | 44 (24.7%) |
| High School Diploma | 85 (61.6%) | 53 (38.4%) |
| College/Associate Degree | 163 (55.6%) | 130 (44.4%) |
| Bachelor's Degree or higher | 222 (75.2%) | 73 (24.7%) |
Occupancy by Age of Householder in Wingate
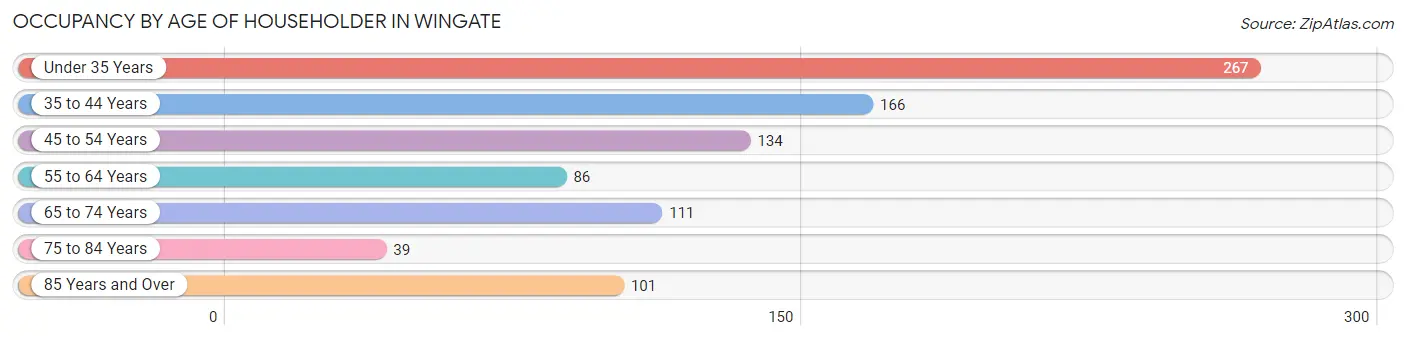
| Age Bracket | # Households | % Households |
| Under 35 Years | 267 | 29.5% |
| 35 to 44 Years | 166 | 18.4% |
| 45 to 54 Years | 134 | 14.8% |
| 55 to 64 Years | 86 | 9.5% |
| 65 to 74 Years | 111 | 12.3% |
| 75 to 84 Years | 39 | 4.3% |
| 85 Years and Over | 101 | 11.2% |
| Total | 904 | 100.0% |
Housing Finances in Wingate
Median Income by Occupancy in Wingate
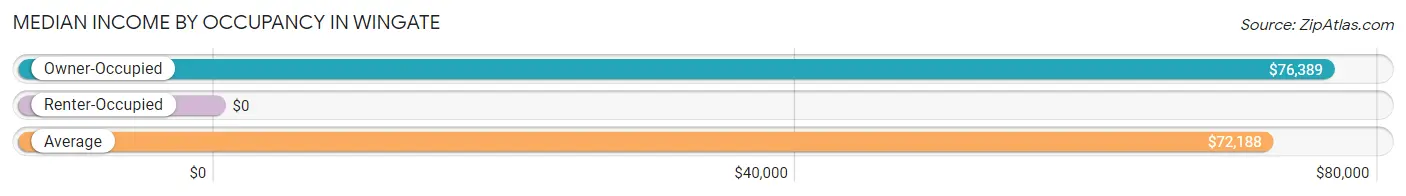
| Occupancy Type | # Households | Median Income |
| Owner-Occupied | 604 (66.8%) | $76,389 |
| Renter-Occupied | 300 (33.2%) | $0 |
| Average | 904 (100.0%) | $72,188 |
Occupancy by Householder Income Bracket in Wingate
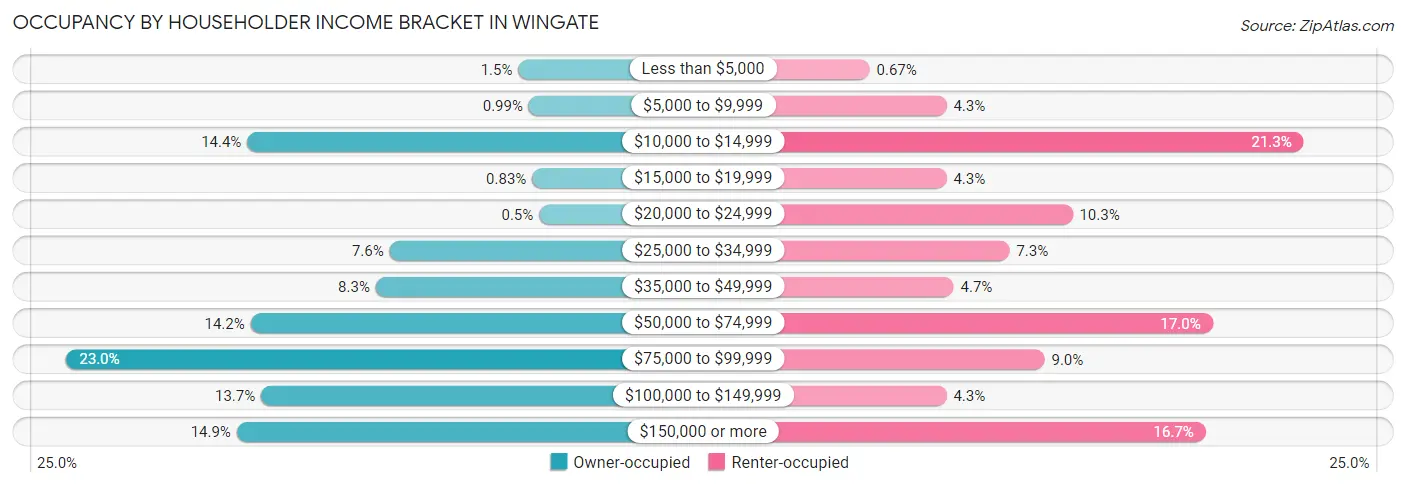
| Income Bracket | Owner-occupied | Renter-occupied |
| Less than $5,000 | 9 (1.5%) | 2 (0.7%) |
| $5,000 to $9,999 | 6 (1.0%) | 13 (4.3%) |
| $10,000 to $14,999 | 87 (14.4%) | 64 (21.3%) |
| $15,000 to $19,999 | 5 (0.8%) | 13 (4.3%) |
| $20,000 to $24,999 | 3 (0.5%) | 31 (10.3%) |
| $25,000 to $34,999 | 46 (7.6%) | 22 (7.3%) |
| $35,000 to $49,999 | 50 (8.3%) | 14 (4.7%) |
| $50,000 to $74,999 | 86 (14.2%) | 51 (17.0%) |
| $75,000 to $99,999 | 139 (23.0%) | 27 (9.0%) |
| $100,000 to $149,999 | 83 (13.7%) | 13 (4.3%) |
| $150,000 or more | 90 (14.9%) | 50 (16.7%) |
| Total | 604 (100.0%) | 300 (100.0%) |
Monthly Housing Cost Tiers in Wingate
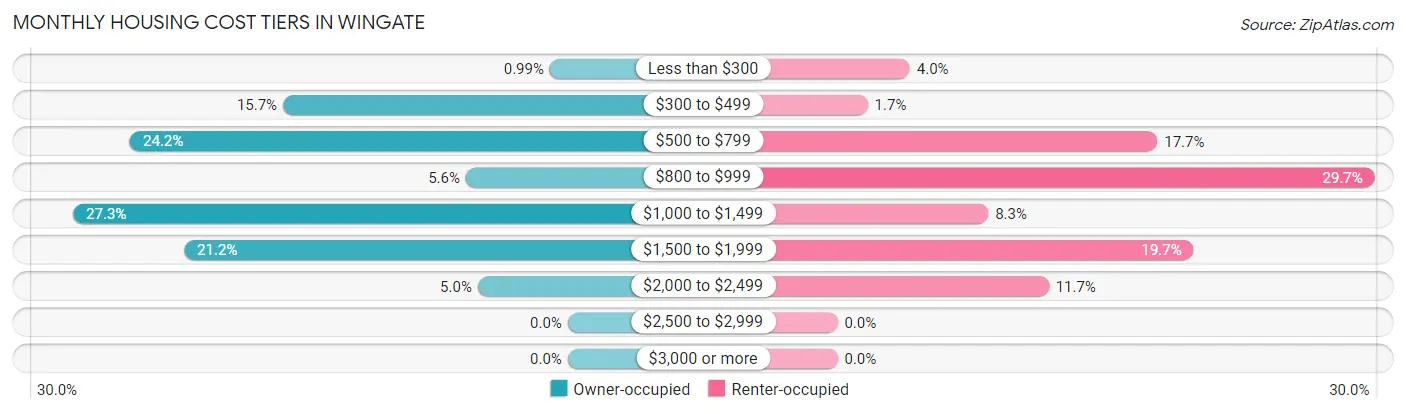
| Monthly Cost | Owner-occupied | Renter-occupied |
| Less than $300 | 6 (1.0%) | 12 (4.0%) |
| $300 to $499 | 95 (15.7%) | 5 (1.7%) |
| $500 to $799 | 146 (24.2%) | 53 (17.7%) |
| $800 to $999 | 34 (5.6%) | 89 (29.7%) |
| $1,000 to $1,499 | 165 (27.3%) | 25 (8.3%) |
| $1,500 to $1,999 | 128 (21.2%) | 59 (19.7%) |
| $2,000 to $2,499 | 30 (5.0%) | 35 (11.7%) |
| $2,500 to $2,999 | 0 (0.0%) | 0 (0.0%) |
| $3,000 or more | 0 (0.0%) | 0 (0.0%) |
| Total | 604 (100.0%) | 300 (100.0%) |
Physical Housing Characteristics in Wingate
Housing Structures in Wingate
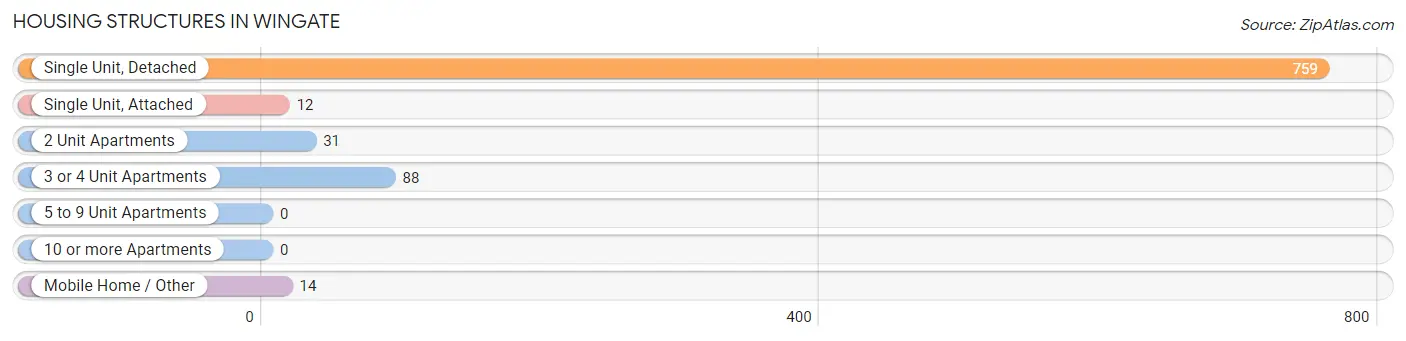
| Structure Type | # Housing Units | % Housing Units |
| Single Unit, Detached | 759 | 84.0% |
| Single Unit, Attached | 12 | 1.3% |
| 2 Unit Apartments | 31 | 3.4% |
| 3 or 4 Unit Apartments | 88 | 9.7% |
| 5 to 9 Unit Apartments | 0 | 0.0% |
| 10 or more Apartments | 0 | 0.0% |
| Mobile Home / Other | 14 | 1.5% |
| Total | 904 | 100.0% |
Housing Structures by Occupancy in Wingate
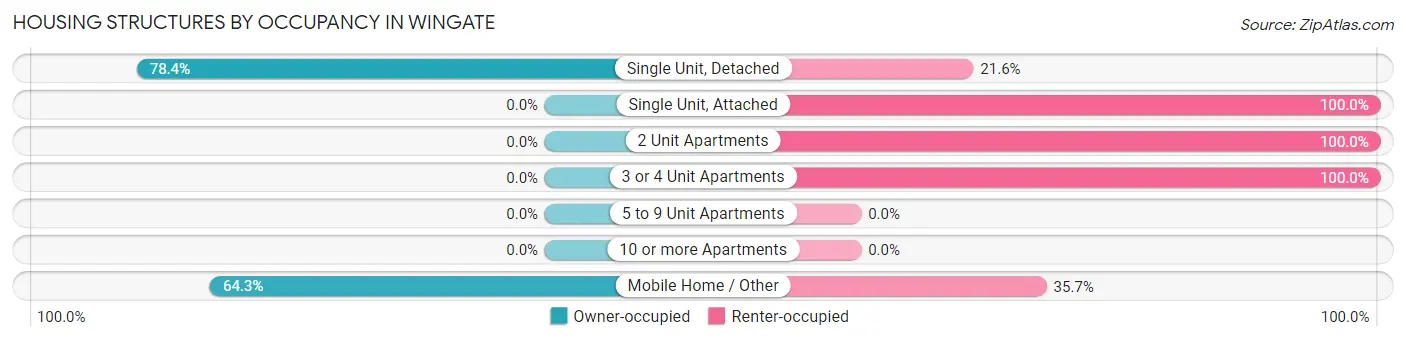
| Structure Type | Owner-occupied | Renter-occupied |
| Single Unit, Detached | 595 (78.4%) | 164 (21.6%) |
| Single Unit, Attached | 0 (0.0%) | 12 (100.0%) |
| 2 Unit Apartments | 0 (0.0%) | 31 (100.0%) |
| 3 or 4 Unit Apartments | 0 (0.0%) | 88 (100.0%) |
| 5 to 9 Unit Apartments | 0 (0.0%) | 0 (0.0%) |
| 10 or more Apartments | 0 (0.0%) | 0 (0.0%) |
| Mobile Home / Other | 9 (64.3%) | 5 (35.7%) |
| Total | 604 (66.8%) | 300 (33.2%) |
Housing Structures by Number of Rooms in Wingate
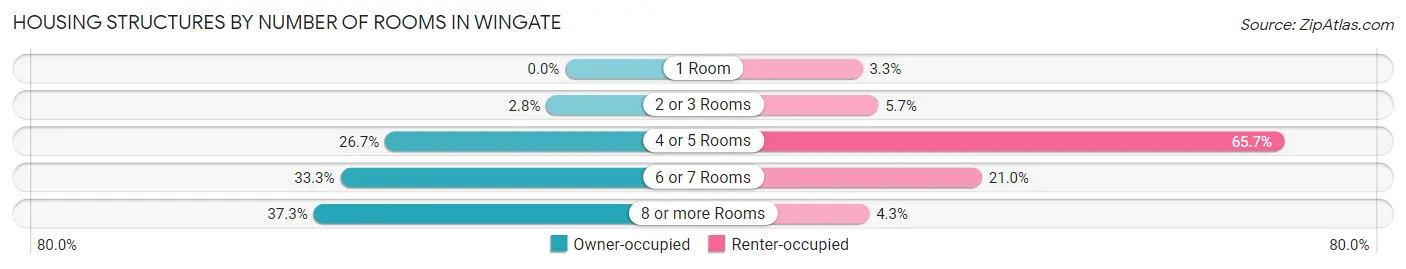
| Number of Rooms | Owner-occupied | Renter-occupied |
| 1 Room | 0 (0.0%) | 10 (3.3%) |
| 2 or 3 Rooms | 17 (2.8%) | 17 (5.7%) |
| 4 or 5 Rooms | 161 (26.7%) | 197 (65.7%) |
| 6 or 7 Rooms | 201 (33.3%) | 63 (21.0%) |
| 8 or more Rooms | 225 (37.2%) | 13 (4.3%) |
| Total | 604 (100.0%) | 300 (100.0%) |
Housing Structure by Heating Type in Wingate
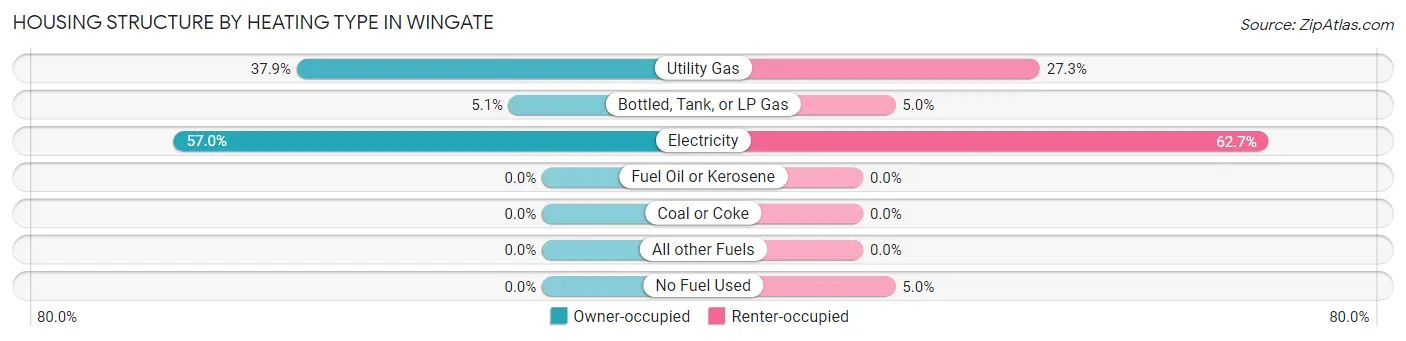
| Heating Type | Owner-occupied | Renter-occupied |
| Utility Gas | 229 (37.9%) | 82 (27.3%) |
| Bottled, Tank, or LP Gas | 31 (5.1%) | 15 (5.0%) |
| Electricity | 344 (57.0%) | 188 (62.7%) |
| Fuel Oil or Kerosene | 0 (0.0%) | 0 (0.0%) |
| Coal or Coke | 0 (0.0%) | 0 (0.0%) |
| All other Fuels | 0 (0.0%) | 0 (0.0%) |
| No Fuel Used | 0 (0.0%) | 15 (5.0%) |
| Total | 604 (100.0%) | 300 (100.0%) |
Household Vehicle Usage in Wingate
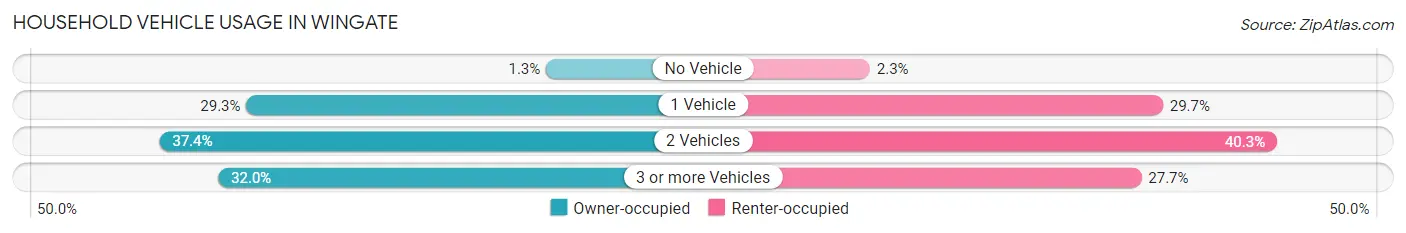
| Vehicles per Household | Owner-occupied | Renter-occupied |
| No Vehicle | 8 (1.3%) | 7 (2.3%) |
| 1 Vehicle | 177 (29.3%) | 89 (29.7%) |
| 2 Vehicles | 226 (37.4%) | 121 (40.3%) |
| 3 or more Vehicles | 193 (32.0%) | 83 (27.7%) |
| Total | 604 (100.0%) | 300 (100.0%) |
Real Estate & Mortgages in Wingate
Real Estate and Mortgage Overview in Wingate
| Characteristic | Without Mortgage | With Mortgage |
| Housing Units | 224 | 380 |
| Median Property Value | $188,400 | $178,800 |
| Median Household Income | - | - |
| Monthly Housing Costs | $518 | $0 |
| Real Estate Taxes | $1,412 | $9 |
Property Value by Mortgage Status in Wingate
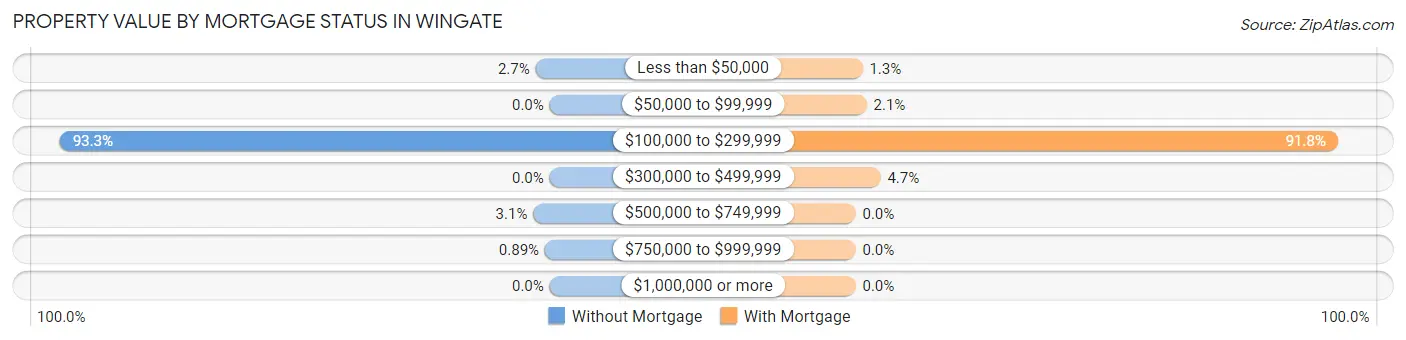
| Property Value | Without Mortgage | With Mortgage |
| Less than $50,000 | 6 (2.7%) | 5 (1.3%) |
| $50,000 to $99,999 | 0 (0.0%) | 8 (2.1%) |
| $100,000 to $299,999 | 209 (93.3%) | 349 (91.8%) |
| $300,000 to $499,999 | 0 (0.0%) | 18 (4.7%) |
| $500,000 to $749,999 | 7 (3.1%) | 0 (0.0%) |
| $750,000 to $999,999 | 2 (0.9%) | 0 (0.0%) |
| $1,000,000 or more | 0 (0.0%) | 0 (0.0%) |
| Total | 224 (100.0%) | 380 (100.0%) |
Household Income by Mortgage Status in Wingate
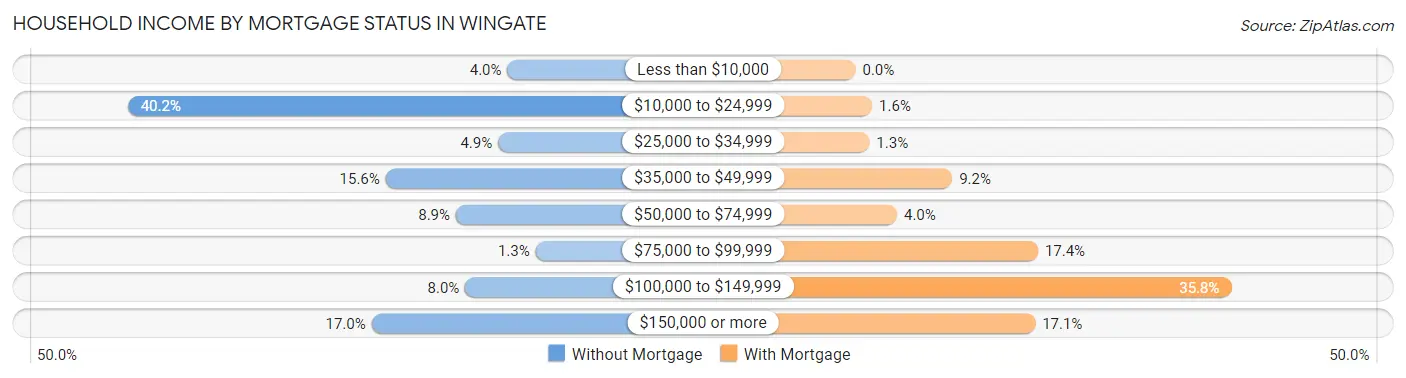
| Household Income | Without Mortgage | With Mortgage |
| Less than $10,000 | 9 (4.0%) | 0 (0.0%) |
| $10,000 to $24,999 | 90 (40.2%) | 6 (1.6%) |
| $25,000 to $34,999 | 11 (4.9%) | 5 (1.3%) |
| $35,000 to $49,999 | 35 (15.6%) | 35 (9.2%) |
| $50,000 to $74,999 | 20 (8.9%) | 15 (4.0%) |
| $75,000 to $99,999 | 3 (1.3%) | 66 (17.4%) |
| $100,000 to $149,999 | 18 (8.0%) | 136 (35.8%) |
| $150,000 or more | 38 (17.0%) | 65 (17.1%) |
| Total | 224 (100.0%) | 380 (100.0%) |
Property Value to Household Income Ratio in Wingate
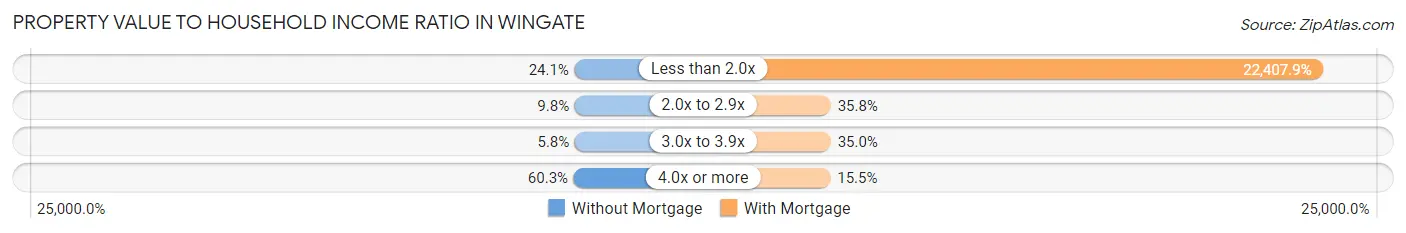
| Value-to-Income Ratio | Without Mortgage | With Mortgage |
| Less than 2.0x | 54 (24.1%) | 85,150 (22,407.9%) |
| 2.0x to 2.9x | 22 (9.8%) | 136 (35.8%) |
| 3.0x to 3.9x | 13 (5.8%) | 133 (35.0%) |
| 4.0x or more | 135 (60.3%) | 59 (15.5%) |
| Total | 224 (100.0%) | 380 (100.0%) |
Real Estate Taxes by Mortgage Status in Wingate
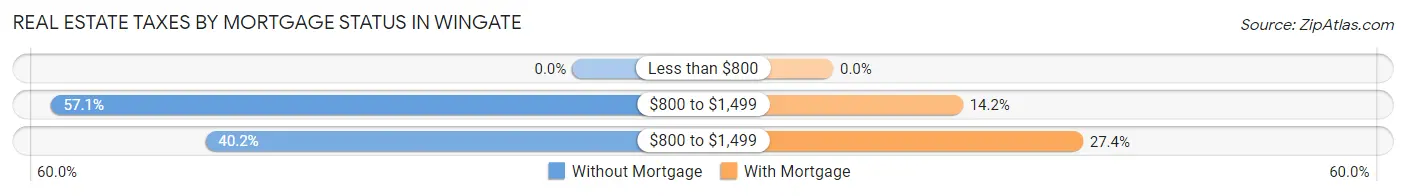
| Property Taxes | Without Mortgage | With Mortgage |
| Less than $800 | 0 (0.0%) | 0 (0.0%) |
| $800 to $1,499 | 128 (57.1%) | 54 (14.2%) |
| $800 to $1,499 | 90 (40.2%) | 104 (27.4%) |
| Total | 224 (100.0%) | 380 (100.0%) |
Health & Disability in Wingate
Health Insurance Coverage by Age in Wingate
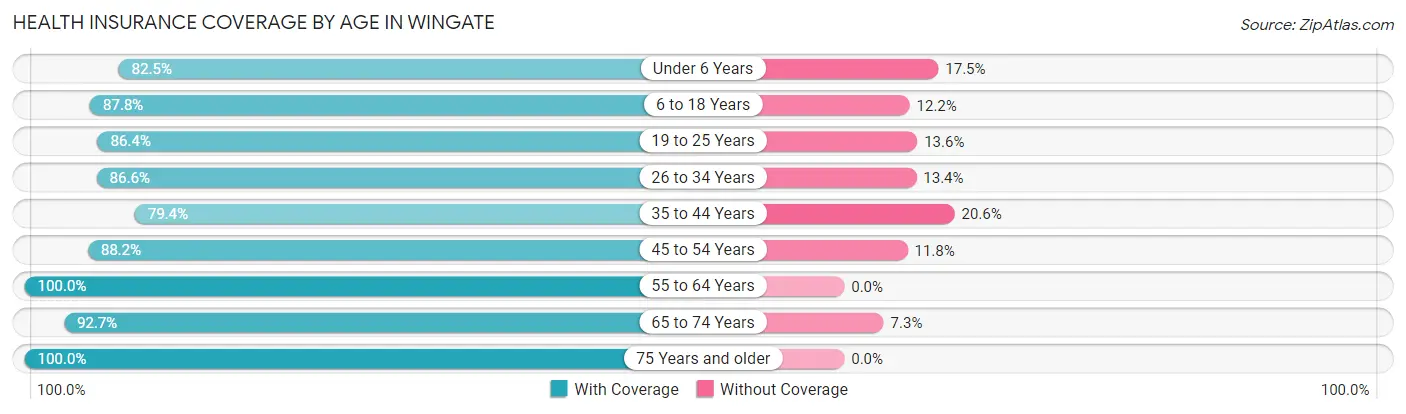
| Age Bracket | With Coverage | Without Coverage |
| Under 6 Years | 235 (82.5%) | 50 (17.5%) |
| 6 to 18 Years | 1,031 (87.8%) | 143 (12.2%) |
| 19 to 25 Years | 1,010 (86.4%) | 159 (13.6%) |
| 26 to 34 Years | 277 (86.6%) | 43 (13.4%) |
| 35 to 44 Years | 286 (79.4%) | 74 (20.6%) |
| 45 to 54 Years | 232 (88.2%) | 31 (11.8%) |
| 55 to 64 Years | 142 (100.0%) | 0 (0.0%) |
| 65 to 74 Years | 164 (92.7%) | 13 (7.3%) |
| 75 Years and older | 171 (100.0%) | 0 (0.0%) |
| Total | 3,548 (87.4%) | 513 (12.6%) |
Health Insurance Coverage by Citizenship Status in Wingate
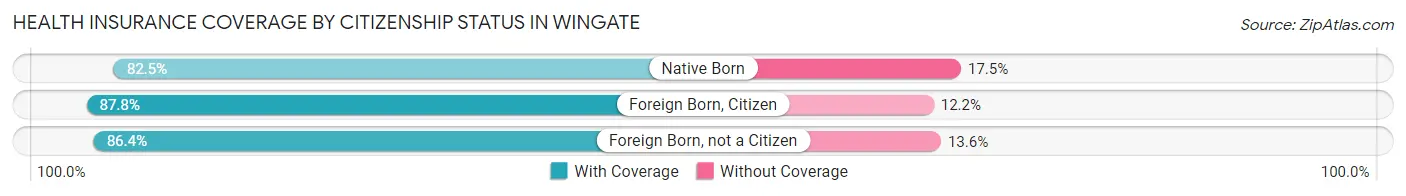
| Citizenship Status | With Coverage | Without Coverage |
| Native Born | 235 (82.5%) | 50 (17.5%) |
| Foreign Born, Citizen | 1,031 (87.8%) | 143 (12.2%) |
| Foreign Born, not a Citizen | 1,010 (86.4%) | 159 (13.6%) |
Health Insurance Coverage by Household Income in Wingate
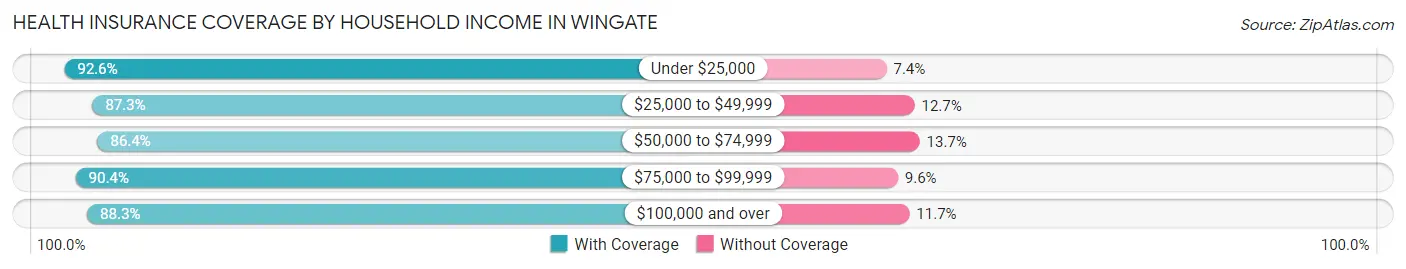
| Household Income | With Coverage | Without Coverage |
| Under $25,000 | 361 (92.6%) | 29 (7.4%) |
| $25,000 to $49,999 | 234 (87.3%) | 34 (12.7%) |
| $50,000 to $74,999 | 291 (86.4%) | 46 (13.7%) |
| $75,000 to $99,999 | 757 (90.4%) | 80 (9.6%) |
| $100,000 and over | 858 (88.3%) | 114 (11.7%) |
Public vs Private Health Insurance Coverage by Age in Wingate
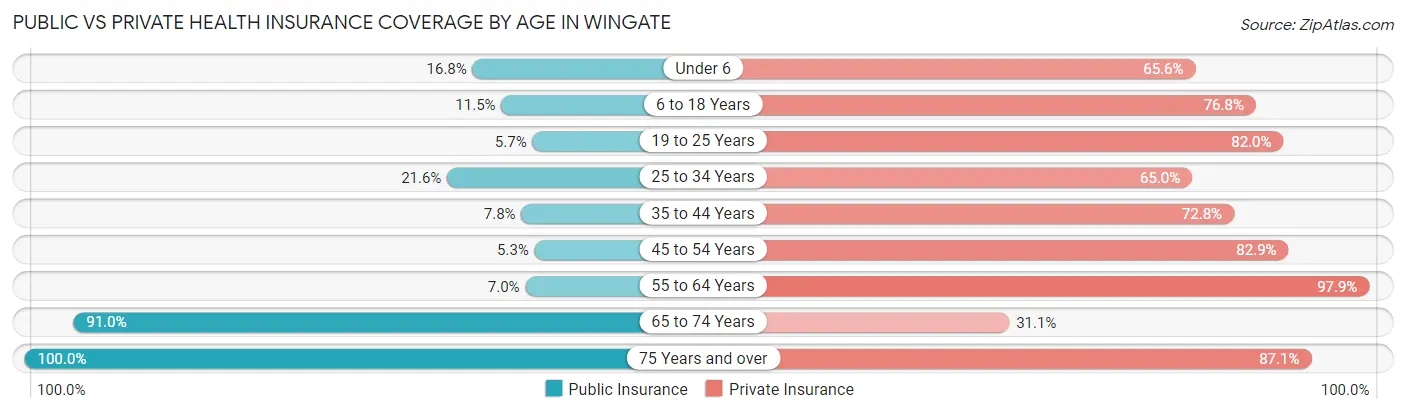
| Age Bracket | Public Insurance | Private Insurance |
| Under 6 | 48 (16.8%) | 187 (65.6%) |
| 6 to 18 Years | 135 (11.5%) | 902 (76.8%) |
| 19 to 25 Years | 67 (5.7%) | 958 (82.0%) |
| 25 to 34 Years | 69 (21.6%) | 208 (65.0%) |
| 35 to 44 Years | 28 (7.8%) | 262 (72.8%) |
| 45 to 54 Years | 14 (5.3%) | 218 (82.9%) |
| 55 to 64 Years | 10 (7.0%) | 139 (97.9%) |
| 65 to 74 Years | 161 (91.0%) | 55 (31.1%) |
| 75 Years and over | 171 (100.0%) | 149 (87.1%) |
| Total | 703 (17.3%) | 3,078 (75.8%) |
Disability Status by Sex by Age in Wingate
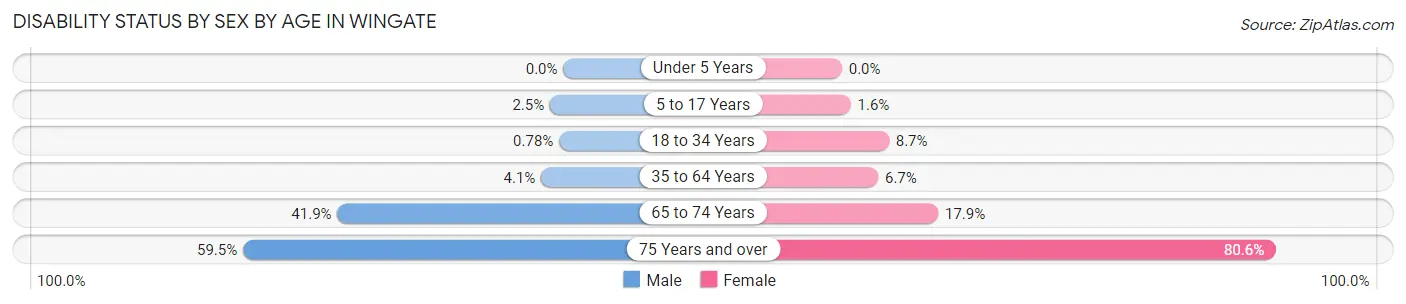
| Age Bracket | Male | Female |
| Under 5 Years | 0 (0.0%) | 0 (0.0%) |
| 5 to 17 Years | 6 (2.5%) | 6 (1.6%) |
| 18 to 34 Years | 7 (0.8%) | 108 (8.7%) |
| 35 to 64 Years | 15 (4.1%) | 27 (6.7%) |
| 65 to 74 Years | 39 (41.9%) | 15 (17.9%) |
| 75 Years and over | 22 (59.5%) | 108 (80.6%) |
Disability Class by Sex by Age in Wingate
Disability Class: Hearing Difficulty
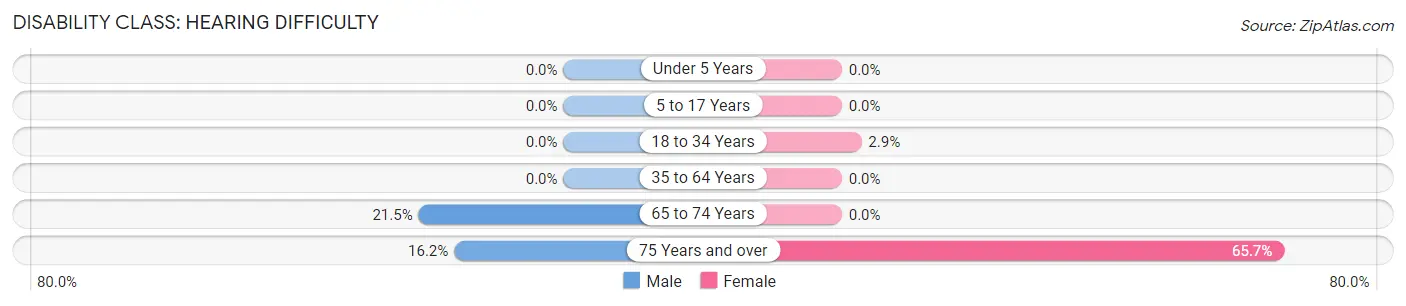
| Age Bracket | Male | Female |
| Under 5 Years | 0 (0.0%) | 0 (0.0%) |
| 5 to 17 Years | 0 (0.0%) | 0 (0.0%) |
| 18 to 34 Years | 0 (0.0%) | 36 (2.9%) |
| 35 to 64 Years | 0 (0.0%) | 0 (0.0%) |
| 65 to 74 Years | 20 (21.5%) | 0 (0.0%) |
| 75 Years and over | 6 (16.2%) | 88 (65.7%) |
Disability Class: Vision Difficulty
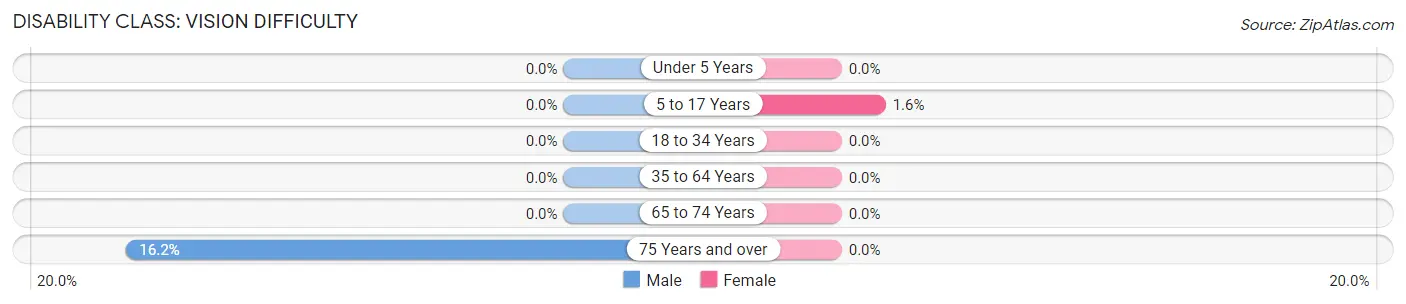
| Age Bracket | Male | Female |
| Under 5 Years | 0 (0.0%) | 0 (0.0%) |
| 5 to 17 Years | 0 (0.0%) | 6 (1.6%) |
| 18 to 34 Years | 0 (0.0%) | 0 (0.0%) |
| 35 to 64 Years | 0 (0.0%) | 0 (0.0%) |
| 65 to 74 Years | 0 (0.0%) | 0 (0.0%) |
| 75 Years and over | 6 (16.2%) | 0 (0.0%) |
Disability Class: Cognitive Difficulty
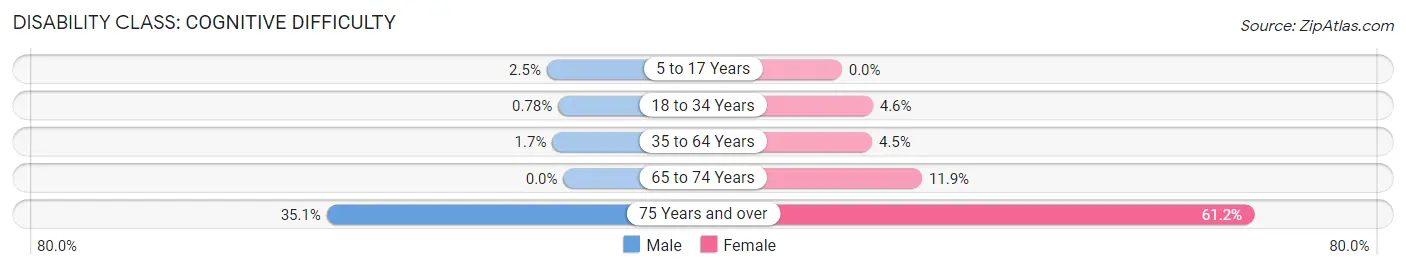
| Age Bracket | Male | Female |
| 5 to 17 Years | 6 (2.5%) | 0 (0.0%) |
| 18 to 34 Years | 7 (0.8%) | 57 (4.6%) |
| 35 to 64 Years | 6 (1.7%) | 18 (4.5%) |
| 65 to 74 Years | 0 (0.0%) | 10 (11.9%) |
| 75 Years and over | 13 (35.1%) | 82 (61.2%) |
Disability Class: Ambulatory Difficulty
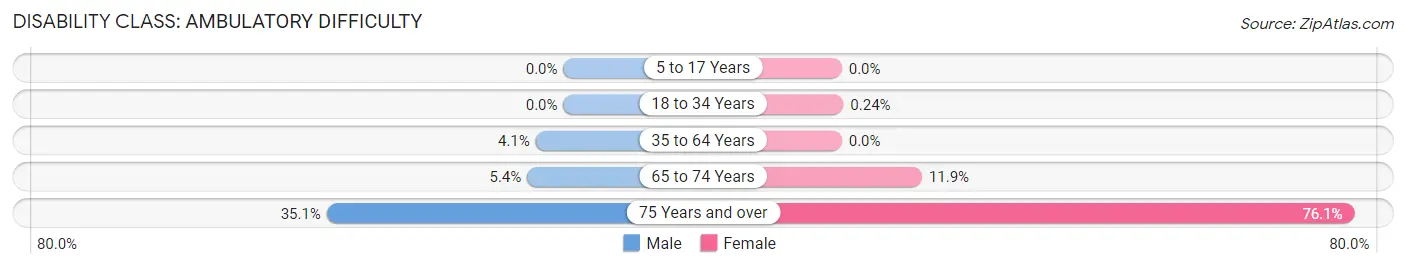
| Age Bracket | Male | Female |
| 5 to 17 Years | 0 (0.0%) | 0 (0.0%) |
| 18 to 34 Years | 0 (0.0%) | 3 (0.2%) |
| 35 to 64 Years | 15 (4.1%) | 0 (0.0%) |
| 65 to 74 Years | 5 (5.4%) | 10 (11.9%) |
| 75 Years and over | 13 (35.1%) | 102 (76.1%) |
Disability Class: Self-Care Difficulty
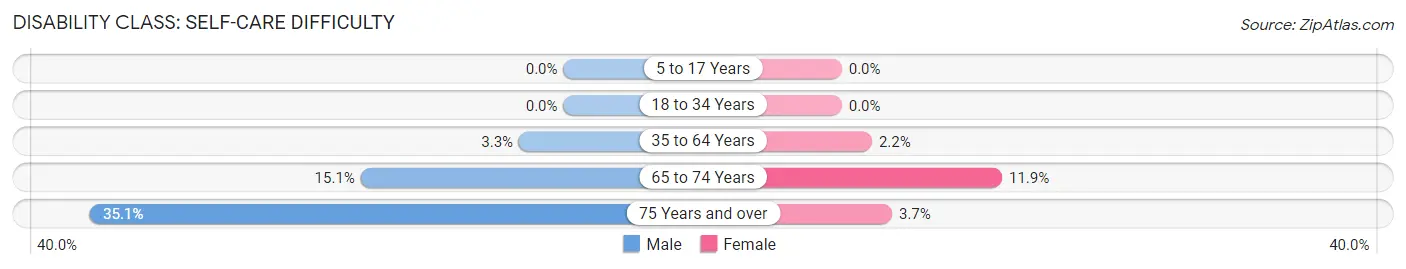
| Age Bracket | Male | Female |
| 5 to 17 Years | 0 (0.0%) | 0 (0.0%) |
| 18 to 34 Years | 0 (0.0%) | 0 (0.0%) |
| 35 to 64 Years | 12 (3.3%) | 9 (2.2%) |
| 65 to 74 Years | 14 (15.0%) | 10 (11.9%) |
| 75 Years and over | 13 (35.1%) | 5 (3.7%) |
Technology Access in Wingate
Computing Device Access in Wingate
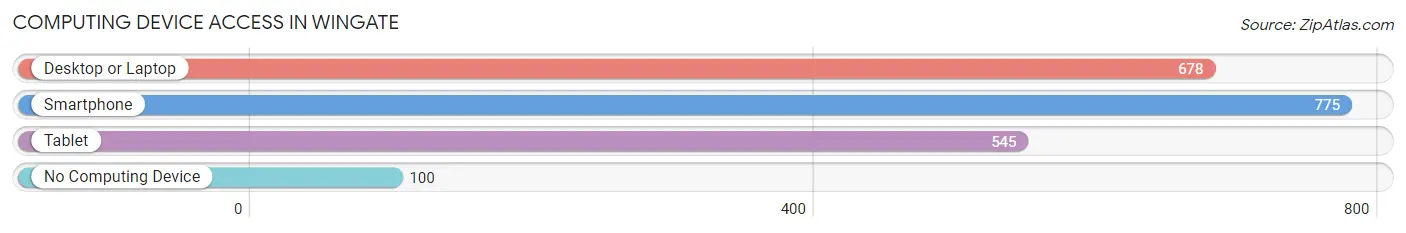
| Device Type | # Households | % Households |
| Desktop or Laptop | 678 | 75.0% |
| Smartphone | 775 | 85.7% |
| Tablet | 545 | 60.3% |
| No Computing Device | 100 | 11.1% |
| Total | 904 | 100.0% |
Internet Access in Wingate
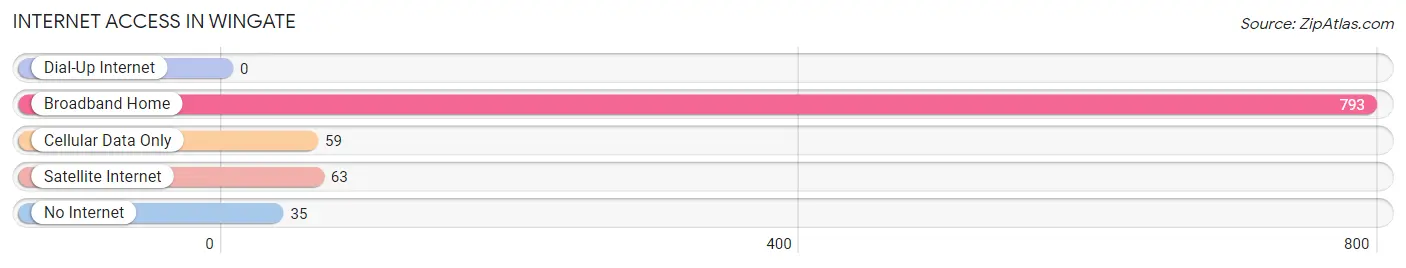
| Internet Type | # Households | % Households |
| Dial-Up Internet | 0 | 0.0% |
| Broadband Home | 793 | 87.7% |
| Cellular Data Only | 59 | 6.5% |
| Satellite Internet | 63 | 7.0% |
| No Internet | 35 | 3.9% |
| Total | 904 | 100.0% |
Wingate Summary
History
The town of Wingate, North Carolina is located in Union County, approximately 25 miles southeast of Charlotte. The town was founded in 1887 and named after the Wingate family, who were prominent landowners in the area. The Wingate family had a large plantation in the area and the town was built around it. The town was originally known as Wingate's Crossroads, but the name was changed to Wingate in 1895.
The town was a small farming community until the late 19th century, when the railroad came through. This allowed for the growth of the town and the development of industry. The first industry to come to Wingate was a cotton mill, which opened in 1891. This was followed by a furniture factory in 1895 and a brickyard in 1898. These industries provided jobs for the local population and helped to spur the growth of the town.
The town continued to grow throughout the 20th century, with the population reaching 1,000 by the 1950s. The town was incorporated in 1959 and has continued to grow since then. Today, Wingate is home to a population of over 4,000 people.
Geography
Wingate is located in Union County, North Carolina, approximately 25 miles southeast of Charlotte. The town is situated in the Piedmont region of the state, which is characterized by rolling hills and forests. The town is located on the banks of the Rocky River, which flows through the town and provides a scenic backdrop.
The town is located at an elevation of 645 feet above sea level and has a total area of 4.2 square miles. The climate in Wingate is mild, with temperatures ranging from the mid-30s in the winter to the mid-80s in the summer.
Economy
Wingate's economy is largely based on agriculture and manufacturing. The town is home to several large farms, which produce a variety of crops, including corn, soybeans, and cotton. The town is also home to several manufacturing companies, including a furniture factory, a brickyard, and a cotton mill.
The town is also home to several small businesses, including restaurants, retail stores, and service providers. The town is also home to Wingate University, which provides educational opportunities for the local population.
Demographics
As of the 2010 census, the population of Wingate was 4,039. The racial makeup of the town was 79.3% White, 16.2% African American, 0.4% Native American, 0.7% Asian, 0.1% Pacific Islander, and 3.3% from other races. The median household income in Wingate was $37,917, and the median family income was $45,938.
The town is home to a variety of religious denominations, including Baptist, Methodist, Presbyterian, and Catholic. The town is also home to a variety of cultural and recreational activities, including a public library, a community center, and several parks.
Conclusion
Wingate, North Carolina is a small town located in Union County, approximately 25 miles southeast of Charlotte. The town was founded in 1887 and has a population of over 4,000 people. The town's economy is largely based on agriculture and manufacturing, and the town is home to several small businesses, including restaurants, retail stores, and service providers. The town is also home to Wingate University, which provides educational opportunities for the local population. The town is home to a variety of religious denominations and cultural and recreational activities.
Common Questions
What is Per Capita Income in Wingate?
Per Capita income in Wingate is $18,518.
What is the Median Family Income in Wingate?
Median Family Income in Wingate is $85,878.
What is the Median Household income in Wingate?
Median Household Income in Wingate is $72,188.
What is Income or Wage Gap in Wingate?
Income or Wage Gap in Wingate is 68.3%.
Women in Wingate earn 31.7 cents for every dollar earned by a man.
What is Inequality or Gini Index in Wingate?
Inequality or Gini Index in Wingate is 0.46.
What is the Total Population of Wingate?
Total Population of Wingate is 4,061.
What is the Total Male Population of Wingate?
Total Male Population of Wingate is 1,750.
What is the Total Female Population of Wingate?
Total Female Population of Wingate is 2,311.
What is the Ratio of Males per 100 Females in Wingate?
There are 75.72 Males per 100 Females in Wingate.
What is the Ratio of Females per 100 Males in Wingate?
There are 132.06 Females per 100 Males in Wingate.
What is the Median Population Age in Wingate?
Median Population Age in Wingate is 21.4 Years.
What is the Average Family Size in Wingate
Average Family Size in Wingate is 4.0 People.
What is the Average Household Size in Wingate
Average Household Size in Wingate is 3.1 People.
How Large is the Labor Force in Wingate?
There are 1,788 People in the Labor Forcein in Wingate.
What is the Percentage of People in the Labor Force in Wingate?
54.2% of People are in the Labor Force in Wingate.
What is the Unemployment Rate in Wingate?
Unemployment Rate in Wingate is 0.6%.