Fallston, NC Map & Demographics
Fallston Map
Fallston Overview
$37,306
PER CAPITA INCOME
$49,250
AVG FAMILY INCOME
$44,545
AVG HOUSEHOLD INCOME
0.58
INEQUALITY / GINI INDEX
670
TOTAL POPULATION
306
MALE POPULATION
364
FEMALE POPULATION
84.07
MALES / 100 FEMALES
118.95
FEMALES / 100 MALES
45.0
MEDIAN AGE
3.7
AVG FAMILY SIZE
2.4
AVG HOUSEHOLD SIZE
248
LABOR FORCE [ PEOPLE ]
47.8%
PERCENT IN LABOR FORCE
2.0%
UNEMPLOYMENT RATE
Fallston Zip Codes
Fallston Area Codes
Income in Fallston
Income Overview in Fallston
Per Capita Income in Fallston is $37,306, while median incomes of families and households are $49,250 and $44,545 respectively.
| Characteristic | Number | Measure |
| Per Capita Income | 670 | $37,306 |
| Median Family Income | 127 | $49,250 |
| Mean Family Income | 127 | $54,057 |
| Median Household Income | 280 | $44,545 |
| Mean Household Income | 280 | $85,850 |
| Income Deficit | 127 | $0 |
| Wage / Income Gap (%) | 670 | 0.00% |
| Wage / Income Gap ($) | 670 | 100.00¢ per $1 |
| Gini / Inequality Index | 670 | 0.58 |
Earnings by Sex in Fallston
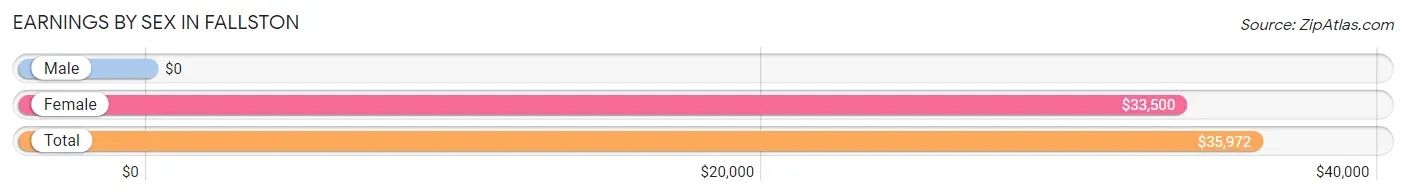
| Sex | Number | Average Earnings |
| Male | 129 (49.0%) | $0 |
| Female | 134 (50.9%) | $33,500 |
| Total | 263 (100.0%) | $35,972 |
Earnings by Sex by Income Bracket in Fallston
The most common earnings brackets in Fallston are $100,000+ for men (40 | 31.0%) and $45,000 to $49,999 for women (28 | 20.9%).
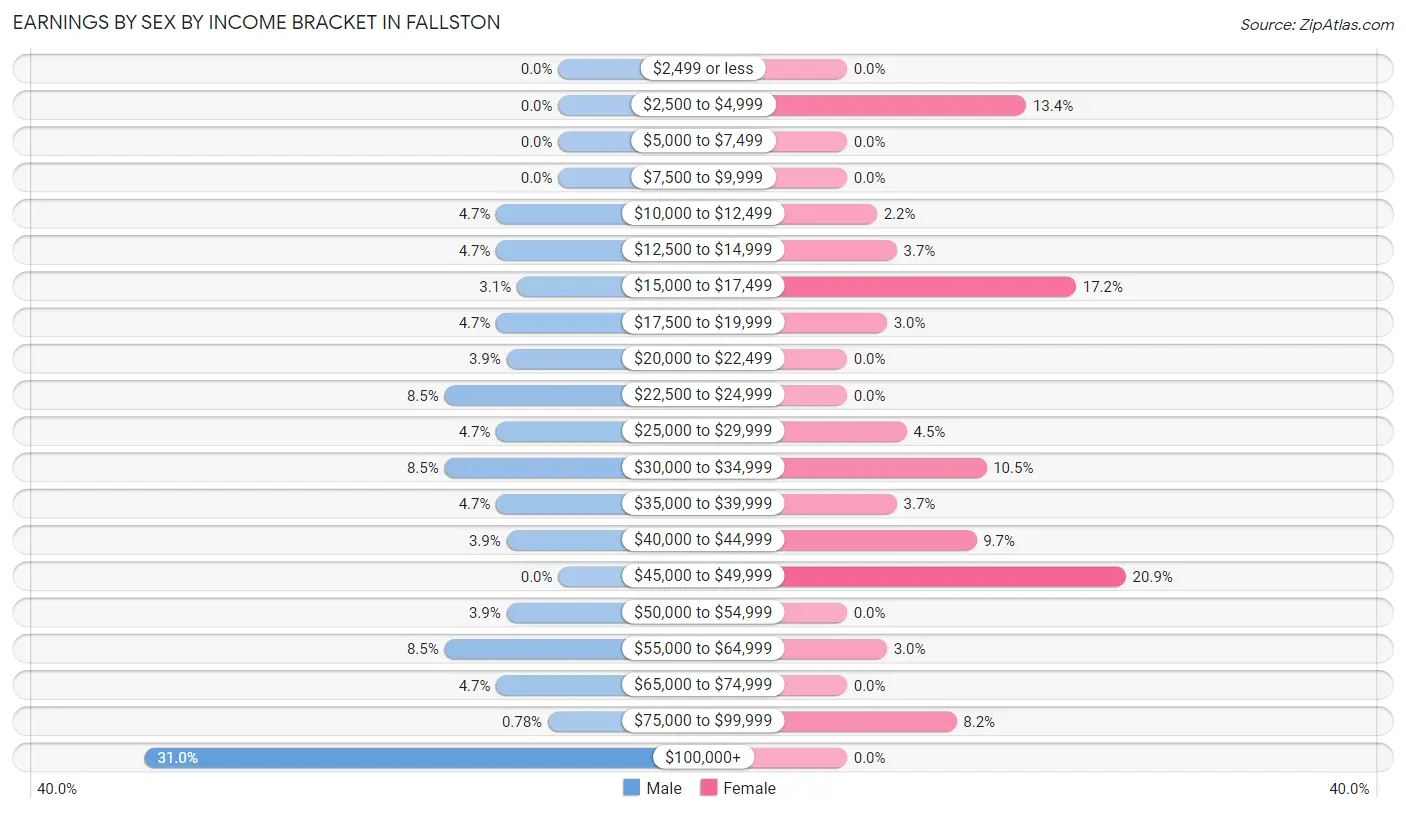
| Income | Male | Female |
| $2,499 or less | 0 (0.0%) | 0 (0.0%) |
| $2,500 to $4,999 | 0 (0.0%) | 18 (13.4%) |
| $5,000 to $7,499 | 0 (0.0%) | 0 (0.0%) |
| $7,500 to $9,999 | 0 (0.0%) | 0 (0.0%) |
| $10,000 to $12,499 | 6 (4.6%) | 3 (2.2%) |
| $12,500 to $14,999 | 6 (4.6%) | 5 (3.7%) |
| $15,000 to $17,499 | 4 (3.1%) | 23 (17.2%) |
| $17,500 to $19,999 | 6 (4.6%) | 4 (3.0%) |
| $20,000 to $22,499 | 5 (3.9%) | 0 (0.0%) |
| $22,500 to $24,999 | 11 (8.5%) | 0 (0.0%) |
| $25,000 to $29,999 | 6 (4.6%) | 6 (4.5%) |
| $30,000 to $34,999 | 11 (8.5%) | 14 (10.4%) |
| $35,000 to $39,999 | 6 (4.6%) | 5 (3.7%) |
| $40,000 to $44,999 | 5 (3.9%) | 13 (9.7%) |
| $45,000 to $49,999 | 0 (0.0%) | 28 (20.9%) |
| $50,000 to $54,999 | 5 (3.9%) | 0 (0.0%) |
| $55,000 to $64,999 | 11 (8.5%) | 4 (3.0%) |
| $65,000 to $74,999 | 6 (4.6%) | 0 (0.0%) |
| $75,000 to $99,999 | 1 (0.8%) | 11 (8.2%) |
| $100,000+ | 40 (31.0%) | 0 (0.0%) |
| Total | 129 (100.0%) | 134 (100.0%) |
Earnings by Sex by Educational Attainment in Fallston
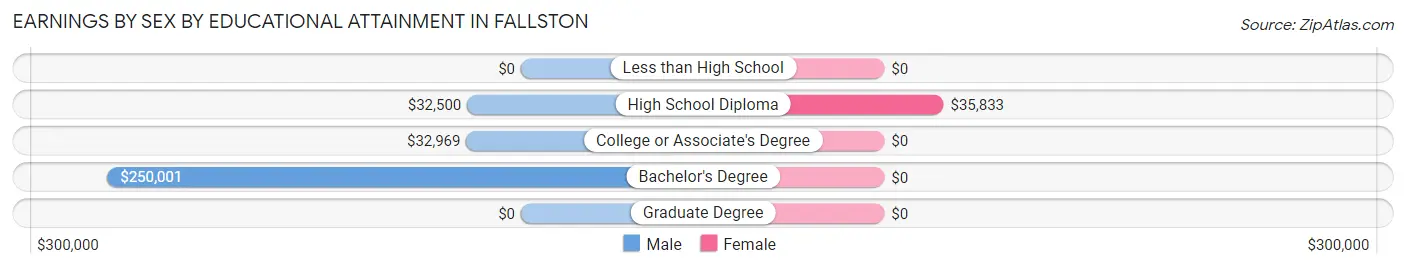
| Educational Attainment | Male Income | Female Income |
| Less than High School | - | - |
| High School Diploma | $32,500 | $35,833 |
| College or Associate's Degree | $32,969 | $0 |
| Bachelor's Degree | $250,001 | $0 |
| Graduate Degree | - | - |
| Total | - | - |
Family Income in Fallston
Family Income Brackets in Fallston
According to the Fallston family income data, there are 29 families falling into the $50,000 to $74,999 income range, which is the most common income bracket and makes up 22.8% of all families.
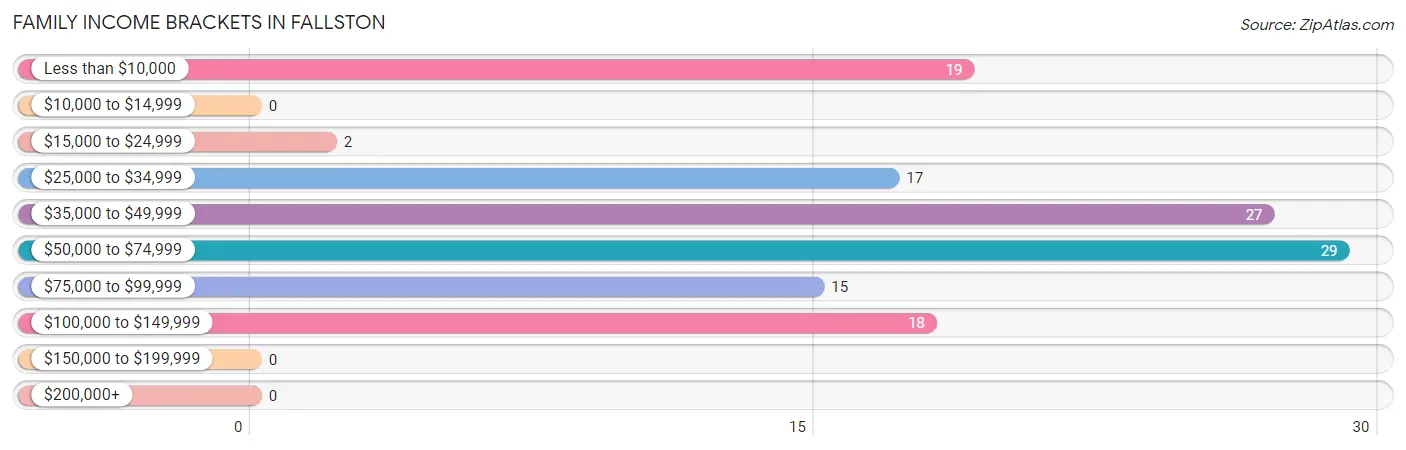
| Income Bracket | # Families | % Families |
| Less than $10,000 | 19 | 15.0% |
| $10,000 to $14,999 | 0 | 0.0% |
| $15,000 to $24,999 | 2 | 1.6% |
| $25,000 to $34,999 | 17 | 13.4% |
| $35,000 to $49,999 | 27 | 21.3% |
| $50,000 to $74,999 | 29 | 22.8% |
| $75,000 to $99,999 | 15 | 11.8% |
| $100,000 to $149,999 | 18 | 14.2% |
| $150,000 to $199,999 | 0 | 0.0% |
| $200,000+ | 0 | 0.0% |
Family Income by Famaliy Size in Fallston
4-person families (12 | 9.5%) account for the highest median family income in Fallston with $79,375 per family, while 2-person families (59 | 46.5%) have the highest median income of $21,688 per family member.
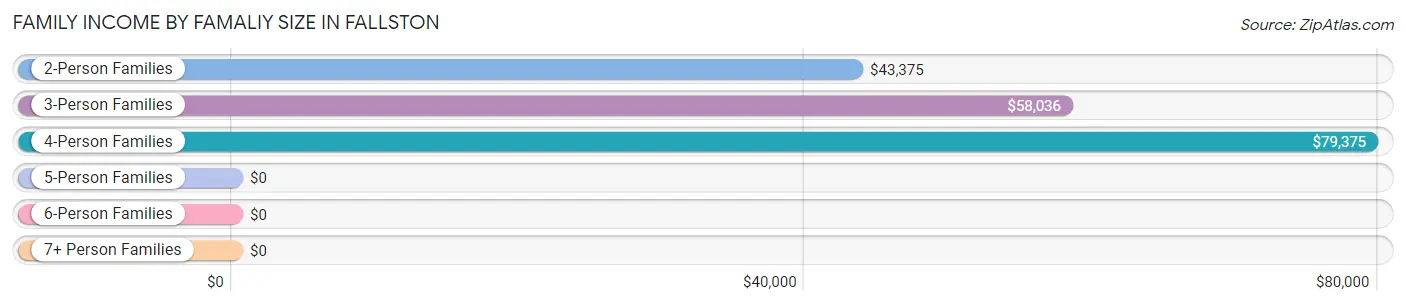
| Income Bracket | # Families | Median Income |
| 2-Person Families | 59 (46.5%) | $43,375 |
| 3-Person Families | 33 (26.0%) | $58,036 |
| 4-Person Families | 12 (9.5%) | $79,375 |
| 5-Person Families | 23 (18.1%) | $0 |
| 6-Person Families | 0 (0.0%) | $0 |
| 7+ Person Families | 0 (0.0%) | $0 |
| Total | 127 (100.0%) | $49,250 |
Family Income by Number of Earners in Fallston
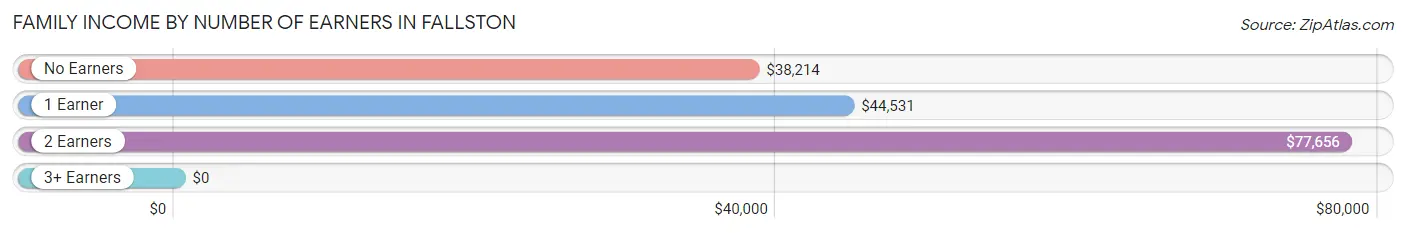
| Number of Earners | # Families | Median Income |
| No Earners | 32 (25.2%) | $38,214 |
| 1 Earner | 59 (46.5%) | $44,531 |
| 2 Earners | 33 (26.0%) | $77,656 |
| 3+ Earners | 3 (2.4%) | $0 |
| Total | 127 (100.0%) | $49,250 |
Household Income in Fallston
Household Income Brackets in Fallston
With 65 households falling in the category, the $15,000 to $24,999 income range is the most frequent in Fallston, accounting for 23.2% of all households.
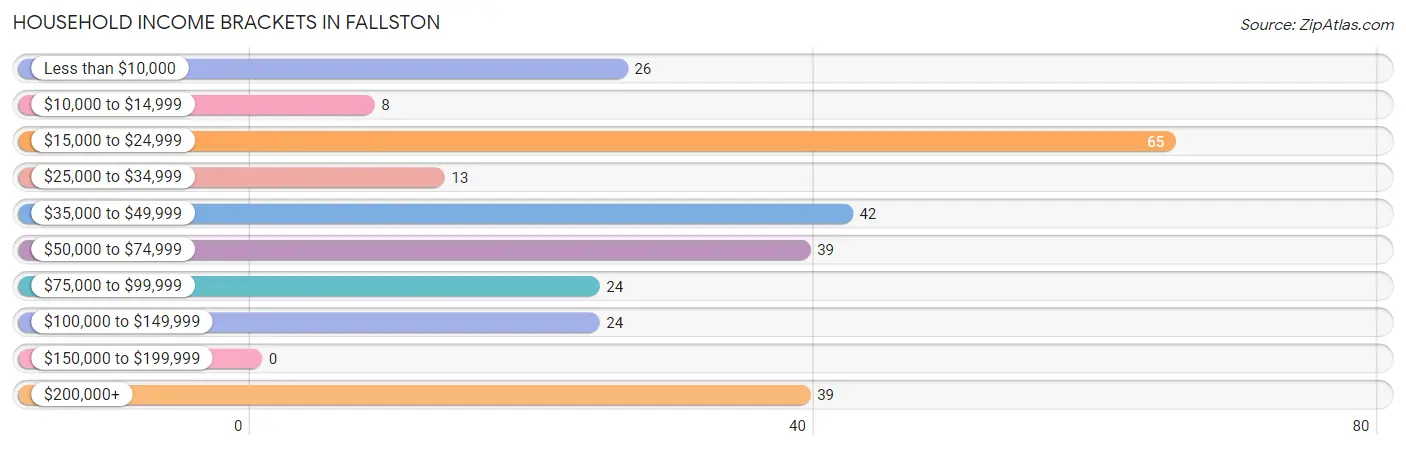
| Income Bracket | # Households | % Households |
| Less than $10,000 | 26 | 9.3% |
| $10,000 to $14,999 | 8 | 2.9% |
| $15,000 to $24,999 | 65 | 23.2% |
| $25,000 to $34,999 | 13 | 4.6% |
| $35,000 to $49,999 | 42 | 15.0% |
| $50,000 to $74,999 | 39 | 13.9% |
| $75,000 to $99,999 | 24 | 8.6% |
| $100,000 to $149,999 | 24 | 8.6% |
| $150,000 to $199,999 | 0 | 0.0% |
| $200,000+ | 39 | 13.9% |
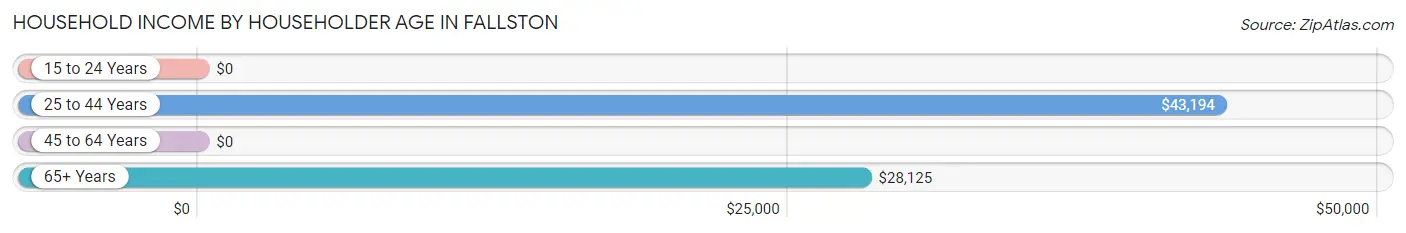
Household Income by Householder Age in Fallston
The median household income in Fallston is $44,545, with the highest median household income of $43,194 found in the 25 to 44 years age bracket for the primary householder. A total of 75 households (26.8%) fall into this category. Meanwhile, the 15 to 24 years age bracket for the primary householder has the lowest median household income of $0, with 1 households (0.4%) in this group.
| Income Bracket | # Households | Median Income |
| 15 to 24 Years | 1 (0.4%) | $0 |
| 25 to 44 Years | 75 (26.8%) | $43,194 |
| 45 to 64 Years | 107 (38.2%) | $0 |
| 65+ Years | 97 (34.6%) | $28,125 |
| Total | 280 (100.0%) | $44,545 |
Poverty in Fallston
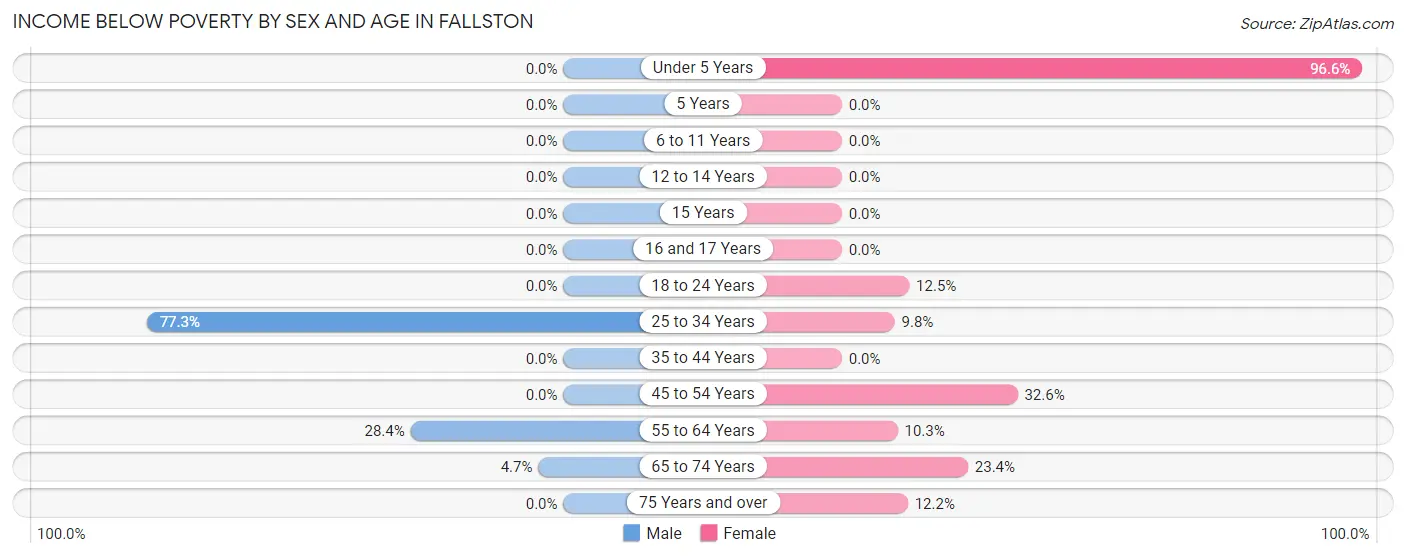
Income Below Poverty by Sex and Age in Fallston
With 25.8% poverty level for males and 34.6% for females among the residents of Fallston, 25 to 34 year old males and under 5 year old females are the most vulnerable to poverty, with 58 males (77.3%) and 85 females (96.6%) in their respective age groups living below the poverty level.
| Age Bracket | Male | Female |
| Under 5 Years | 0 (0.0%) | 85 (96.6%) |
| 5 Years | 0 (0.0%) | 0 (0.0%) |
| 6 to 11 Years | 0 (0.0%) | 0 (0.0%) |
| 12 to 14 Years | 0 (0.0%) | 0 (0.0%) |
| 15 Years | 0 (0.0%) | 0 (0.0%) |
| 16 and 17 Years | 0 (0.0%) | 0 (0.0%) |
| 18 to 24 Years | 0 (0.0%) | 1 (12.5%) |
| 25 to 34 Years | 58 (77.3%) | 5 (9.8%) |
| 35 to 44 Years | 0 (0.0%) | 0 (0.0%) |
| 45 to 54 Years | 0 (0.0%) | 15 (32.6%) |
| 55 to 64 Years | 19 (28.4%) | 3 (10.3%) |
| 65 to 74 Years | 2 (4.6%) | 11 (23.4%) |
| 75 Years and over | 0 (0.0%) | 6 (12.2%) |
| Total | 79 (25.8%) | 126 (34.6%) |
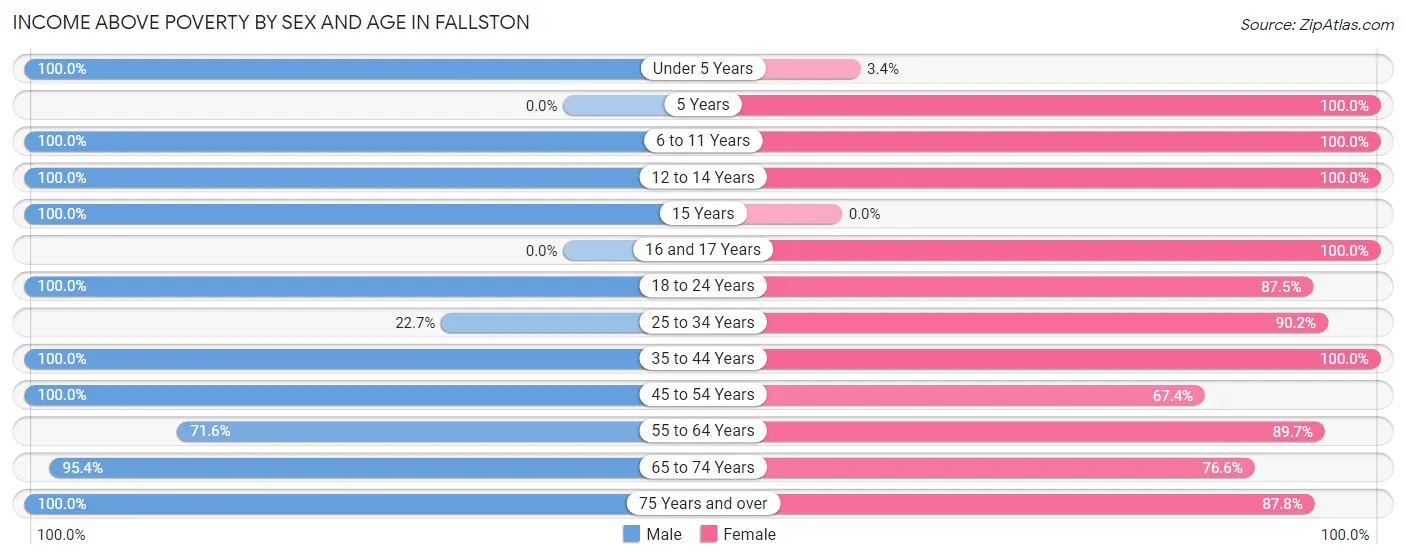
Income Above Poverty by Sex and Age in Fallston
According to the poverty statistics in Fallston, males aged under 5 years and females aged 5 years are the age groups that are most secure financially, with 100.0% of males and 100.0% of females in these age groups living above the poverty line.
| Age Bracket | Male | Female |
| Under 5 Years | 5 (100.0%) | 3 (3.4%) |
| 5 Years | 0 (0.0%) | 2 (100.0%) |
| 6 to 11 Years | 16 (100.0%) | 20 (100.0%) |
| 12 to 14 Years | 7 (100.0%) | 8 (100.0%) |
| 15 Years | 5 (100.0%) | 0 (0.0%) |
| 16 and 17 Years | 0 (0.0%) | 2 (100.0%) |
| 18 to 24 Years | 9 (100.0%) | 7 (87.5%) |
| 25 to 34 Years | 17 (22.7%) | 46 (90.2%) |
| 35 to 44 Years | 25 (100.0%) | 14 (100.0%) |
| 45 to 54 Years | 33 (100.0%) | 31 (67.4%) |
| 55 to 64 Years | 48 (71.6%) | 26 (89.7%) |
| 65 to 74 Years | 41 (95.4%) | 36 (76.6%) |
| 75 Years and over | 21 (100.0%) | 43 (87.8%) |
| Total | 227 (74.2%) | 238 (65.4%) |
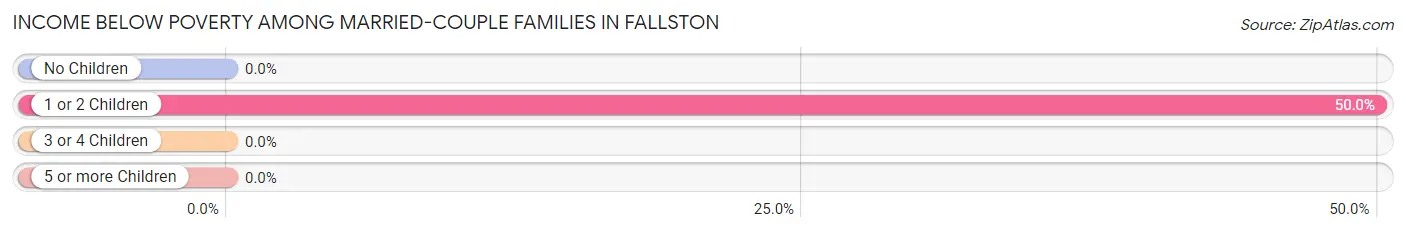
Income Below Poverty Among Married-Couple Families in Fallston
The poverty statistics for married-couple families in Fallston show that 23.7% or 19 of the total 80 families live below the poverty line. Families with 1 or 2 children have the highest poverty rate of 50.0%, comprising of 19 families. On the other hand, families with no children have the lowest poverty rate of 0.0%, which includes 0 families.
| Children | Above Poverty | Below Poverty |
| No Children | 39 (100.0%) | 0 (0.0%) |
| 1 or 2 Children | 19 (50.0%) | 19 (50.0%) |
| 3 or 4 Children | 3 (100.0%) | 0 (0.0%) |
| 5 or more Children | 0 (0.0%) | 0 (0.0%) |
| Total | 61 (76.2%) | 19 (23.7%) |
Income Below Poverty Among Single-Parent Households in Fallston
| Children | Single Father | Single Mother |
| No Children | 0 (0.0%) | 0 (0.0%) |
| 1 or 2 Children | 0 (0.0%) | 0 (0.0%) |
| 3 or 4 Children | 0 (0.0%) | 0 (0.0%) |
| 5 or more Children | 0 (0.0%) | 0 (0.0%) |
| Total | 0 (0.0%) | 0 (0.0%) |
Income Below Poverty Among Married-Couple vs Single-Parent Households in Fallston
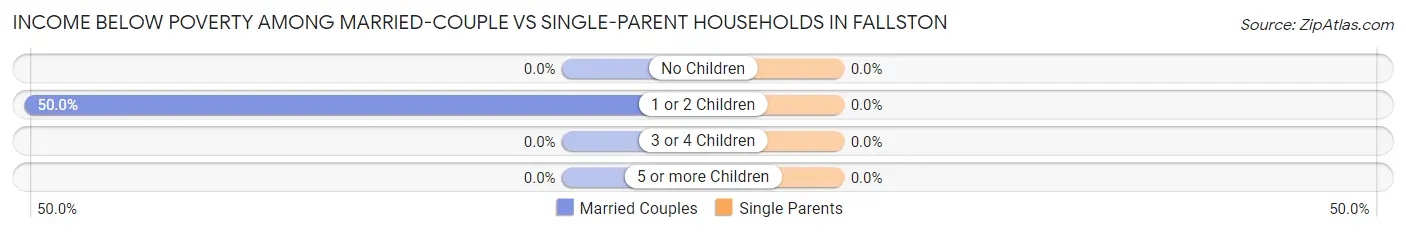
| Children | Married-Couple Families | Single-Parent Households |
| No Children | 0 (0.0%) | 0 (0.0%) |
| 1 or 2 Children | 19 (50.0%) | 0 (0.0%) |
| 3 or 4 Children | 0 (0.0%) | 0 (0.0%) |
| 5 or more Children | 0 (0.0%) | 0 (0.0%) |
| Total | 19 (23.7%) | 0 (0.0%) |
Race in Fallston
The most populous races in Fallston are White / Caucasian (610 | 91.0%), Asian (22 | 3.3%), and Two or more Races (20 | 3.0%).
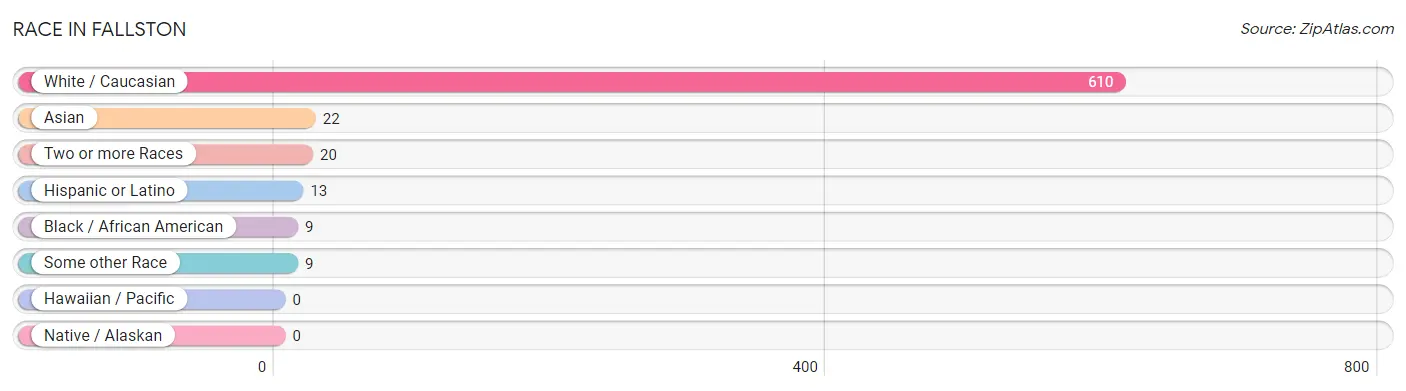
| Race | # Population | % Population |
| Asian | 22 | 3.3% |
| Black / African American | 9 | 1.3% |
| Hawaiian / Pacific | 0 | 0.0% |
| Hispanic or Latino | 13 | 1.9% |
| Native / Alaskan | 0 | 0.0% |
| White / Caucasian | 610 | 91.0% |
| Two or more Races | 20 | 3.0% |
| Some other Race | 9 | 1.3% |
| Total | 670 | 100.0% |
Ancestry in Fallston
The most populous ancestries reported in Fallston are American (223 | 33.3%), Irish (54 | 8.1%), English (39 | 5.8%), German (37 | 5.5%), and French (27 | 4.0%), together accounting for 56.7% of all Fallston residents.
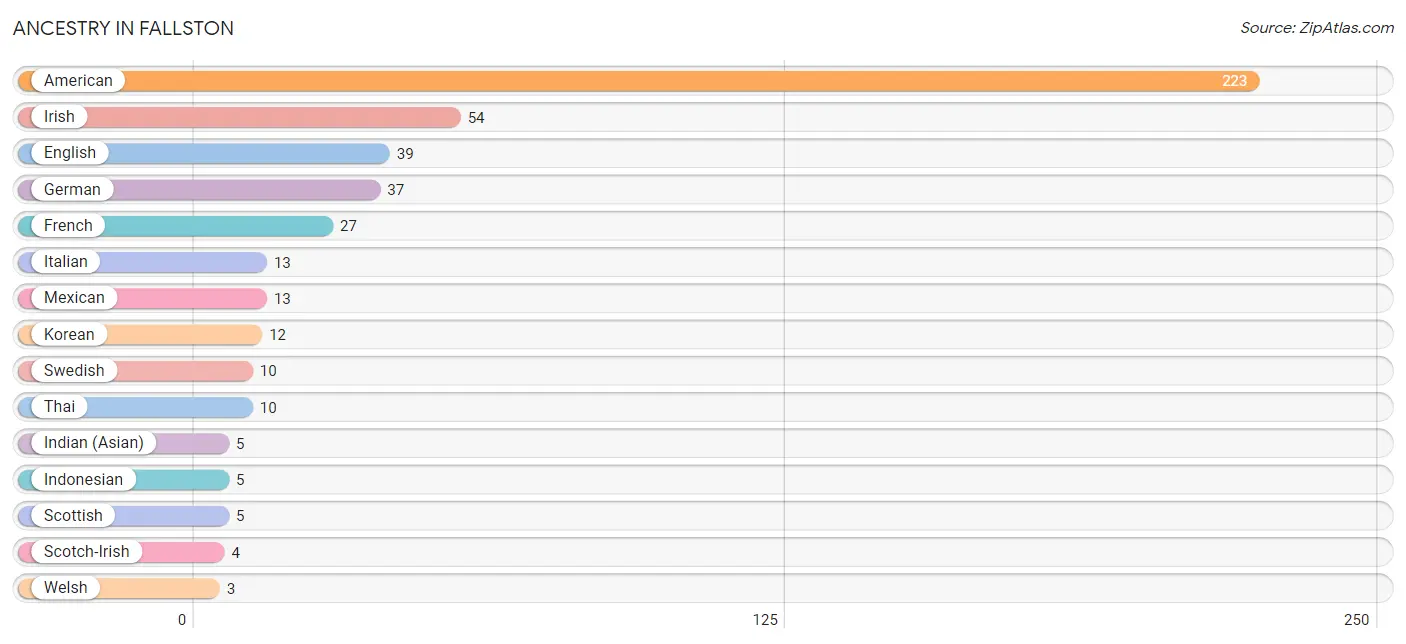
| Ancestry | # Population | % Population |
| American | 223 | 33.3% |
| British | 2 | 0.3% |
| Dutch | 1 | 0.2% |
| English | 39 | 5.8% |
| French | 27 | 4.0% |
| German | 37 | 5.5% |
| Indian (Asian) | 5 | 0.7% |
| Indonesian | 5 | 0.7% |
| Irish | 54 | 8.1% |
| Italian | 13 | 1.9% |
| Korean | 12 | 1.8% |
| Mexican | 13 | 1.9% |
| Scotch-Irish | 4 | 0.6% |
| Scottish | 5 | 0.7% |
| Swedish | 10 | 1.5% |
| Thai | 10 | 1.5% |
| Welsh | 3 | 0.4% | View All 17 Rows |
Immigrants in Fallston
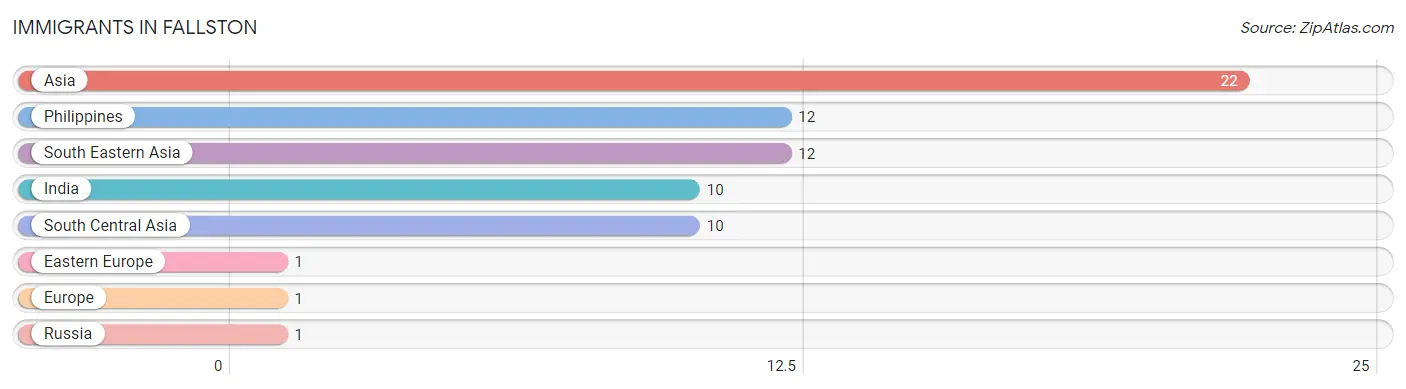
The most numerous immigrant groups reported in Fallston came from Asia (22 | 3.3%), Philippines (12 | 1.8%), South Eastern Asia (12 | 1.8%), India (10 | 1.5%), and South Central Asia (10 | 1.5%), together accounting for 9.8% of all Fallston residents.
| Immigration Origin | # Population | % Population |
| Asia | 22 | 3.3% |
| Eastern Europe | 1 | 0.2% |
| Europe | 1 | 0.2% |
| India | 10 | 1.5% |
| Philippines | 12 | 1.8% |
| Russia | 1 | 0.2% |
| South Central Asia | 10 | 1.5% |
| South Eastern Asia | 12 | 1.8% | View All 8 Rows |
Sex and Age in Fallston
Sex and Age in Fallston
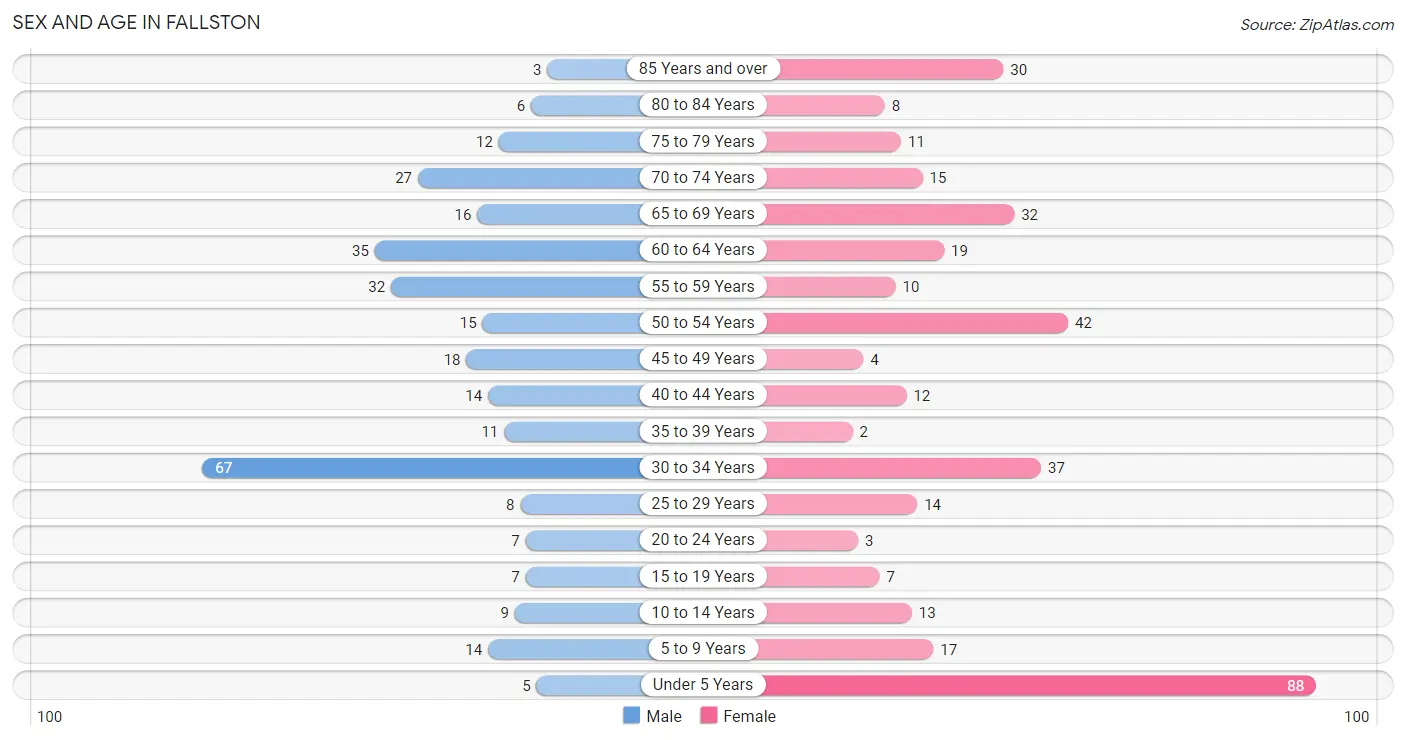
The most populous age groups in Fallston are 30 to 34 Years (67 | 21.9%) for men and Under 5 Years (88 | 24.2%) for women.
| Age Bracket | Male | Female |
| Under 5 Years | 5 (1.6%) | 88 (24.2%) |
| 5 to 9 Years | 14 (4.6%) | 17 (4.7%) |
| 10 to 14 Years | 9 (2.9%) | 13 (3.6%) |
| 15 to 19 Years | 7 (2.3%) | 7 (1.9%) |
| 20 to 24 Years | 7 (2.3%) | 3 (0.8%) |
| 25 to 29 Years | 8 (2.6%) | 14 (3.8%) |
| 30 to 34 Years | 67 (21.9%) | 37 (10.2%) |
| 35 to 39 Years | 11 (3.6%) | 2 (0.5%) |
| 40 to 44 Years | 14 (4.6%) | 12 (3.3%) |
| 45 to 49 Years | 18 (5.9%) | 4 (1.1%) |
| 50 to 54 Years | 15 (4.9%) | 42 (11.5%) |
| 55 to 59 Years | 32 (10.5%) | 10 (2.8%) |
| 60 to 64 Years | 35 (11.4%) | 19 (5.2%) |
| 65 to 69 Years | 16 (5.2%) | 32 (8.8%) |
| 70 to 74 Years | 27 (8.8%) | 15 (4.1%) |
| 75 to 79 Years | 12 (3.9%) | 11 (3.0%) |
| 80 to 84 Years | 6 (2.0%) | 8 (2.2%) |
| 85 Years and over | 3 (1.0%) | 30 (8.2%) |
| Total | 306 (100.0%) | 364 (100.0%) |
Families and Households in Fallston
Median Family Size in Fallston
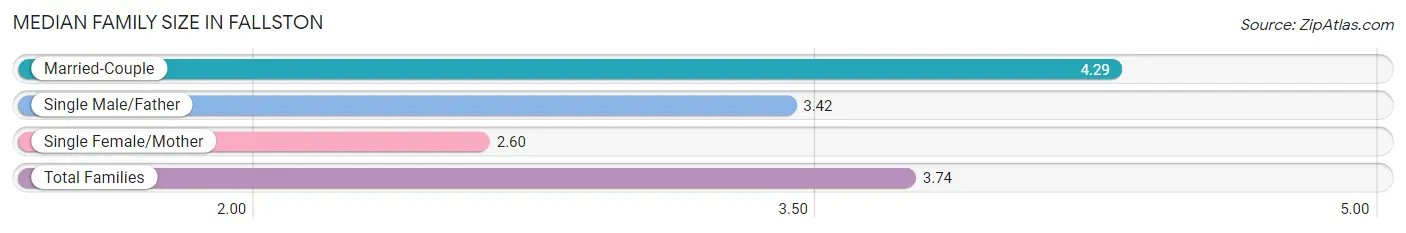
The median family size in Fallston is 3.74 persons per family, with married-couple families (80 | 63.0%) accounting for the largest median family size of 4.29 persons per family. On the other hand, single female/mother families (35 | 27.6%) represent the smallest median family size with 2.60 persons per family.
| Family Type | # Families | Family Size |
| Married-Couple | 80 (63.0%) | 4.29 |
| Single Male/Father | 12 (9.5%) | 3.42 |
| Single Female/Mother | 35 (27.6%) | 2.60 |
| Total Families | 127 (100.0%) | 3.74 |
Median Household Size in Fallston
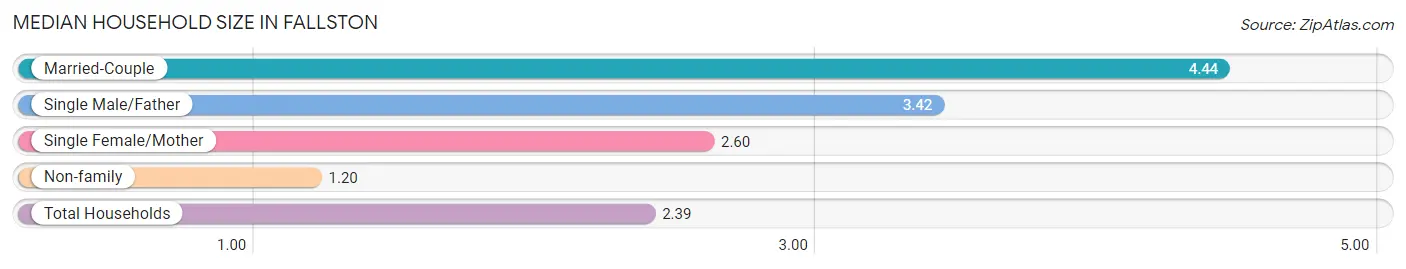
The median household size in Fallston is 2.39 persons per household, with married-couple households (80 | 28.6%) accounting for the largest median household size of 4.44 persons per household. non-family households (153 | 54.6%) represent the smallest median household size with 1.20 persons per household.
| Household Type | # Households | Household Size |
| Married-Couple | 80 (28.6%) | 4.44 |
| Single Male/Father | 12 (4.3%) | 3.42 |
| Single Female/Mother | 35 (12.5%) | 2.60 |
| Non-family | 153 (54.6%) | 1.20 |
| Total Households | 280 (100.0%) | 2.39 |
Household Size by Marriage Status in Fallston
Out of a total of 280 households in Fallston, 127 (45.4%) are family households, while 153 (54.6%) are nonfamily households. The most numerous type of family households are 2-person households, comprising 53, and the most common type of nonfamily households are 1-person households, comprising 131.
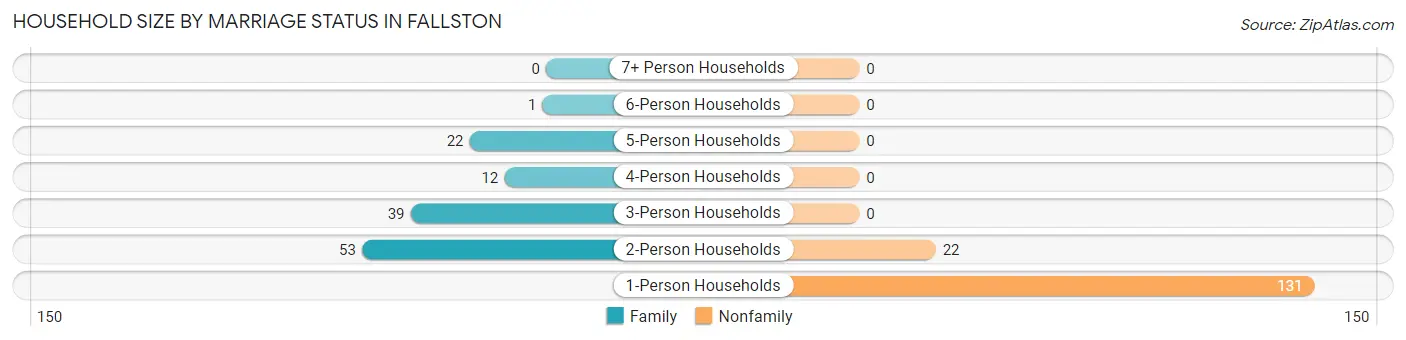
| Household Size | Family Households | Nonfamily Households |
| 1-Person Households | - | 131 (46.8%) |
| 2-Person Households | 53 (18.9%) | 22 (7.9%) |
| 3-Person Households | 39 (13.9%) | 0 (0.0%) |
| 4-Person Households | 12 (4.3%) | 0 (0.0%) |
| 5-Person Households | 22 (7.9%) | 0 (0.0%) |
| 6-Person Households | 1 (0.4%) | 0 (0.0%) |
| 7+ Person Households | 0 (0.0%) | 0 (0.0%) |
| Total | 127 (45.4%) | 153 (54.6%) |
Female Fertility in Fallston
Fertility by Age in Fallston
Average fertility rate in Fallston is 35.0 births per 1,000 women. Women in the age bracket of 20 to 34 years have the highest fertility rate with 56.0 births per 1,000 women. Women in the age bracket of 20 to 34 years acount for 100.0% of all women with births.
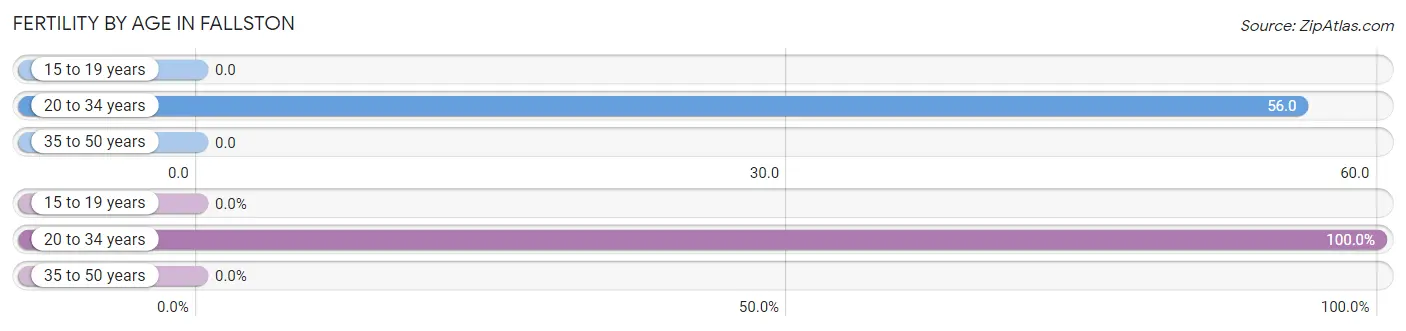
| Age Bracket | Women with Births | Births / 1,000 Women |
| 15 to 19 years | 0 (0.0%) | 0.0 |
| 20 to 34 years | 3 (100.0%) | 56.0 |
| 35 to 50 years | 0 (0.0%) | 0.0 |
| Total | 3 (100.0%) | 35.0 |
Fertility by Age by Marriage Status in Fallston
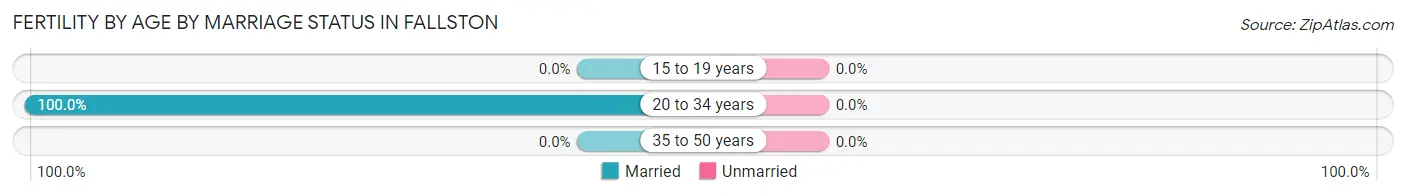
| Age Bracket | Married | Unmarried |
| 15 to 19 years | 0 (0.0%) | 0 (0.0%) |
| 20 to 34 years | 3 (100.0%) | 0 (0.0%) |
| 35 to 50 years | 0 (0.0%) | 0 (0.0%) |
| Total | 3 (100.0%) | 0 (0.0%) |
Fertility by Education in Fallston
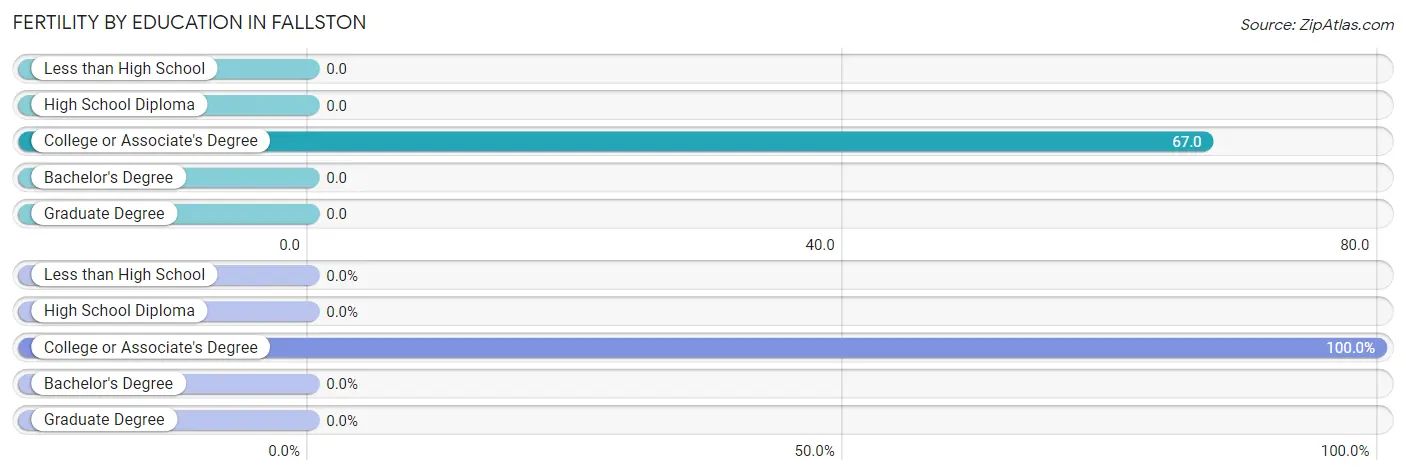
| Educational Attainment | Women with Births | Births / 1,000 Women |
| Less than High School | 0 (0.0%) | 0.0 |
| High School Diploma | 0 (0.0%) | 0.0 |
| College or Associate's Degree | 3 (100.0%) | 67.0 |
| Bachelor's Degree | 0 (0.0%) | 0.0 |
| Graduate Degree | 0 (0.0%) | 0.0 |
| Total | 3 (100.0%) | 35.0 |
Fertility by Education by Marriage Status in Fallston
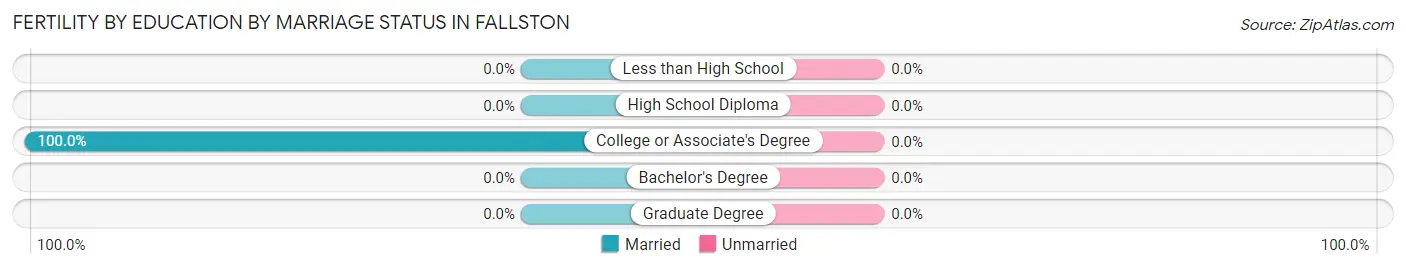
| Educational Attainment | Married | Unmarried |
| Less than High School | 0 (0.0%) | 0 (0.0%) |
| High School Diploma | 0 (0.0%) | 0 (0.0%) |
| College or Associate's Degree | 3 (100.0%) | 0 (0.0%) |
| Bachelor's Degree | 0 (0.0%) | 0 (0.0%) |
| Graduate Degree | 0 (0.0%) | 0 (0.0%) |
| Total | 3 (100.0%) | 0 (0.0%) |
Employment Characteristics in Fallston
Employment by Class of Employer in Fallston
Among the 243 employed individuals in Fallston, private company employees (171 | 70.4%), self-employed (not incorporated) (35 | 14.4%), and local government employees (17 | 7.0%) make up the most common classes of employment.
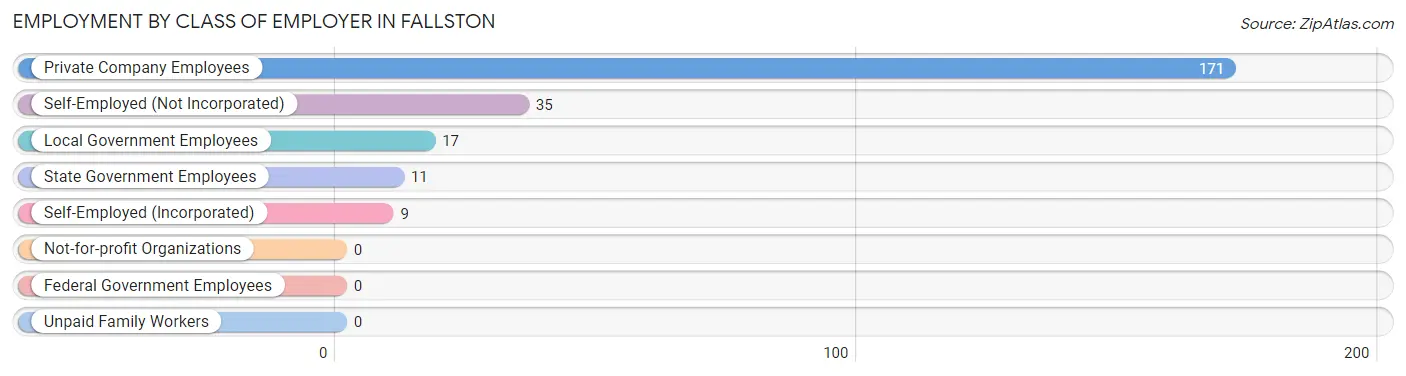
| Employer Class | # Employees | % Employees |
| Private Company Employees | 171 | 70.4% |
| Self-Employed (Incorporated) | 9 | 3.7% |
| Self-Employed (Not Incorporated) | 35 | 14.4% |
| Not-for-profit Organizations | 0 | 0.0% |
| Local Government Employees | 17 | 7.0% |
| State Government Employees | 11 | 4.5% |
| Federal Government Employees | 0 | 0.0% |
| Unpaid Family Workers | 0 | 0.0% |
| Total | 243 | 100.0% |
Employment Status by Age in Fallston
According to the labor force statistics for Fallston, out of the total population over 16 years of age (519), 47.8% or 248 individuals are in the labor force, with 2.0% or 5 of them unemployed. The age group with the highest labor force participation rate is 25 to 29 years, with 100.0% or 22 individuals in the labor force. Within the labor force, the 16 to 19 years age range has the highest percentage of unemployed individuals, with 100.0% or 3 of them being unemployed.
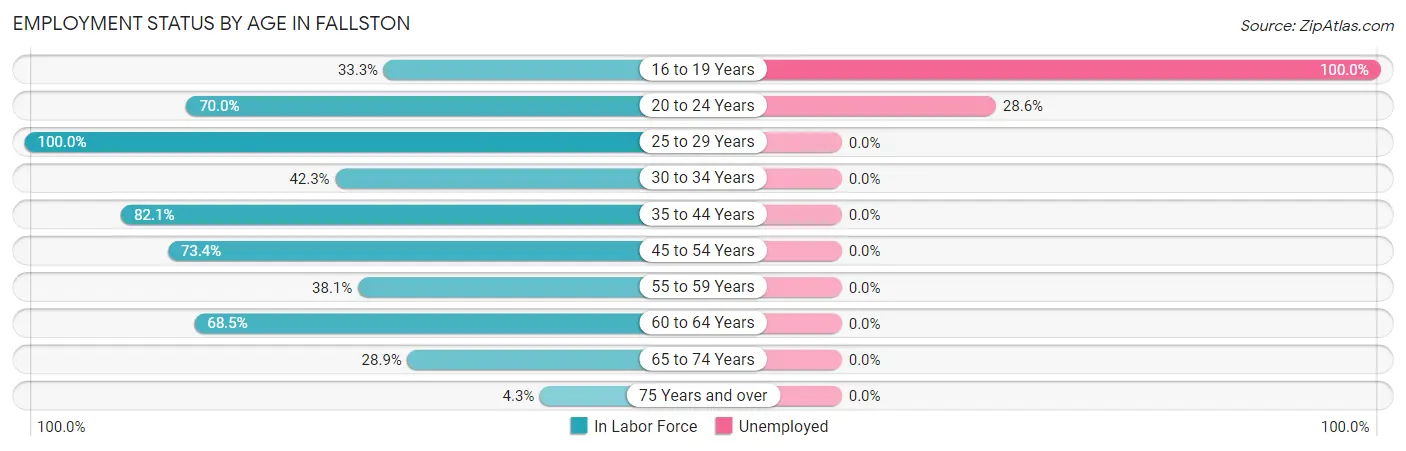
| Age Bracket | In Labor Force | Unemployed |
| 16 to 19 Years | 3 (33.3%) | 3 (100.0%) |
| 20 to 24 Years | 7 (70.0%) | 2 (28.6%) |
| 25 to 29 Years | 22 (100.0%) | 0 (0.0%) |
| 30 to 34 Years | 44 (42.3%) | 0 (0.0%) |
| 35 to 44 Years | 32 (82.1%) | 0 (0.0%) |
| 45 to 54 Years | 58 (73.4%) | 0 (0.0%) |
| 55 to 59 Years | 16 (38.1%) | 0 (0.0%) |
| 60 to 64 Years | 37 (68.5%) | 0 (0.0%) |
| 65 to 74 Years | 26 (28.9%) | 0 (0.0%) |
| 75 Years and over | 3 (4.3%) | 0 (0.0%) |
| Total | 248 (47.8%) | 5 (2.0%) |
Employment Status by Educational Attainment in Fallston
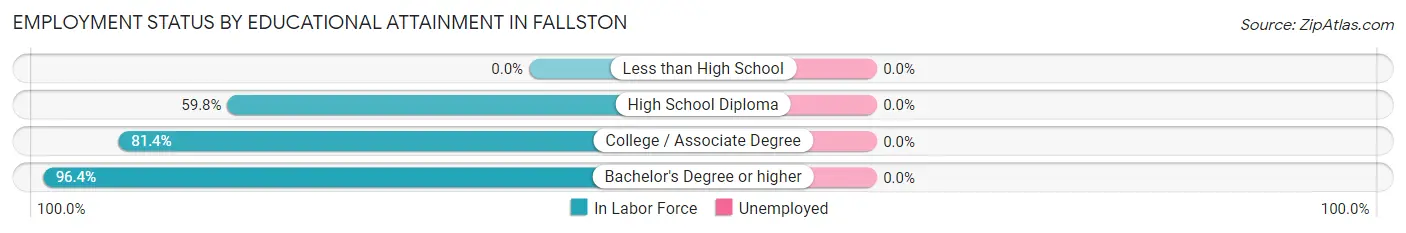
| Educational Attainment | In Labor Force | Unemployed |
| Less than High School | 0 (0.0%) | 0 (0.0%) |
| High School Diploma | 64 (59.8%) | 0 (0.0%) |
| College / Associate Degree | 92 (81.4%) | 0 (0.0%) |
| Bachelor's Degree or higher | 53 (96.4%) | 0 (0.0%) |
| Total | 209 (61.5%) | 0 (0.0%) |
Employment Occupations by Sex in Fallston
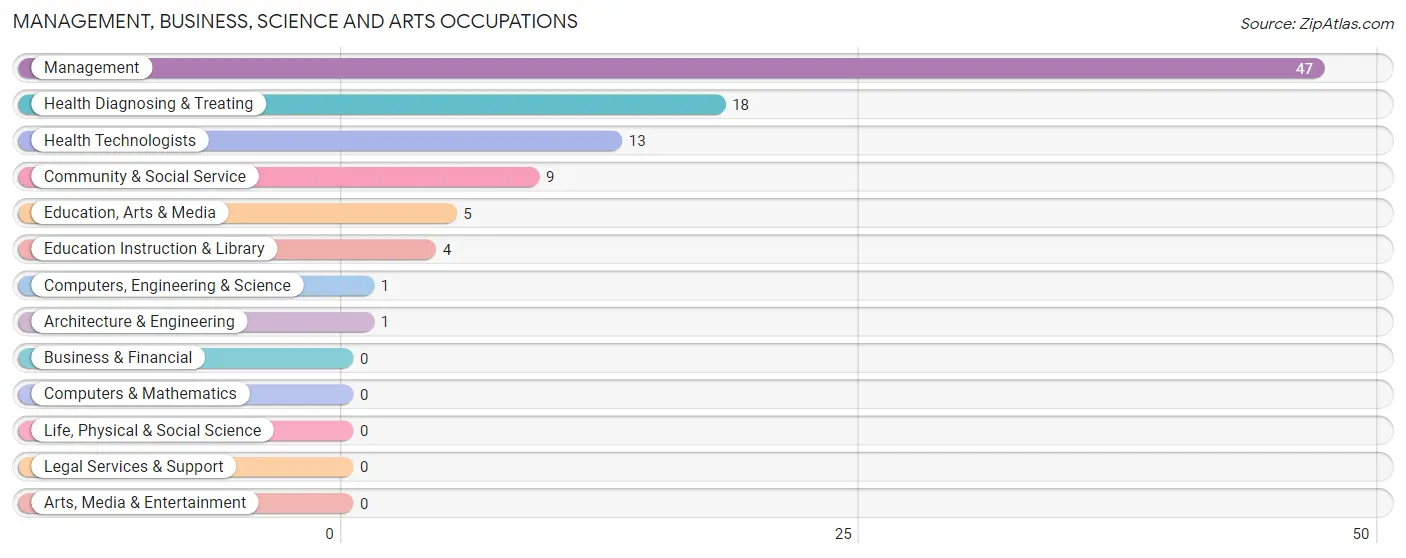
Management, Business, Science and Arts Occupations
The most common Management, Business, Science and Arts occupations in Fallston are Management (47 | 19.3%), Health Diagnosing & Treating (18 | 7.4%), Health Technologists (13 | 5.3%), Community & Social Service (9 | 3.7%), and Education, Arts & Media (5 | 2.1%).
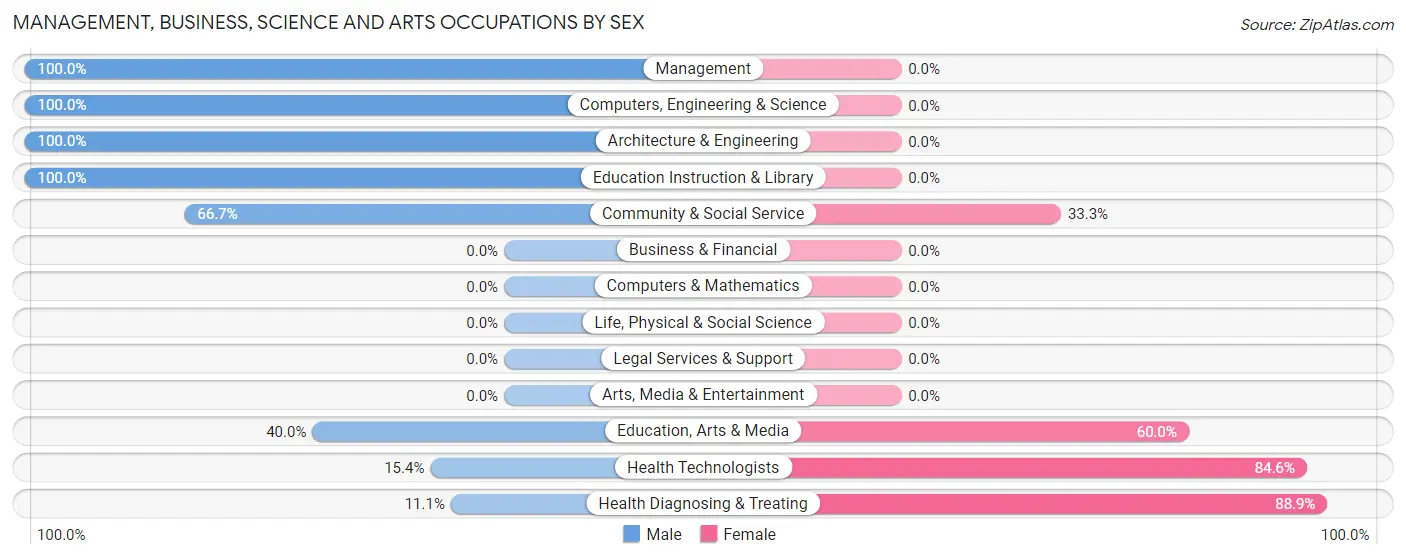
Management, Business, Science and Arts Occupations by Sex
Within the Management, Business, Science and Arts occupations in Fallston, the most male-oriented occupations are Management (100.0%), Computers, Engineering & Science (100.0%), and Architecture & Engineering (100.0%), while the most female-oriented occupations are Health Diagnosing & Treating (88.9%), Health Technologists (84.6%), and Education, Arts & Media (60.0%).
| Occupation | Male | Female |
| Management | 47 (100.0%) | 0 (0.0%) |
| Business & Financial | 0 (0.0%) | 0 (0.0%) |
| Computers, Engineering & Science | 1 (100.0%) | 0 (0.0%) |
| Computers & Mathematics | 0 (0.0%) | 0 (0.0%) |
| Architecture & Engineering | 1 (100.0%) | 0 (0.0%) |
| Life, Physical & Social Science | 0 (0.0%) | 0 (0.0%) |
| Community & Social Service | 6 (66.7%) | 3 (33.3%) |
| Education, Arts & Media | 2 (40.0%) | 3 (60.0%) |
| Legal Services & Support | 0 (0.0%) | 0 (0.0%) |
| Education Instruction & Library | 4 (100.0%) | 0 (0.0%) |
| Arts, Media & Entertainment | 0 (0.0%) | 0 (0.0%) |
| Health Diagnosing & Treating | 2 (11.1%) | 16 (88.9%) |
| Health Technologists | 2 (15.4%) | 11 (84.6%) |
| Total (Category) | 56 (74.7%) | 19 (25.3%) |
| Total (Overall) | 129 (53.1%) | 114 (46.9%) |
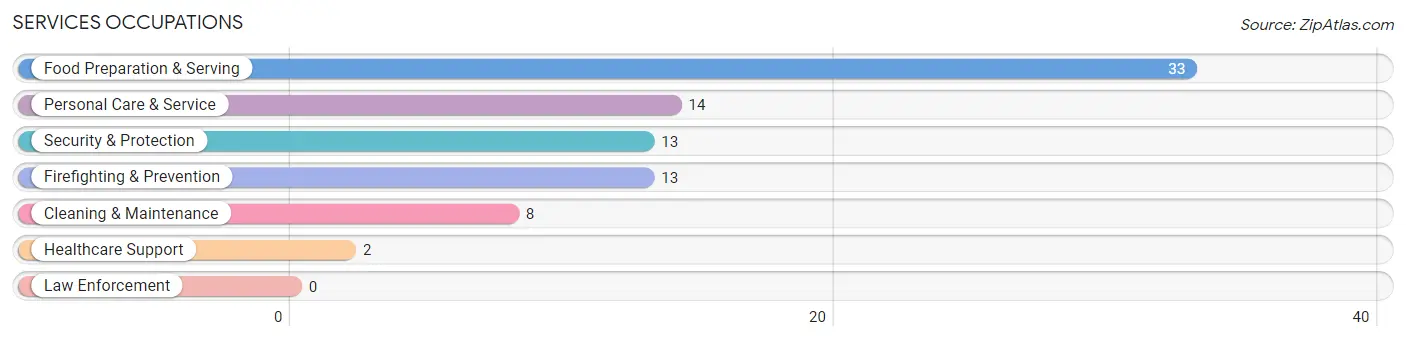
Services Occupations
The most common Services occupations in Fallston are Food Preparation & Serving (33 | 13.6%), Personal Care & Service (14 | 5.8%), Security & Protection (13 | 5.3%), Firefighting & Prevention (13 | 5.3%), and Cleaning & Maintenance (8 | 3.3%).
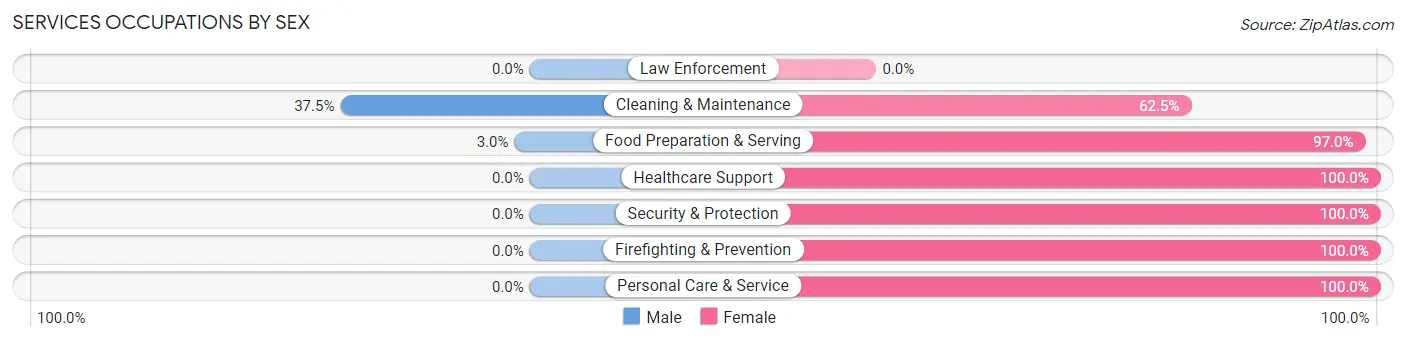
Services Occupations by Sex
Within the Services occupations in Fallston, the most male-oriented occupations are Cleaning & Maintenance (37.5%), and Food Preparation & Serving (3.0%), while the most female-oriented occupations are Healthcare Support (100.0%), Security & Protection (100.0%), and Firefighting & Prevention (100.0%).
| Occupation | Male | Female |
| Healthcare Support | 0 (0.0%) | 2 (100.0%) |
| Security & Protection | 0 (0.0%) | 13 (100.0%) |
| Firefighting & Prevention | 0 (0.0%) | 13 (100.0%) |
| Law Enforcement | 0 (0.0%) | 0 (0.0%) |
| Food Preparation & Serving | 1 (3.0%) | 32 (97.0%) |
| Cleaning & Maintenance | 3 (37.5%) | 5 (62.5%) |
| Personal Care & Service | 0 (0.0%) | 14 (100.0%) |
| Total (Category) | 4 (5.7%) | 66 (94.3%) |
| Total (Overall) | 129 (53.1%) | 114 (46.9%) |
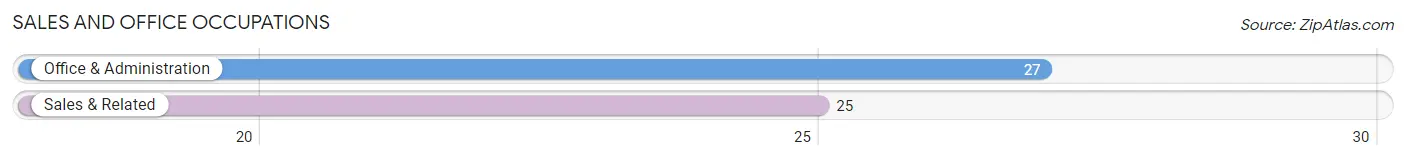
Sales and Office Occupations
The most common Sales and Office occupations in Fallston are Office & Administration (27 | 11.1%), and Sales & Related (25 | 10.3%).
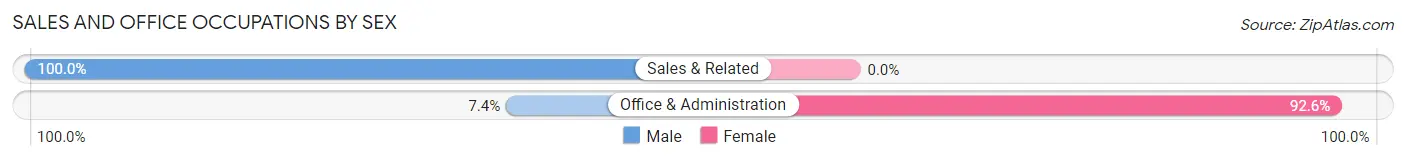
Sales and Office Occupations by Sex
| Occupation | Male | Female |
| Sales & Related | 25 (100.0%) | 0 (0.0%) |
| Office & Administration | 2 (7.4%) | 25 (92.6%) |
| Total (Category) | 27 (51.9%) | 25 (48.1%) |
| Total (Overall) | 129 (53.1%) | 114 (46.9%) |
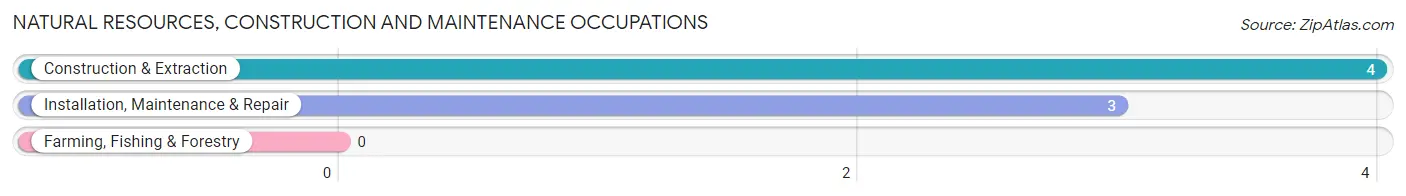
Natural Resources, Construction and Maintenance Occupations
The most common Natural Resources, Construction and Maintenance occupations in Fallston are Construction & Extraction (4 | 1.7%), and Installation, Maintenance & Repair (3 | 1.2%).
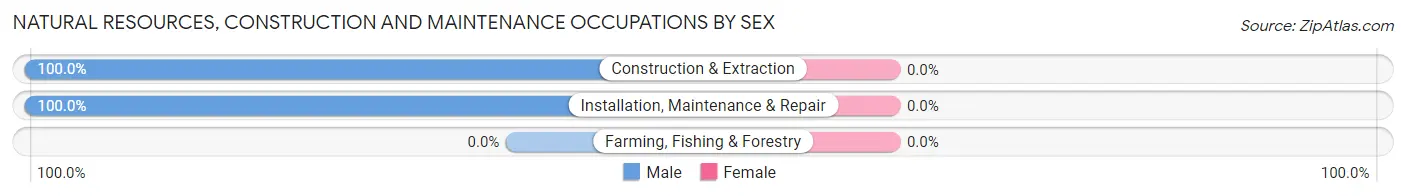
Natural Resources, Construction and Maintenance Occupations by Sex
| Occupation | Male | Female |
| Farming, Fishing & Forestry | 0 (0.0%) | 0 (0.0%) |
| Construction & Extraction | 4 (100.0%) | 0 (0.0%) |
| Installation, Maintenance & Repair | 3 (100.0%) | 0 (0.0%) |
| Total (Category) | 7 (100.0%) | 0 (0.0%) |
| Total (Overall) | 129 (53.1%) | 114 (46.9%) |
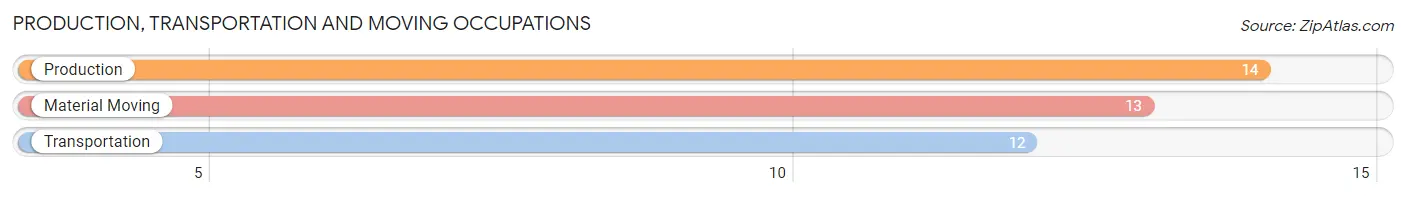
Production, Transportation and Moving Occupations
The most common Production, Transportation and Moving occupations in Fallston are Production (14 | 5.8%), Material Moving (13 | 5.3%), and Transportation (12 | 4.9%).
Production, Transportation and Moving Occupations by Sex
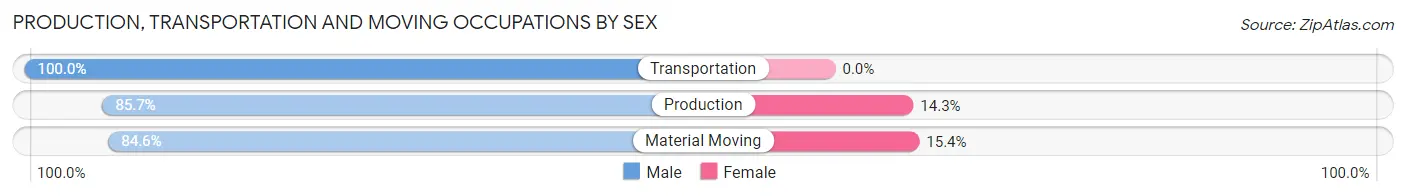
| Occupation | Male | Female |
| Production | 12 (85.7%) | 2 (14.3%) |
| Transportation | 12 (100.0%) | 0 (0.0%) |
| Material Moving | 11 (84.6%) | 2 (15.4%) |
| Total (Category) | 35 (89.7%) | 4 (10.3%) |
| Total (Overall) | 129 (53.1%) | 114 (46.9%) |
Employment Industries by Sex in Fallston
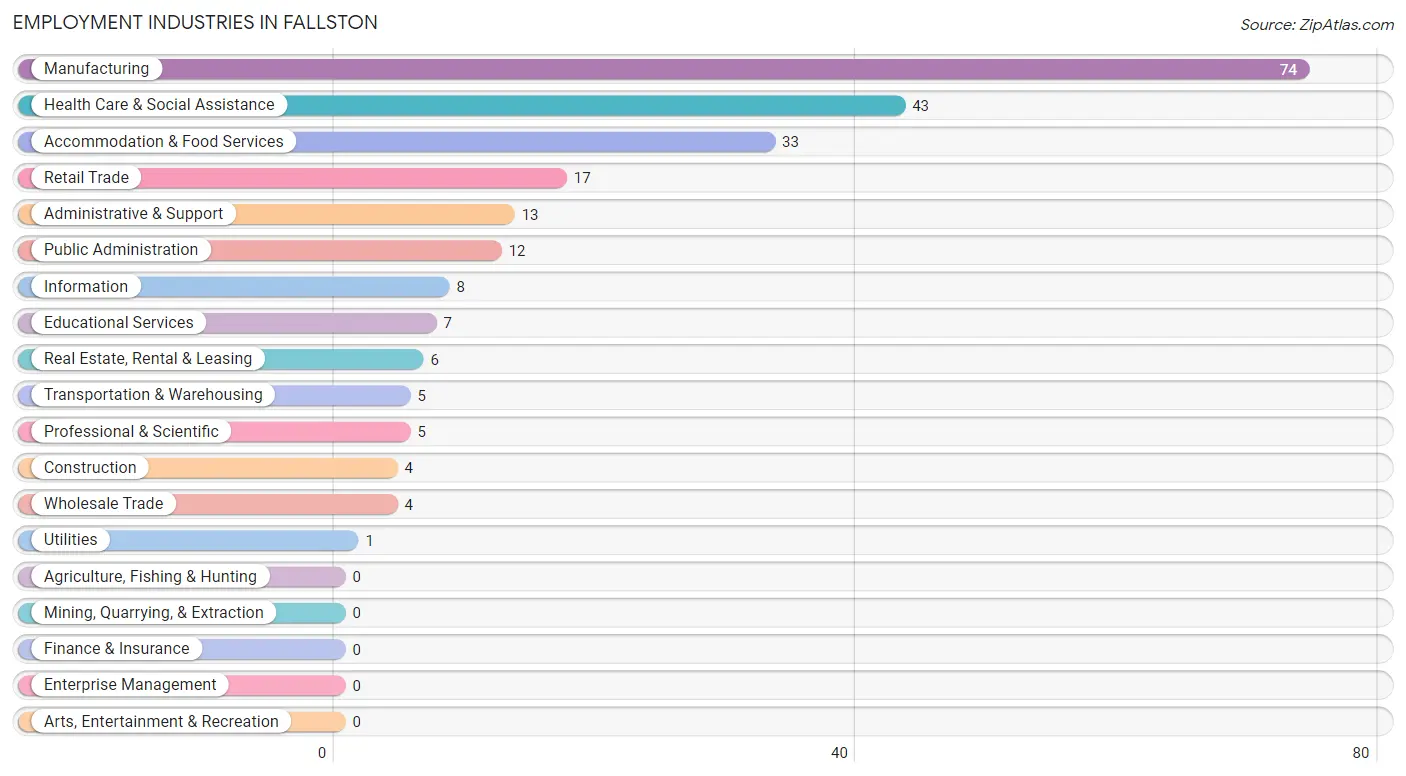
Employment Industries in Fallston
The major employment industries in Fallston include Manufacturing (74 | 30.4%), Health Care & Social Assistance (43 | 17.7%), Accommodation & Food Services (33 | 13.6%), Retail Trade (17 | 7.0%), and Administrative & Support (13 | 5.3%).
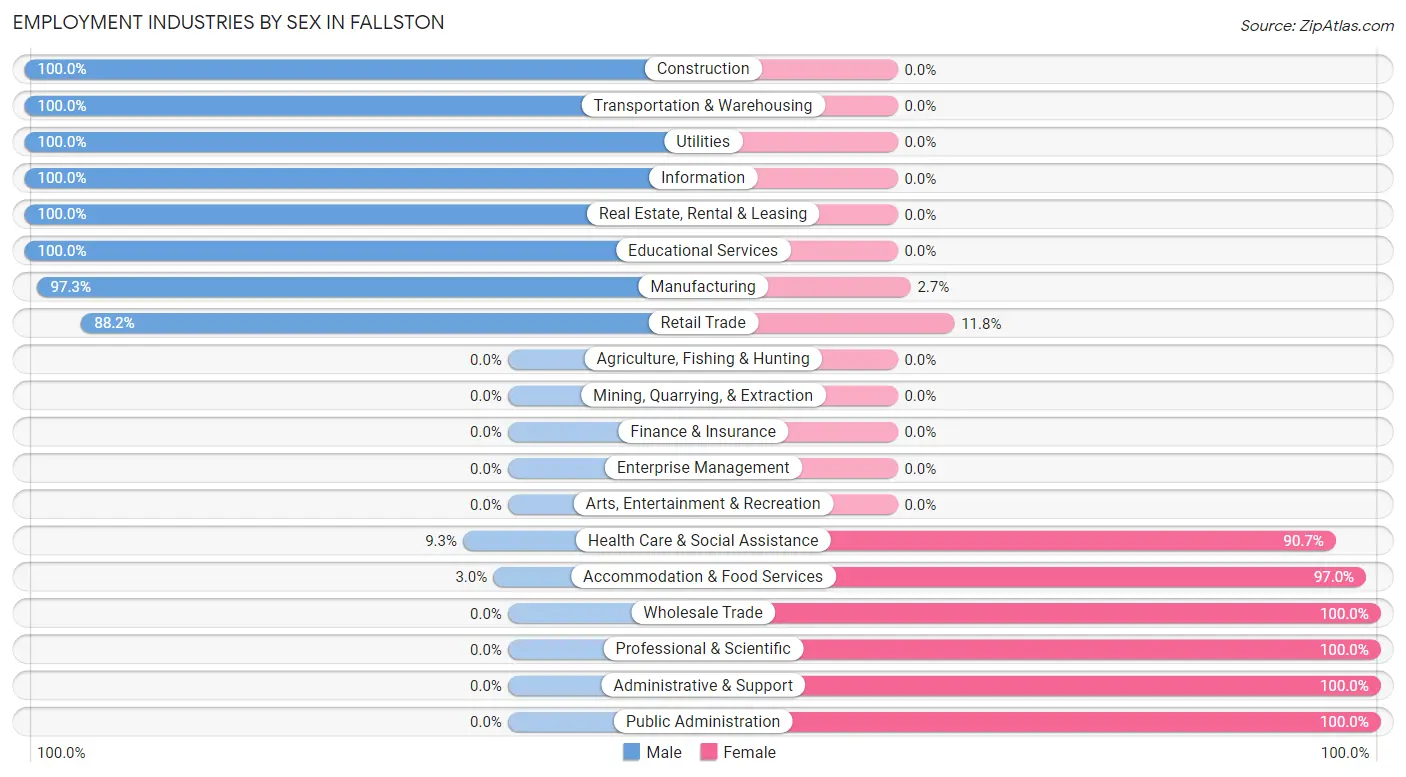
Employment Industries by Sex in Fallston
The Fallston industries that see more men than women are Construction (100.0%), Transportation & Warehousing (100.0%), and Utilities (100.0%), whereas the industries that tend to have a higher number of women are Wholesale Trade (100.0%), Professional & Scientific (100.0%), and Administrative & Support (100.0%).
| Industry | Male | Female |
| Agriculture, Fishing & Hunting | 0 (0.0%) | 0 (0.0%) |
| Mining, Quarrying, & Extraction | 0 (0.0%) | 0 (0.0%) |
| Construction | 4 (100.0%) | 0 (0.0%) |
| Manufacturing | 72 (97.3%) | 2 (2.7%) |
| Wholesale Trade | 0 (0.0%) | 4 (100.0%) |
| Retail Trade | 15 (88.2%) | 2 (11.8%) |
| Transportation & Warehousing | 5 (100.0%) | 0 (0.0%) |
| Utilities | 1 (100.0%) | 0 (0.0%) |
| Information | 8 (100.0%) | 0 (0.0%) |
| Finance & Insurance | 0 (0.0%) | 0 (0.0%) |
| Real Estate, Rental & Leasing | 6 (100.0%) | 0 (0.0%) |
| Professional & Scientific | 0 (0.0%) | 5 (100.0%) |
| Enterprise Management | 0 (0.0%) | 0 (0.0%) |
| Administrative & Support | 0 (0.0%) | 13 (100.0%) |
| Educational Services | 7 (100.0%) | 0 (0.0%) |
| Health Care & Social Assistance | 4 (9.3%) | 39 (90.7%) |
| Arts, Entertainment & Recreation | 0 (0.0%) | 0 (0.0%) |
| Accommodation & Food Services | 1 (3.0%) | 32 (97.0%) |
| Public Administration | 0 (0.0%) | 12 (100.0%) |
| Total | 129 (53.1%) | 114 (46.9%) |
Education in Fallston
School Enrollment in Fallston
The most common levels of schooling among the 70 students in Fallston are middle school (22 | 31.4%), kindergarten (18 | 25.7%), and elementary school (13 | 18.6%).
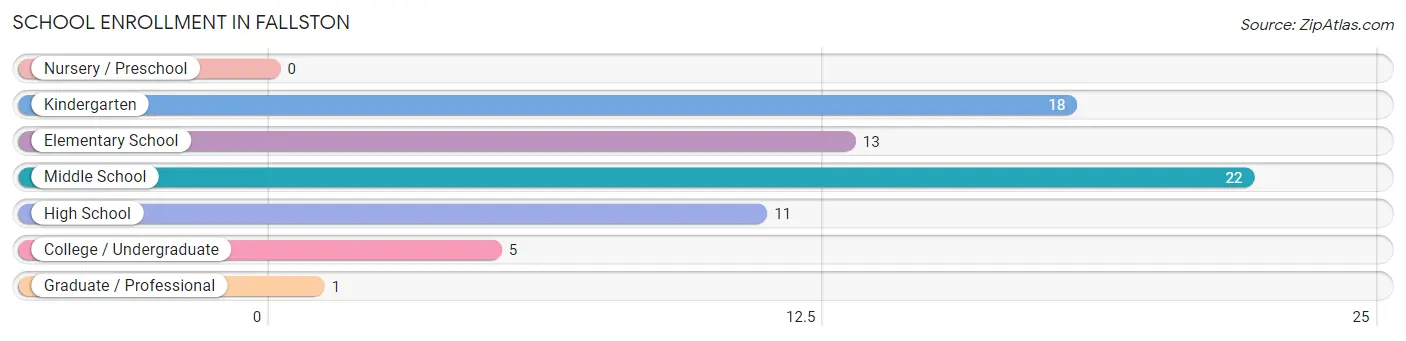
| School Level | # Students | % Students |
| Nursery / Preschool | 0 | 0.0% |
| Kindergarten | 18 | 25.7% |
| Elementary School | 13 | 18.6% |
| Middle School | 22 | 31.4% |
| High School | 11 | 15.7% |
| College / Undergraduate | 5 | 7.1% |
| Graduate / Professional | 1 | 1.4% |
| Total | 70 | 100.0% |
School Enrollment by Age by Funding Source in Fallston
Out of a total of 70 students who are enrolled in schools in Fallston, 8 (11.4%) attend a private institution, while the remaining 62 (88.6%) are enrolled in public schools. The age group of 10 to 14 year olds has the highest likelihood of being enrolled in private schools, with 5 (22.7% in the age bracket) enrolled. Conversely, the age group of 15 to 17 year olds has the lowest likelihood of being enrolled in a private school, with 7 (100.0% in the age bracket) attending a public institution.
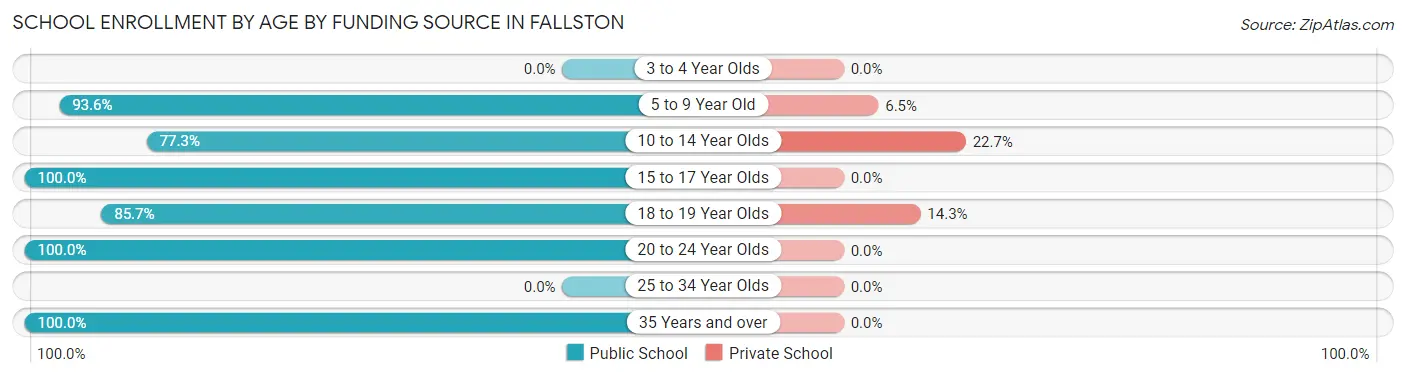
| Age Bracket | Public School | Private School |
| 3 to 4 Year Olds | 0 (0.0%) | 0 (0.0%) |
| 5 to 9 Year Old | 29 (93.5%) | 2 (6.5%) |
| 10 to 14 Year Olds | 17 (77.3%) | 5 (22.7%) |
| 15 to 17 Year Olds | 7 (100.0%) | 0 (0.0%) |
| 18 to 19 Year Olds | 6 (85.7%) | 1 (14.3%) |
| 20 to 24 Year Olds | 2 (100.0%) | 0 (0.0%) |
| 25 to 34 Year Olds | 0 (0.0%) | 0 (0.0%) |
| 35 Years and over | 1 (100.0%) | 0 (0.0%) |
| Total | 62 (88.6%) | 8 (11.4%) |
Educational Attainment by Field of Study in Fallston
Physical & health sciences (34 | 29.6%), business (34 | 29.6%), literature & languages (13 | 11.3%), arts & humanities (13 | 11.3%), and education (10 | 8.7%) are the most common fields of study among 115 individuals in Fallston who have obtained a bachelor's degree or higher.
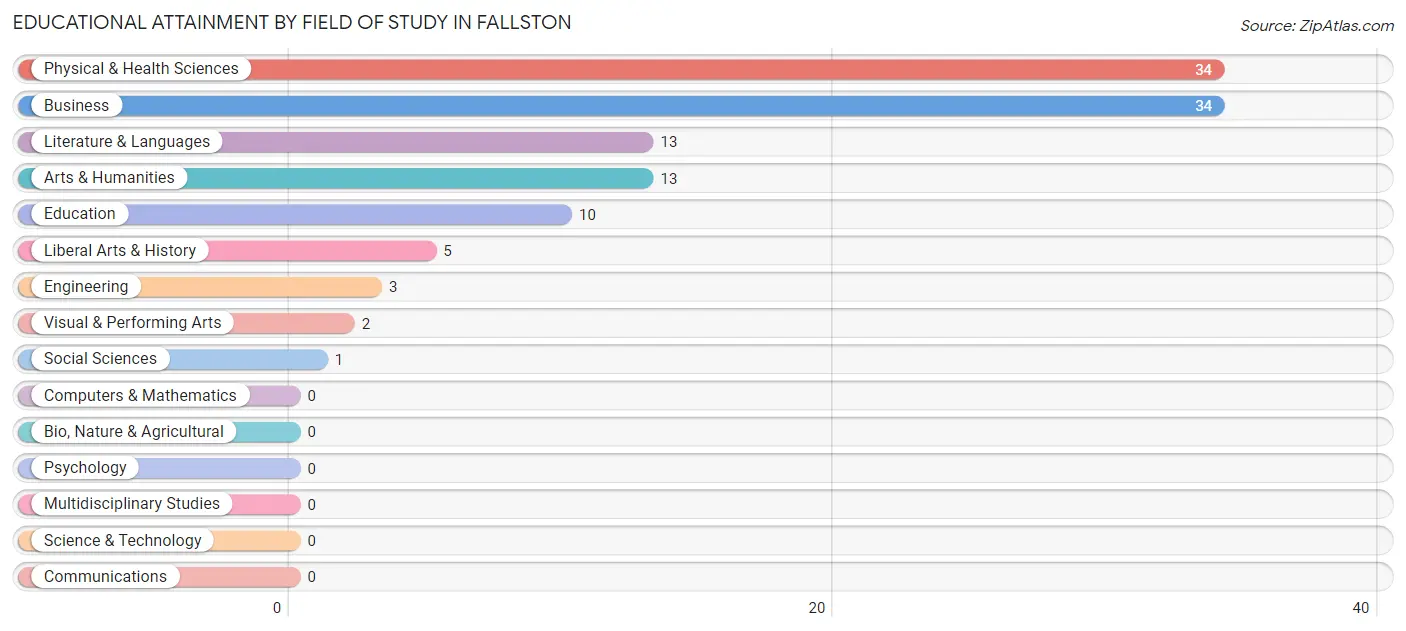
| Field of Study | # Graduates | % Graduates |
| Computers & Mathematics | 0 | 0.0% |
| Bio, Nature & Agricultural | 0 | 0.0% |
| Physical & Health Sciences | 34 | 29.6% |
| Psychology | 0 | 0.0% |
| Social Sciences | 1 | 0.9% |
| Engineering | 3 | 2.6% |
| Multidisciplinary Studies | 0 | 0.0% |
| Science & Technology | 0 | 0.0% |
| Business | 34 | 29.6% |
| Education | 10 | 8.7% |
| Literature & Languages | 13 | 11.3% |
| Liberal Arts & History | 5 | 4.3% |
| Visual & Performing Arts | 2 | 1.7% |
| Communications | 0 | 0.0% |
| Arts & Humanities | 13 | 11.3% |
| Total | 115 | 100.0% |
Transportation & Commute in Fallston
Vehicle Availability by Sex in Fallston
The most prevalent vehicle ownership categories in Fallston are males with 3 vehicles (61, accounting for 47.3%) and females with 3 vehicles (18, making up 53.5%).
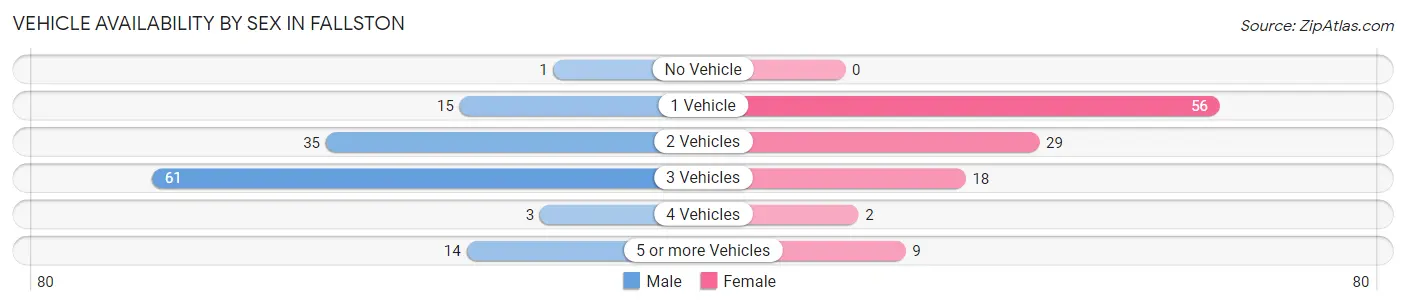
| Vehicles Available | Male | Female |
| No Vehicle | 1 (0.8%) | 0 (0.0%) |
| 1 Vehicle | 15 (11.6%) | 56 (49.1%) |
| 2 Vehicles | 35 (27.1%) | 29 (25.4%) |
| 3 Vehicles | 61 (47.3%) | 18 (15.8%) |
| 4 Vehicles | 3 (2.3%) | 2 (1.8%) |
| 5 or more Vehicles | 14 (10.8%) | 9 (7.9%) |
| Total | 129 (100.0%) | 114 (100.0%) |
Commute Time in Fallston
The most frequently occuring commute durations in Fallston are 30 to 34 minutes (74 commuters, 30.6%), 15 to 19 minutes (39 commuters, 16.1%), and 5 to 9 minutes (21 commuters, 8.7%).
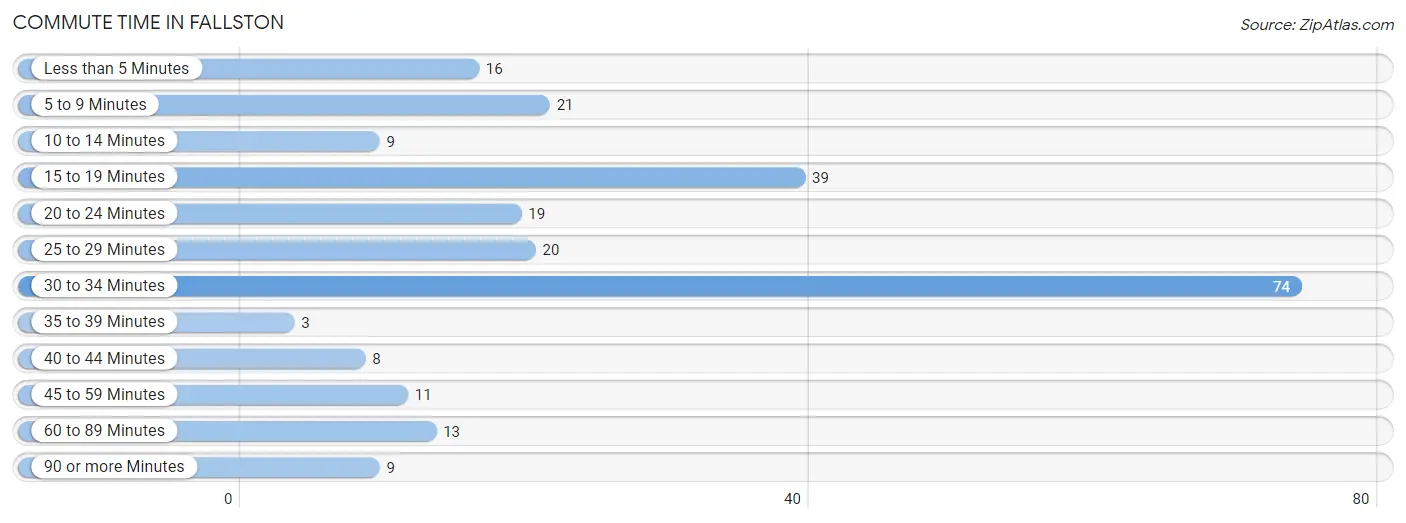
| Commute Time | # Commuters | % Commuters |
| Less than 5 Minutes | 16 | 6.6% |
| 5 to 9 Minutes | 21 | 8.7% |
| 10 to 14 Minutes | 9 | 3.7% |
| 15 to 19 Minutes | 39 | 16.1% |
| 20 to 24 Minutes | 19 | 7.9% |
| 25 to 29 Minutes | 20 | 8.3% |
| 30 to 34 Minutes | 74 | 30.6% |
| 35 to 39 Minutes | 3 | 1.2% |
| 40 to 44 Minutes | 8 | 3.3% |
| 45 to 59 Minutes | 11 | 4.5% |
| 60 to 89 Minutes | 13 | 5.4% |
| 90 or more Minutes | 9 | 3.7% |
Commute Time by Sex in Fallston
The most common commute times in Fallston are 30 to 34 minutes (51 commuters, 39.8%) for males and 30 to 34 minutes (23 commuters, 20.2%) for females.
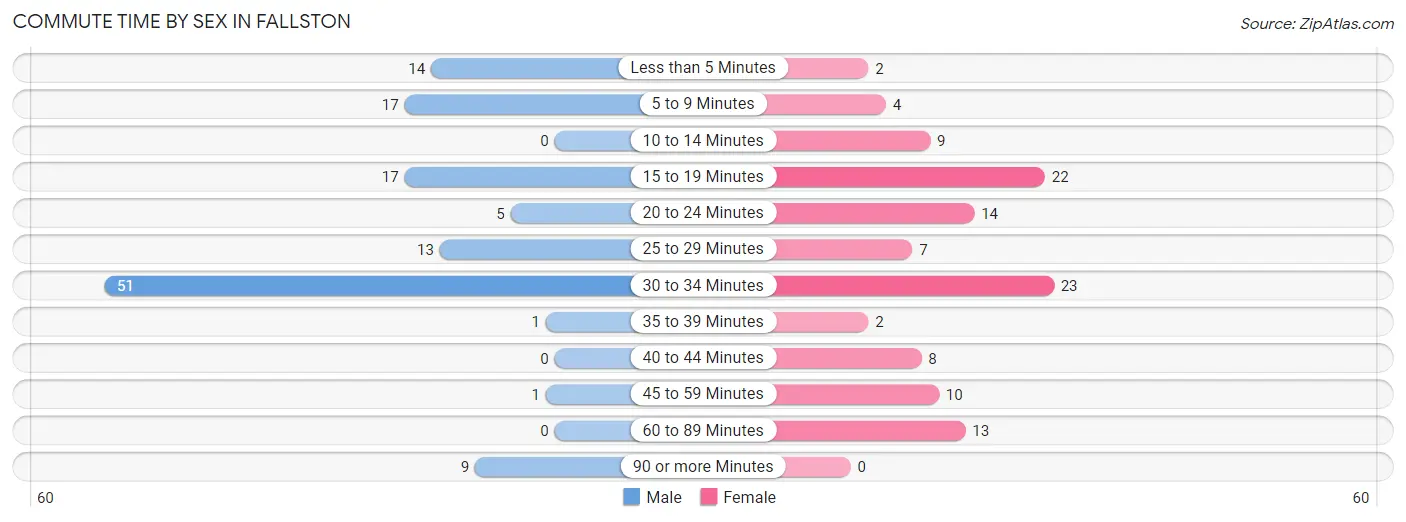
| Commute Time | Male | Female |
| Less than 5 Minutes | 14 (10.9%) | 2 (1.8%) |
| 5 to 9 Minutes | 17 (13.3%) | 4 (3.5%) |
| 10 to 14 Minutes | 0 (0.0%) | 9 (7.9%) |
| 15 to 19 Minutes | 17 (13.3%) | 22 (19.3%) |
| 20 to 24 Minutes | 5 (3.9%) | 14 (12.3%) |
| 25 to 29 Minutes | 13 (10.2%) | 7 (6.1%) |
| 30 to 34 Minutes | 51 (39.8%) | 23 (20.2%) |
| 35 to 39 Minutes | 1 (0.8%) | 2 (1.8%) |
| 40 to 44 Minutes | 0 (0.0%) | 8 (7.0%) |
| 45 to 59 Minutes | 1 (0.8%) | 10 (8.8%) |
| 60 to 89 Minutes | 0 (0.0%) | 13 (11.4%) |
| 90 or more Minutes | 9 (7.0%) | 0 (0.0%) |
Time of Departure to Work by Sex in Fallston
The most frequent times of departure to work in Fallston are 7:30 AM to 7:59 AM (49, 38.3%) for males and 7:30 AM to 7:59 AM (30, 26.3%) for females.
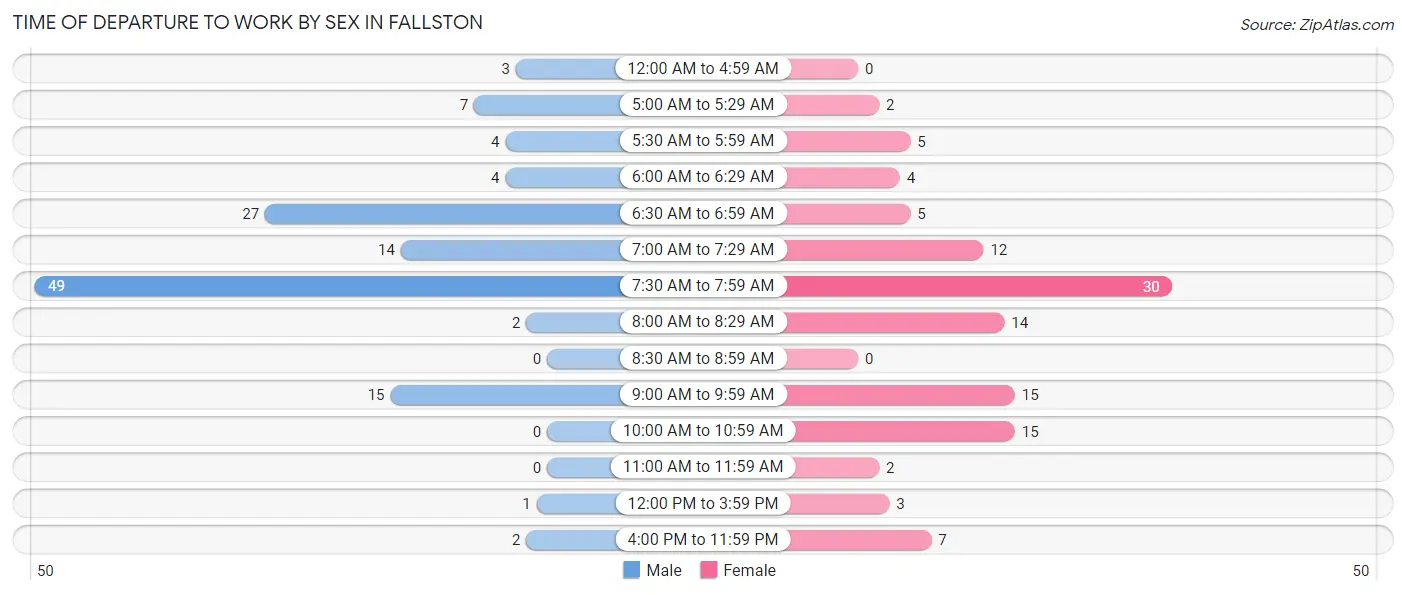
| Time of Departure | Male | Female |
| 12:00 AM to 4:59 AM | 3 (2.3%) | 0 (0.0%) |
| 5:00 AM to 5:29 AM | 7 (5.5%) | 2 (1.8%) |
| 5:30 AM to 5:59 AM | 4 (3.1%) | 5 (4.4%) |
| 6:00 AM to 6:29 AM | 4 (3.1%) | 4 (3.5%) |
| 6:30 AM to 6:59 AM | 27 (21.1%) | 5 (4.4%) |
| 7:00 AM to 7:29 AM | 14 (10.9%) | 12 (10.5%) |
| 7:30 AM to 7:59 AM | 49 (38.3%) | 30 (26.3%) |
| 8:00 AM to 8:29 AM | 2 (1.6%) | 14 (12.3%) |
| 8:30 AM to 8:59 AM | 0 (0.0%) | 0 (0.0%) |
| 9:00 AM to 9:59 AM | 15 (11.7%) | 15 (13.2%) |
| 10:00 AM to 10:59 AM | 0 (0.0%) | 15 (13.2%) |
| 11:00 AM to 11:59 AM | 0 (0.0%) | 2 (1.8%) |
| 12:00 PM to 3:59 PM | 1 (0.8%) | 3 (2.6%) |
| 4:00 PM to 11:59 PM | 2 (1.6%) | 7 (6.1%) |
| Total | 128 (100.0%) | 114 (100.0%) |
Housing Occupancy in Fallston
Occupancy by Ownership in Fallston
Of the total 280 dwellings in Fallston, owner-occupied units account for 190 (67.9%), while renter-occupied units make up 90 (32.1%).
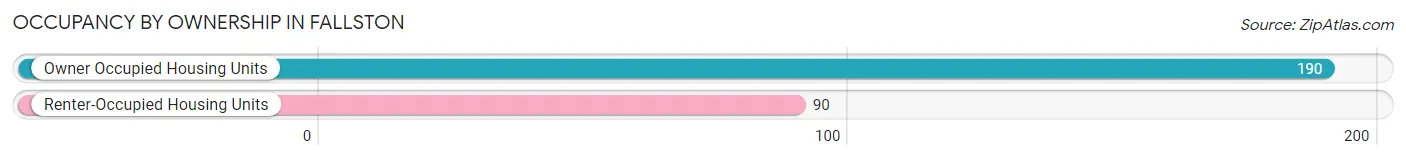
| Occupancy | # Housing Units | % Housing Units |
| Owner Occupied Housing Units | 190 | 67.9% |
| Renter-Occupied Housing Units | 90 | 32.1% |
| Total Occupied Housing Units | 280 | 100.0% |
Occupancy by Household Size in Fallston
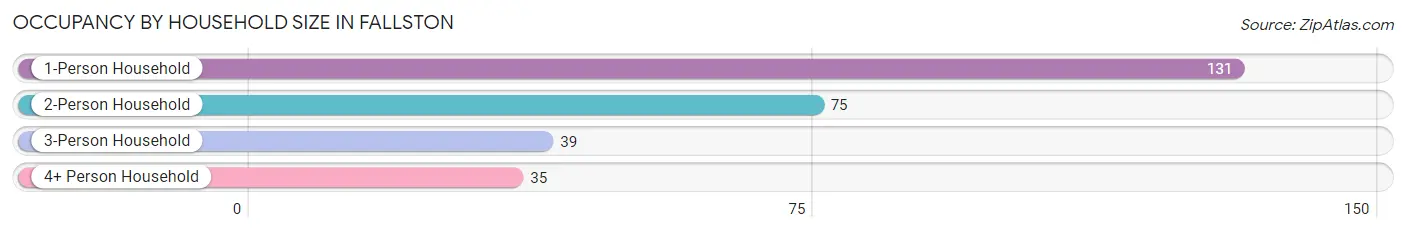
| Household Size | # Housing Units | % Housing Units |
| 1-Person Household | 131 | 46.8% |
| 2-Person Household | 75 | 26.8% |
| 3-Person Household | 39 | 13.9% |
| 4+ Person Household | 35 | 12.5% |
| Total Housing Units | 280 | 100.0% |
Occupancy by Ownership by Household Size in Fallston
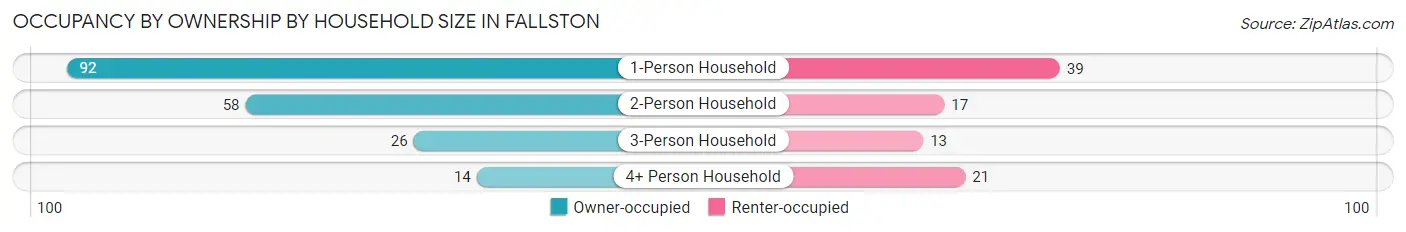
| Household Size | Owner-occupied | Renter-occupied |
| 1-Person Household | 92 (70.2%) | 39 (29.8%) |
| 2-Person Household | 58 (77.3%) | 17 (22.7%) |
| 3-Person Household | 26 (66.7%) | 13 (33.3%) |
| 4+ Person Household | 14 (40.0%) | 21 (60.0%) |
| Total Housing Units | 190 (67.9%) | 90 (32.1%) |
Occupancy by Educational Attainment in Fallston
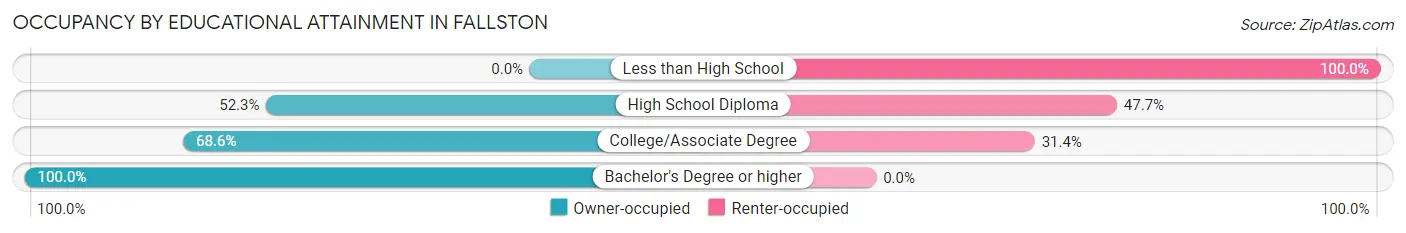
| Household Size | Owner-occupied | Renter-occupied |
| Less than High School | 0 (0.0%) | 15 (100.0%) |
| High School Diploma | 46 (52.3%) | 42 (47.7%) |
| College/Associate Degree | 72 (68.6%) | 33 (31.4%) |
| Bachelor's Degree or higher | 72 (100.0%) | 0 (0.0%) |
Occupancy by Age of Householder in Fallston
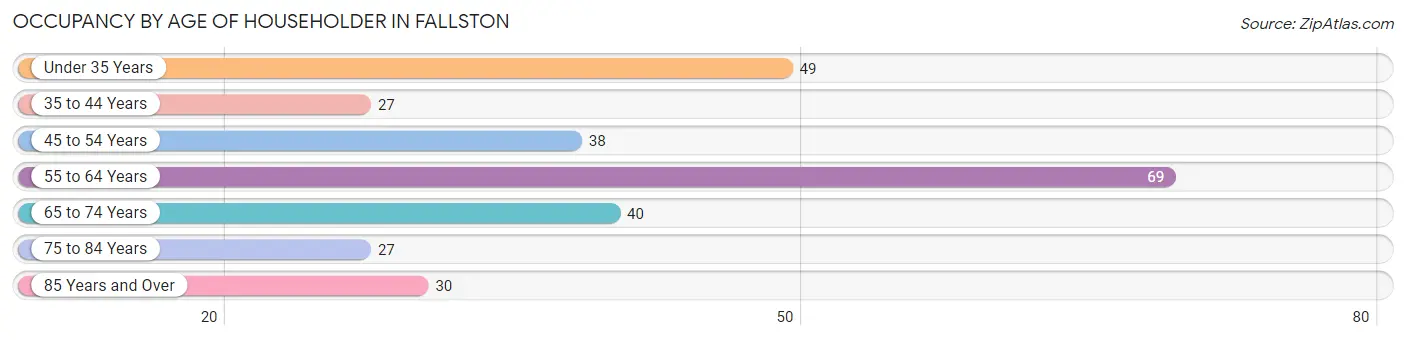
| Age Bracket | # Households | % Households |
| Under 35 Years | 49 | 17.5% |
| 35 to 44 Years | 27 | 9.6% |
| 45 to 54 Years | 38 | 13.6% |
| 55 to 64 Years | 69 | 24.6% |
| 65 to 74 Years | 40 | 14.3% |
| 75 to 84 Years | 27 | 9.6% |
| 85 Years and Over | 30 | 10.7% |
| Total | 280 | 100.0% |
Housing Finances in Fallston
Median Income by Occupancy in Fallston
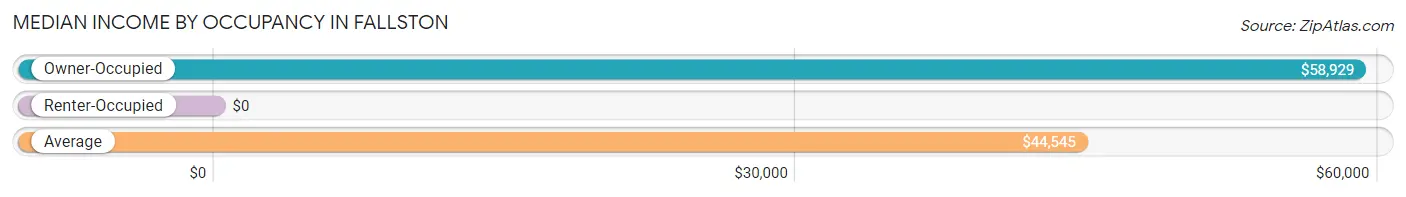
| Occupancy Type | # Households | Median Income |
| Owner-Occupied | 190 (67.9%) | $58,929 |
| Renter-Occupied | 90 (32.1%) | $0 |
| Average | 280 (100.0%) | $44,545 |
Occupancy by Householder Income Bracket in Fallston
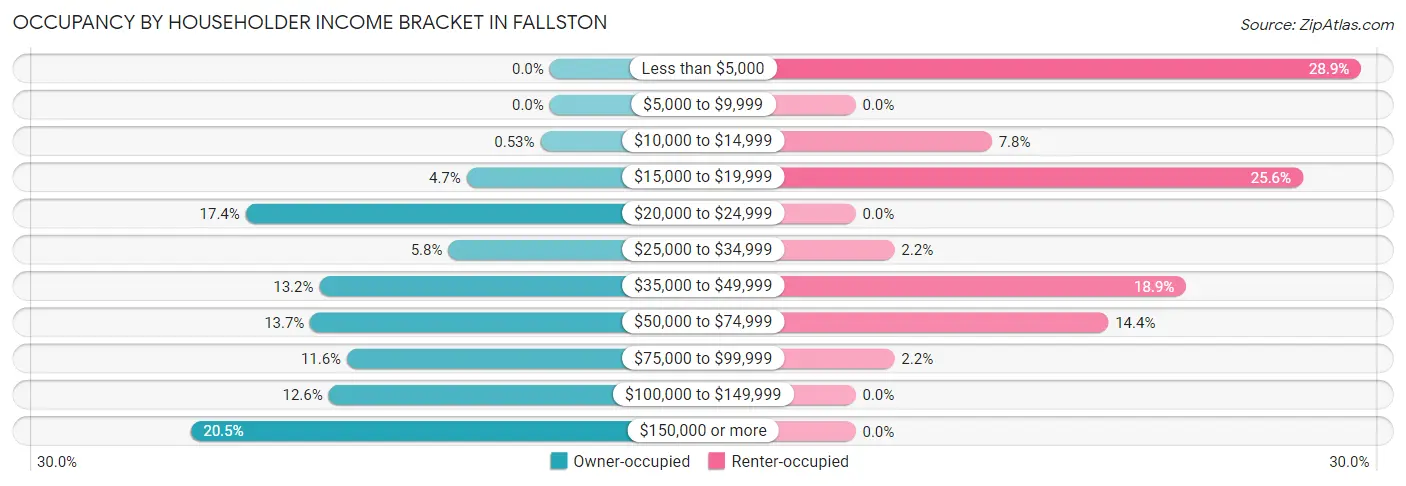
| Income Bracket | Owner-occupied | Renter-occupied |
| Less than $5,000 | 0 (0.0%) | 26 (28.9%) |
| $5,000 to $9,999 | 0 (0.0%) | 0 (0.0%) |
| $10,000 to $14,999 | 1 (0.5%) | 7 (7.8%) |
| $15,000 to $19,999 | 9 (4.7%) | 23 (25.6%) |
| $20,000 to $24,999 | 33 (17.4%) | 0 (0.0%) |
| $25,000 to $34,999 | 11 (5.8%) | 2 (2.2%) |
| $35,000 to $49,999 | 25 (13.2%) | 17 (18.9%) |
| $50,000 to $74,999 | 26 (13.7%) | 13 (14.4%) |
| $75,000 to $99,999 | 22 (11.6%) | 2 (2.2%) |
| $100,000 to $149,999 | 24 (12.6%) | 0 (0.0%) |
| $150,000 or more | 39 (20.5%) | 0 (0.0%) |
| Total | 190 (100.0%) | 90 (100.0%) |
Monthly Housing Cost Tiers in Fallston
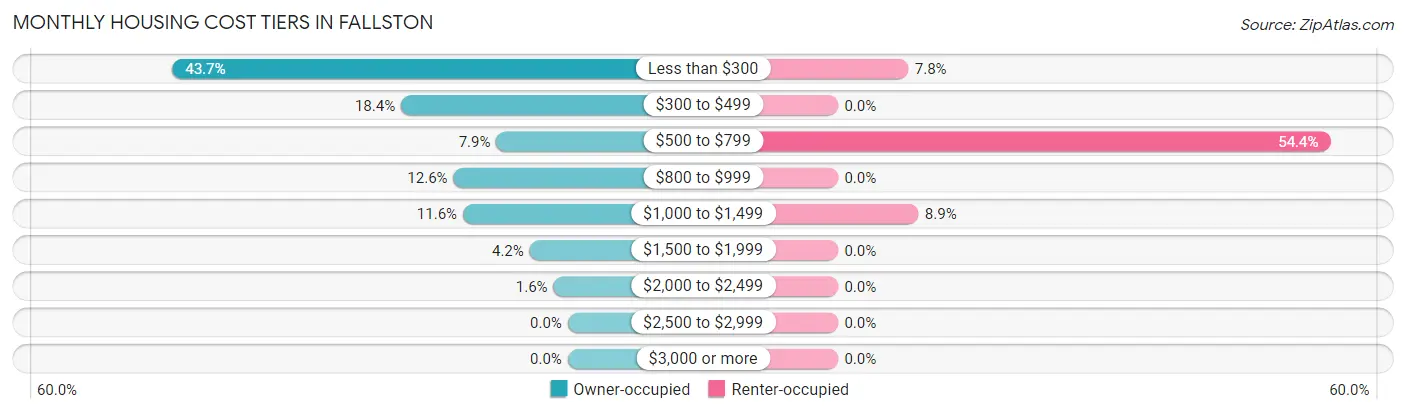
| Monthly Cost | Owner-occupied | Renter-occupied |
| Less than $300 | 83 (43.7%) | 7 (7.8%) |
| $300 to $499 | 35 (18.4%) | 0 (0.0%) |
| $500 to $799 | 15 (7.9%) | 49 (54.4%) |
| $800 to $999 | 24 (12.6%) | 0 (0.0%) |
| $1,000 to $1,499 | 22 (11.6%) | 8 (8.9%) |
| $1,500 to $1,999 | 8 (4.2%) | 0 (0.0%) |
| $2,000 to $2,499 | 3 (1.6%) | 0 (0.0%) |
| $2,500 to $2,999 | 0 (0.0%) | 0 (0.0%) |
| $3,000 or more | 0 (0.0%) | 0 (0.0%) |
| Total | 190 (100.0%) | 90 (100.0%) |
Physical Housing Characteristics in Fallston
Housing Structures in Fallston
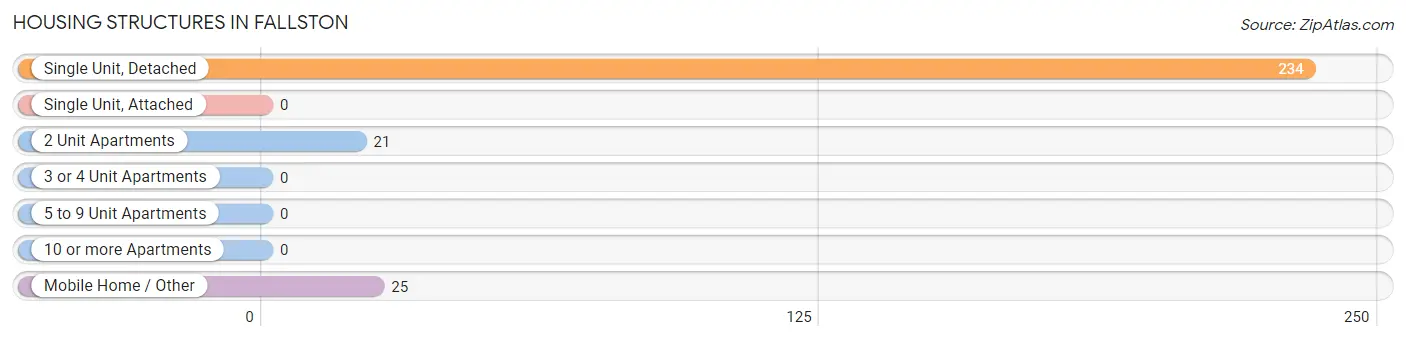
| Structure Type | # Housing Units | % Housing Units |
| Single Unit, Detached | 234 | 83.6% |
| Single Unit, Attached | 0 | 0.0% |
| 2 Unit Apartments | 21 | 7.5% |
| 3 or 4 Unit Apartments | 0 | 0.0% |
| 5 to 9 Unit Apartments | 0 | 0.0% |
| 10 or more Apartments | 0 | 0.0% |
| Mobile Home / Other | 25 | 8.9% |
| Total | 280 | 100.0% |
Housing Structures by Occupancy in Fallston
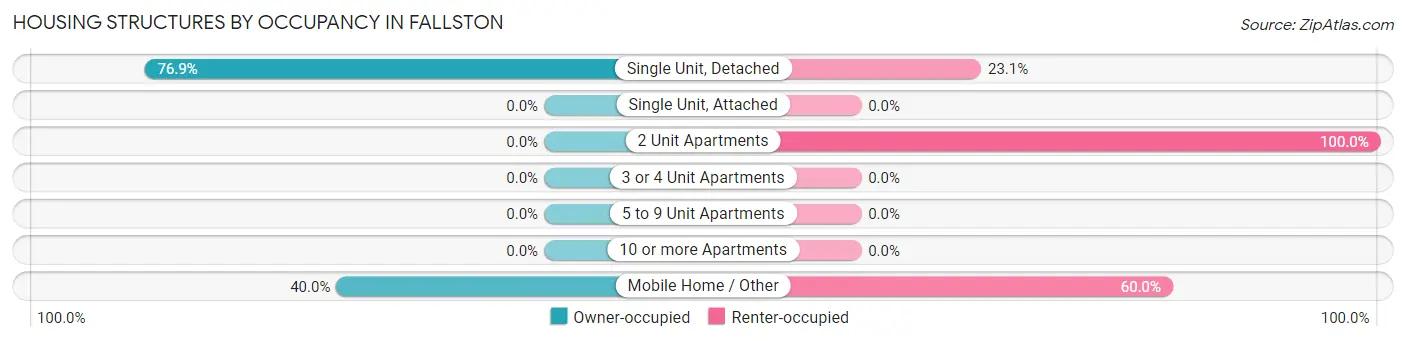
| Structure Type | Owner-occupied | Renter-occupied |
| Single Unit, Detached | 180 (76.9%) | 54 (23.1%) |
| Single Unit, Attached | 0 (0.0%) | 0 (0.0%) |
| 2 Unit Apartments | 0 (0.0%) | 21 (100.0%) |
| 3 or 4 Unit Apartments | 0 (0.0%) | 0 (0.0%) |
| 5 to 9 Unit Apartments | 0 (0.0%) | 0 (0.0%) |
| 10 or more Apartments | 0 (0.0%) | 0 (0.0%) |
| Mobile Home / Other | 10 (40.0%) | 15 (60.0%) |
| Total | 190 (67.9%) | 90 (32.1%) |
Housing Structures by Number of Rooms in Fallston
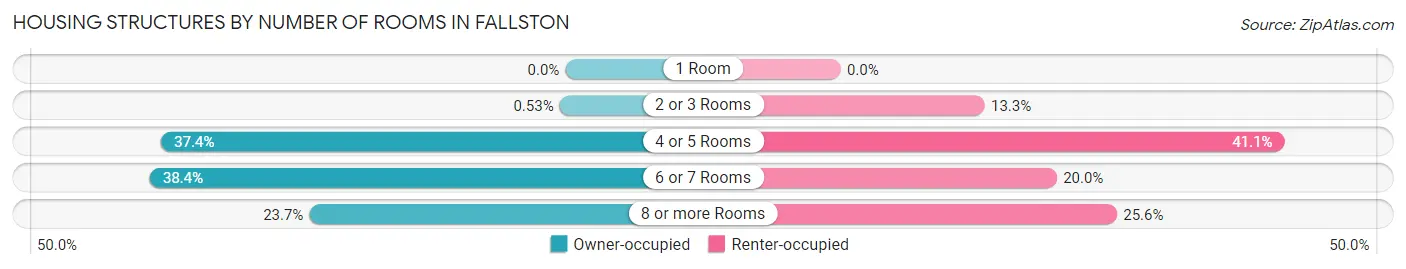
| Number of Rooms | Owner-occupied | Renter-occupied |
| 1 Room | 0 (0.0%) | 0 (0.0%) |
| 2 or 3 Rooms | 1 (0.5%) | 12 (13.3%) |
| 4 or 5 Rooms | 71 (37.4%) | 37 (41.1%) |
| 6 or 7 Rooms | 73 (38.4%) | 18 (20.0%) |
| 8 or more Rooms | 45 (23.7%) | 23 (25.6%) |
| Total | 190 (100.0%) | 90 (100.0%) |
Housing Structure by Heating Type in Fallston
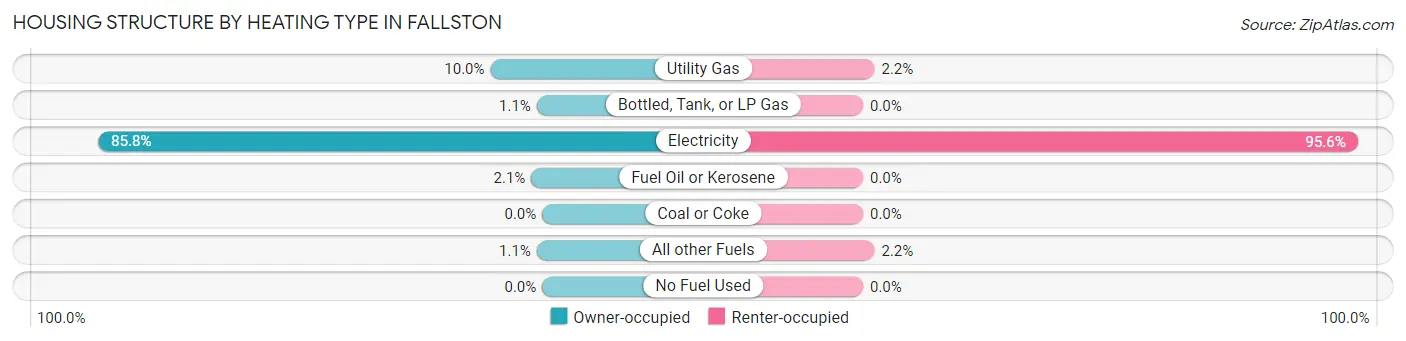
| Heating Type | Owner-occupied | Renter-occupied |
| Utility Gas | 19 (10.0%) | 2 (2.2%) |
| Bottled, Tank, or LP Gas | 2 (1.1%) | 0 (0.0%) |
| Electricity | 163 (85.8%) | 86 (95.6%) |
| Fuel Oil or Kerosene | 4 (2.1%) | 0 (0.0%) |
| Coal or Coke | 0 (0.0%) | 0 (0.0%) |
| All other Fuels | 2 (1.1%) | 2 (2.2%) |
| No Fuel Used | 0 (0.0%) | 0 (0.0%) |
| Total | 190 (100.0%) | 90 (100.0%) |
Household Vehicle Usage in Fallston
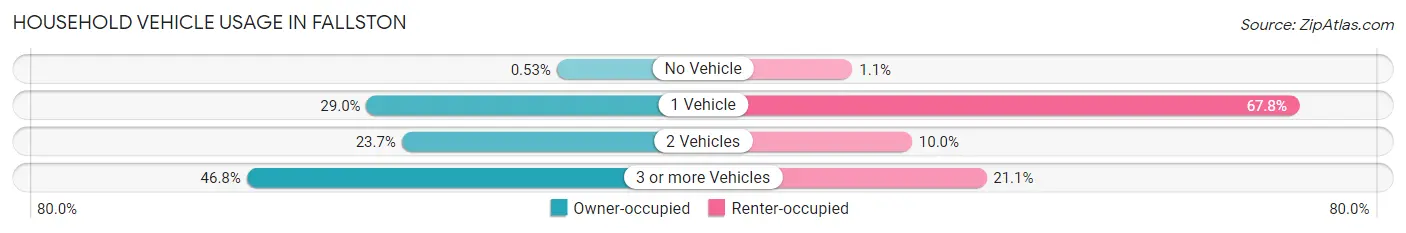
| Vehicles per Household | Owner-occupied | Renter-occupied |
| No Vehicle | 1 (0.5%) | 1 (1.1%) |
| 1 Vehicle | 55 (28.9%) | 61 (67.8%) |
| 2 Vehicles | 45 (23.7%) | 9 (10.0%) |
| 3 or more Vehicles | 89 (46.8%) | 19 (21.1%) |
| Total | 190 (100.0%) | 90 (100.0%) |
Real Estate & Mortgages in Fallston
Real Estate and Mortgage Overview in Fallston
| Characteristic | Without Mortgage | With Mortgage |
| Housing Units | 127 | 63 |
| Median Property Value | $78,800 | $154,400 |
| Median Household Income | - | - |
| Monthly Housing Costs | $246 | $0 |
| Real Estate Taxes | $647 | $0 |
Property Value by Mortgage Status in Fallston
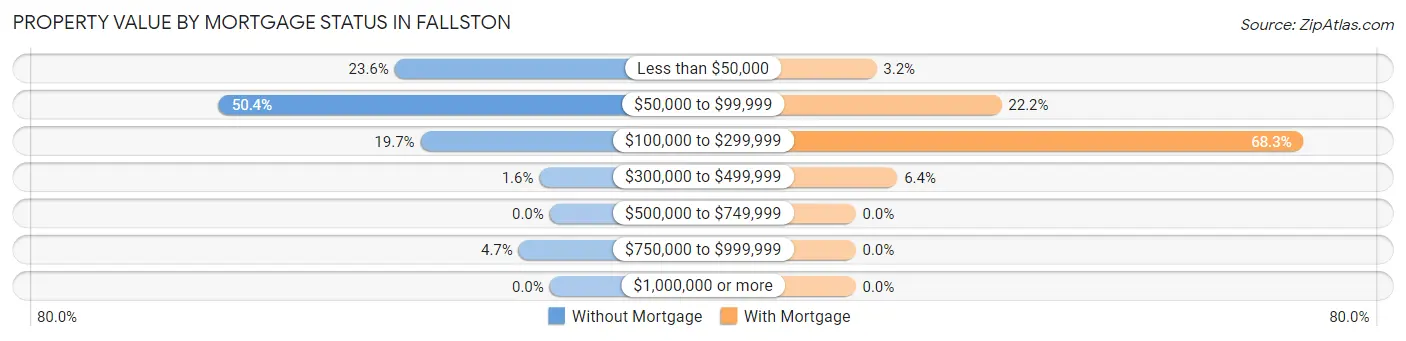
| Property Value | Without Mortgage | With Mortgage |
| Less than $50,000 | 30 (23.6%) | 2 (3.2%) |
| $50,000 to $99,999 | 64 (50.4%) | 14 (22.2%) |
| $100,000 to $299,999 | 25 (19.7%) | 43 (68.2%) |
| $300,000 to $499,999 | 2 (1.6%) | 4 (6.4%) |
| $500,000 to $749,999 | 0 (0.0%) | 0 (0.0%) |
| $750,000 to $999,999 | 6 (4.7%) | 0 (0.0%) |
| $1,000,000 or more | 0 (0.0%) | 0 (0.0%) |
| Total | 127 (100.0%) | 63 (100.0%) |
Household Income by Mortgage Status in Fallston
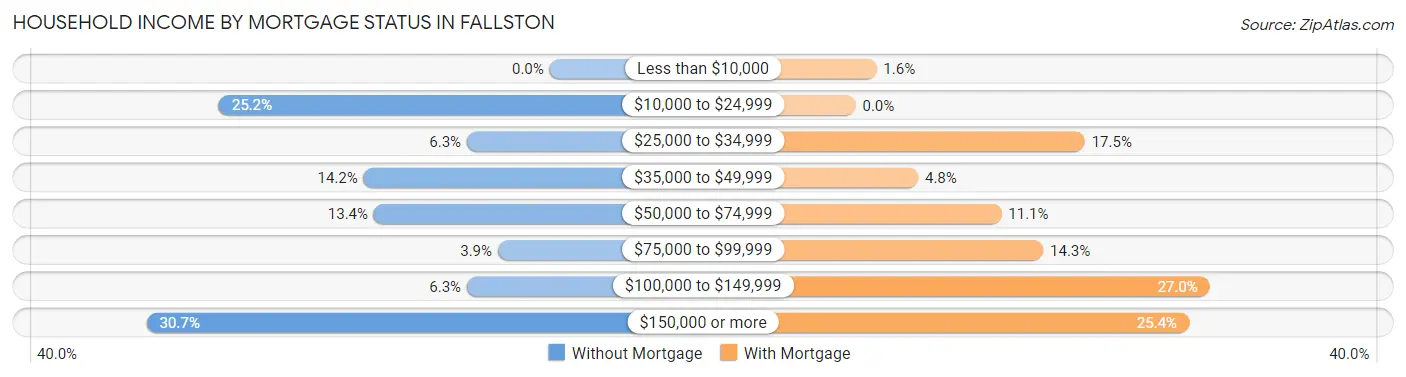
| Household Income | Without Mortgage | With Mortgage |
| Less than $10,000 | 0 (0.0%) | 1 (1.6%) |
| $10,000 to $24,999 | 32 (25.2%) | 0 (0.0%) |
| $25,000 to $34,999 | 8 (6.3%) | 11 (17.5%) |
| $35,000 to $49,999 | 18 (14.2%) | 3 (4.8%) |
| $50,000 to $74,999 | 17 (13.4%) | 7 (11.1%) |
| $75,000 to $99,999 | 5 (3.9%) | 9 (14.3%) |
| $100,000 to $149,999 | 8 (6.3%) | 17 (27.0%) |
| $150,000 or more | 39 (30.7%) | 16 (25.4%) |
| Total | 127 (100.0%) | 63 (100.0%) |
Property Value to Household Income Ratio in Fallston
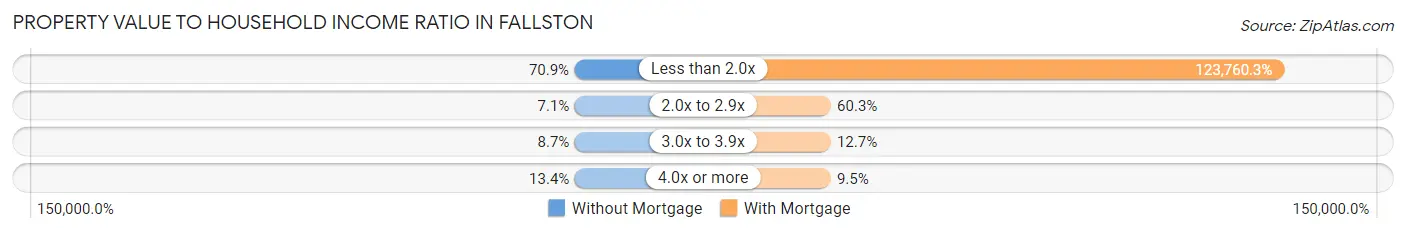
| Value-to-Income Ratio | Without Mortgage | With Mortgage |
| Less than 2.0x | 90 (70.9%) | 77,969 (123,760.3%) |
| 2.0x to 2.9x | 9 (7.1%) | 38 (60.3%) |
| 3.0x to 3.9x | 11 (8.7%) | 8 (12.7%) |
| 4.0x or more | 17 (13.4%) | 6 (9.5%) |
| Total | 127 (100.0%) | 63 (100.0%) |
Real Estate Taxes by Mortgage Status in Fallston
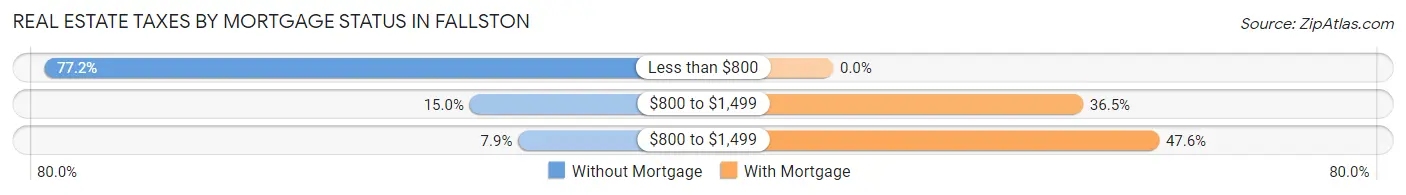
| Property Taxes | Without Mortgage | With Mortgage |
| Less than $800 | 98 (77.2%) | 0 (0.0%) |
| $800 to $1,499 | 19 (15.0%) | 23 (36.5%) |
| $800 to $1,499 | 10 (7.9%) | 30 (47.6%) |
| Total | 127 (100.0%) | 63 (100.0%) |
Health & Disability in Fallston
Health Insurance Coverage by Age in Fallston
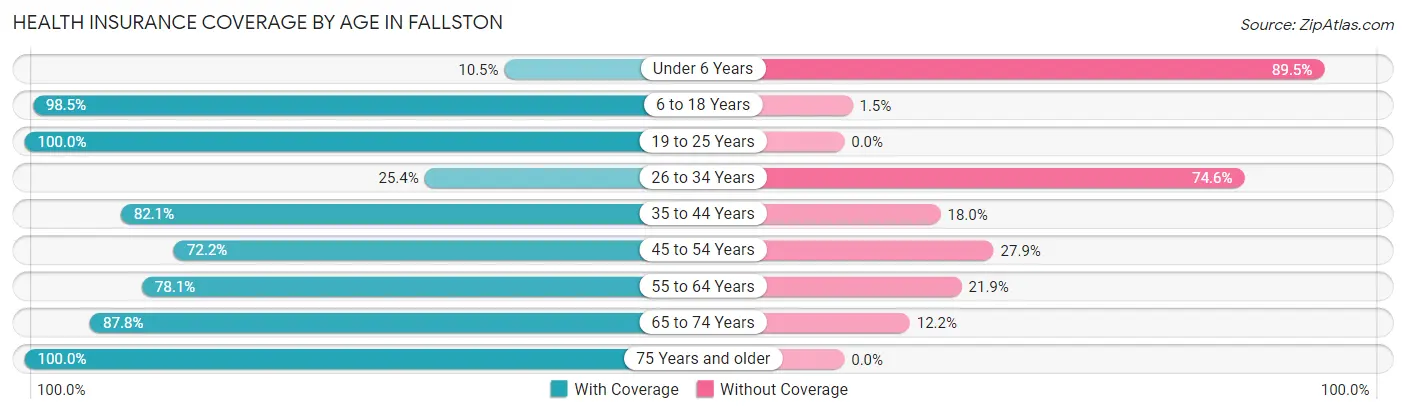
| Age Bracket | With Coverage | Without Coverage |
| Under 6 Years | 10 (10.5%) | 85 (89.5%) |
| 6 to 18 Years | 64 (98.5%) | 1 (1.5%) |
| 19 to 25 Years | 18 (100.0%) | 0 (0.0%) |
| 26 to 34 Years | 30 (25.4%) | 88 (74.6%) |
| 35 to 44 Years | 32 (82.1%) | 7 (17.9%) |
| 45 to 54 Years | 57 (72.2%) | 22 (27.9%) |
| 55 to 64 Years | 75 (78.1%) | 21 (21.9%) |
| 65 to 74 Years | 79 (87.8%) | 11 (12.2%) |
| 75 Years and older | 70 (100.0%) | 0 (0.0%) |
| Total | 435 (64.9%) | 235 (35.1%) |
Health Insurance Coverage by Citizenship Status in Fallston
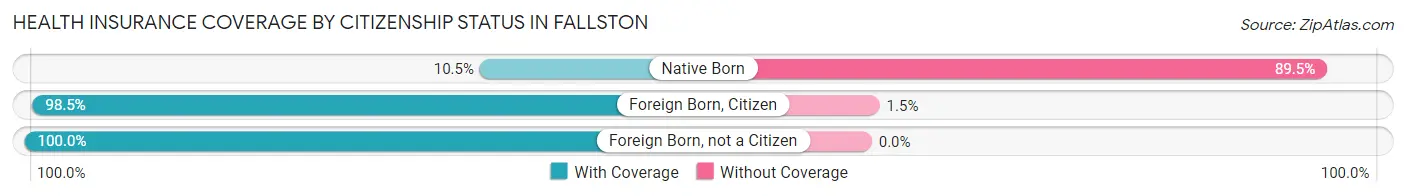
| Citizenship Status | With Coverage | Without Coverage |
| Native Born | 10 (10.5%) | 85 (89.5%) |
| Foreign Born, Citizen | 64 (98.5%) | 1 (1.5%) |
| Foreign Born, not a Citizen | 18 (100.0%) | 0 (0.0%) |
Health Insurance Coverage by Household Income in Fallston
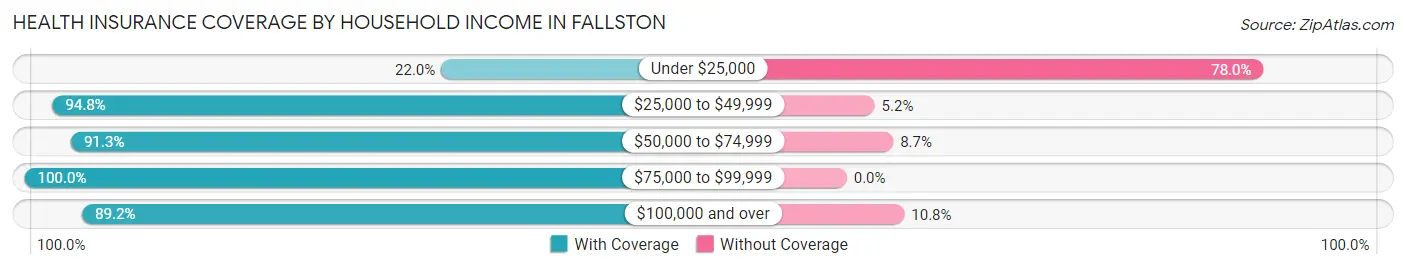
| Household Income | With Coverage | Without Coverage |
| Under $25,000 | 58 (22.0%) | 206 (78.0%) |
| $25,000 to $49,999 | 109 (94.8%) | 6 (5.2%) |
| $50,000 to $74,999 | 84 (91.3%) | 8 (8.7%) |
| $75,000 to $99,999 | 60 (100.0%) | 0 (0.0%) |
| $100,000 and over | 124 (89.2%) | 15 (10.8%) |
Public vs Private Health Insurance Coverage by Age in Fallston
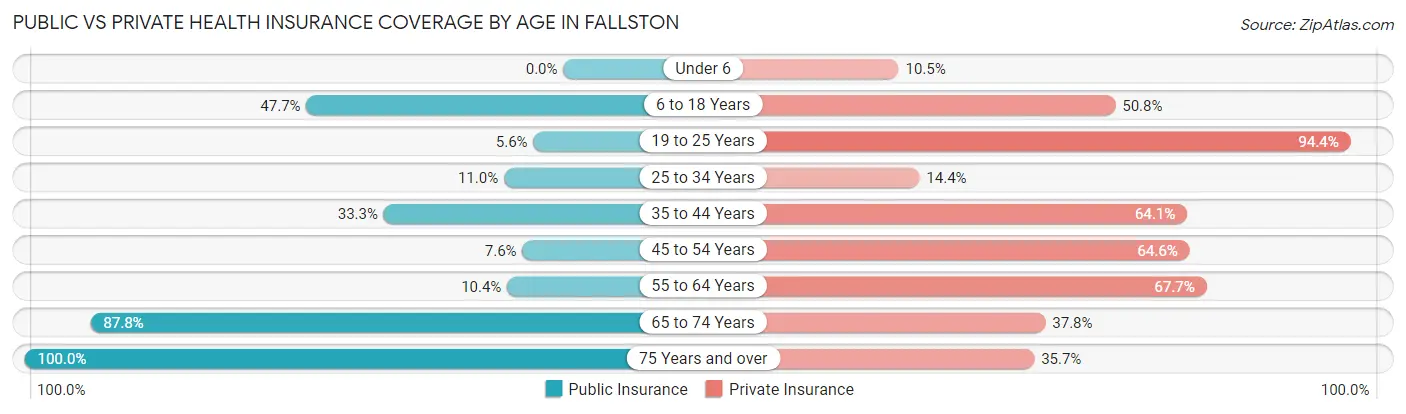
| Age Bracket | Public Insurance | Private Insurance |
| Under 6 | 0 (0.0%) | 10 (10.5%) |
| 6 to 18 Years | 31 (47.7%) | 33 (50.8%) |
| 19 to 25 Years | 1 (5.6%) | 17 (94.4%) |
| 25 to 34 Years | 13 (11.0%) | 17 (14.4%) |
| 35 to 44 Years | 13 (33.3%) | 25 (64.1%) |
| 45 to 54 Years | 6 (7.6%) | 51 (64.6%) |
| 55 to 64 Years | 10 (10.4%) | 65 (67.7%) |
| 65 to 74 Years | 79 (87.8%) | 34 (37.8%) |
| 75 Years and over | 70 (100.0%) | 25 (35.7%) |
| Total | 223 (33.3%) | 277 (41.3%) |
Disability Status by Sex by Age in Fallston
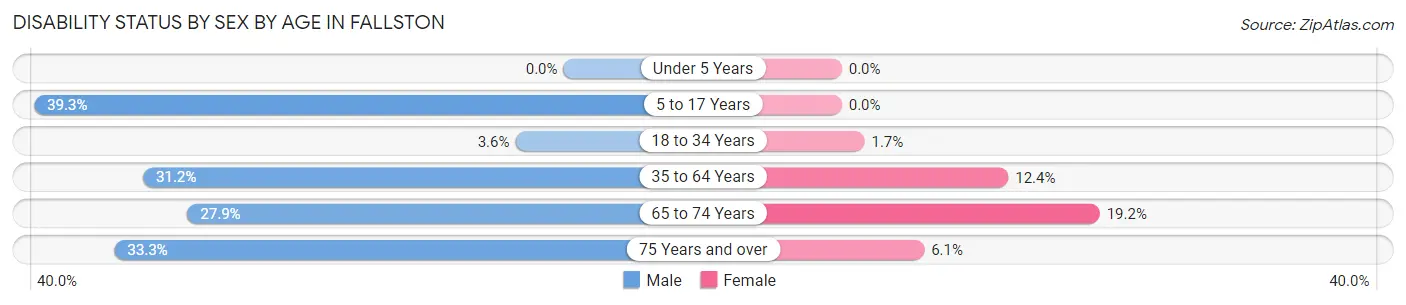
| Age Bracket | Male | Female |
| Under 5 Years | 0 (0.0%) | 0 (0.0%) |
| 5 to 17 Years | 11 (39.3%) | 0 (0.0%) |
| 18 to 34 Years | 3 (3.6%) | 1 (1.7%) |
| 35 to 64 Years | 39 (31.2%) | 11 (12.4%) |
| 65 to 74 Years | 12 (27.9%) | 9 (19.2%) |
| 75 Years and over | 7 (33.3%) | 3 (6.1%) |
Disability Class by Sex by Age in Fallston
Disability Class: Hearing Difficulty
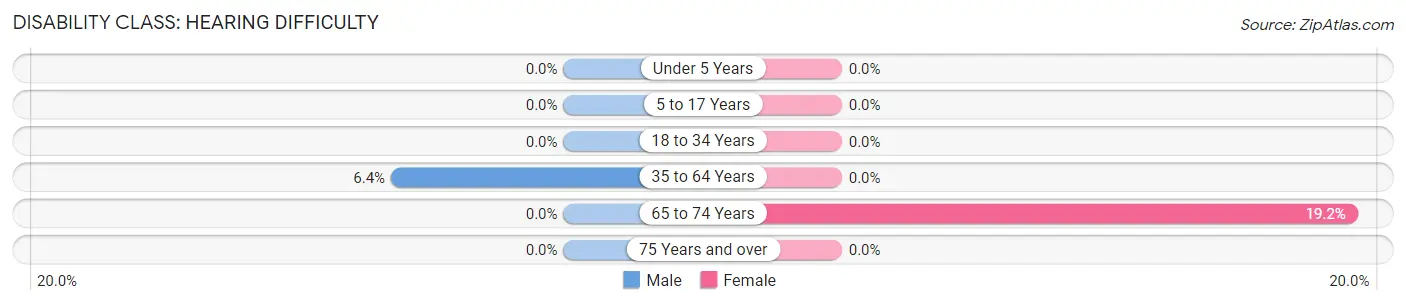
| Age Bracket | Male | Female |
| Under 5 Years | 0 (0.0%) | 0 (0.0%) |
| 5 to 17 Years | 0 (0.0%) | 0 (0.0%) |
| 18 to 34 Years | 0 (0.0%) | 0 (0.0%) |
| 35 to 64 Years | 8 (6.4%) | 0 (0.0%) |
| 65 to 74 Years | 0 (0.0%) | 9 (19.2%) |
| 75 Years and over | 0 (0.0%) | 0 (0.0%) |
Disability Class: Vision Difficulty
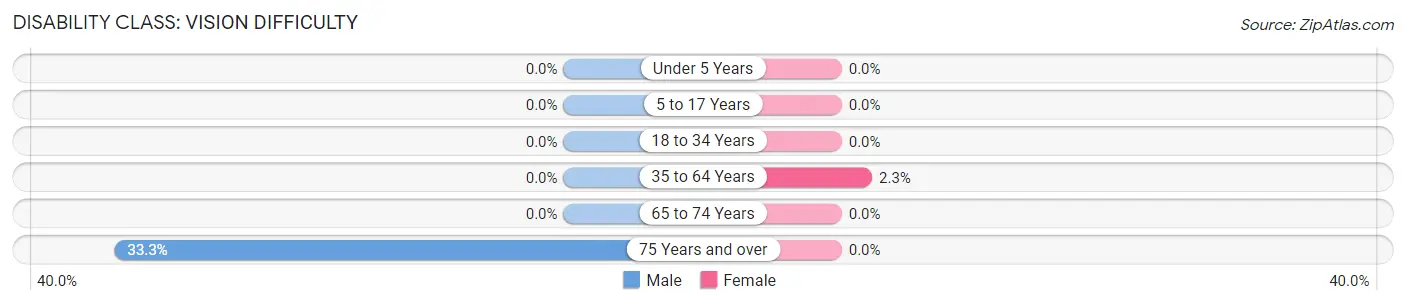
| Age Bracket | Male | Female |
| Under 5 Years | 0 (0.0%) | 0 (0.0%) |
| 5 to 17 Years | 0 (0.0%) | 0 (0.0%) |
| 18 to 34 Years | 0 (0.0%) | 0 (0.0%) |
| 35 to 64 Years | 0 (0.0%) | 2 (2.2%) |
| 65 to 74 Years | 0 (0.0%) | 0 (0.0%) |
| 75 Years and over | 7 (33.3%) | 0 (0.0%) |
Disability Class: Cognitive Difficulty
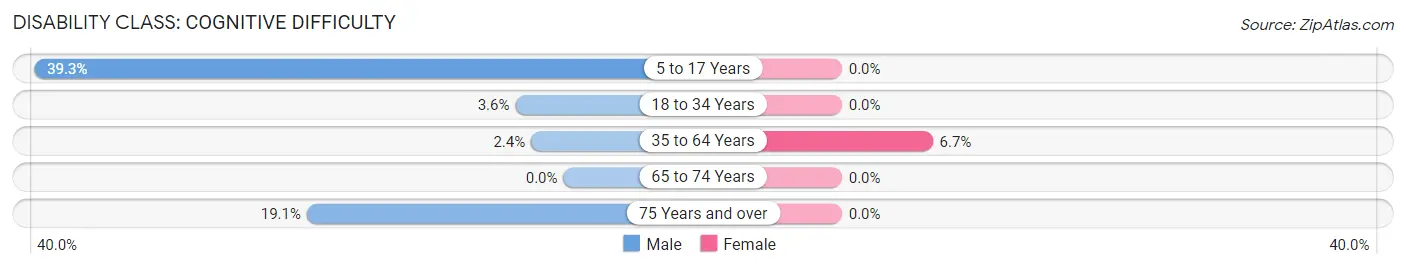
| Age Bracket | Male | Female |
| 5 to 17 Years | 11 (39.3%) | 0 (0.0%) |
| 18 to 34 Years | 3 (3.6%) | 0 (0.0%) |
| 35 to 64 Years | 3 (2.4%) | 6 (6.7%) |
| 65 to 74 Years | 0 (0.0%) | 0 (0.0%) |
| 75 Years and over | 4 (19.1%) | 0 (0.0%) |
Disability Class: Ambulatory Difficulty
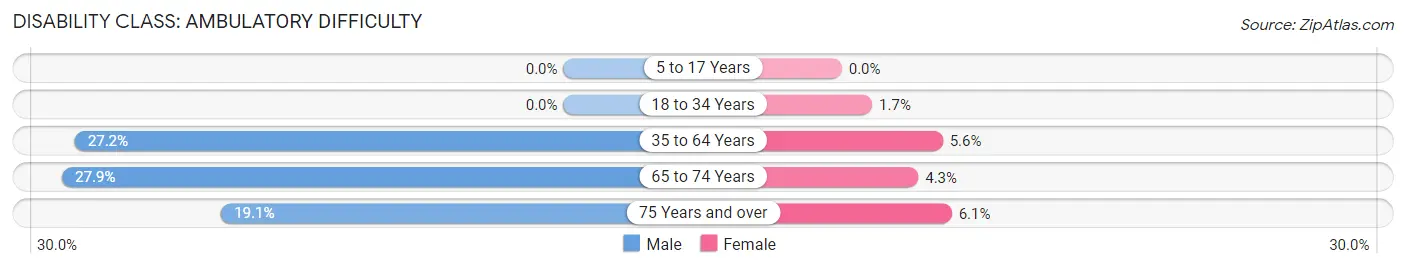
| Age Bracket | Male | Female |
| 5 to 17 Years | 0 (0.0%) | 0 (0.0%) |
| 18 to 34 Years | 0 (0.0%) | 1 (1.7%) |
| 35 to 64 Years | 34 (27.2%) | 5 (5.6%) |
| 65 to 74 Years | 12 (27.9%) | 2 (4.3%) |
| 75 Years and over | 4 (19.1%) | 3 (6.1%) |
Disability Class: Self-Care Difficulty
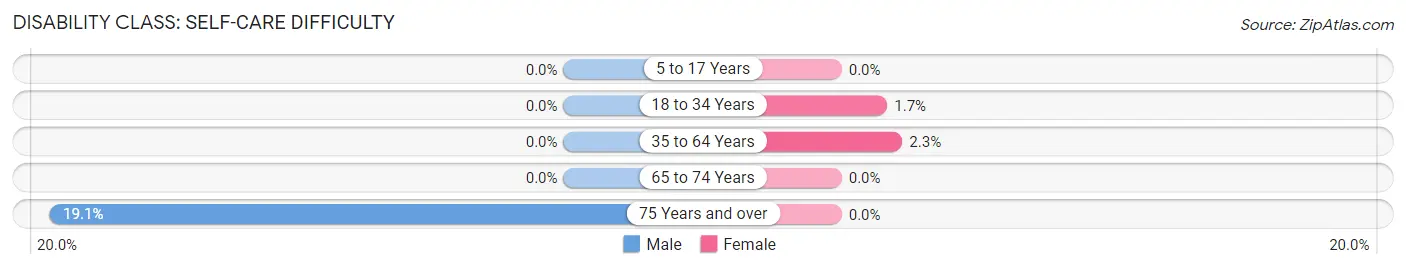
| Age Bracket | Male | Female |
| 5 to 17 Years | 0 (0.0%) | 0 (0.0%) |
| 18 to 34 Years | 0 (0.0%) | 1 (1.7%) |
| 35 to 64 Years | 0 (0.0%) | 2 (2.2%) |
| 65 to 74 Years | 0 (0.0%) | 0 (0.0%) |
| 75 Years and over | 4 (19.1%) | 0 (0.0%) |
Technology Access in Fallston
Computing Device Access in Fallston
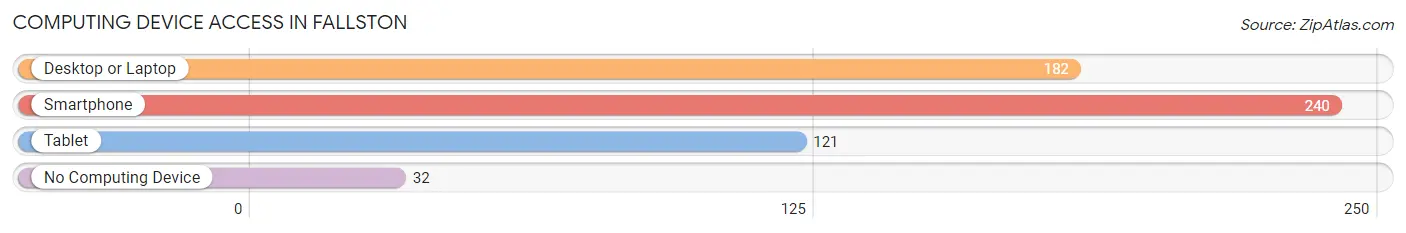
| Device Type | # Households | % Households |
| Desktop or Laptop | 182 | 65.0% |
| Smartphone | 240 | 85.7% |
| Tablet | 121 | 43.2% |
| No Computing Device | 32 | 11.4% |
| Total | 280 | 100.0% |
Internet Access in Fallston
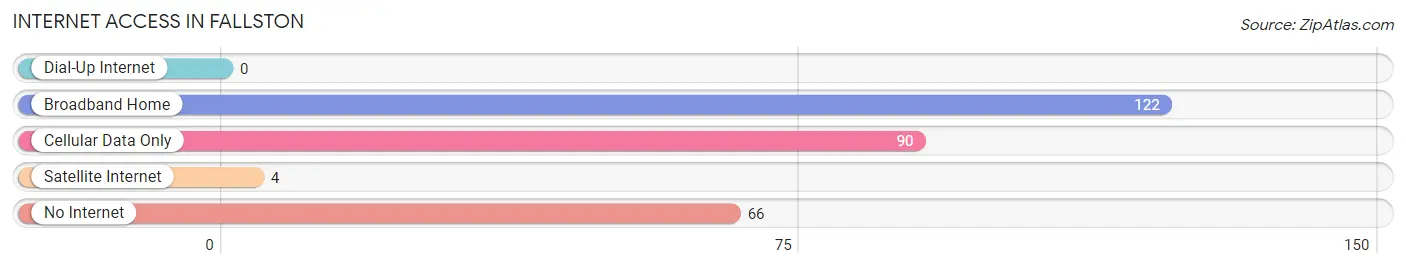
| Internet Type | # Households | % Households |
| Dial-Up Internet | 0 | 0.0% |
| Broadband Home | 122 | 43.6% |
| Cellular Data Only | 90 | 32.1% |
| Satellite Internet | 4 | 1.4% |
| No Internet | 66 | 23.6% |
| Total | 280 | 100.0% |
Fallston Summary
Fallston, North Carolina is a small town located in Cleveland County, in the foothills of the Blue Ridge Mountains. The town is situated along the banks of the Broad River, and is home to a population of approximately 1,000 people.
History
The area that is now Fallston was first settled in the late 1700s by a group of settlers from the nearby town of Shelby. The settlers named the area “Fallston” after the nearby waterfall. The town was officially incorporated in 1891, and the first post office was established in 1892.
In the early 1900s, Fallston was a thriving agricultural community, with cotton, tobacco, and corn being the main crops. The town also had a number of small businesses, including a general store, a blacksmith shop, and a grist mill.
In the 1950s, Fallston began to experience a decline in population as many of the town’s residents moved away in search of better job opportunities. The town’s population continued to decline until the late 1990s, when it began to slowly increase again.
Geography
Fallston is located in the foothills of the Blue Ridge Mountains, and is situated along the banks of the Broad River. The town is located approximately 25 miles west of Charlotte, and is bordered by the towns of Shelby, Kings Mountain, and Boiling Springs.
The town has a total area of 1.2 square miles, all of which is land. The terrain is mostly flat, with some rolling hills. The climate is mild, with temperatures ranging from the mid-50s in the winter to the mid-80s in the summer.
Economy
The economy of Fallston is largely based on agriculture, with cotton, tobacco, and corn being the main crops. The town also has a number of small businesses, including a general store, a blacksmith shop, and a grist mill.
In recent years, Fallston has seen an increase in tourism, with many visitors coming to the area to enjoy the natural beauty of the Blue Ridge Mountains. The town also has a number of antique shops, art galleries, and restaurants.
Demographics
As of the 2010 census, Fallston had a population of 1,000 people. The racial makeup of the town was 95.2% White, 2.2% African American, 0.7% Native American, 0.3% Asian, and 1.6% from other races.
The median household income in Fallston was $35,000, and the median family income was $41,000. The per capita income was $17,000. Approximately 10.3% of the population was below the poverty line.
Fallston is served by the Cleveland County School District, which includes two elementary schools, one middle school, and one high school. The town also has a number of churches, including Baptist, Methodist, and Presbyterian.
Conclusion
Fallston, North Carolina is a small town located in Cleveland County, in the foothills of the Blue Ridge Mountains. The town is situated along the banks of the Broad River, and is home to a population of approximately 1,000 people. The economy of Fallston is largely based on agriculture, with cotton, tobacco, and corn being the main crops. The town also has a number of small businesses, including a general store, a blacksmith shop, and a grist mill. In recent years, Fallston has seen an increase in tourism, with many visitors coming to the area to enjoy the natural beauty of the Blue Ridge Mountains. The town also has a number of antique shops, art galleries, and restaurants.
Common Questions
What is Per Capita Income in Fallston?
Per Capita income in Fallston is $37,306.
What is the Median Family Income in Fallston?
Median Family Income in Fallston is $49,250.
What is the Median Household income in Fallston?
Median Household Income in Fallston is $44,545.
What is Inequality or Gini Index in Fallston?
Inequality or Gini Index in Fallston is 0.58.
What is the Total Population of Fallston?
Total Population of Fallston is 670.
What is the Total Male Population of Fallston?
Total Male Population of Fallston is 306.
What is the Total Female Population of Fallston?
Total Female Population of Fallston is 364.
What is the Ratio of Males per 100 Females in Fallston?
There are 84.07 Males per 100 Females in Fallston.
What is the Ratio of Females per 100 Males in Fallston?
There are 118.95 Females per 100 Males in Fallston.
What is the Median Population Age in Fallston?
Median Population Age in Fallston is 45.0 Years.
What is the Average Family Size in Fallston
Average Family Size in Fallston is 3.7 People.
What is the Average Household Size in Fallston
Average Household Size in Fallston is 2.4 People.
How Large is the Labor Force in Fallston?
There are 248 People in the Labor Forcein in Fallston.
What is the Percentage of People in the Labor Force in Fallston?
47.8% of People are in the Labor Force in Fallston.
What is the Unemployment Rate in Fallston?
Unemployment Rate in Fallston is 2.0%.