Marble, NC Map & Demographics
Marble Map
Marble Overview
$14,348
PER CAPITA INCOME
$46,641
AVG FAMILY INCOME
$44,145
AVG HOUSEHOLD INCOME
0.30
INEQUALITY / GINI INDEX
282
TOTAL POPULATION
90
MALE POPULATION
192
FEMALE POPULATION
46.88
MALES / 100 FEMALES
213.33
FEMALES / 100 MALES
25.7
MEDIAN AGE
4.2
AVG FAMILY SIZE
3.0
AVG HOUSEHOLD SIZE
125
LABOR FORCE [ PEOPLE ]
65.4%
PERCENT IN LABOR FORCE
47.2%
UNEMPLOYMENT RATE
Marble Zip Codes
Marble Area Codes
Income in Marble
Income Overview in Marble
Per Capita Income in Marble is $14,348, while median incomes of families and households are $46,641 and $44,145 respectively.
| Characteristic | Number | Measure |
| Per Capita Income | 282 | $14,348 |
| Median Family Income | 59 | $46,641 |
| Mean Family Income | 59 | $53,297 |
| Median Household Income | 93 | $44,145 |
| Mean Household Income | 93 | $39,330 |
| Income Deficit | 59 | $0 |
| Wage / Income Gap (%) | 282 | 0.00% |
| Wage / Income Gap ($) | 282 | 100.00¢ per $1 |
| Gini / Inequality Index | 282 | 0.30 |
Earnings by Sex in Marble
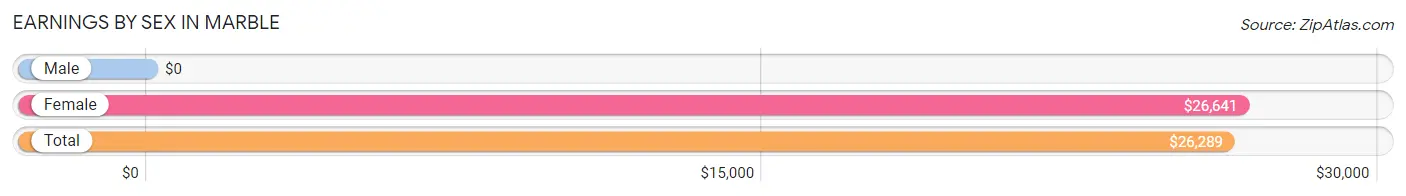
| Sex | Number | Average Earnings |
| Male | 45 (36.0%) | $0 |
| Female | 80 (64.0%) | $26,641 |
| Total | 125 (100.0%) | $26,289 |
Earnings by Sex by Income Bracket in Marble
The most common earnings brackets in Marble are $7,500 to $9,999 for men (27 | 60.0%) and $25,000 to $29,999 for women (36 | 45.0%).
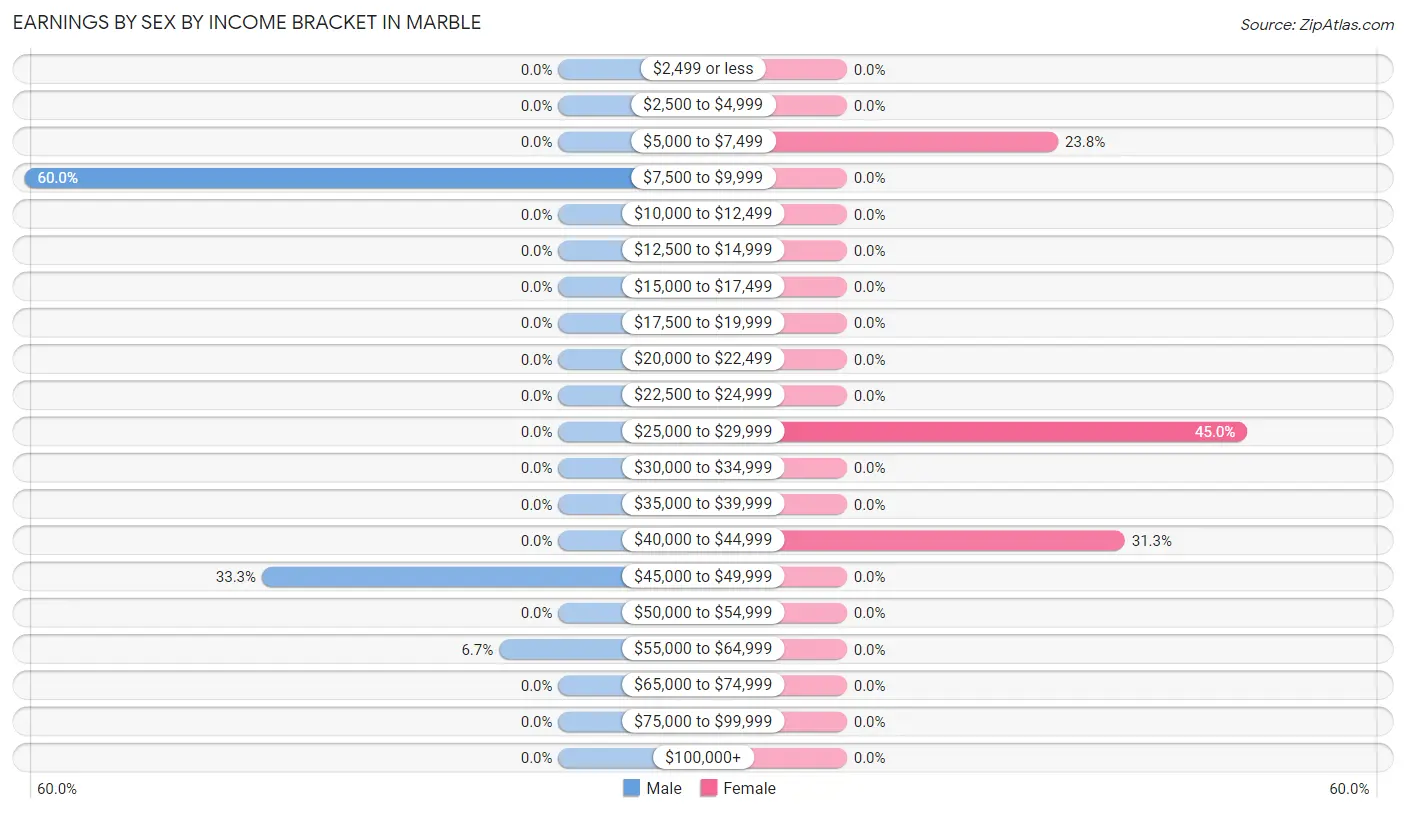
| Income | Male | Female |
| $2,499 or less | 0 (0.0%) | 0 (0.0%) |
| $2,500 to $4,999 | 0 (0.0%) | 0 (0.0%) |
| $5,000 to $7,499 | 0 (0.0%) | 19 (23.7%) |
| $7,500 to $9,999 | 27 (60.0%) | 0 (0.0%) |
| $10,000 to $12,499 | 0 (0.0%) | 0 (0.0%) |
| $12,500 to $14,999 | 0 (0.0%) | 0 (0.0%) |
| $15,000 to $17,499 | 0 (0.0%) | 0 (0.0%) |
| $17,500 to $19,999 | 0 (0.0%) | 0 (0.0%) |
| $20,000 to $22,499 | 0 (0.0%) | 0 (0.0%) |
| $22,500 to $24,999 | 0 (0.0%) | 0 (0.0%) |
| $25,000 to $29,999 | 0 (0.0%) | 36 (45.0%) |
| $30,000 to $34,999 | 0 (0.0%) | 0 (0.0%) |
| $35,000 to $39,999 | 0 (0.0%) | 0 (0.0%) |
| $40,000 to $44,999 | 0 (0.0%) | 25 (31.2%) |
| $45,000 to $49,999 | 15 (33.3%) | 0 (0.0%) |
| $50,000 to $54,999 | 0 (0.0%) | 0 (0.0%) |
| $55,000 to $64,999 | 3 (6.7%) | 0 (0.0%) |
| $65,000 to $74,999 | 0 (0.0%) | 0 (0.0%) |
| $75,000 to $99,999 | 0 (0.0%) | 0 (0.0%) |
| $100,000+ | 0 (0.0%) | 0 (0.0%) |
| Total | 45 (100.0%) | 80 (100.0%) |
Earnings by Sex by Educational Attainment in Marble
| Educational Attainment | Male Income | Female Income |
| Less than High School | - | - |
| High School Diploma | - | - |
| College or Associate's Degree | - | - |
| Bachelor's Degree | - | - |
| Graduate Degree | - | - |
| Total | - | - |
Family Income in Marble
Family Income Brackets in Marble
According to the Marble family income data, there are 35 families falling into the $35,000 to $49,999 income range, which is the most common income bracket and makes up 59.3% of all families.
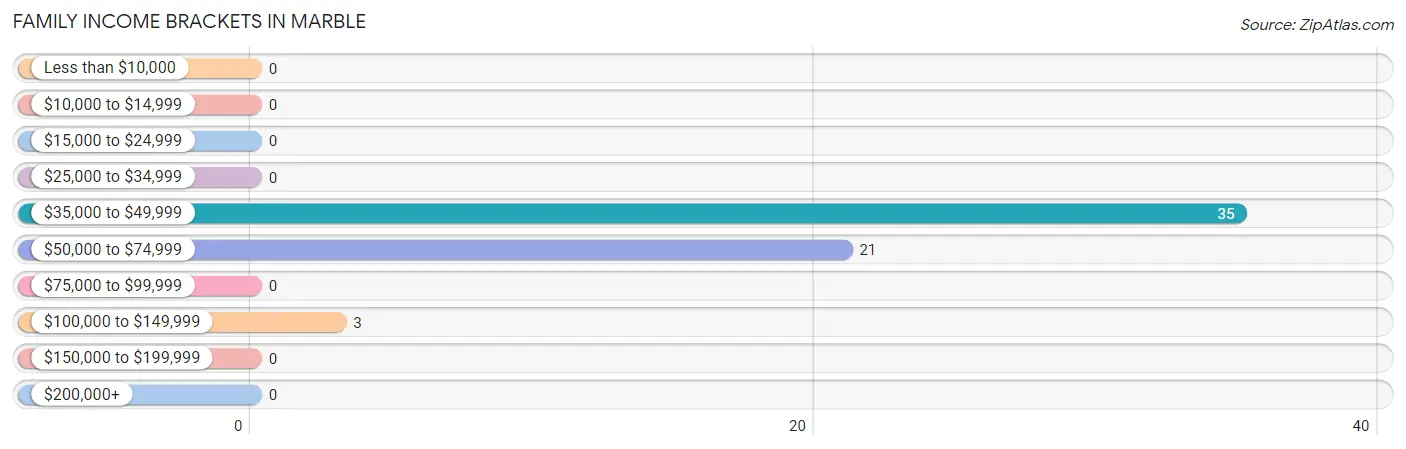
| Income Bracket | # Families | % Families |
| Less than $10,000 | 0 | 0.0% |
| $10,000 to $14,999 | 0 | 0.0% |
| $15,000 to $24,999 | 0 | 0.0% |
| $25,000 to $34,999 | 0 | 0.0% |
| $35,000 to $49,999 | 35 | 59.3% |
| $50,000 to $74,999 | 21 | 35.6% |
| $75,000 to $99,999 | 0 | 0.0% |
| $100,000 to $149,999 | 3 | 5.1% |
| $150,000 to $199,999 | 0 | 0.0% |
| $200,000+ | 0 | 0.0% |
Family Income by Famaliy Size in Marble
| Income Bracket | # Families | Median Income |
| 2-Person Families | 24 (40.7%) | $0 |
| 3-Person Families | 0 (0.0%) | $0 |
| 4-Person Families | 19 (32.2%) | $0 |
| 5-Person Families | 16 (27.1%) | $0 |
| 6-Person Families | 0 (0.0%) | $0 |
| 7+ Person Families | 0 (0.0%) | $0 |
| Total | 59 (100.0%) | $46,641 |
Family Income by Number of Earners in Marble
| Number of Earners | # Families | Median Income |
| No Earners | 0 (0.0%) | $0 |
| 1 Earner | 37 (62.7%) | $0 |
| 2 Earners | 3 (5.1%) | $0 |
| 3+ Earners | 19 (32.2%) | $0 |
| Total | 59 (100.0%) | $46,641 |
Household Income in Marble
Household Income Brackets in Marble
With 35 households falling in the category, the $35,000 to $49,999 income range is the most frequent in Marble, accounting for 37.6% of all households.
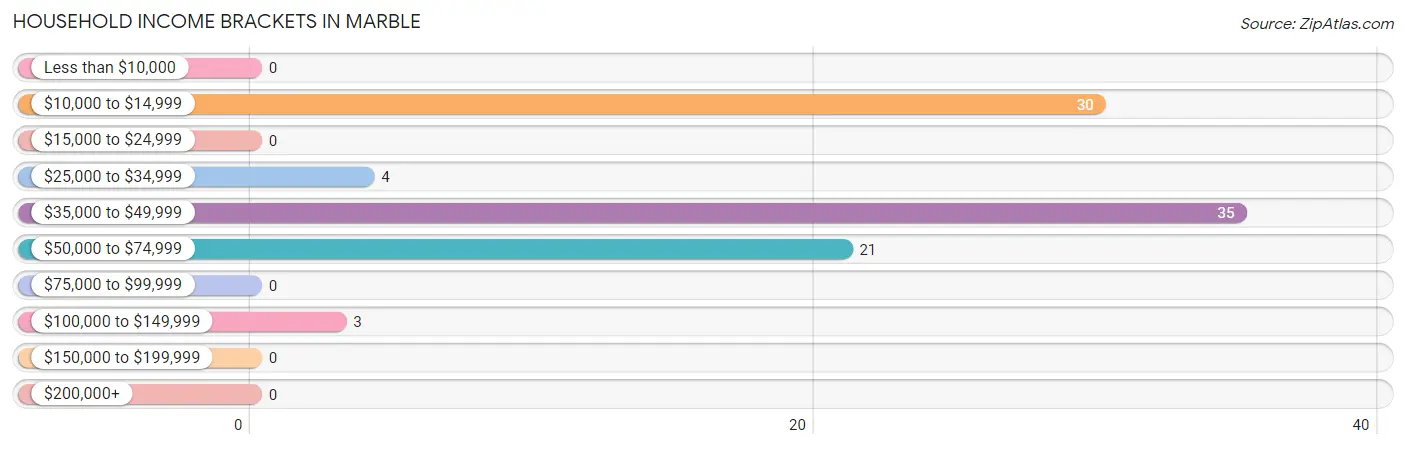
| Income Bracket | # Households | % Households |
| Less than $10,000 | 0 | 0.0% |
| $10,000 to $14,999 | 30 | 32.3% |
| $15,000 to $24,999 | 0 | 0.0% |
| $25,000 to $34,999 | 4 | 4.3% |
| $35,000 to $49,999 | 35 | 37.6% |
| $50,000 to $74,999 | 21 | 22.6% |
| $75,000 to $99,999 | 0 | 0.0% |
| $100,000 to $149,999 | 3 | 3.2% |
| $150,000 to $199,999 | 0 | 0.0% |
| $200,000+ | 0 | 0.0% |
Household Income by Householder Age in Marble
The median household income in Marble is $44,145, with the highest median household income of $45,781 found in the 45 to 64 years age bracket for the primary householder. A total of 70 households (75.3%) fall into this category.
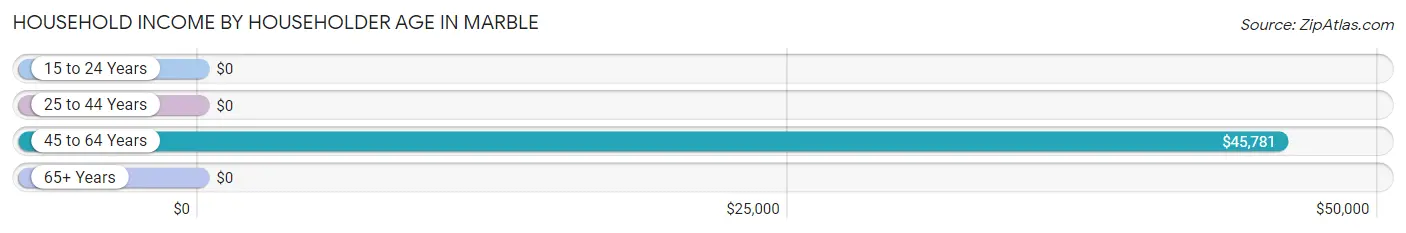
| Income Bracket | # Households | Median Income |
| 15 to 24 Years | 0 (0.0%) | $0 |
| 25 to 44 Years | 0 (0.0%) | $0 |
| 45 to 64 Years | 70 (75.3%) | $45,781 |
| 65+ Years | 23 (24.7%) | $0 |
| Total | 93 (100.0%) | $44,145 |
Poverty in Marble
Income Below Poverty by Sex and Age in Marble
With 7.8% poverty level for males and 12.0% for females among the residents of Marble, 55 to 64 year old males and 75 year old and over females are the most vulnerable to poverty, with 7 males (23.3%) and 23 females (100.0%) in their respective age groups living below the poverty level.
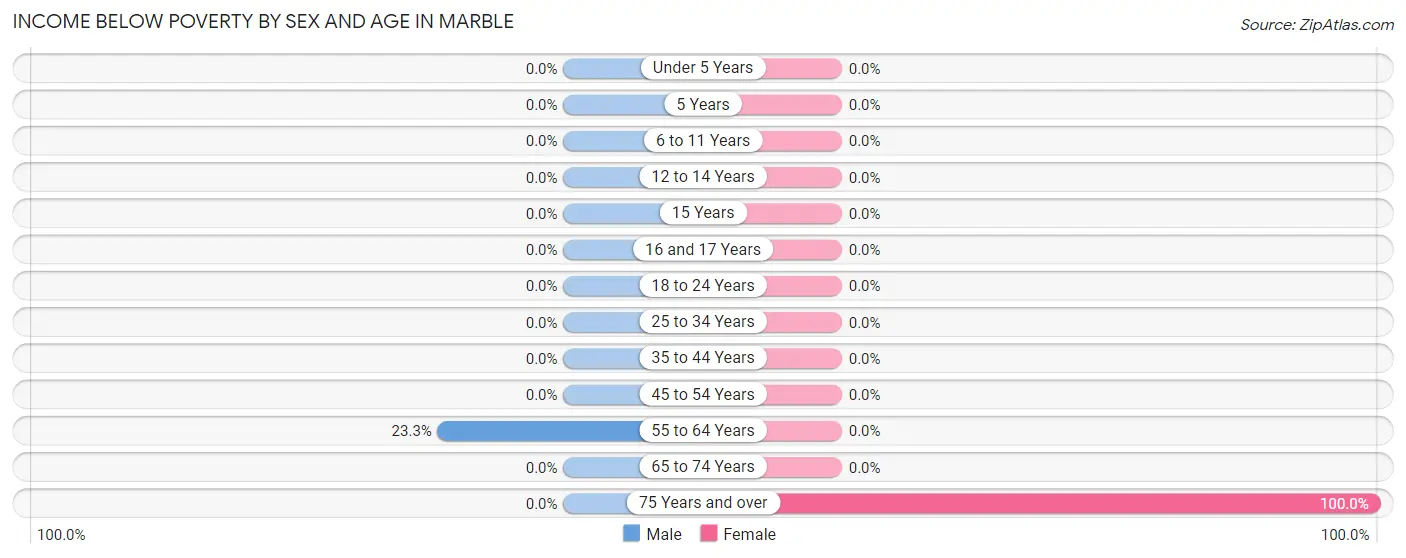
| Age Bracket | Male | Female |
| Under 5 Years | 0 (0.0%) | 0 (0.0%) |
| 5 Years | 0 (0.0%) | 0 (0.0%) |
| 6 to 11 Years | 0 (0.0%) | 0 (0.0%) |
| 12 to 14 Years | 0 (0.0%) | 0 (0.0%) |
| 15 Years | 0 (0.0%) | 0 (0.0%) |
| 16 and 17 Years | 0 (0.0%) | 0 (0.0%) |
| 18 to 24 Years | 0 (0.0%) | 0 (0.0%) |
| 25 to 34 Years | 0 (0.0%) | 0 (0.0%) |
| 35 to 44 Years | 0 (0.0%) | 0 (0.0%) |
| 45 to 54 Years | 0 (0.0%) | 0 (0.0%) |
| 55 to 64 Years | 7 (23.3%) | 0 (0.0%) |
| 65 to 74 Years | 0 (0.0%) | 0 (0.0%) |
| 75 Years and over | 0 (0.0%) | 23 (100.0%) |
| Total | 7 (7.8%) | 23 (12.0%) |
Income Above Poverty by Sex and Age in Marble
According to the poverty statistics in Marble, males aged under 5 years and females aged under 5 years are the age groups that are most secure financially, with 100.0% of males and 100.0% of females in these age groups living above the poverty line.
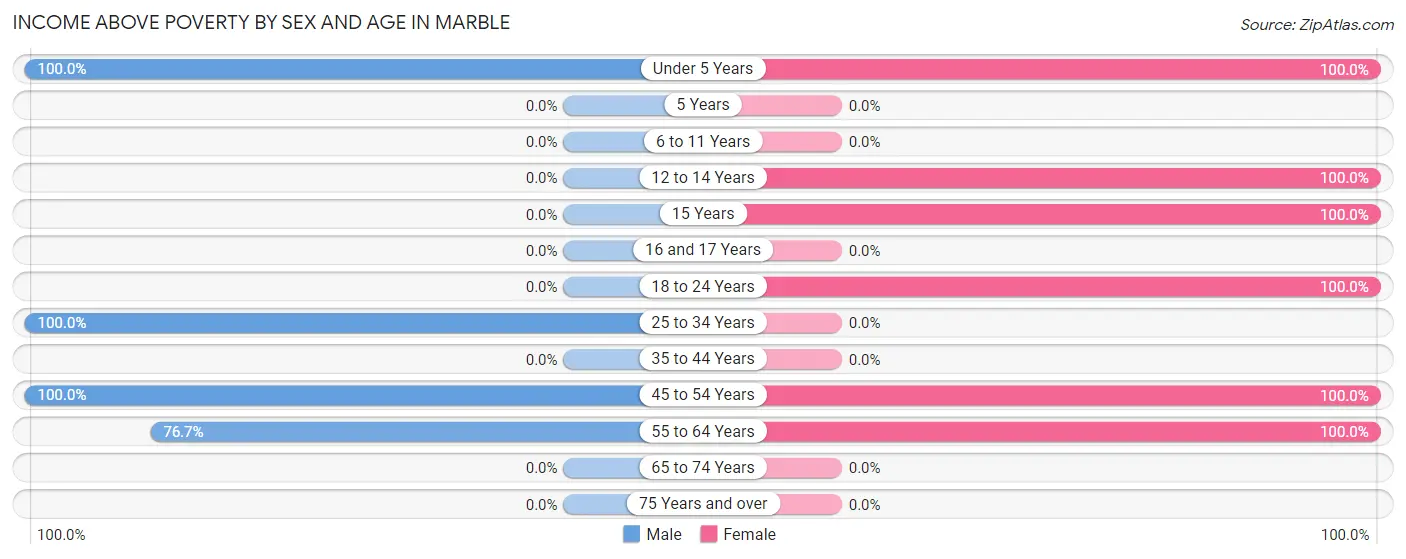
| Age Bracket | Male | Female |
| Under 5 Years | 18 (100.0%) | 11 (100.0%) |
| 5 Years | 0 (0.0%) | 0 (0.0%) |
| 6 to 11 Years | 0 (0.0%) | 0 (0.0%) |
| 12 to 14 Years | 0 (0.0%) | 20 (100.0%) |
| 15 Years | 0 (0.0%) | 42 (100.0%) |
| 16 and 17 Years | 0 (0.0%) | 0 (0.0%) |
| 18 to 24 Years | 0 (0.0%) | 32 (100.0%) |
| 25 to 34 Years | 27 (100.0%) | 0 (0.0%) |
| 35 to 44 Years | 0 (0.0%) | 0 (0.0%) |
| 45 to 54 Years | 15 (100.0%) | 60 (100.0%) |
| 55 to 64 Years | 23 (76.7%) | 4 (100.0%) |
| 65 to 74 Years | 0 (0.0%) | 0 (0.0%) |
| 75 Years and over | 0 (0.0%) | 0 (0.0%) |
| Total | 83 (92.2%) | 169 (88.0%) |
Income Below Poverty Among Married-Couple Families in Marble
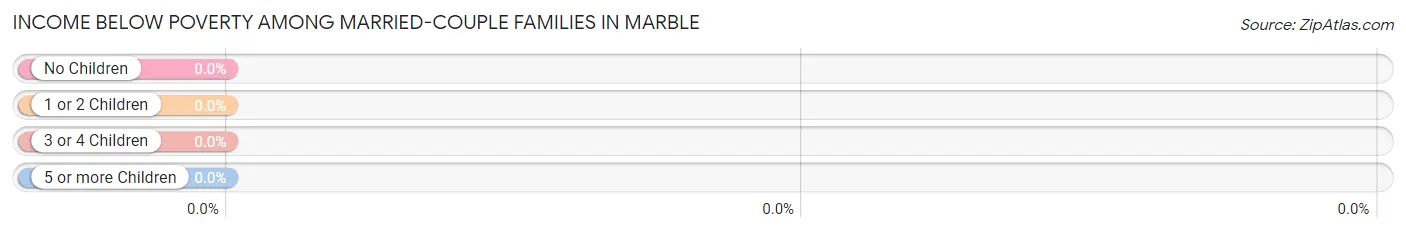
| Children | Above Poverty | Below Poverty |
| No Children | 24 (100.0%) | 0 (0.0%) |
| 1 or 2 Children | 0 (0.0%) | 0 (0.0%) |
| 3 or 4 Children | 16 (100.0%) | 0 (0.0%) |
| 5 or more Children | 0 (0.0%) | 0 (0.0%) |
| Total | 40 (100.0%) | 0 (0.0%) |
Income Below Poverty Among Single-Parent Households in Marble
| Children | Single Father | Single Mother |
| No Children | 0 (0.0%) | 0 (0.0%) |
| 1 or 2 Children | 0 (0.0%) | 0 (0.0%) |
| 3 or 4 Children | 0 (0.0%) | 0 (0.0%) |
| 5 or more Children | 0 (0.0%) | 0 (0.0%) |
| Total | 0 (0.0%) | 0 (0.0%) |
Income Below Poverty Among Married-Couple vs Single-Parent Households in Marble
| Children | Married-Couple Families | Single-Parent Households |
| No Children | 0 (0.0%) | 0 (0.0%) |
| 1 or 2 Children | 0 (0.0%) | 0 (0.0%) |
| 3 or 4 Children | 0 (0.0%) | 0 (0.0%) |
| 5 or more Children | 0 (0.0%) | 0 (0.0%) |
| Total | 0 (0.0%) | 0 (0.0%) |
Race in Marble
The most populous races in Marble are White / Caucasian (241 | 85.5%), and Black / African American (41 | 14.5%).
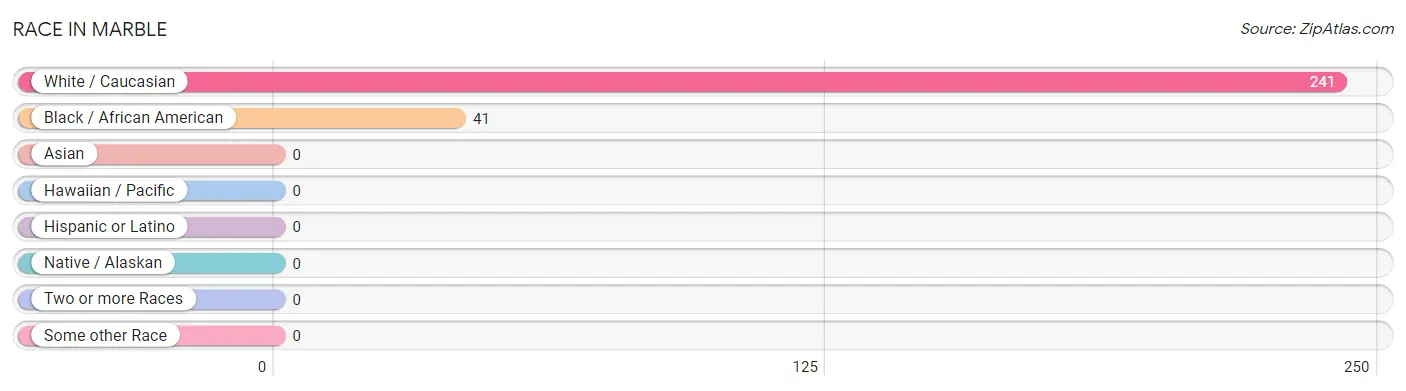
| Race | # Population | % Population |
| Asian | 0 | 0.0% |
| Black / African American | 41 | 14.5% |
| Hawaiian / Pacific | 0 | 0.0% |
| Hispanic or Latino | 0 | 0.0% |
| Native / Alaskan | 0 | 0.0% |
| White / Caucasian | 241 | 85.5% |
| Two or more Races | 0 | 0.0% |
| Some other Race | 0 | 0.0% |
| Total | 282 | 100.0% |
Ancestry in Marble
The most populous ancestries reported in Marble are American (108 | 38.3%), Scotch-Irish (4 | 1.4%), and English (3 | 1.1%), together accounting for 40.8% of all Marble residents.
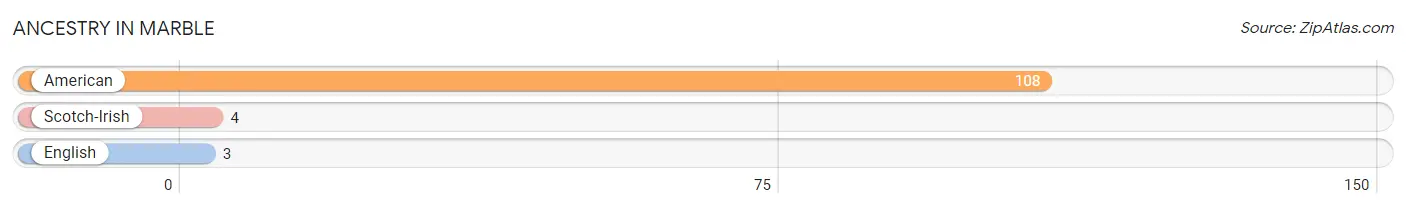
| Ancestry | # Population | % Population |
| American | 108 | 38.3% |
| English | 3 | 1.1% |
| Scotch-Irish | 4 | 1.4% | View All 3 Rows |
Immigrants in Marble

| Immigration Origin | # Population | % Population | View All 0 Rows |
Sex and Age in Marble
Sex and Age in Marble
The most populous age groups in Marble are 55 to 59 Years (30 | 33.3%) for men and 15 to 19 Years (42 | 21.9%) for women.

| Age Bracket | Male | Female |
| Under 5 Years | 18 (20.0%) | 11 (5.7%) |
| 5 to 9 Years | 0 (0.0%) | 0 (0.0%) |
| 10 to 14 Years | 0 (0.0%) | 20 (10.4%) |
| 15 to 19 Years | 0 (0.0%) | 42 (21.9%) |
| 20 to 24 Years | 0 (0.0%) | 32 (16.7%) |
| 25 to 29 Years | 27 (30.0%) | 0 (0.0%) |
| 30 to 34 Years | 0 (0.0%) | 0 (0.0%) |
| 35 to 39 Years | 0 (0.0%) | 0 (0.0%) |
| 40 to 44 Years | 0 (0.0%) | 0 (0.0%) |
| 45 to 49 Years | 0 (0.0%) | 19 (9.9%) |
| 50 to 54 Years | 15 (16.7%) | 41 (21.3%) |
| 55 to 59 Years | 30 (33.3%) | 4 (2.1%) |
| 60 to 64 Years | 0 (0.0%) | 0 (0.0%) |
| 65 to 69 Years | 0 (0.0%) | 0 (0.0%) |
| 70 to 74 Years | 0 (0.0%) | 0 (0.0%) |
| 75 to 79 Years | 0 (0.0%) | 23 (12.0%) |
| 80 to 84 Years | 0 (0.0%) | 0 (0.0%) |
| 85 Years and over | 0 (0.0%) | 0 (0.0%) |
| Total | 90 (100.0%) | 192 (100.0%) |
Families and Households in Marble
Median Family Size in Marble
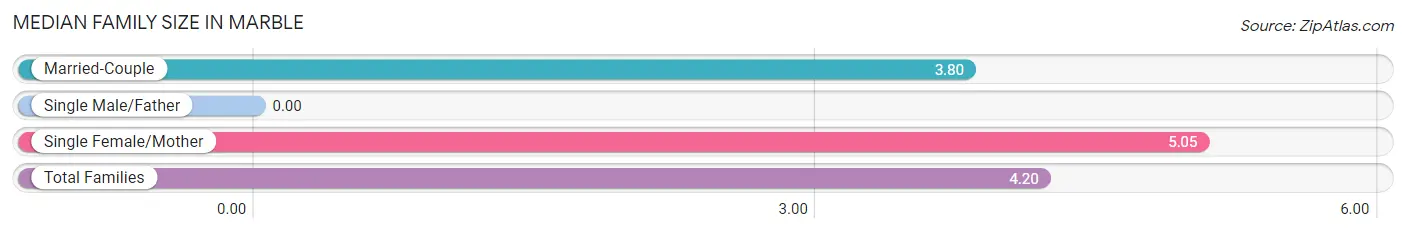
| Family Type | # Families | Family Size |
| Married-Couple | 40 (67.8%) | 3.80 |
| Single Male/Father | 0 (0.0%) | - |
| Single Female/Mother | 19 (32.2%) | 5.05 |
| Total Families | 59 (100.0%) | 4.20 |
Median Household Size in Marble
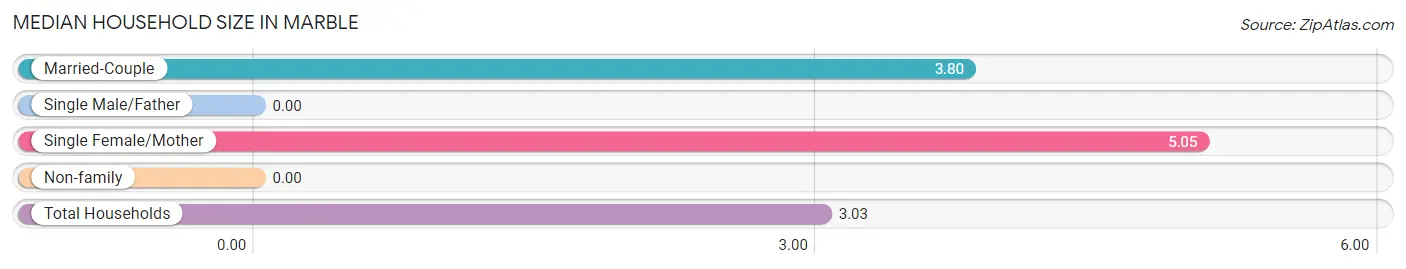
| Household Type | # Households | Household Size |
| Married-Couple | 40 (43.0%) | 3.80 |
| Single Male/Father | 0 (0.0%) | - |
| Single Female/Mother | 19 (20.4%) | 5.05 |
| Non-family | 34 (36.6%) | - |
| Total Households | 93 (100.0%) | 3.03 |
Household Size by Marriage Status in Marble
Out of a total of 93 households in Marble, 59 (63.4%) are family households, while 34 (36.6%) are nonfamily households. The most numerous type of family households are 2-person households, comprising 24, and the most common type of nonfamily households are 1-person households, comprising 34.
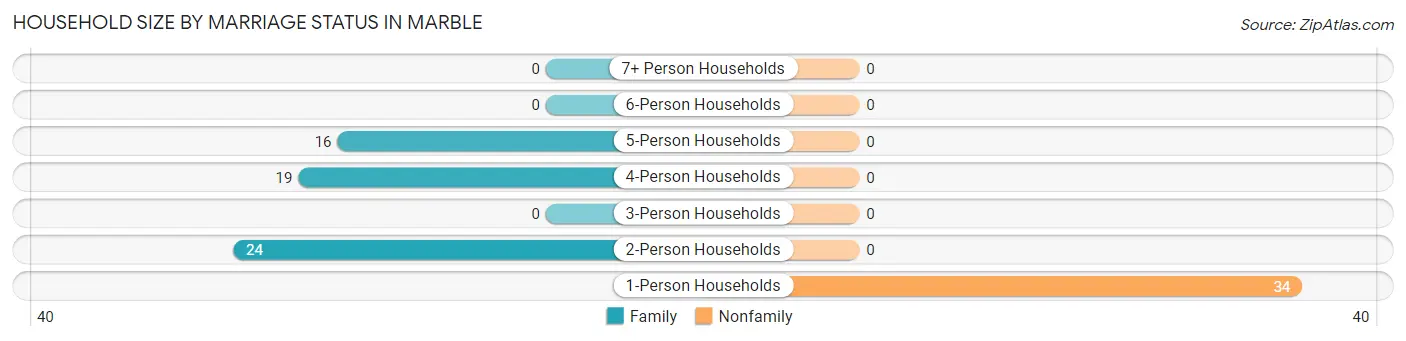
| Household Size | Family Households | Nonfamily Households |
| 1-Person Households | - | 34 (36.6%) |
| 2-Person Households | 24 (25.8%) | 0 (0.0%) |
| 3-Person Households | 0 (0.0%) | 0 (0.0%) |
| 4-Person Households | 19 (20.4%) | 0 (0.0%) |
| 5-Person Households | 16 (17.2%) | 0 (0.0%) |
| 6-Person Households | 0 (0.0%) | 0 (0.0%) |
| 7+ Person Households | 0 (0.0%) | 0 (0.0%) |
| Total | 59 (63.4%) | 34 (36.6%) |
Female Fertility in Marble
Fertility by Age in Marble
| Age Bracket | Women with Births | Births / 1,000 Women |
| 15 to 19 years | 0 (0.0%) | 0.0 |
| 20 to 34 years | 0 (0.0%) | 0.0 |
| 35 to 50 years | 0 (0.0%) | 0.0 |
| Total | 0 (0.0%) | 0.0 |
Fertility by Age by Marriage Status in Marble
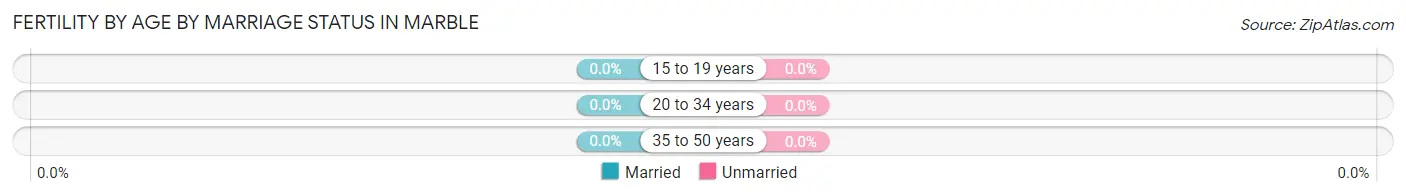
| Age Bracket | Married | Unmarried |
| 15 to 19 years | 0 (0.0%) | 0 (0.0%) |
| 20 to 34 years | 0 (0.0%) | 0 (0.0%) |
| 35 to 50 years | 0 (0.0%) | 0 (0.0%) |
| Total | 0 (0.0%) | 0 (0.0%) |
Fertility by Education in Marble
| Educational Attainment | Women with Births | Births / 1,000 Women |
| Less than High School | 0 (0.0%) | 0.0 |
| High School Diploma | 0 (0.0%) | 0.0 |
| College or Associate's Degree | 0 (0.0%) | 0.0 |
| Bachelor's Degree | 0 (0.0%) | 0.0 |
| Graduate Degree | 0 (0.0%) | 0.0 |
| Total | 0 (0.0%) | 0.0 |
Fertility by Education by Marriage Status in Marble
| Educational Attainment | Married | Unmarried |
| Less than High School | 0 (0.0%) | 0 (0.0%) |
| High School Diploma | 0 (0.0%) | 0 (0.0%) |
| College or Associate's Degree | 0 (0.0%) | 0 (0.0%) |
| Bachelor's Degree | 0 (0.0%) | 0 (0.0%) |
| Graduate Degree | 0 (0.0%) | 0 (0.0%) |
| Total | 0 (0.0%) | 0 (0.0%) |
Employment Characteristics in Marble
Employment by Class of Employer in Marble
Among the 47 employed individuals in Marble, private company employees (43 | 91.5%), and local government employees (4 | 8.5%) make up the most common classes of employment.
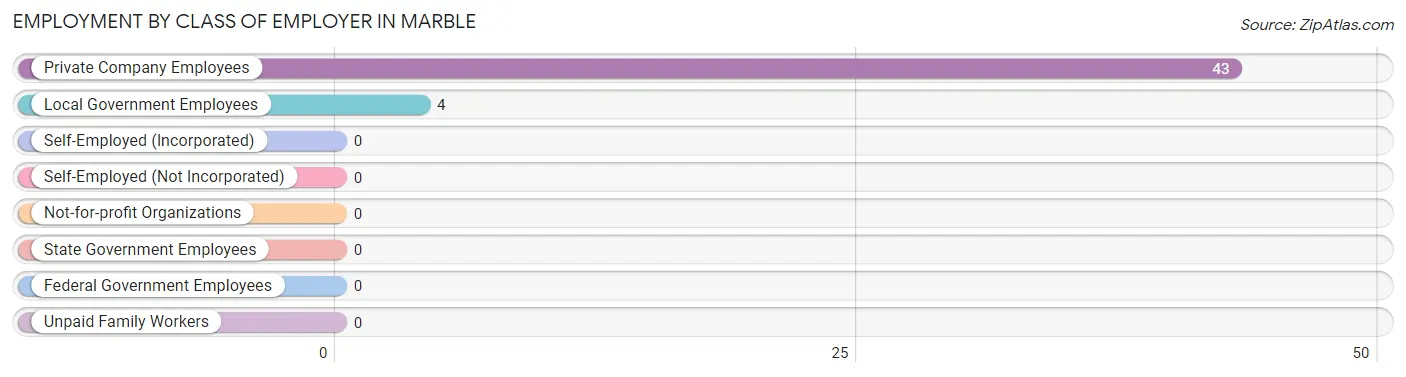
| Employer Class | # Employees | % Employees |
| Private Company Employees | 43 | 91.5% |
| Self-Employed (Incorporated) | 0 | 0.0% |
| Self-Employed (Not Incorporated) | 0 | 0.0% |
| Not-for-profit Organizations | 0 | 0.0% |
| Local Government Employees | 4 | 8.5% |
| State Government Employees | 0 | 0.0% |
| Federal Government Employees | 0 | 0.0% |
| Unpaid Family Workers | 0 | 0.0% |
| Total | 47 | 100.0% |
Employment Status by Age in Marble
According to the labor force statistics for Marble, out of the total population over 16 years of age (191), 65.4% or 125 individuals are in the labor force, with 47.2% or 59 of them unemployed. The age group with the highest labor force participation rate is 20 to 24 years, with 100.0% or 32 individuals in the labor force. Within the labor force, the 20 to 24 years age range has the highest percentage of unemployed individuals, with 100.0% or 32 of them being unemployed.
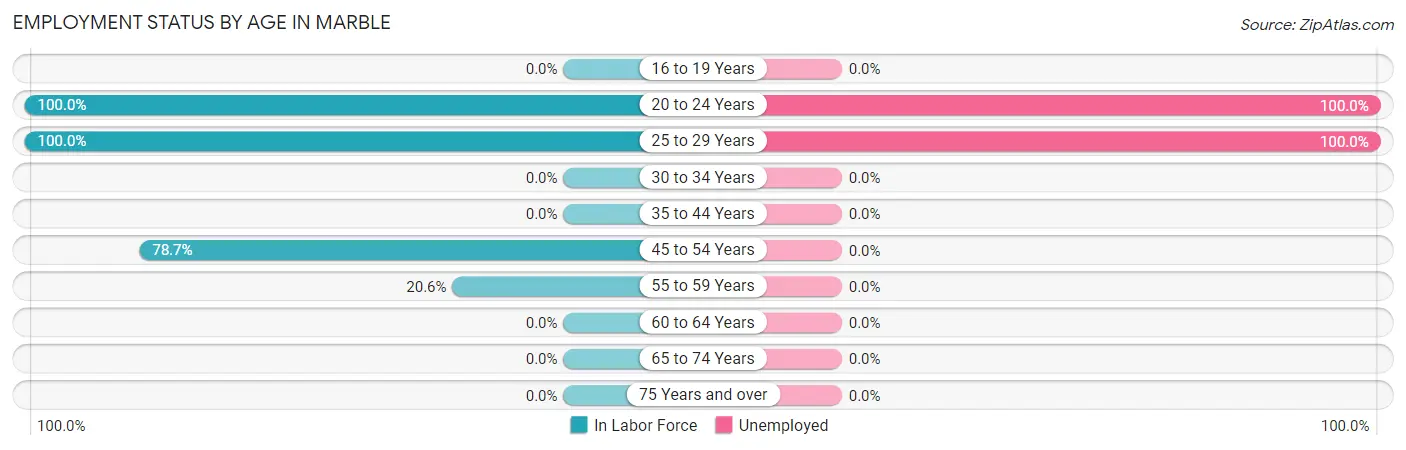
| Age Bracket | In Labor Force | Unemployed |
| 16 to 19 Years | 0 (0.0%) | 0 (0.0%) |
| 20 to 24 Years | 32 (100.0%) | 32 (100.0%) |
| 25 to 29 Years | 27 (100.0%) | 27 (100.0%) |
| 30 to 34 Years | 0 (0.0%) | 0 (0.0%) |
| 35 to 44 Years | 0 (0.0%) | 0 (0.0%) |
| 45 to 54 Years | 59 (78.7%) | 0 (0.0%) |
| 55 to 59 Years | 7 (20.6%) | 0 (0.0%) |
| 60 to 64 Years | 0 (0.0%) | 0 (0.0%) |
| 65 to 74 Years | 0 (0.0%) | 0 (0.0%) |
| 75 Years and over | 0 (0.0%) | 0 (0.0%) |
| Total | 125 (65.4%) | 59 (47.2%) |
Employment Status by Educational Attainment in Marble
According to labor force statistics for Marble, 68.4% of individuals (93) out of the total population between 25 and 64 years of age (136) are in the labor force, with 29.0% or 27 of them being unemployed. The group with the highest labor force participation rate are those with the educational attainment of college / associate degree, with 100.0% or 28 individuals in the labor force. Within the labor force, individuals with bachelor's degree or higher education have the highest percentage of unemployment, with 87.1% or 27 of them being unemployed.
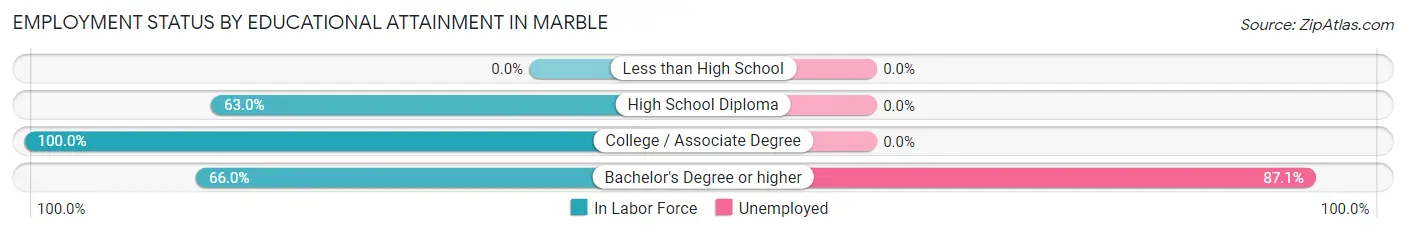
| Educational Attainment | In Labor Force | Unemployed |
| Less than High School | 0 (0.0%) | 0 (0.0%) |
| High School Diploma | 34 (63.0%) | 0 (0.0%) |
| College / Associate Degree | 28 (100.0%) | 0 (0.0%) |
| Bachelor's Degree or higher | 31 (66.0%) | 41 (87.1%) |
| Total | 93 (68.4%) | 39 (29.0%) |
Employment Occupations by Sex in Marble
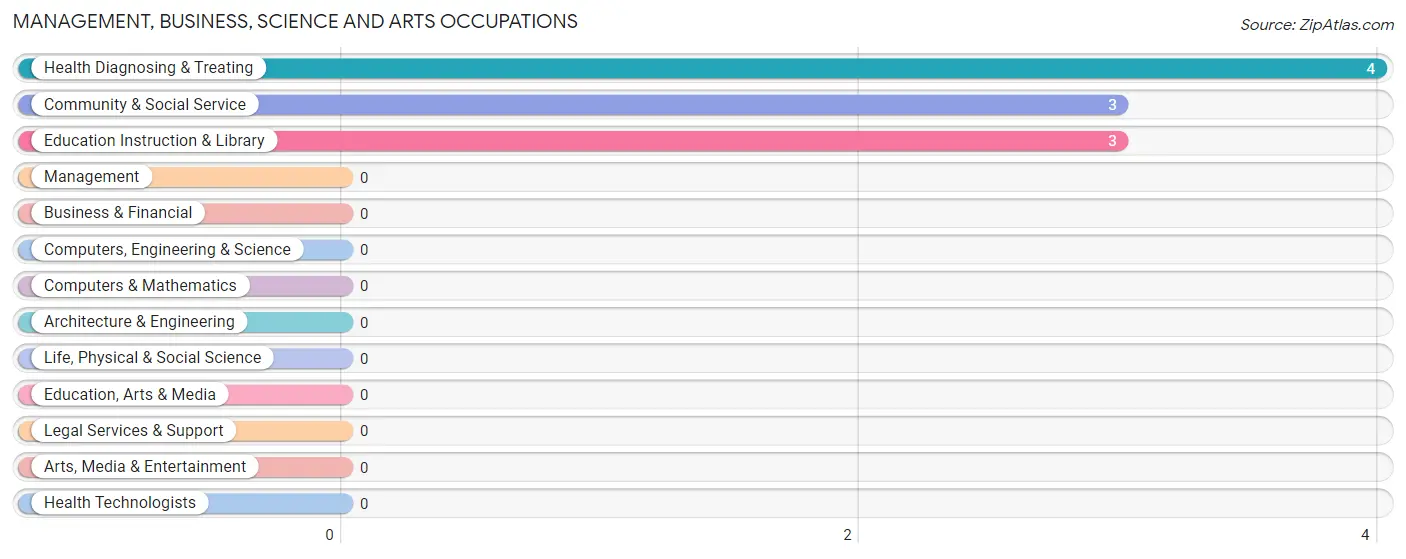
Management, Business, Science and Arts Occupations
The most common Management, Business, Science and Arts occupations in Marble are Health Diagnosing & Treating (4 | 6.1%), Community & Social Service (3 | 4.5%), and Education Instruction & Library (3 | 4.5%).
Management, Business, Science and Arts Occupations by Sex
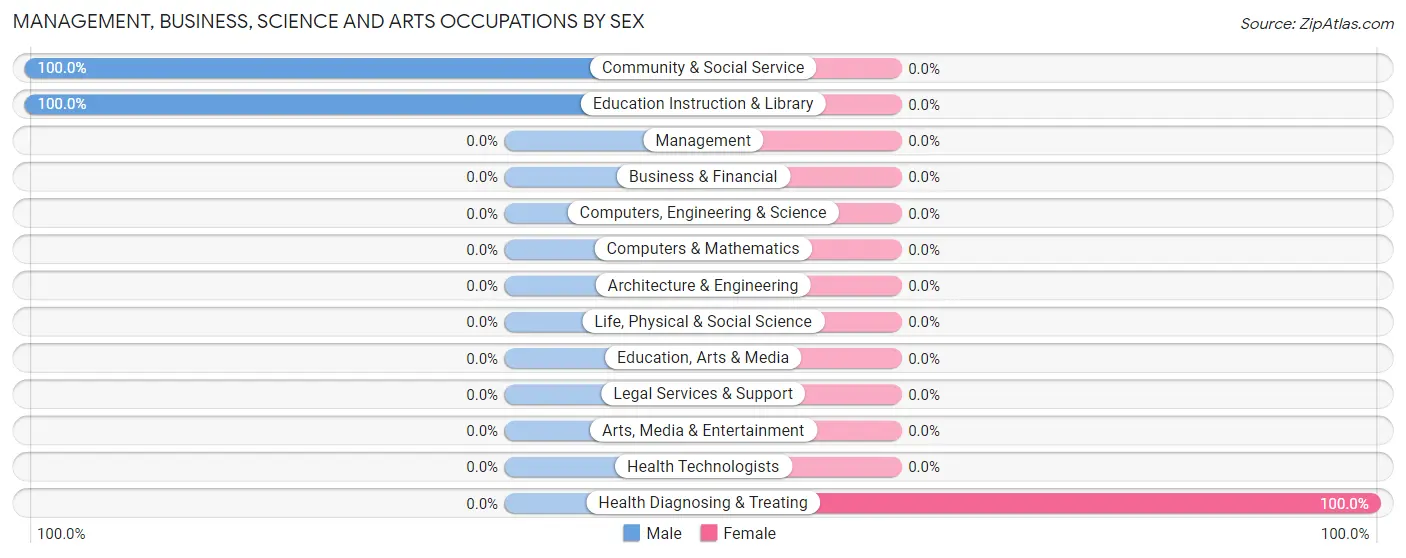
| Occupation | Male | Female |
| Management | 0 (0.0%) | 0 (0.0%) |
| Business & Financial | 0 (0.0%) | 0 (0.0%) |
| Computers, Engineering & Science | 0 (0.0%) | 0 (0.0%) |
| Computers & Mathematics | 0 (0.0%) | 0 (0.0%) |
| Architecture & Engineering | 0 (0.0%) | 0 (0.0%) |
| Life, Physical & Social Science | 0 (0.0%) | 0 (0.0%) |
| Community & Social Service | 3 (100.0%) | 0 (0.0%) |
| Education, Arts & Media | 0 (0.0%) | 0 (0.0%) |
| Legal Services & Support | 0 (0.0%) | 0 (0.0%) |
| Education Instruction & Library | 3 (100.0%) | 0 (0.0%) |
| Arts, Media & Entertainment | 0 (0.0%) | 0 (0.0%) |
| Health Diagnosing & Treating | 0 (0.0%) | 4 (100.0%) |
| Health Technologists | 0 (0.0%) | 0 (0.0%) |
| Total (Category) | 3 (42.9%) | 4 (57.1%) |
| Total (Overall) | 18 (27.3%) | 48 (72.7%) |
Services Occupations
The most common Services occupations in Marble are , and Food Preparation & Serving (19 | 28.8%).
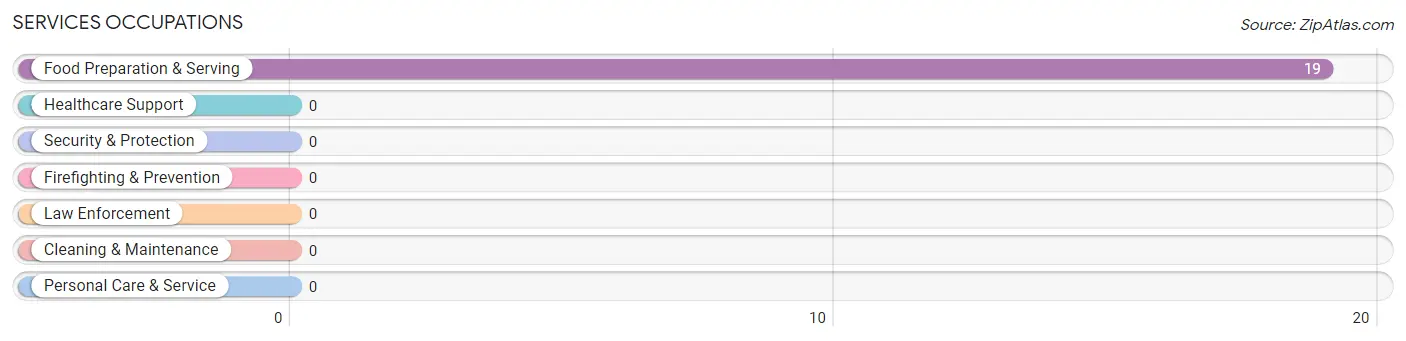
Services Occupations by Sex
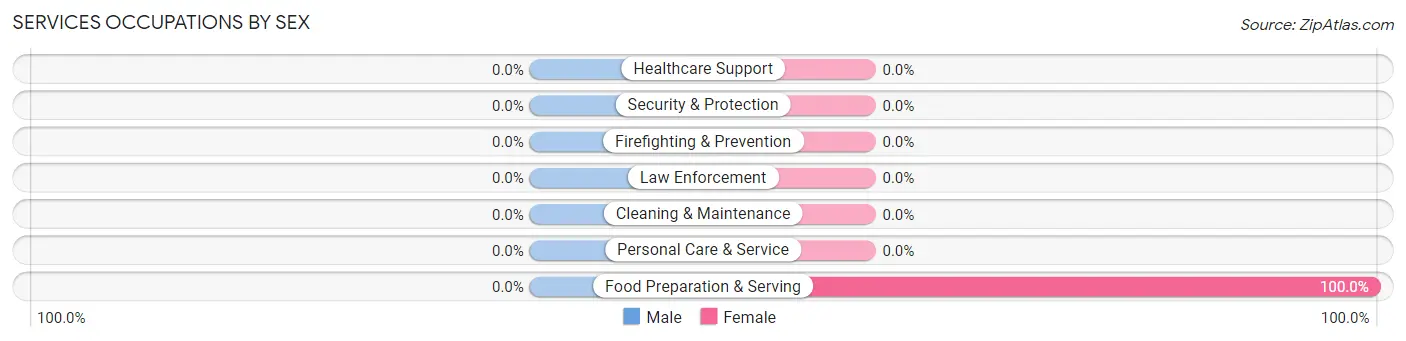
| Occupation | Male | Female |
| Healthcare Support | 0 (0.0%) | 0 (0.0%) |
| Security & Protection | 0 (0.0%) | 0 (0.0%) |
| Firefighting & Prevention | 0 (0.0%) | 0 (0.0%) |
| Law Enforcement | 0 (0.0%) | 0 (0.0%) |
| Food Preparation & Serving | 0 (0.0%) | 19 (100.0%) |
| Cleaning & Maintenance | 0 (0.0%) | 0 (0.0%) |
| Personal Care & Service | 0 (0.0%) | 0 (0.0%) |
| Total (Category) | 0 (0.0%) | 19 (100.0%) |
| Total (Overall) | 18 (27.3%) | 48 (72.7%) |
Sales and Office Occupations
The most common Sales and Office occupations in Marble are Sales & Related (15 | 22.7%), and Office & Administration (4 | 6.1%).
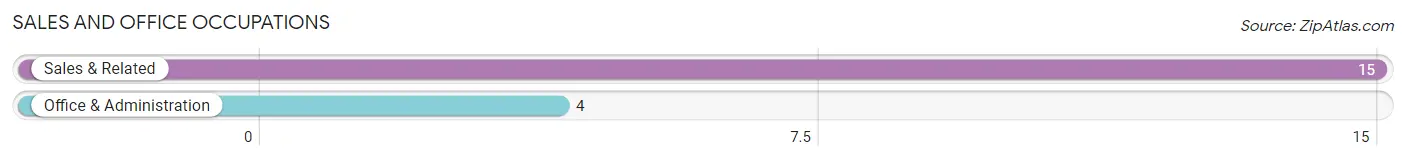
Sales and Office Occupations by Sex
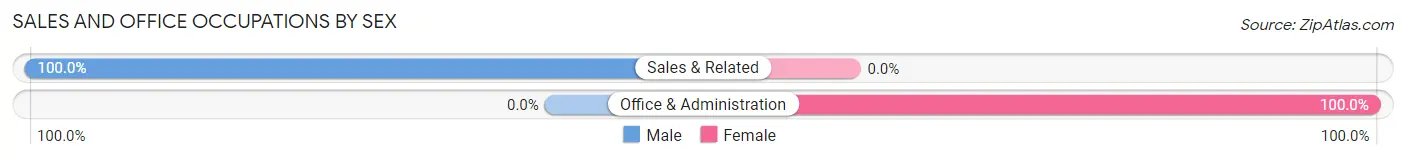
| Occupation | Male | Female |
| Sales & Related | 15 (100.0%) | 0 (0.0%) |
| Office & Administration | 0 (0.0%) | 4 (100.0%) |
| Total (Category) | 15 (78.9%) | 4 (21.0%) |
| Total (Overall) | 18 (27.3%) | 48 (72.7%) |
Natural Resources, Construction and Maintenance Occupations
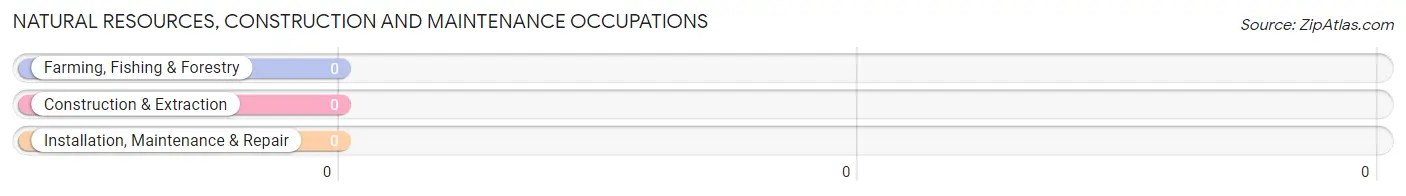
Natural Resources, Construction and Maintenance Occupations by Sex
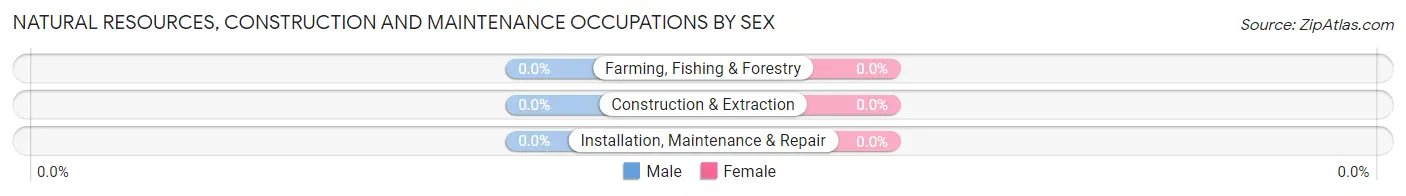
| Occupation | Male | Female |
| Farming, Fishing & Forestry | 0 (0.0%) | 0 (0.0%) |
| Construction & Extraction | 0 (0.0%) | 0 (0.0%) |
| Installation, Maintenance & Repair | 0 (0.0%) | 0 (0.0%) |
| Total (Category) | 0 (0.0%) | 0 (0.0%) |
| Total (Overall) | 18 (27.3%) | 48 (72.7%) |
Production, Transportation and Moving Occupations
The most common Production, Transportation and Moving occupations in Marble are , and Production (21 | 31.8%).
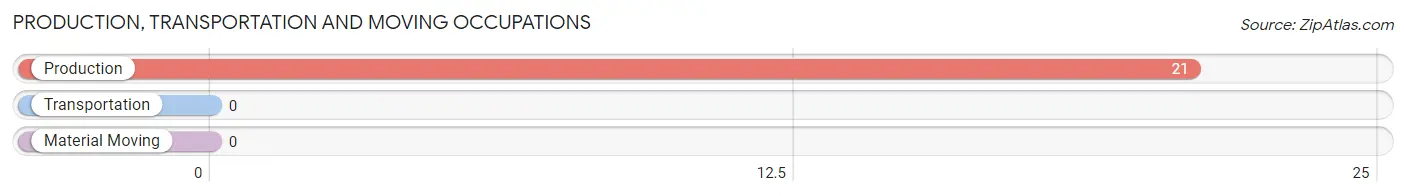
Production, Transportation and Moving Occupations by Sex
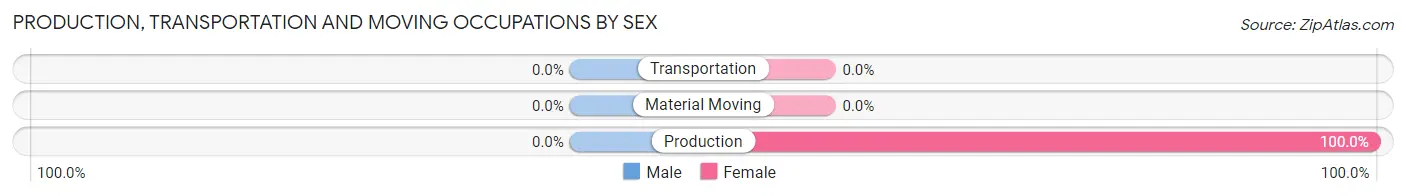
| Occupation | Male | Female |
| Production | 0 (0.0%) | 21 (100.0%) |
| Transportation | 0 (0.0%) | 0 (0.0%) |
| Material Moving | 0 (0.0%) | 0 (0.0%) |
| Total (Category) | 0 (0.0%) | 21 (100.0%) |
| Total (Overall) | 18 (27.3%) | 48 (72.7%) |
Employment Industries by Sex in Marble
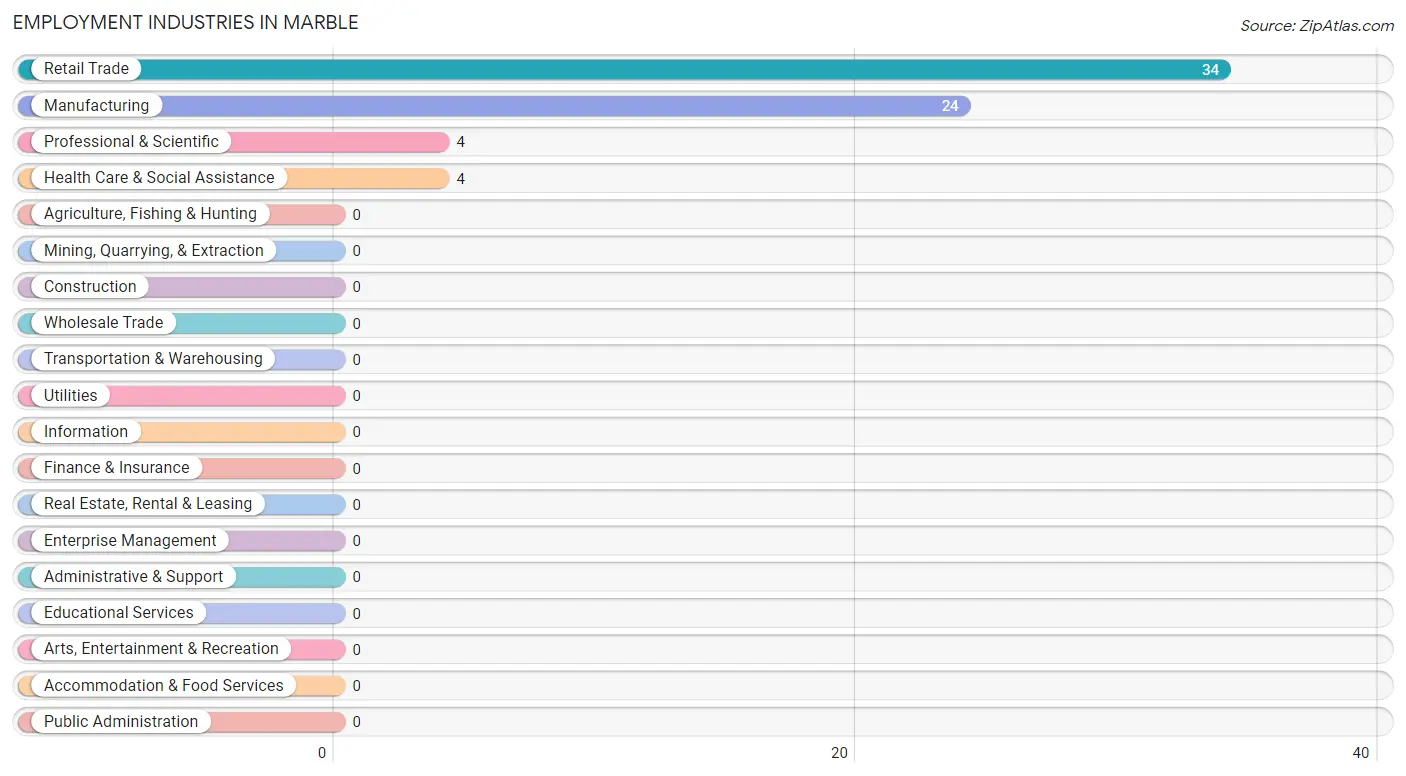
Employment Industries in Marble
The major employment industries in Marble include Retail Trade (34 | 51.5%), Manufacturing (24 | 36.4%), Professional & Scientific (4 | 6.1%), and Health Care & Social Assistance (4 | 6.1%).
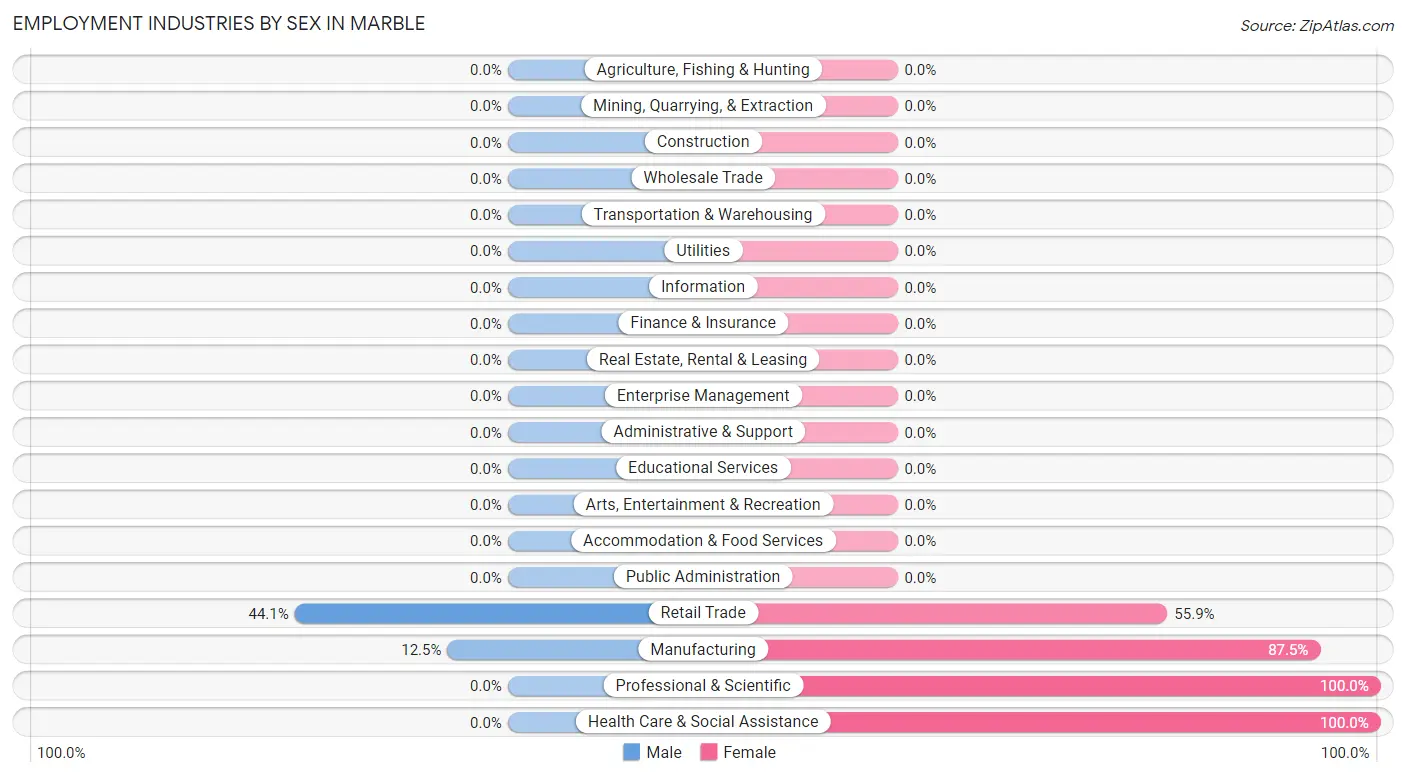
Employment Industries by Sex in Marble
The Marble industries that see more men than women are Retail Trade (44.1%), and Manufacturing (12.5%), whereas the industries that tend to have a higher number of women are Professional & Scientific (100.0%), Health Care & Social Assistance (100.0%), and Manufacturing (87.5%).
| Industry | Male | Female |
| Agriculture, Fishing & Hunting | 0 (0.0%) | 0 (0.0%) |
| Mining, Quarrying, & Extraction | 0 (0.0%) | 0 (0.0%) |
| Construction | 0 (0.0%) | 0 (0.0%) |
| Manufacturing | 3 (12.5%) | 21 (87.5%) |
| Wholesale Trade | 0 (0.0%) | 0 (0.0%) |
| Retail Trade | 15 (44.1%) | 19 (55.9%) |
| Transportation & Warehousing | 0 (0.0%) | 0 (0.0%) |
| Utilities | 0 (0.0%) | 0 (0.0%) |
| Information | 0 (0.0%) | 0 (0.0%) |
| Finance & Insurance | 0 (0.0%) | 0 (0.0%) |
| Real Estate, Rental & Leasing | 0 (0.0%) | 0 (0.0%) |
| Professional & Scientific | 0 (0.0%) | 4 (100.0%) |
| Enterprise Management | 0 (0.0%) | 0 (0.0%) |
| Administrative & Support | 0 (0.0%) | 0 (0.0%) |
| Educational Services | 0 (0.0%) | 0 (0.0%) |
| Health Care & Social Assistance | 0 (0.0%) | 4 (100.0%) |
| Arts, Entertainment & Recreation | 0 (0.0%) | 0 (0.0%) |
| Accommodation & Food Services | 0 (0.0%) | 0 (0.0%) |
| Public Administration | 0 (0.0%) | 0 (0.0%) |
| Total | 18 (27.3%) | 48 (72.7%) |
Education in Marble
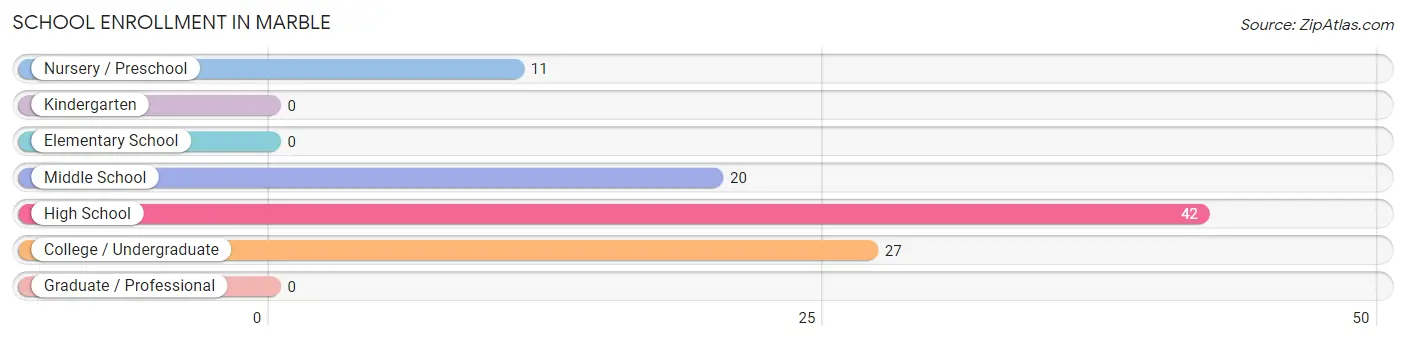
School Enrollment in Marble
The most common levels of schooling among the 100 students in Marble are high school (42 | 42.0%), college / undergraduate (27 | 27.0%), and middle school (20 | 20.0%).
| School Level | # Students | % Students |
| Nursery / Preschool | 11 | 11.0% |
| Kindergarten | 0 | 0.0% |
| Elementary School | 0 | 0.0% |
| Middle School | 20 | 20.0% |
| High School | 42 | 42.0% |
| College / Undergraduate | 27 | 27.0% |
| Graduate / Professional | 0 | 0.0% |
| Total | 100 | 100.0% |
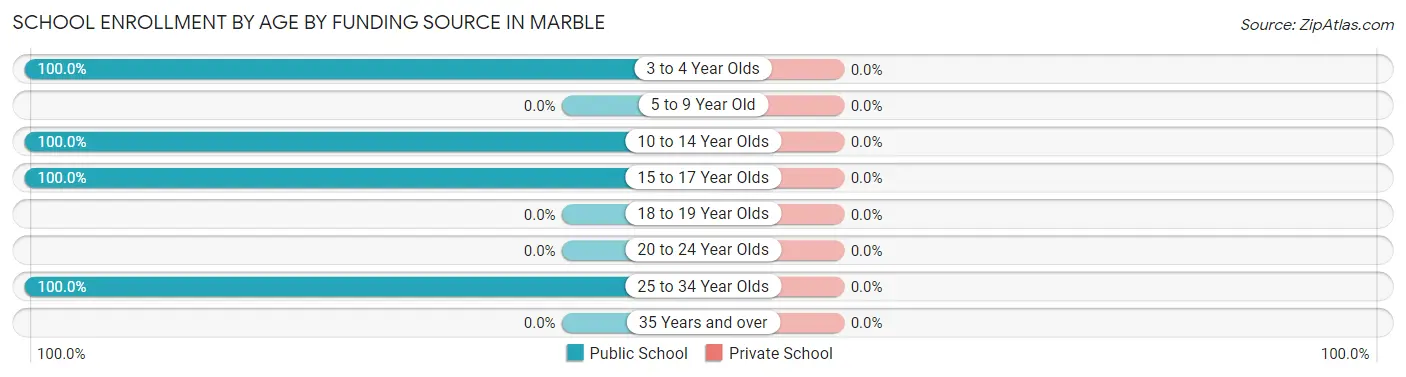
School Enrollment by Age by Funding Source in Marble
| Age Bracket | Public School | Private School |
| 3 to 4 Year Olds | 11 (100.0%) | 0 (0.0%) |
| 5 to 9 Year Old | 0 (0.0%) | 0 (0.0%) |
| 10 to 14 Year Olds | 20 (100.0%) | 0 (0.0%) |
| 15 to 17 Year Olds | 42 (100.0%) | 0 (0.0%) |
| 18 to 19 Year Olds | 0 (0.0%) | 0 (0.0%) |
| 20 to 24 Year Olds | 0 (0.0%) | 0 (0.0%) |
| 25 to 34 Year Olds | 27 (100.0%) | 0 (0.0%) |
| 35 Years and over | 0 (0.0%) | 0 (0.0%) |
| Total | 100 (100.0%) | 0 (0.0%) |
Educational Attainment by Field of Study in Marble
Business (27 | 57.5%), education (16 | 34.0%), and literature & languages (4 | 8.5%) are the most common fields of study among 47 individuals in Marble who have obtained a bachelor's degree or higher.
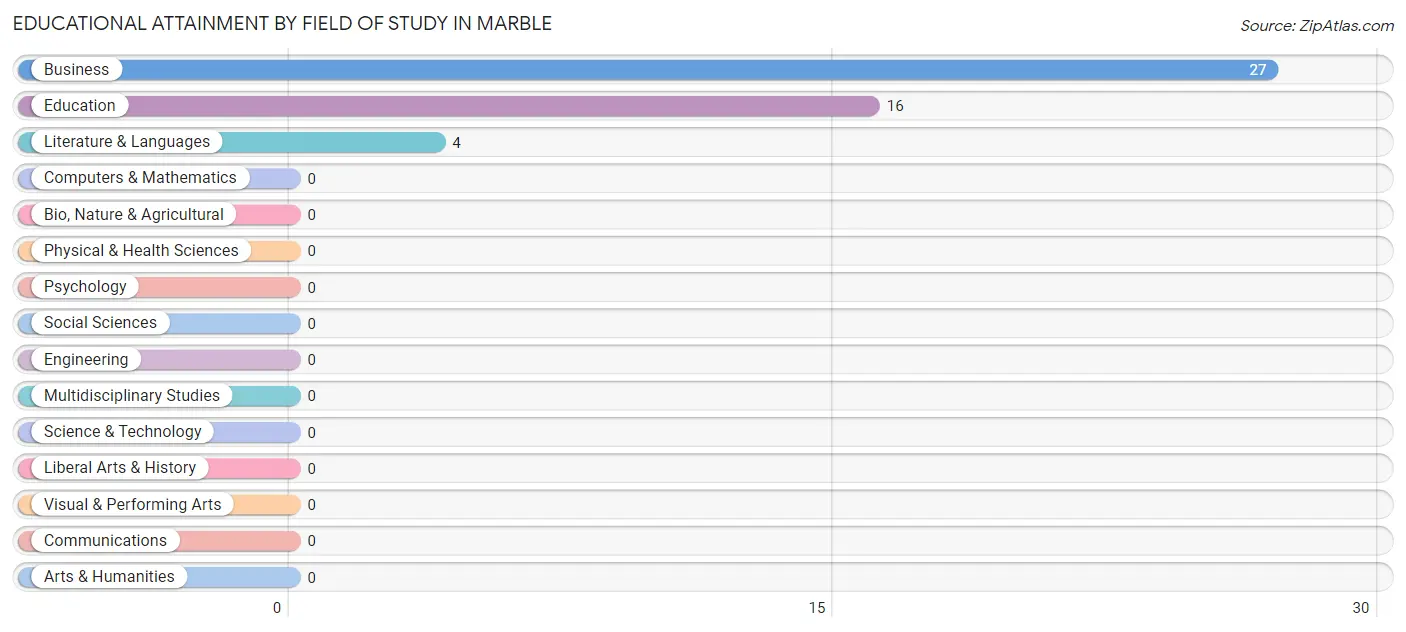
| Field of Study | # Graduates | % Graduates |
| Computers & Mathematics | 0 | 0.0% |
| Bio, Nature & Agricultural | 0 | 0.0% |
| Physical & Health Sciences | 0 | 0.0% |
| Psychology | 0 | 0.0% |
| Social Sciences | 0 | 0.0% |
| Engineering | 0 | 0.0% |
| Multidisciplinary Studies | 0 | 0.0% |
| Science & Technology | 0 | 0.0% |
| Business | 27 | 57.5% |
| Education | 16 | 34.0% |
| Literature & Languages | 4 | 8.5% |
| Liberal Arts & History | 0 | 0.0% |
| Visual & Performing Arts | 0 | 0.0% |
| Communications | 0 | 0.0% |
| Arts & Humanities | 0 | 0.0% |
| Total | 47 | 100.0% |
Transportation & Commute in Marble
Vehicle Availability by Sex in Marble
The most prevalent vehicle ownership categories in Marble are males with 2 vehicles (15, accounting for 83.3%) and females with 2 vehicles (21, making up 51.7%).
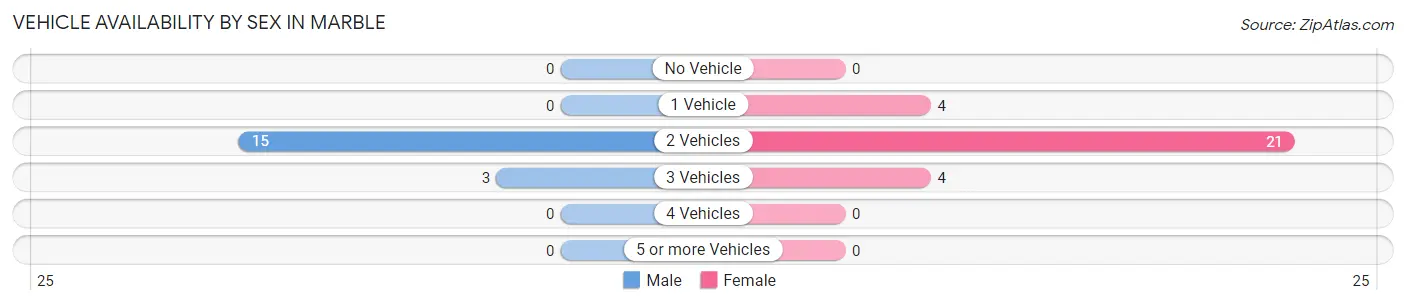
| Vehicles Available | Male | Female |
| No Vehicle | 0 (0.0%) | 0 (0.0%) |
| 1 Vehicle | 0 (0.0%) | 4 (13.8%) |
| 2 Vehicles | 15 (83.3%) | 21 (72.4%) |
| 3 Vehicles | 3 (16.7%) | 4 (13.8%) |
| 4 Vehicles | 0 (0.0%) | 0 (0.0%) |
| 5 or more Vehicles | 0 (0.0%) | 0 (0.0%) |
| Total | 18 (100.0%) | 29 (100.0%) |
Commute Time in Marble
The most frequently occuring commute durations in Marble are 90 or more minutes (21 commuters, 44.7%), 15 to 19 minutes (15 commuters, 31.9%), and 40 to 44 minutes (8 commuters, 17.0%).
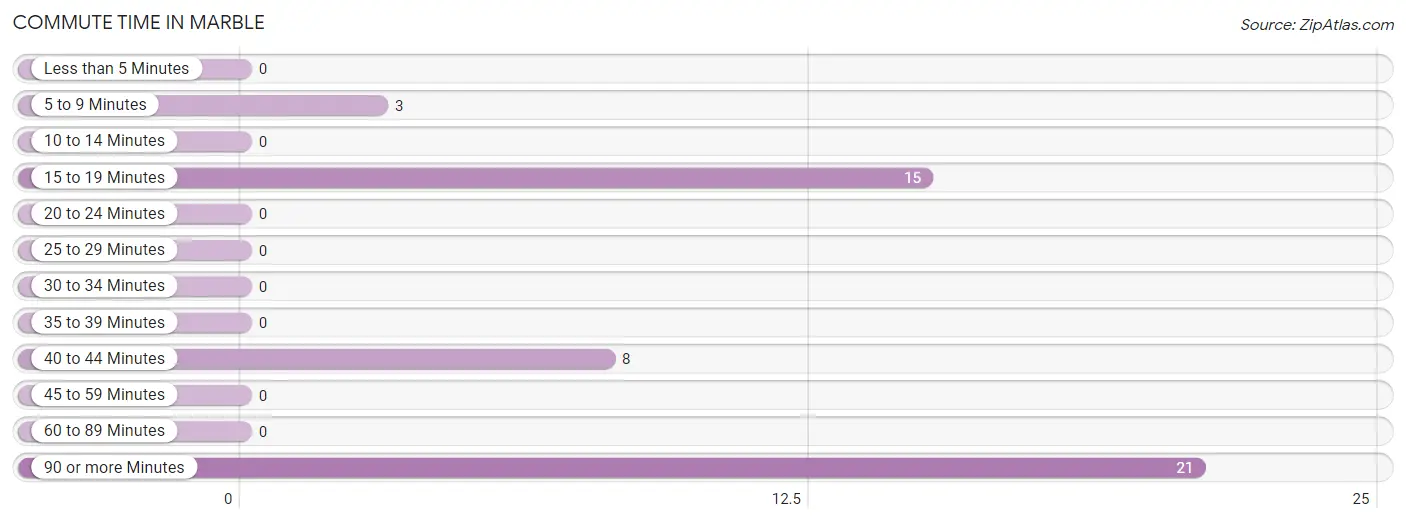
| Commute Time | # Commuters | % Commuters |
| Less than 5 Minutes | 0 | 0.0% |
| 5 to 9 Minutes | 3 | 6.4% |
| 10 to 14 Minutes | 0 | 0.0% |
| 15 to 19 Minutes | 15 | 31.9% |
| 20 to 24 Minutes | 0 | 0.0% |
| 25 to 29 Minutes | 0 | 0.0% |
| 30 to 34 Minutes | 0 | 0.0% |
| 35 to 39 Minutes | 0 | 0.0% |
| 40 to 44 Minutes | 8 | 17.0% |
| 45 to 59 Minutes | 0 | 0.0% |
| 60 to 89 Minutes | 0 | 0.0% |
| 90 or more Minutes | 21 | 44.7% |
Commute Time by Sex in Marble
The most common commute times in Marble are 15 to 19 minutes (15 commuters, 83.3%) for males and 90 or more minutes (21 commuters, 72.4%) for females.
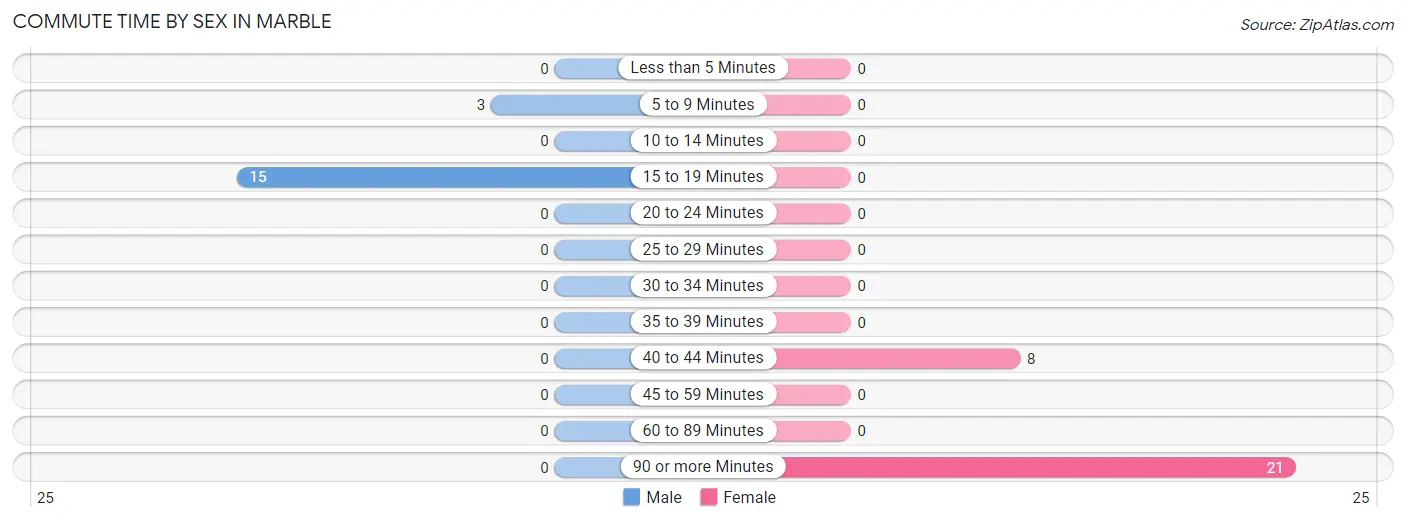
| Commute Time | Male | Female |
| Less than 5 Minutes | 0 (0.0%) | 0 (0.0%) |
| 5 to 9 Minutes | 3 (16.7%) | 0 (0.0%) |
| 10 to 14 Minutes | 0 (0.0%) | 0 (0.0%) |
| 15 to 19 Minutes | 15 (83.3%) | 0 (0.0%) |
| 20 to 24 Minutes | 0 (0.0%) | 0 (0.0%) |
| 25 to 29 Minutes | 0 (0.0%) | 0 (0.0%) |
| 30 to 34 Minutes | 0 (0.0%) | 0 (0.0%) |
| 35 to 39 Minutes | 0 (0.0%) | 0 (0.0%) |
| 40 to 44 Minutes | 0 (0.0%) | 8 (27.6%) |
| 45 to 59 Minutes | 0 (0.0%) | 0 (0.0%) |
| 60 to 89 Minutes | 0 (0.0%) | 0 (0.0%) |
| 90 or more Minutes | 0 (0.0%) | 21 (72.4%) |
Time of Departure to Work by Sex in Marble
The most frequent times of departure to work in Marble are 6:30 AM to 6:59 AM (18, 100.0%) for males and 5:00 AM to 5:29 AM (21, 72.4%) for females.
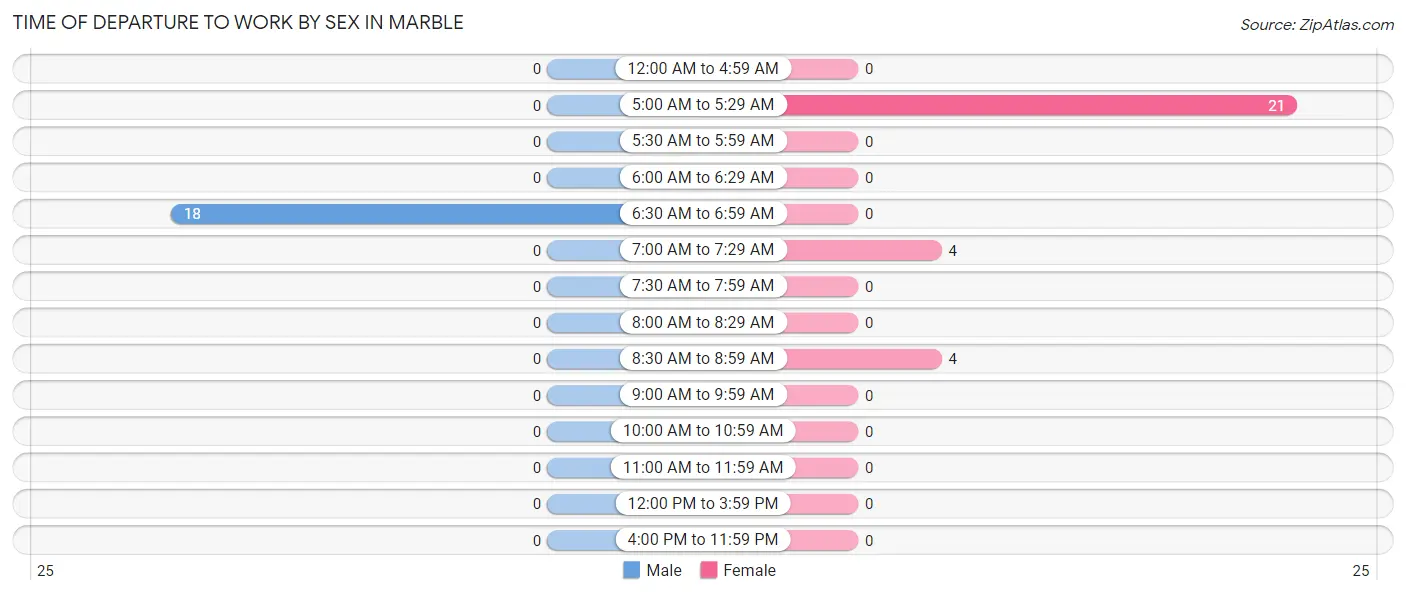
| Time of Departure | Male | Female |
| 12:00 AM to 4:59 AM | 0 (0.0%) | 0 (0.0%) |
| 5:00 AM to 5:29 AM | 0 (0.0%) | 21 (72.4%) |
| 5:30 AM to 5:59 AM | 0 (0.0%) | 0 (0.0%) |
| 6:00 AM to 6:29 AM | 0 (0.0%) | 0 (0.0%) |
| 6:30 AM to 6:59 AM | 18 (100.0%) | 0 (0.0%) |
| 7:00 AM to 7:29 AM | 0 (0.0%) | 4 (13.8%) |
| 7:30 AM to 7:59 AM | 0 (0.0%) | 0 (0.0%) |
| 8:00 AM to 8:29 AM | 0 (0.0%) | 0 (0.0%) |
| 8:30 AM to 8:59 AM | 0 (0.0%) | 4 (13.8%) |
| 9:00 AM to 9:59 AM | 0 (0.0%) | 0 (0.0%) |
| 10:00 AM to 10:59 AM | 0 (0.0%) | 0 (0.0%) |
| 11:00 AM to 11:59 AM | 0 (0.0%) | 0 (0.0%) |
| 12:00 PM to 3:59 PM | 0 (0.0%) | 0 (0.0%) |
| 4:00 PM to 11:59 PM | 0 (0.0%) | 0 (0.0%) |
| Total | 18 (100.0%) | 29 (100.0%) |
Housing Occupancy in Marble
Occupancy by Ownership in Marble
Of the total 93 dwellings in Marble, owner-occupied units account for 49 (52.7%), while renter-occupied units make up 44 (47.3%).
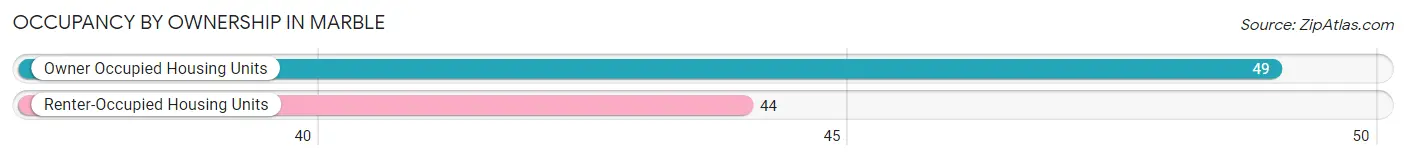
| Occupancy | # Housing Units | % Housing Units |
| Owner Occupied Housing Units | 49 | 52.7% |
| Renter-Occupied Housing Units | 44 | 47.3% |
| Total Occupied Housing Units | 93 | 100.0% |
Occupancy by Household Size in Marble
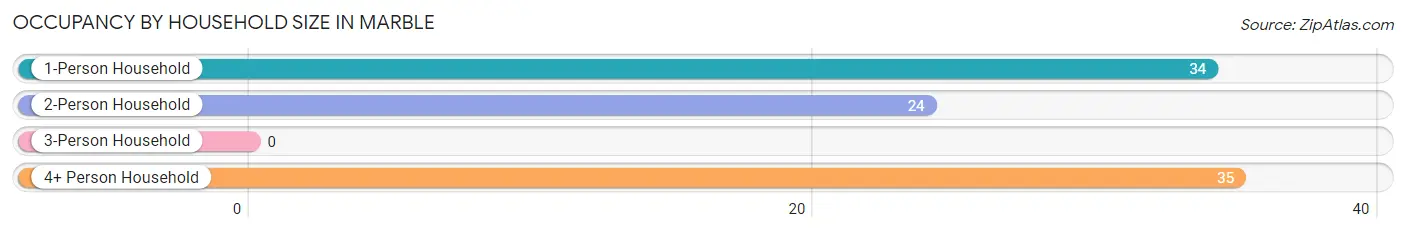
| Household Size | # Housing Units | % Housing Units |
| 1-Person Household | 34 | 36.6% |
| 2-Person Household | 24 | 25.8% |
| 3-Person Household | 0 | 0.0% |
| 4+ Person Household | 35 | 37.6% |
| Total Housing Units | 93 | 100.0% |
Occupancy by Ownership by Household Size in Marble
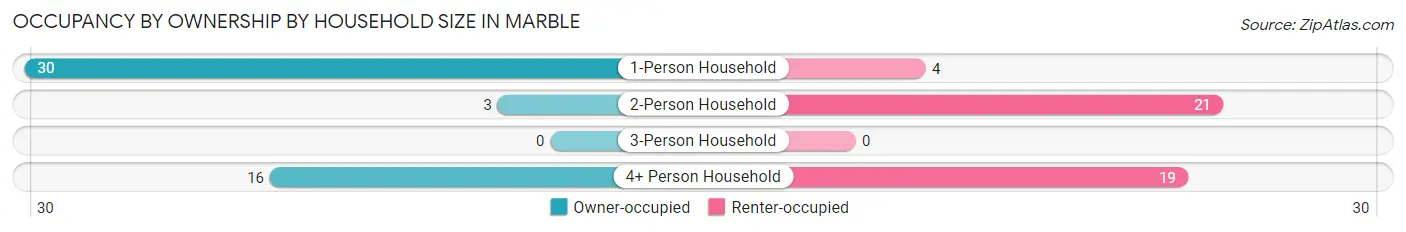
| Household Size | Owner-occupied | Renter-occupied |
| 1-Person Household | 30 (88.2%) | 4 (11.8%) |
| 2-Person Household | 3 (12.5%) | 21 (87.5%) |
| 3-Person Household | 0 (0.0%) | 0 (0.0%) |
| 4+ Person Household | 16 (45.7%) | 19 (54.3%) |
| Total Housing Units | 49 (52.7%) | 44 (47.3%) |
Occupancy by Educational Attainment in Marble
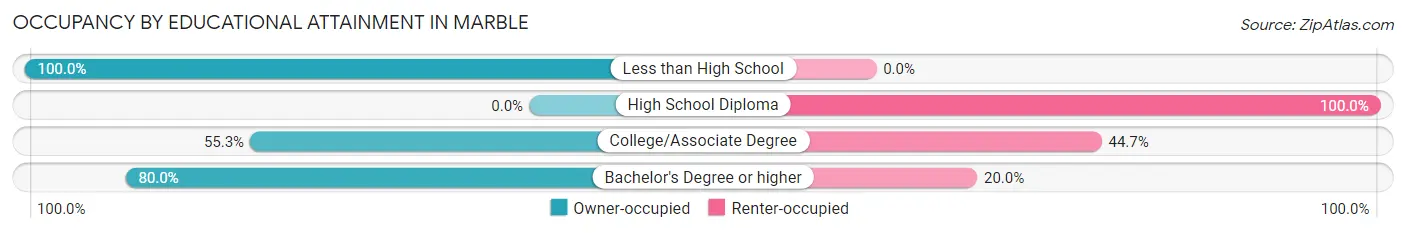
| Household Size | Owner-occupied | Renter-occupied |
| Less than High School | 7 (100.0%) | 0 (0.0%) |
| High School Diploma | 0 (0.0%) | 19 (100.0%) |
| College/Associate Degree | 26 (55.3%) | 21 (44.7%) |
| Bachelor's Degree or higher | 16 (80.0%) | 4 (20.0%) |
Occupancy by Age of Householder in Marble
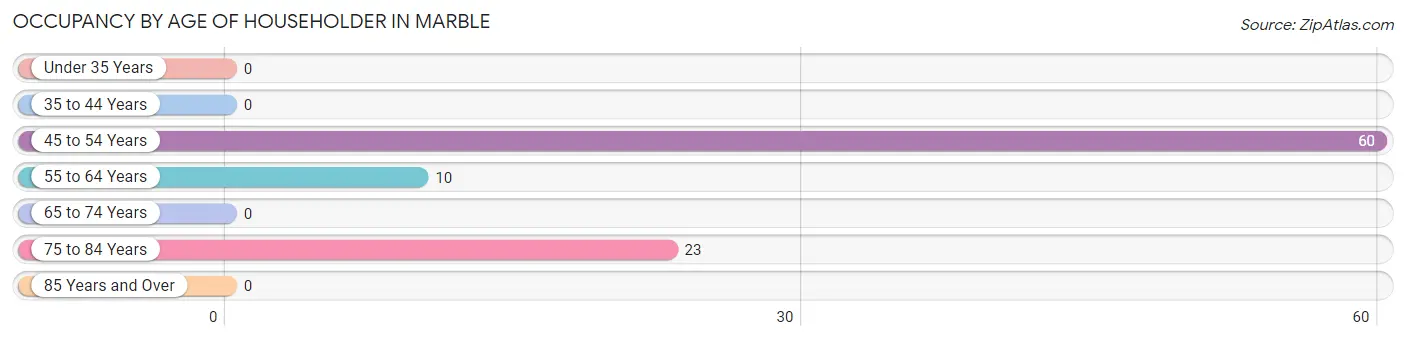
| Age Bracket | # Households | % Households |
| Under 35 Years | 0 | 0.0% |
| 35 to 44 Years | 0 | 0.0% |
| 45 to 54 Years | 60 | 64.5% |
| 55 to 64 Years | 10 | 10.7% |
| 65 to 74 Years | 0 | 0.0% |
| 75 to 84 Years | 23 | 24.7% |
| 85 Years and Over | 0 | 0.0% |
| Total | 93 | 100.0% |
Housing Finances in Marble
Median Income by Occupancy in Marble
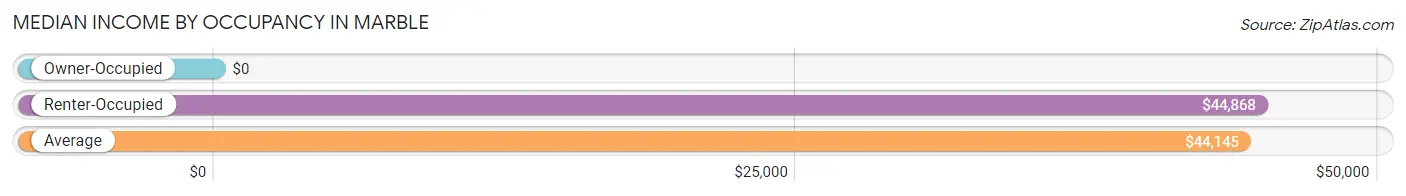
| Occupancy Type | # Households | Median Income |
| Owner-Occupied | 49 (52.7%) | $0 |
| Renter-Occupied | 44 (47.3%) | $44,868 |
| Average | 93 (100.0%) | $44,145 |
Occupancy by Householder Income Bracket in Marble
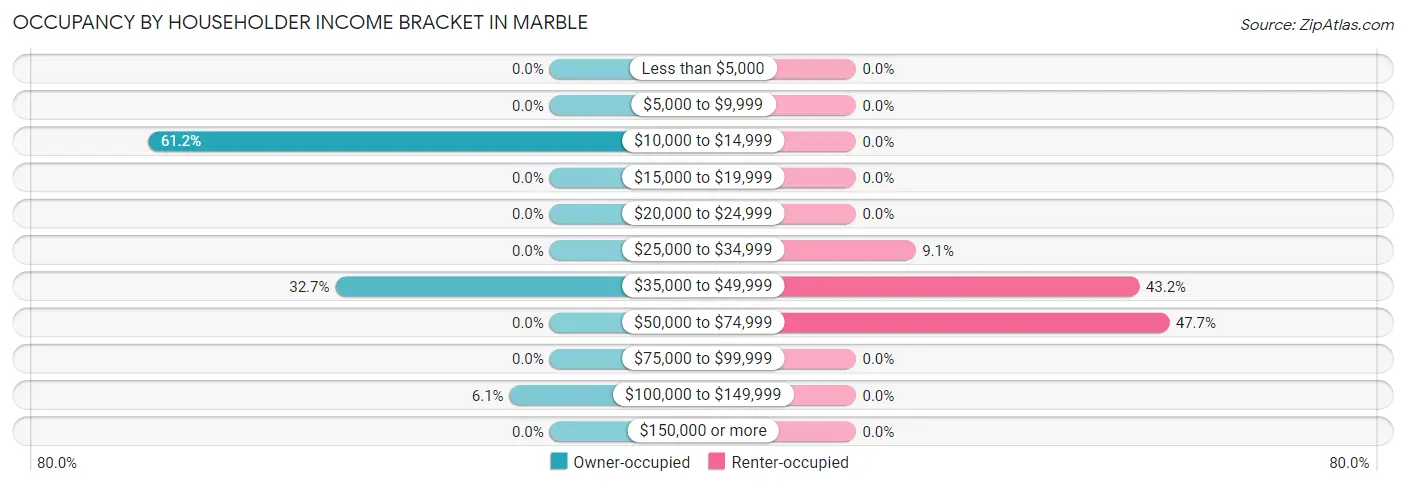
| Income Bracket | Owner-occupied | Renter-occupied |
| Less than $5,000 | 0 (0.0%) | 0 (0.0%) |
| $5,000 to $9,999 | 0 (0.0%) | 0 (0.0%) |
| $10,000 to $14,999 | 30 (61.2%) | 0 (0.0%) |
| $15,000 to $19,999 | 0 (0.0%) | 0 (0.0%) |
| $20,000 to $24,999 | 0 (0.0%) | 0 (0.0%) |
| $25,000 to $34,999 | 0 (0.0%) | 4 (9.1%) |
| $35,000 to $49,999 | 16 (32.7%) | 19 (43.2%) |
| $50,000 to $74,999 | 0 (0.0%) | 21 (47.7%) |
| $75,000 to $99,999 | 0 (0.0%) | 0 (0.0%) |
| $100,000 to $149,999 | 3 (6.1%) | 0 (0.0%) |
| $150,000 or more | 0 (0.0%) | 0 (0.0%) |
| Total | 49 (100.0%) | 44 (100.0%) |
Monthly Housing Cost Tiers in Marble
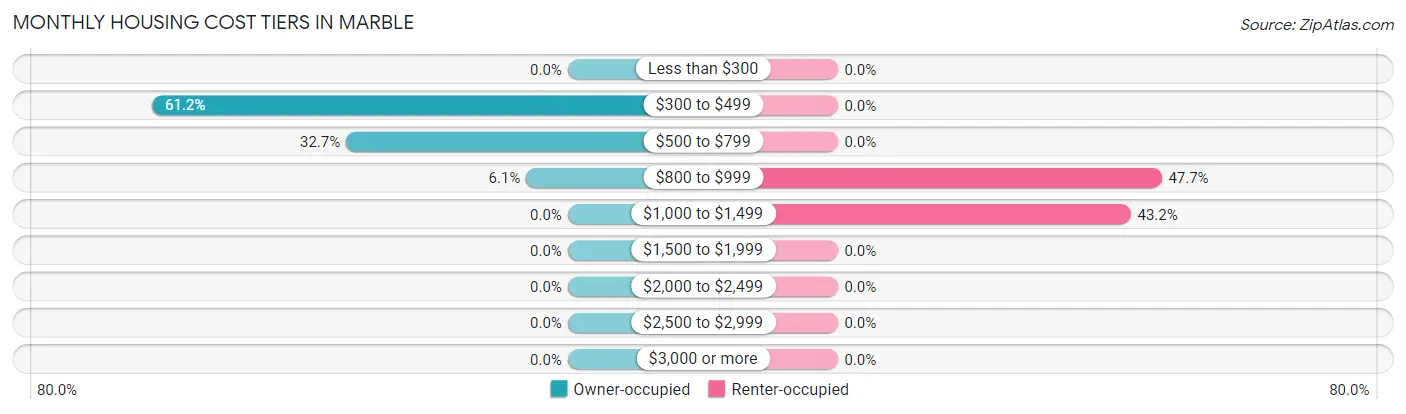
| Monthly Cost | Owner-occupied | Renter-occupied |
| Less than $300 | 0 (0.0%) | 0 (0.0%) |
| $300 to $499 | 30 (61.2%) | 0 (0.0%) |
| $500 to $799 | 16 (32.7%) | 0 (0.0%) |
| $800 to $999 | 3 (6.1%) | 21 (47.7%) |
| $1,000 to $1,499 | 0 (0.0%) | 19 (43.2%) |
| $1,500 to $1,999 | 0 (0.0%) | 0 (0.0%) |
| $2,000 to $2,499 | 0 (0.0%) | 0 (0.0%) |
| $2,500 to $2,999 | 0 (0.0%) | 0 (0.0%) |
| $3,000 or more | 0 (0.0%) | 0 (0.0%) |
| Total | 49 (100.0%) | 44 (100.0%) |
Physical Housing Characteristics in Marble
Housing Structures in Marble
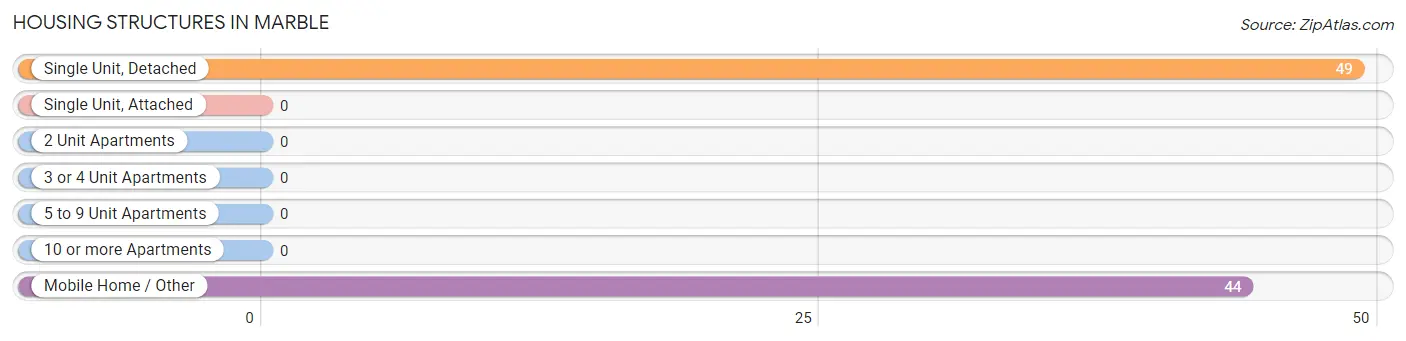
| Structure Type | # Housing Units | % Housing Units |
| Single Unit, Detached | 49 | 52.7% |
| Single Unit, Attached | 0 | 0.0% |
| 2 Unit Apartments | 0 | 0.0% |
| 3 or 4 Unit Apartments | 0 | 0.0% |
| 5 to 9 Unit Apartments | 0 | 0.0% |
| 10 or more Apartments | 0 | 0.0% |
| Mobile Home / Other | 44 | 47.3% |
| Total | 93 | 100.0% |
Housing Structures by Occupancy in Marble
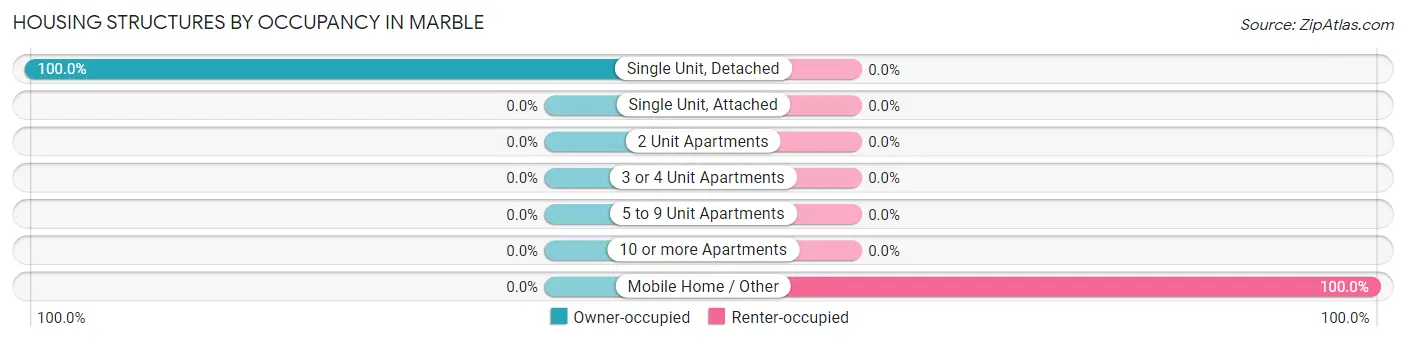
| Structure Type | Owner-occupied | Renter-occupied |
| Single Unit, Detached | 49 (100.0%) | 0 (0.0%) |
| Single Unit, Attached | 0 (0.0%) | 0 (0.0%) |
| 2 Unit Apartments | 0 (0.0%) | 0 (0.0%) |
| 3 or 4 Unit Apartments | 0 (0.0%) | 0 (0.0%) |
| 5 to 9 Unit Apartments | 0 (0.0%) | 0 (0.0%) |
| 10 or more Apartments | 0 (0.0%) | 0 (0.0%) |
| Mobile Home / Other | 0 (0.0%) | 44 (100.0%) |
| Total | 49 (52.7%) | 44 (47.3%) |
Housing Structures by Number of Rooms in Marble
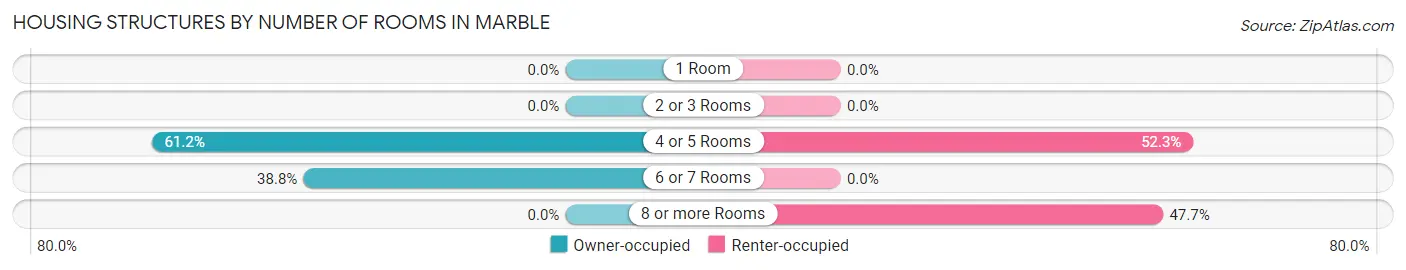
| Number of Rooms | Owner-occupied | Renter-occupied |
| 1 Room | 0 (0.0%) | 0 (0.0%) |
| 2 or 3 Rooms | 0 (0.0%) | 0 (0.0%) |
| 4 or 5 Rooms | 30 (61.2%) | 23 (52.3%) |
| 6 or 7 Rooms | 19 (38.8%) | 0 (0.0%) |
| 8 or more Rooms | 0 (0.0%) | 21 (47.7%) |
| Total | 49 (100.0%) | 44 (100.0%) |
Housing Structure by Heating Type in Marble
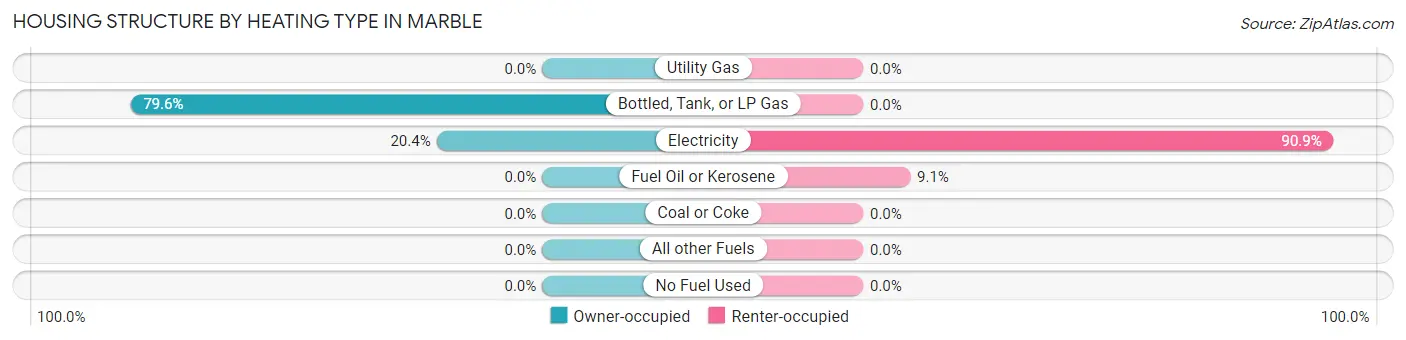
| Heating Type | Owner-occupied | Renter-occupied |
| Utility Gas | 0 (0.0%) | 0 (0.0%) |
| Bottled, Tank, or LP Gas | 39 (79.6%) | 0 (0.0%) |
| Electricity | 10 (20.4%) | 40 (90.9%) |
| Fuel Oil or Kerosene | 0 (0.0%) | 4 (9.1%) |
| Coal or Coke | 0 (0.0%) | 0 (0.0%) |
| All other Fuels | 0 (0.0%) | 0 (0.0%) |
| No Fuel Used | 0 (0.0%) | 0 (0.0%) |
| Total | 49 (100.0%) | 44 (100.0%) |
Household Vehicle Usage in Marble
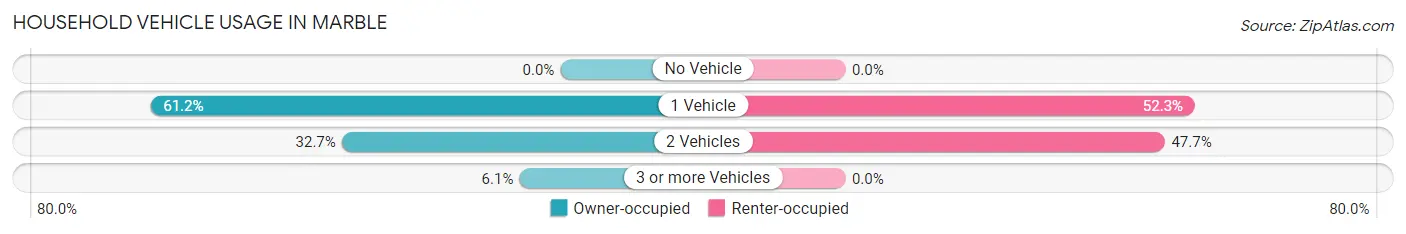
| Vehicles per Household | Owner-occupied | Renter-occupied |
| No Vehicle | 0 (0.0%) | 0 (0.0%) |
| 1 Vehicle | 30 (61.2%) | 23 (52.3%) |
| 2 Vehicles | 16 (32.7%) | 21 (47.7%) |
| 3 or more Vehicles | 3 (6.1%) | 0 (0.0%) |
| Total | 49 (100.0%) | 44 (100.0%) |
Real Estate & Mortgages in Marble
Real Estate and Mortgage Overview in Marble
| Characteristic | Without Mortgage | With Mortgage |
| Housing Units | 23 | 26 |
| Median Property Value | - | - |
| Median Household Income | - | - |
| Monthly Housing Costs | - | - |
| Real Estate Taxes | - | - |
Property Value by Mortgage Status in Marble
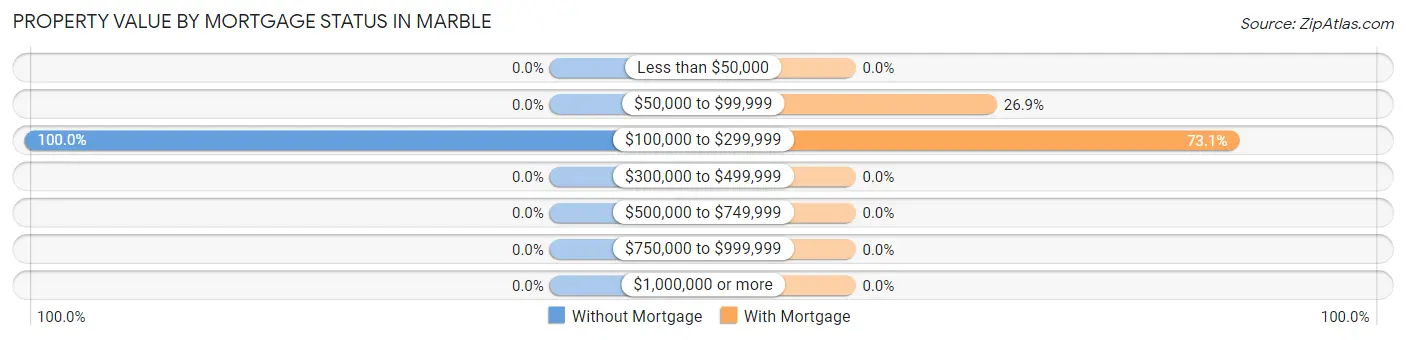
| Property Value | Without Mortgage | With Mortgage |
| Less than $50,000 | 0 (0.0%) | 0 (0.0%) |
| $50,000 to $99,999 | 0 (0.0%) | 7 (26.9%) |
| $100,000 to $299,999 | 23 (100.0%) | 19 (73.1%) |
| $300,000 to $499,999 | 0 (0.0%) | 0 (0.0%) |
| $500,000 to $749,999 | 0 (0.0%) | 0 (0.0%) |
| $750,000 to $999,999 | 0 (0.0%) | 0 (0.0%) |
| $1,000,000 or more | 0 (0.0%) | 0 (0.0%) |
| Total | 23 (100.0%) | 26 (100.0%) |
Household Income by Mortgage Status in Marble
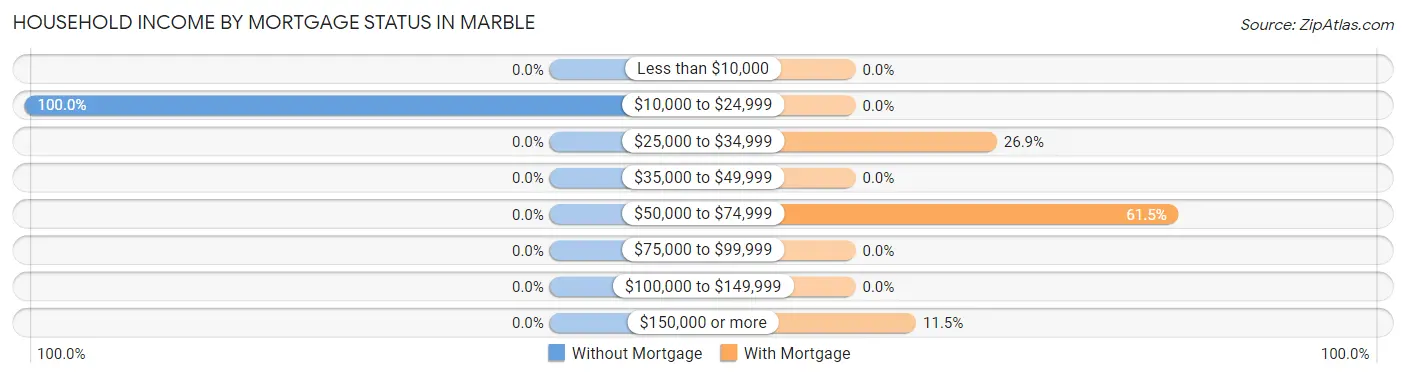
| Household Income | Without Mortgage | With Mortgage |
| Less than $10,000 | 0 (0.0%) | 0 (0.0%) |
| $10,000 to $24,999 | 23 (100.0%) | 0 (0.0%) |
| $25,000 to $34,999 | 0 (0.0%) | 7 (26.9%) |
| $35,000 to $49,999 | 0 (0.0%) | 0 (0.0%) |
| $50,000 to $74,999 | 0 (0.0%) | 16 (61.5%) |
| $75,000 to $99,999 | 0 (0.0%) | 0 (0.0%) |
| $100,000 to $149,999 | 0 (0.0%) | 0 (0.0%) |
| $150,000 or more | 0 (0.0%) | 3 (11.5%) |
| Total | 23 (100.0%) | 26 (100.0%) |
Property Value to Household Income Ratio in Marble
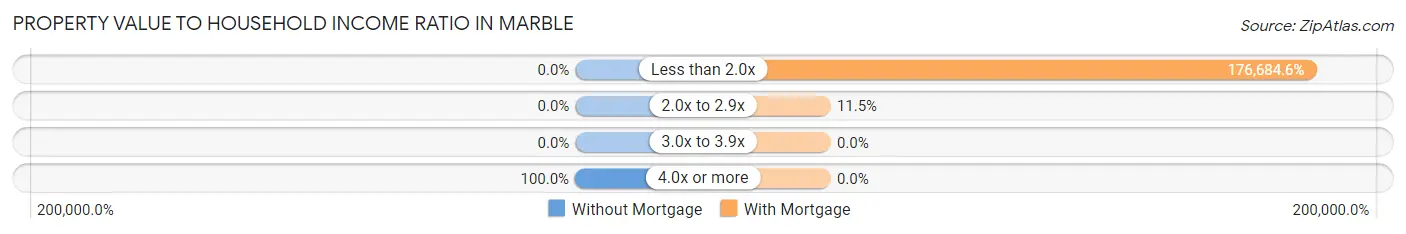
| Value-to-Income Ratio | Without Mortgage | With Mortgage |
| Less than 2.0x | 0 (0.0%) | 45,938 (176,684.6%) |
| 2.0x to 2.9x | 0 (0.0%) | 3 (11.5%) |
| 3.0x to 3.9x | 0 (0.0%) | 0 (0.0%) |
| 4.0x or more | 23 (100.0%) | 0 (0.0%) |
| Total | 23 (100.0%) | 26 (100.0%) |
Real Estate Taxes by Mortgage Status in Marble
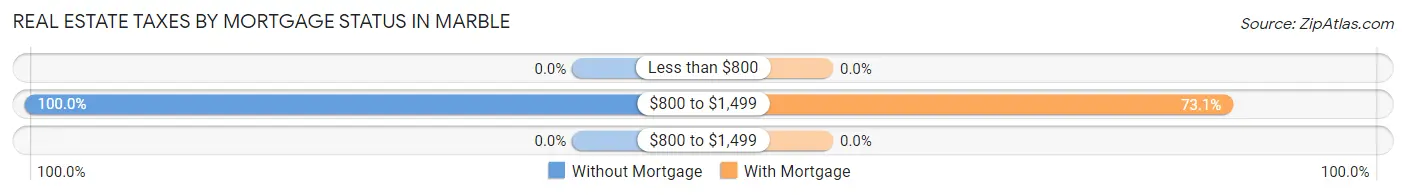
| Property Taxes | Without Mortgage | With Mortgage |
| Less than $800 | 0 (0.0%) | 0 (0.0%) |
| $800 to $1,499 | 23 (100.0%) | 19 (73.1%) |
| $800 to $1,499 | 0 (0.0%) | 0 (0.0%) |
| Total | 23 (100.0%) | 26 (100.0%) |
Health & Disability in Marble
Health Insurance Coverage by Age in Marble
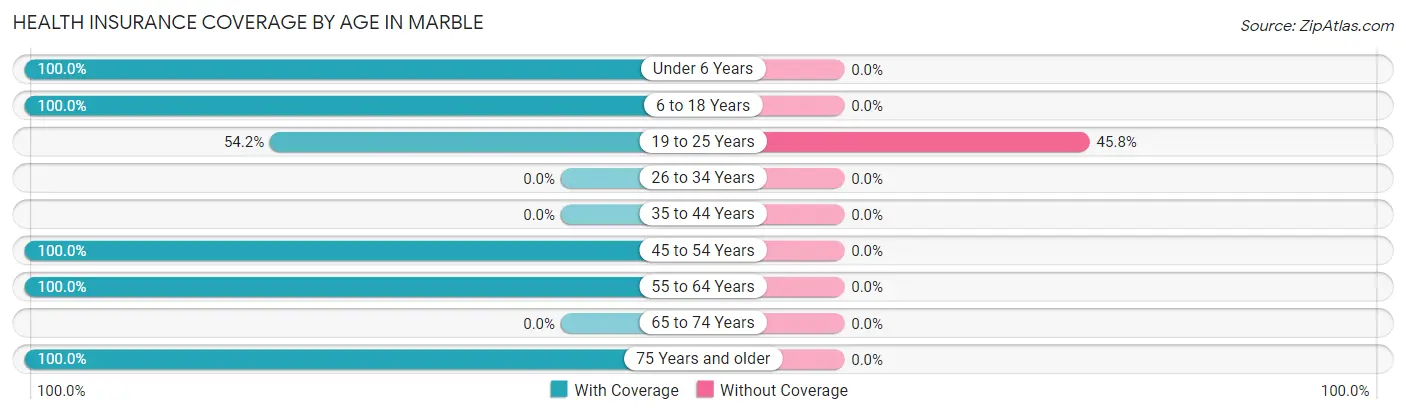
| Age Bracket | With Coverage | Without Coverage |
| Under 6 Years | 29 (100.0%) | 0 (0.0%) |
| 6 to 18 Years | 62 (100.0%) | 0 (0.0%) |
| 19 to 25 Years | 32 (54.2%) | 27 (45.8%) |
| 26 to 34 Years | 0 (0.0%) | 0 (0.0%) |
| 35 to 44 Years | 0 (0.0%) | 0 (0.0%) |
| 45 to 54 Years | 75 (100.0%) | 0 (0.0%) |
| 55 to 64 Years | 34 (100.0%) | 0 (0.0%) |
| 65 to 74 Years | 0 (0.0%) | 0 (0.0%) |
| 75 Years and older | 23 (100.0%) | 0 (0.0%) |
| Total | 255 (90.4%) | 27 (9.6%) |
Health Insurance Coverage by Citizenship Status in Marble
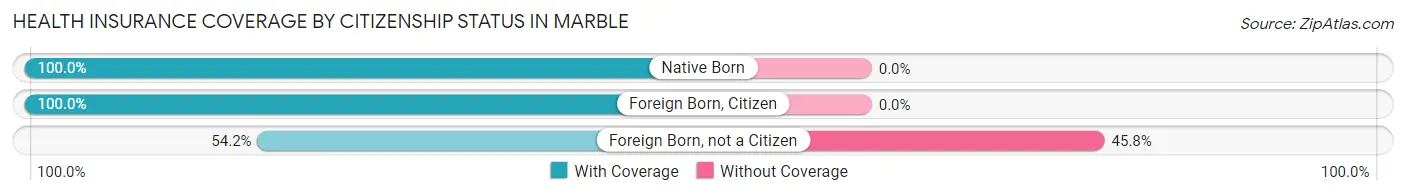
| Citizenship Status | With Coverage | Without Coverage |
| Native Born | 29 (100.0%) | 0 (0.0%) |
| Foreign Born, Citizen | 62 (100.0%) | 0 (0.0%) |
| Foreign Born, not a Citizen | 32 (54.2%) | 27 (45.8%) |
Health Insurance Coverage by Household Income in Marble
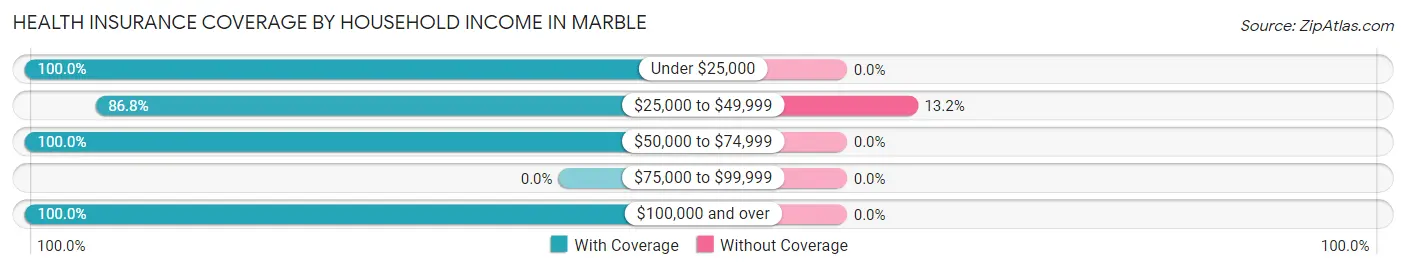
| Household Income | With Coverage | Without Coverage |
| Under $25,000 | 30 (100.0%) | 0 (0.0%) |
| $25,000 to $49,999 | 177 (86.8%) | 27 (13.2%) |
| $50,000 to $74,999 | 41 (100.0%) | 0 (0.0%) |
| $75,000 to $99,999 | 0 (0.0%) | 0 (0.0%) |
| $100,000 and over | 7 (100.0%) | 0 (0.0%) |
Public vs Private Health Insurance Coverage by Age in Marble
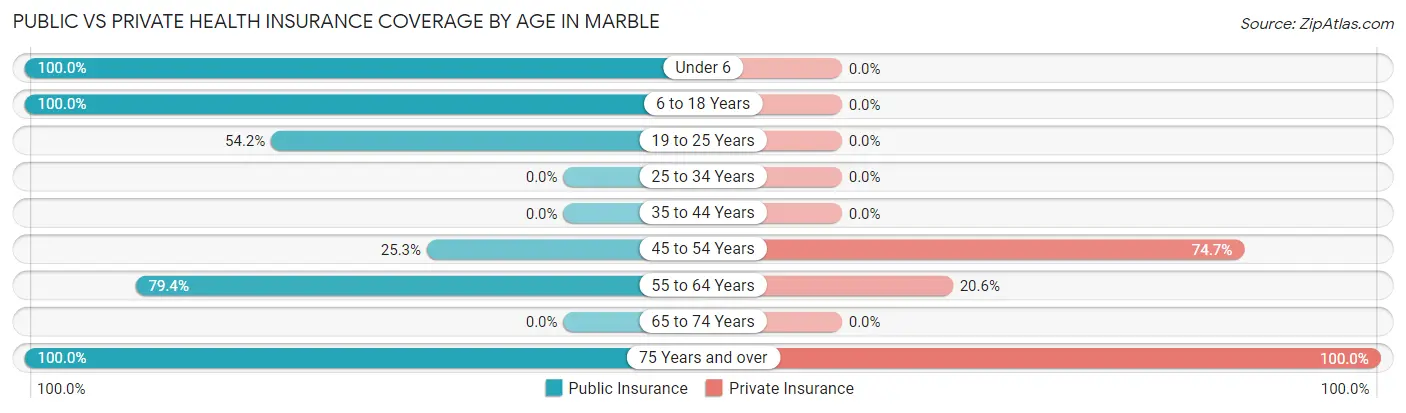
| Age Bracket | Public Insurance | Private Insurance |
| Under 6 | 29 (100.0%) | 0 (0.0%) |
| 6 to 18 Years | 62 (100.0%) | 0 (0.0%) |
| 19 to 25 Years | 32 (54.2%) | 0 (0.0%) |
| 25 to 34 Years | 0 (0.0%) | 0 (0.0%) |
| 35 to 44 Years | 0 (0.0%) | 0 (0.0%) |
| 45 to 54 Years | 19 (25.3%) | 56 (74.7%) |
| 55 to 64 Years | 27 (79.4%) | 7 (20.6%) |
| 65 to 74 Years | 0 (0.0%) | 0 (0.0%) |
| 75 Years and over | 23 (100.0%) | 23 (100.0%) |
| Total | 192 (68.1%) | 86 (30.5%) |
Disability Status by Sex by Age in Marble
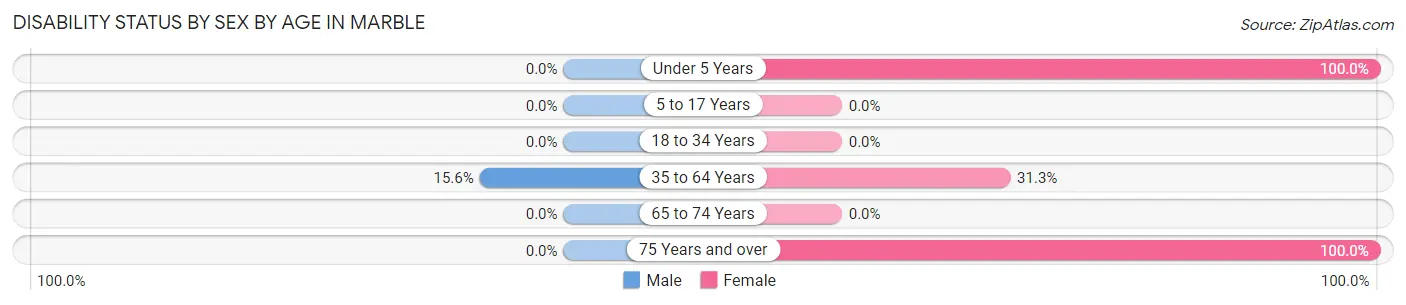
| Age Bracket | Male | Female |
| Under 5 Years | 0 (0.0%) | 11 (100.0%) |
| 5 to 17 Years | 0 (0.0%) | 0 (0.0%) |
| 18 to 34 Years | 0 (0.0%) | 0 (0.0%) |
| 35 to 64 Years | 7 (15.6%) | 20 (31.2%) |
| 65 to 74 Years | 0 (0.0%) | 0 (0.0%) |
| 75 Years and over | 0 (0.0%) | 23 (100.0%) |
Disability Class by Sex by Age in Marble
Disability Class: Hearing Difficulty
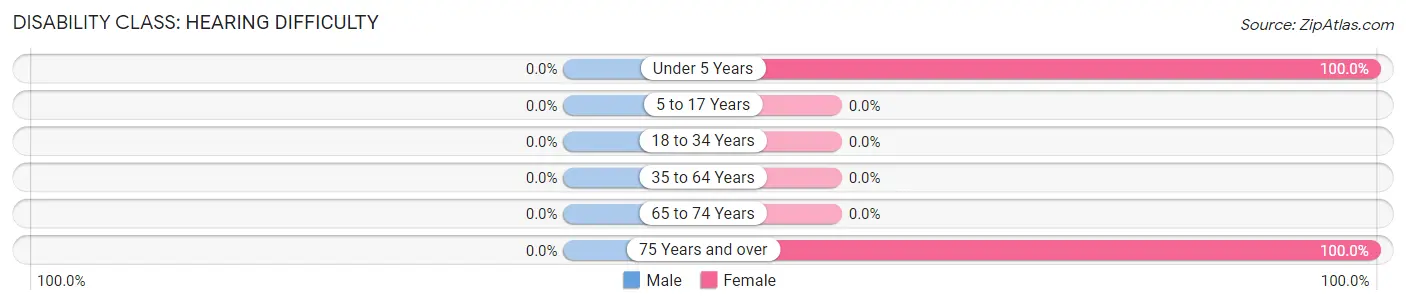
| Age Bracket | Male | Female |
| Under 5 Years | 0 (0.0%) | 11 (100.0%) |
| 5 to 17 Years | 0 (0.0%) | 0 (0.0%) |
| 18 to 34 Years | 0 (0.0%) | 0 (0.0%) |
| 35 to 64 Years | 0 (0.0%) | 0 (0.0%) |
| 65 to 74 Years | 0 (0.0%) | 0 (0.0%) |
| 75 Years and over | 0 (0.0%) | 23 (100.0%) |
Disability Class: Vision Difficulty
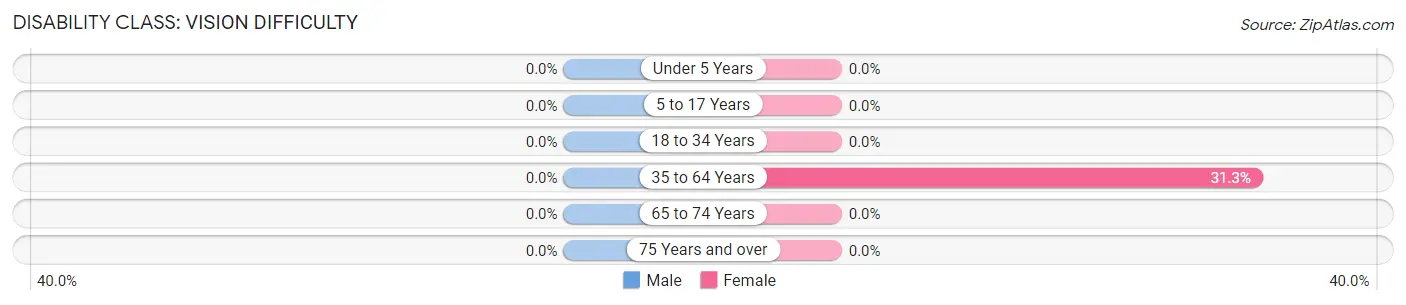
| Age Bracket | Male | Female |
| Under 5 Years | 0 (0.0%) | 0 (0.0%) |
| 5 to 17 Years | 0 (0.0%) | 0 (0.0%) |
| 18 to 34 Years | 0 (0.0%) | 0 (0.0%) |
| 35 to 64 Years | 0 (0.0%) | 20 (31.2%) |
| 65 to 74 Years | 0 (0.0%) | 0 (0.0%) |
| 75 Years and over | 0 (0.0%) | 0 (0.0%) |
Disability Class: Cognitive Difficulty
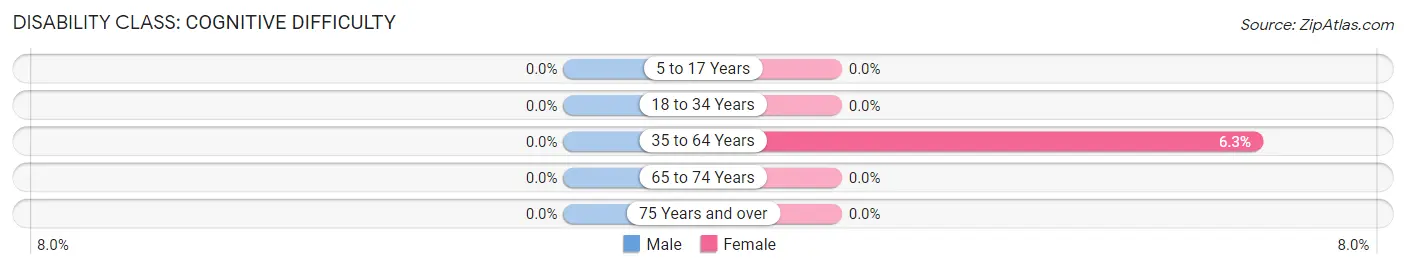
| Age Bracket | Male | Female |
| 5 to 17 Years | 0 (0.0%) | 0 (0.0%) |
| 18 to 34 Years | 0 (0.0%) | 0 (0.0%) |
| 35 to 64 Years | 0 (0.0%) | 4 (6.2%) |
| 65 to 74 Years | 0 (0.0%) | 0 (0.0%) |
| 75 Years and over | 0 (0.0%) | 0 (0.0%) |
Disability Class: Ambulatory Difficulty
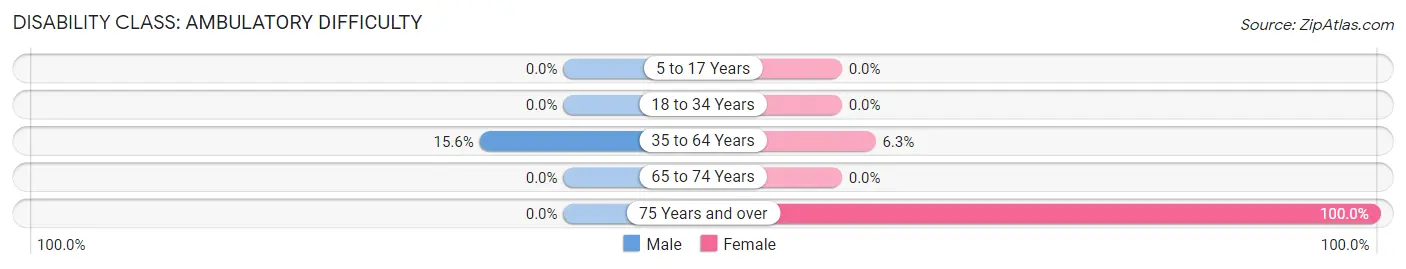
| Age Bracket | Male | Female |
| 5 to 17 Years | 0 (0.0%) | 0 (0.0%) |
| 18 to 34 Years | 0 (0.0%) | 0 (0.0%) |
| 35 to 64 Years | 7 (15.6%) | 4 (6.2%) |
| 65 to 74 Years | 0 (0.0%) | 0 (0.0%) |
| 75 Years and over | 0 (0.0%) | 23 (100.0%) |
Disability Class: Self-Care Difficulty
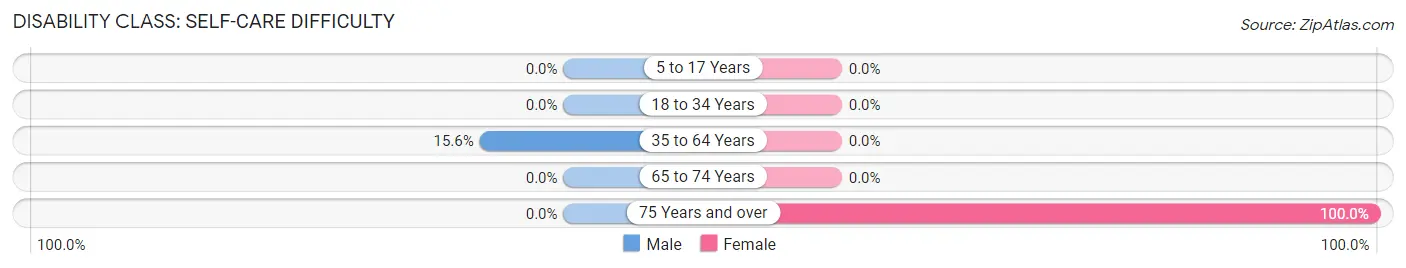
| Age Bracket | Male | Female |
| 5 to 17 Years | 0 (0.0%) | 0 (0.0%) |
| 18 to 34 Years | 0 (0.0%) | 0 (0.0%) |
| 35 to 64 Years | 7 (15.6%) | 0 (0.0%) |
| 65 to 74 Years | 0 (0.0%) | 0 (0.0%) |
| 75 Years and over | 0 (0.0%) | 23 (100.0%) |
Technology Access in Marble
Computing Device Access in Marble
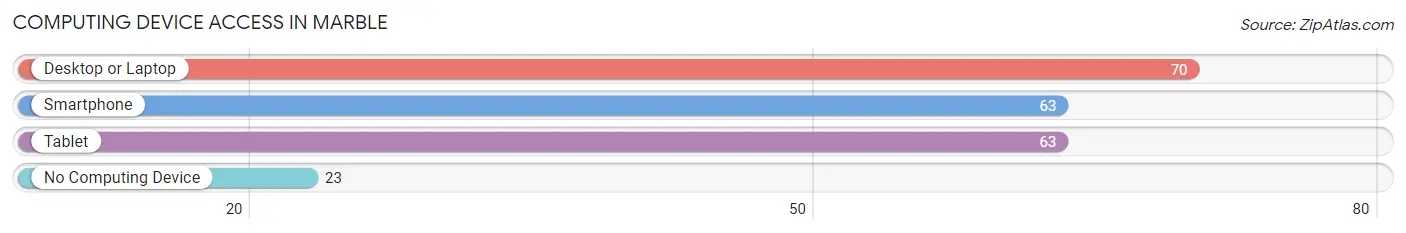
| Device Type | # Households | % Households |
| Desktop or Laptop | 70 | 75.3% |
| Smartphone | 63 | 67.7% |
| Tablet | 63 | 67.7% |
| No Computing Device | 23 | 24.7% |
| Total | 93 | 100.0% |
Internet Access in Marble
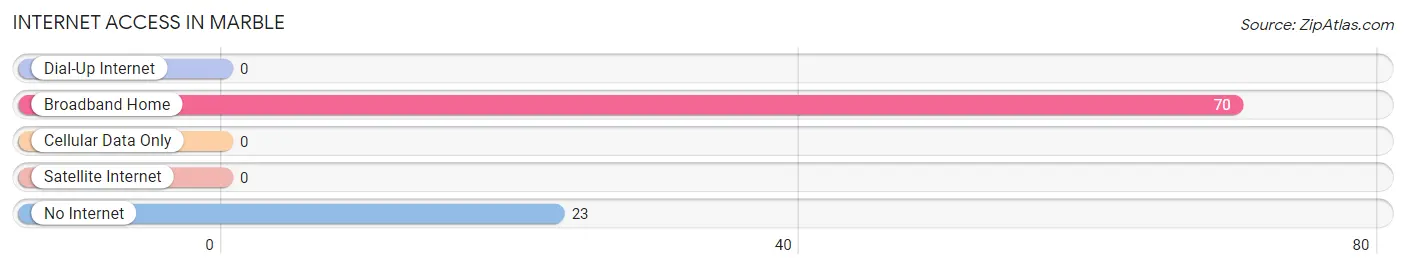
| Internet Type | # Households | % Households |
| Dial-Up Internet | 0 | 0.0% |
| Broadband Home | 70 | 75.3% |
| Cellular Data Only | 0 | 0.0% |
| Satellite Internet | 0 | 0.0% |
| No Internet | 23 | 24.7% |
| Total | 93 | 100.0% |
Marble Summary
Marble, North Carolina is a small town located in the western part of the state, in the foothills of the Appalachian Mountains. It is situated in the county of McDowell, and is part of the Hickory-Lenoir-Morganton Metropolitan Statistical Area. The town has a population of just over 1,000 people, and is known for its rich history and culture.
Geography
Marble is located in the foothills of the Appalachian Mountains, and is surrounded by the Catawba River and the Linville River. The town is situated at an elevation of 1,400 feet, and is located in the Blue Ridge Mountains. The town is located in the Piedmont region of North Carolina, and is part of the Hickory-Lenoir-Morganton Metropolitan Statistical Area. The town is located approximately 40 miles from Asheville, and is accessible by US Highway 70.
History
Marble was first settled in the late 1700s by settlers from Scotland and Ireland. The town was originally known as “Marbletown”, and was named after the abundance of marble in the area. The town was incorporated in 1891, and was home to a thriving marble industry. The town was also home to a number of other industries, including a cotton mill, a furniture factory, and a brickyard.
Economy
Marble’s economy is largely based on tourism, as the town is home to a number of attractions, including the McDowell County Historical Museum, the McDowell County Courthouse, and the McDowell County Library. The town is also home to a number of small businesses, including restaurants, shops, and galleries. The town is also home to a number of manufacturing companies, including a furniture factory and a brickyard.
Demographics
As of the 2010 census, the population of Marble was 1,039. The racial makeup of the town was 95.3% White, 1.2% African American, 0.3% Native American, 0.2% Asian, 0.1% Pacific Islander, and 2.9% from other races. The median household income in Marble was $30,938, and the median family income was $37,917. The town has a poverty rate of 22.3%.
Marble is a small town with a rich history and culture. The town is home to a number of attractions, and is a popular tourist destination. The town is also home to a number of small businesses, and is a great place to live and work. Marble is a great place to visit, and is a great place to call home.
Common Questions
What is Per Capita Income in Marble?
Per Capita income in Marble is $14,348.
What is the Median Family Income in Marble?
Median Family Income in Marble is $46,641.
What is the Median Household income in Marble?
Median Household Income in Marble is $44,145.
What is Inequality or Gini Index in Marble?
Inequality or Gini Index in Marble is 0.30.
What is the Total Population of Marble?
Total Population of Marble is 282.
What is the Total Male Population of Marble?
Total Male Population of Marble is 90.
What is the Total Female Population of Marble?
Total Female Population of Marble is 192.
What is the Ratio of Males per 100 Females in Marble?
There are 46.88 Males per 100 Females in Marble.
What is the Ratio of Females per 100 Males in Marble?
There are 213.33 Females per 100 Males in Marble.
What is the Median Population Age in Marble?
Median Population Age in Marble is 25.7 Years.
What is the Average Family Size in Marble
Average Family Size in Marble is 4.2 People.
What is the Average Household Size in Marble
Average Household Size in Marble is 3.0 People.
How Large is the Labor Force in Marble?
There are 125 People in the Labor Forcein in Marble.
What is the Percentage of People in the Labor Force in Marble?
65.4% of People are in the Labor Force in Marble.
What is the Unemployment Rate in Marble?
Unemployment Rate in Marble is 47.2%.