Zip Codes with the Highest Percentage of Population Employed in Food Preparation & Serving in Roxboro, NC
RELATED REPORTS & OPTIONS
Food Preparation & Serving
Roxboro
Compare Zip Codes
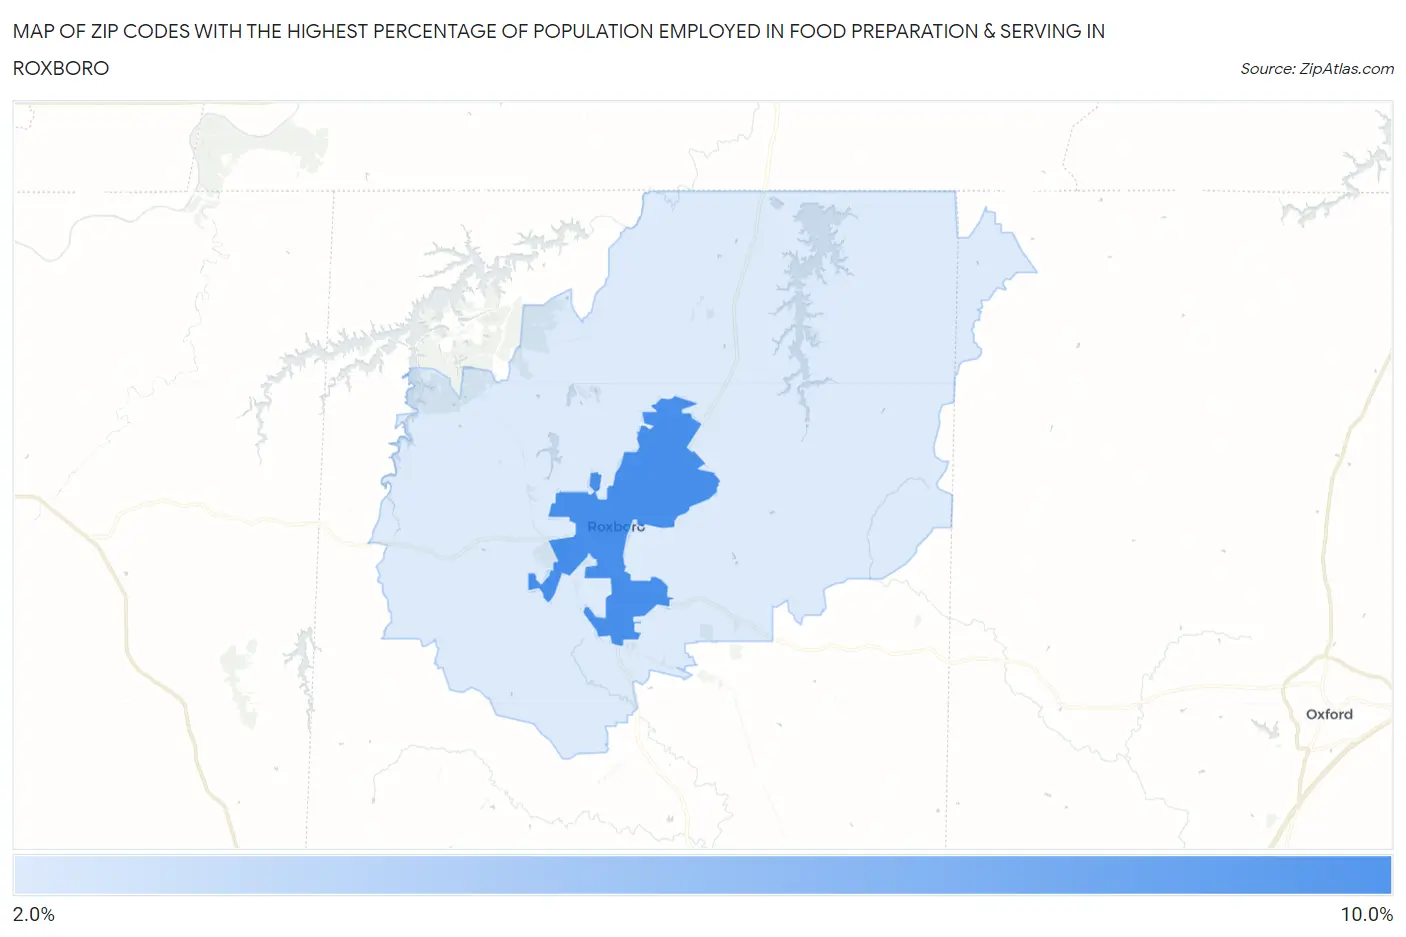
Map of Zip Codes with the Highest Percentage of Population Employed in Food Preparation & Serving in Roxboro
2.8%
9.8%
Zip Codes with the Highest Percentage of Population Employed in Food Preparation & Serving in Roxboro, NC
| Zip Code | % Employed | vs State | vs National | |
| 1. | 27573 | 9.8% | 5.3%(+4.52)#71 | 5.3%(+4.52)#2,788 |
| 2. | 27574 | 2.8% | 5.3%(-2.48)#607 | 5.3%(-2.48)#22,032 |
1
Common Questions
What are the Top Zip Codes with the Highest Percentage of Population Employed in Food Preparation & Serving in Roxboro, NC?
Top Zip Codes with the Highest Percentage of Population Employed in Food Preparation & Serving in Roxboro, NC are:
What zip code has the Highest Percentage of Population Employed in Food Preparation & Serving in Roxboro, NC?
27573 has the Highest Percentage of Population Employed in Food Preparation & Serving in Roxboro, NC with 9.8%.
What is the Percentage of Population Employed in Food Preparation & Serving in Roxboro, NC?
Percentage of Population Employed in Food Preparation & Serving in Roxboro is 11.6%.
What is the Percentage of Population Employed in Food Preparation & Serving in North Carolina?
Percentage of Population Employed in Food Preparation & Serving in North Carolina is 5.3%.
What is the Percentage of Population Employed in Food Preparation & Serving in the United States?
Percentage of Population Employed in Food Preparation & Serving in the United States is 5.3%.