Zip Codes with the Highest Percentage of Population Employed in Food Preparation & Serving in Mooresville, NC
RELATED REPORTS & OPTIONS
Food Preparation & Serving
Mooresville
Compare Zip Codes
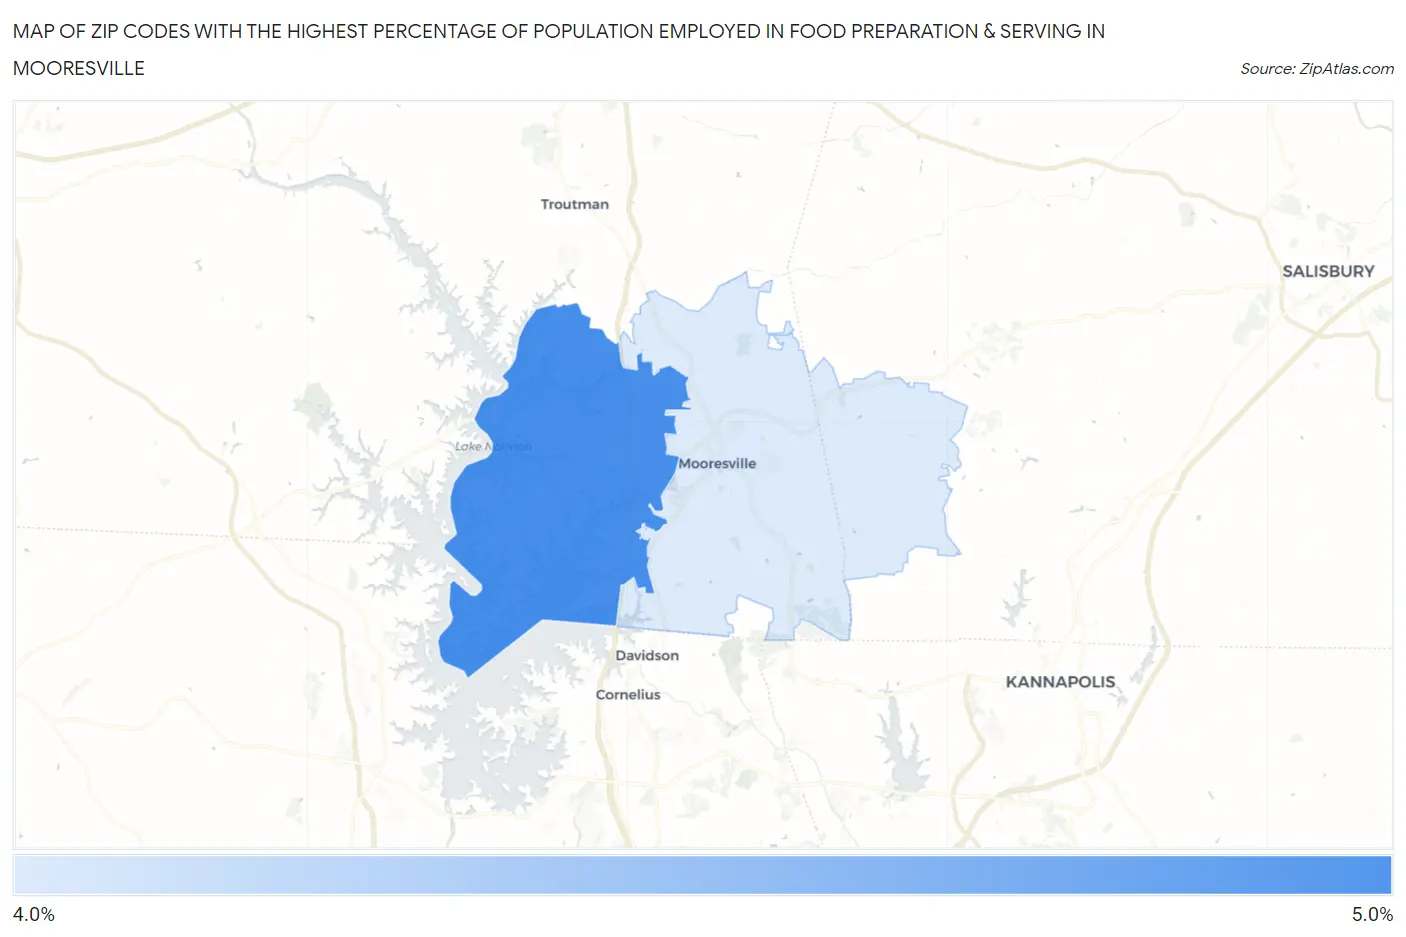
Map of Zip Codes with the Highest Percentage of Population Employed in Food Preparation & Serving in Mooresville
4.2%
4.7%
Zip Codes with the Highest Percentage of Population Employed in Food Preparation & Serving in Mooresville, NC
| Zip Code | % Employed | vs State | vs National | |
| 1. | 28117 | 4.7% | 5.3%(-0.600)#395 | 5.3%(-0.596)#14,193 |
| 2. | 28115 | 4.2% | 5.3%(-1.06)#447 | 5.3%(-1.06)#16,204 |
1
Common Questions
What are the Top Zip Codes with the Highest Percentage of Population Employed in Food Preparation & Serving in Mooresville, NC?
Top Zip Codes with the Highest Percentage of Population Employed in Food Preparation & Serving in Mooresville, NC are:
What zip code has the Highest Percentage of Population Employed in Food Preparation & Serving in Mooresville, NC?
28117 has the Highest Percentage of Population Employed in Food Preparation & Serving in Mooresville, NC with 4.7%.
What is the Percentage of Population Employed in Food Preparation & Serving in Mooresville, NC?
Percentage of Population Employed in Food Preparation & Serving in Mooresville is 3.9%.
What is the Percentage of Population Employed in Food Preparation & Serving in North Carolina?
Percentage of Population Employed in Food Preparation & Serving in North Carolina is 5.3%.
What is the Percentage of Population Employed in Food Preparation & Serving in the United States?
Percentage of Population Employed in Food Preparation & Serving in the United States is 5.3%.