Zip Codes with the Highest Percentage of Population Employed in Food Preparation & Serving in Burlington, NC
RELATED REPORTS & OPTIONS
Food Preparation & Serving
Burlington
Compare Zip Codes
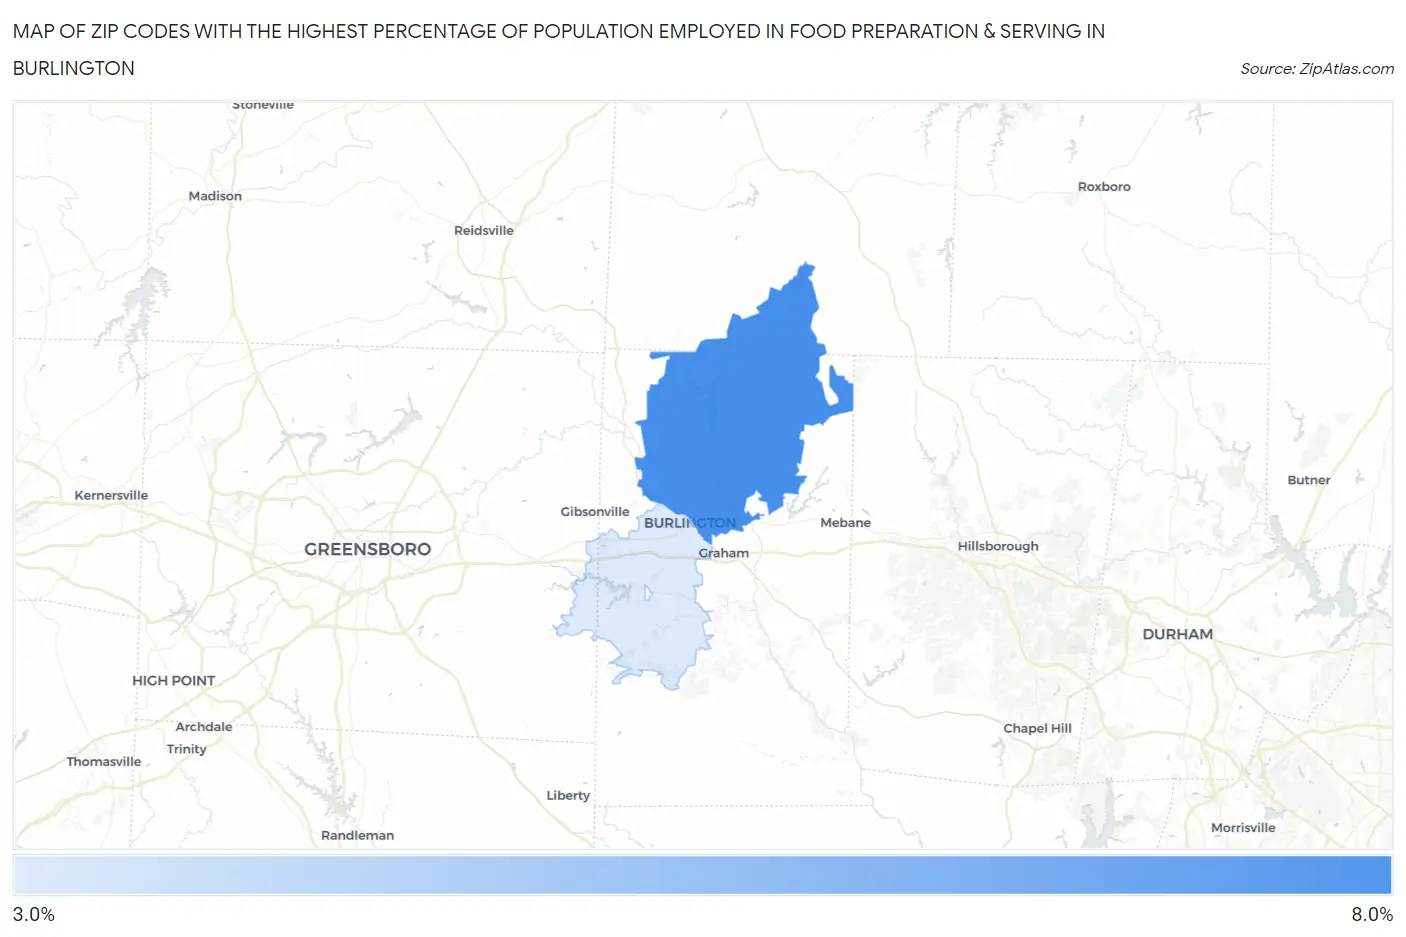
Map of Zip Codes with the Highest Percentage of Population Employed in Food Preparation & Serving in Burlington
3.9%
6.6%
Zip Codes with the Highest Percentage of Population Employed in Food Preparation & Serving in Burlington, NC
| Zip Code | % Employed | vs State | vs National | |
| 1. | 27217 | 6.6% | 5.3%(+1.31)#194 | 5.3%(+1.32)#7,595 |
| 2. | 27215 | 3.9% | 5.3%(-1.43)#487 | 5.3%(-1.43)#17,707 |
1
Common Questions
What are the Top Zip Codes with the Highest Percentage of Population Employed in Food Preparation & Serving in Burlington, NC?
Top Zip Codes with the Highest Percentage of Population Employed in Food Preparation & Serving in Burlington, NC are:
What zip code has the Highest Percentage of Population Employed in Food Preparation & Serving in Burlington, NC?
27217 has the Highest Percentage of Population Employed in Food Preparation & Serving in Burlington, NC with 6.6%.
What is the Percentage of Population Employed in Food Preparation & Serving in Burlington, NC?
Percentage of Population Employed in Food Preparation & Serving in Burlington is 6.2%.
What is the Percentage of Population Employed in Food Preparation & Serving in North Carolina?
Percentage of Population Employed in Food Preparation & Serving in North Carolina is 5.3%.
What is the Percentage of Population Employed in Food Preparation & Serving in the United States?
Percentage of Population Employed in Food Preparation & Serving in the United States is 5.3%.