Northwest, NC Map & Demographics
Northwest Map
Northwest Overview
$22,615
PER CAPITA INCOME
$31,750
AVG HOUSEHOLD INCOME
17.8%
WAGE / INCOME GAP [ % ]
82.2¢/ $1
WAGE / INCOME GAP [ $ ]
0.43
INEQUALITY / GINI INDEX
769
TOTAL POPULATION
307
MALE POPULATION
462
FEMALE POPULATION
66.45
MALES / 100 FEMALES
150.49
FEMALES / 100 MALES
52.5
MEDIAN AGE
2.9
AVG FAMILY SIZE
2.2
AVG HOUSEHOLD SIZE
379
LABOR FORCE [ PEOPLE ]
56.0%
PERCENT IN LABOR FORCE
10.8%
UNEMPLOYMENT RATE
Northwest Area Codes
Income in Northwest
Income Overview in Northwest
| Characteristic | Number | Measure |
| Per Capita Income | 769 | $22,615 |
| Median Family Income | 219 | $0 |
| Mean Family Income | 219 | $60,069 |
| Median Household Income | 342 | $31,750 |
| Mean Household Income | 342 | $49,967 |
| Income Deficit | 219 | $0 |
| Wage / Income Gap (%) | 769 | 17.79% |
| Wage / Income Gap ($) | 769 | 82.21¢ per $1 |
| Gini / Inequality Index | 769 | 0.43 |
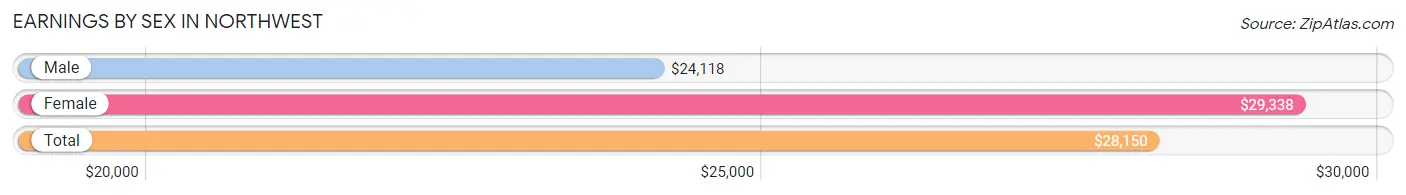
Earnings by Sex in Northwest
Average Earnings in Northwest are $28,150, $24,118 for men and $29,338 for women, a difference of 17.8%.
| Sex | Number | Average Earnings |
| Male | 150 (41.1%) | $24,118 |
| Female | 215 (58.9%) | $29,338 |
| Total | 365 (100.0%) | $28,150 |
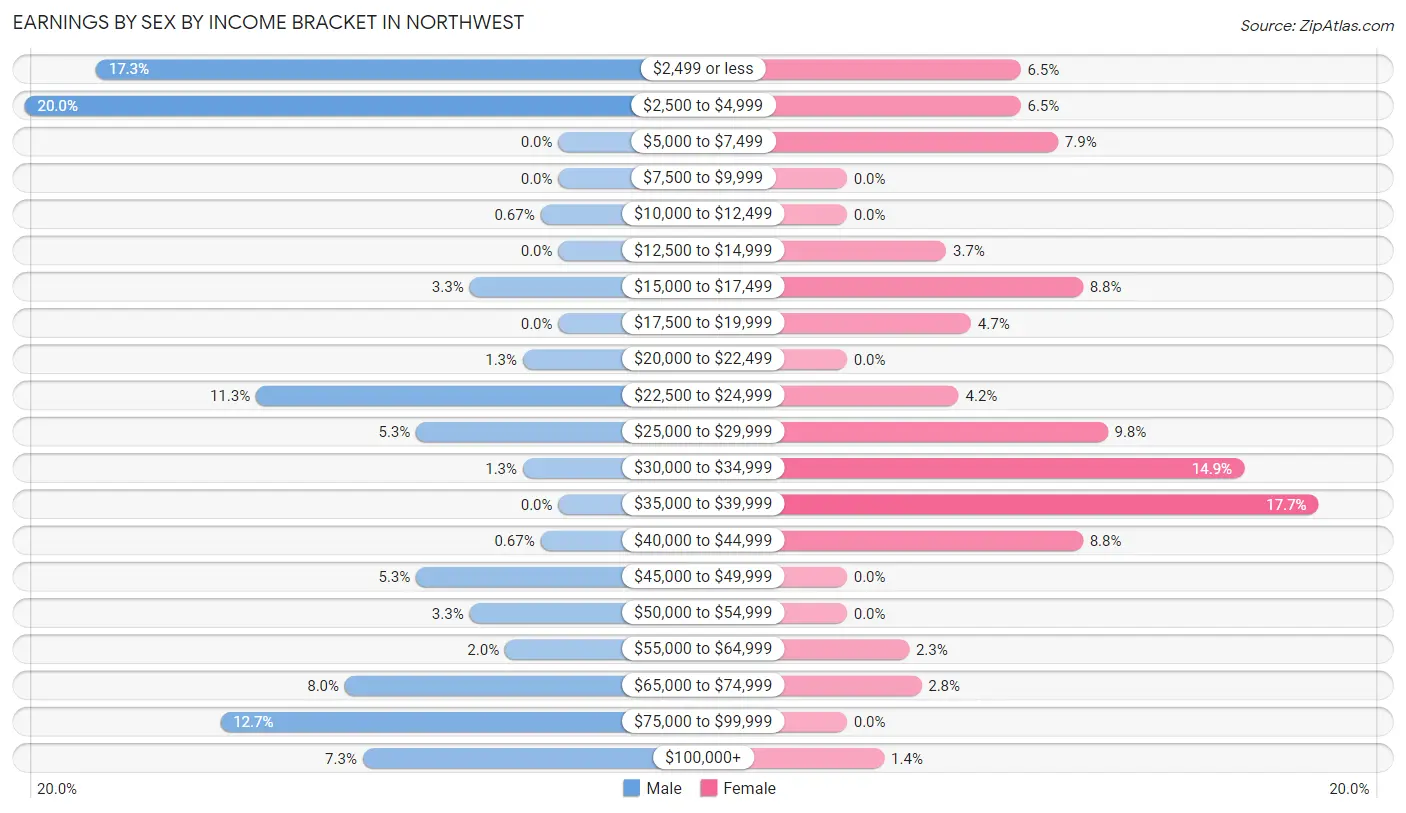
Earnings by Sex by Income Bracket in Northwest
The most common earnings brackets in Northwest are $2,500 to $4,999 for men (30 | 20.0%) and $35,000 to $39,999 for women (38 | 17.7%).
| Income | Male | Female |
| $2,499 or less | 26 (17.3%) | 14 (6.5%) |
| $2,500 to $4,999 | 30 (20.0%) | 14 (6.5%) |
| $5,000 to $7,499 | 0 (0.0%) | 17 (7.9%) |
| $7,500 to $9,999 | 0 (0.0%) | 0 (0.0%) |
| $10,000 to $12,499 | 1 (0.7%) | 0 (0.0%) |
| $12,500 to $14,999 | 0 (0.0%) | 8 (3.7%) |
| $15,000 to $17,499 | 5 (3.3%) | 19 (8.8%) |
| $17,500 to $19,999 | 0 (0.0%) | 10 (4.6%) |
| $20,000 to $22,499 | 2 (1.3%) | 0 (0.0%) |
| $22,500 to $24,999 | 17 (11.3%) | 9 (4.2%) |
| $25,000 to $29,999 | 8 (5.3%) | 21 (9.8%) |
| $30,000 to $34,999 | 2 (1.3%) | 32 (14.9%) |
| $35,000 to $39,999 | 0 (0.0%) | 38 (17.7%) |
| $40,000 to $44,999 | 1 (0.7%) | 19 (8.8%) |
| $45,000 to $49,999 | 8 (5.3%) | 0 (0.0%) |
| $50,000 to $54,999 | 5 (3.3%) | 0 (0.0%) |
| $55,000 to $64,999 | 3 (2.0%) | 5 (2.3%) |
| $65,000 to $74,999 | 12 (8.0%) | 6 (2.8%) |
| $75,000 to $99,999 | 19 (12.7%) | 0 (0.0%) |
| $100,000+ | 11 (7.3%) | 3 (1.4%) |
| Total | 150 (100.0%) | 215 (100.0%) |
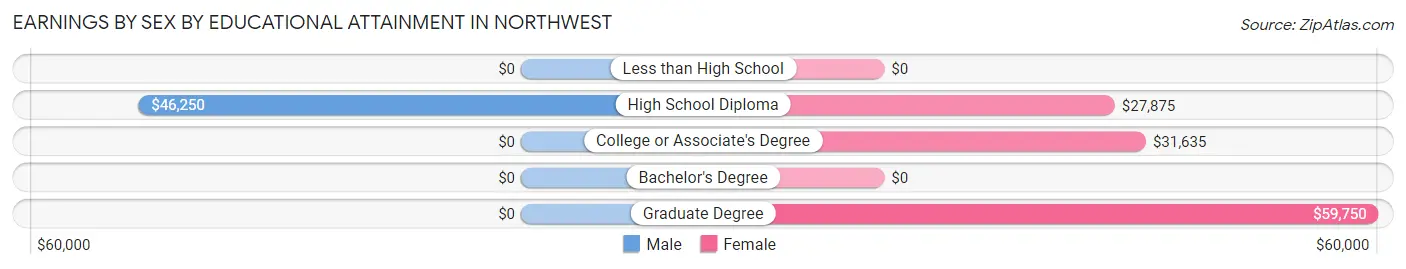
Earnings by Sex by Educational Attainment in Northwest
Average earnings in Northwest are $51,500 for men and $29,779 for women, a difference of 42.2%. Men with an educational attainment of high school diploma enjoy the highest average annual earnings of $46,250, while those with high school diploma education earn the least with $46,250. Women with an educational attainment of graduate degree earn the most with the average annual earnings of $59,750, while those with high school diploma education have the smallest earnings of $27,875.
| Educational Attainment | Male Income | Female Income |
| Less than High School | - | - |
| High School Diploma | $46,250 | $27,875 |
| College or Associate's Degree | - | - |
| Bachelor's Degree | - | - |
| Graduate Degree | - | - |
| Total | $51,500 | $29,779 |
Family Income in Northwest
Family Income Brackets in Northwest
According to the Northwest family income data, there are 50 families falling into the $75,000 to $99,999 income range, which is the most common income bracket and makes up 22.8% of all families.
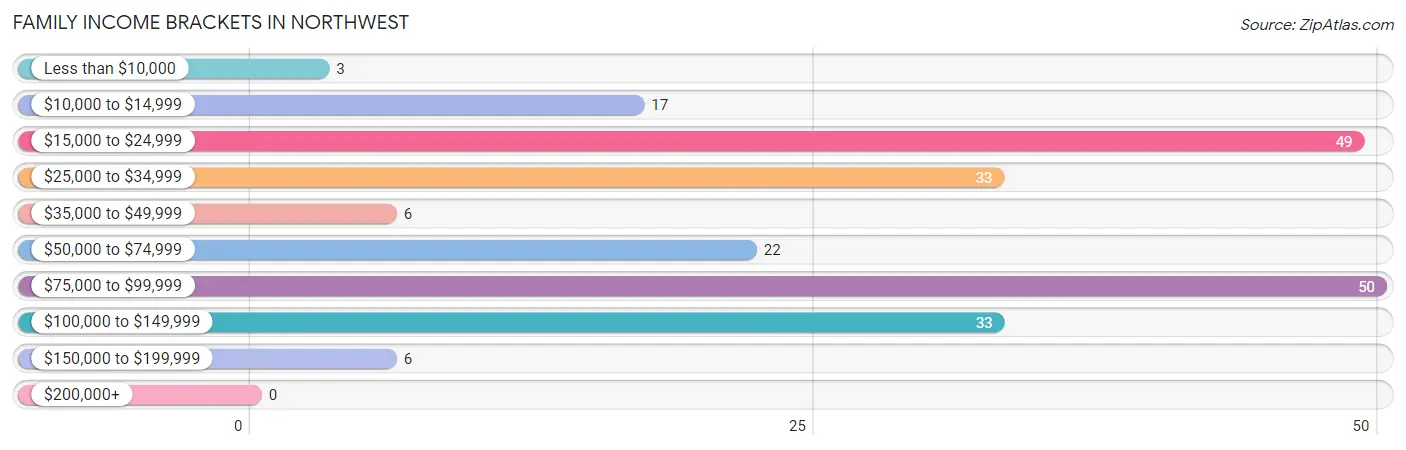
| Income Bracket | # Families | % Families |
| Less than $10,000 | 3 | 1.4% |
| $10,000 to $14,999 | 17 | 7.8% |
| $15,000 to $24,999 | 49 | 22.4% |
| $25,000 to $34,999 | 33 | 15.1% |
| $35,000 to $49,999 | 6 | 2.7% |
| $50,000 to $74,999 | 22 | 10.0% |
| $75,000 to $99,999 | 50 | 22.8% |
| $100,000 to $149,999 | 33 | 15.1% |
| $150,000 to $199,999 | 6 | 2.7% |
| $200,000+ | 0 | 0.0% |
Family Income by Famaliy Size in Northwest
2-person families (96 | 43.8%) account for the highest median family income in Northwest with $88,947 per family, while 2-person families (96 | 43.8%) have the highest median income of $44,474 per family member.
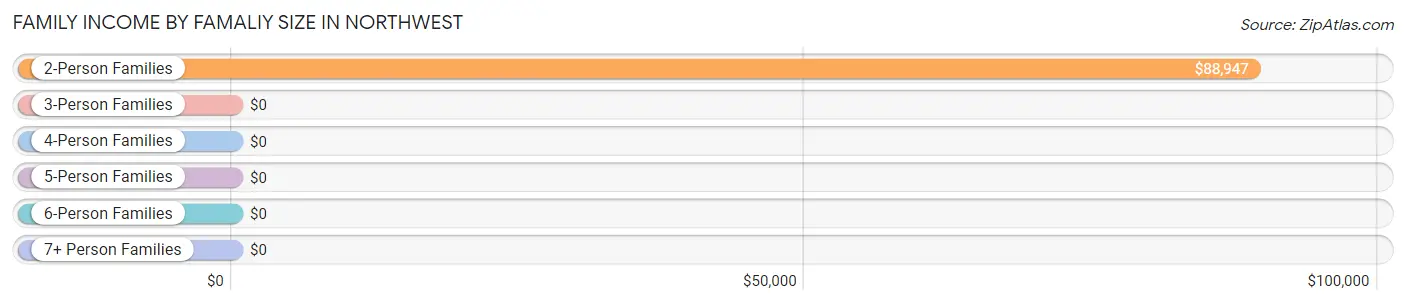
| Income Bracket | # Families | Median Income |
| 2-Person Families | 96 (43.8%) | $88,947 |
| 3-Person Families | 95 (43.4%) | $0 |
| 4-Person Families | 15 (6.9%) | $0 |
| 5-Person Families | 0 (0.0%) | $0 |
| 6-Person Families | 13 (5.9%) | $0 |
| 7+ Person Families | 0 (0.0%) | $0 |
| Total | 219 (100.0%) | $0 |
Family Income by Number of Earners in Northwest
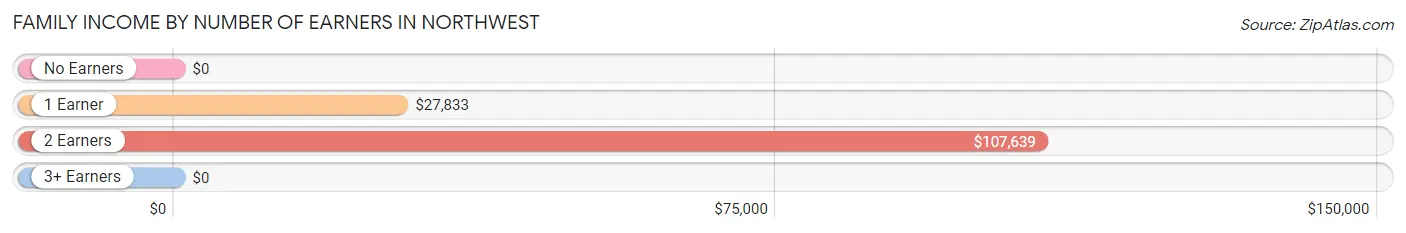
| Number of Earners | # Families | Median Income |
| No Earners | 45 (20.5%) | $0 |
| 1 Earner | 102 (46.6%) | $27,833 |
| 2 Earners | 67 (30.6%) | $107,639 |
| 3+ Earners | 5 (2.3%) | $0 |
| Total | 219 (100.0%) | $0 |
Household Income in Northwest
Household Income Brackets in Northwest
With 69 households falling in the category, the $15,000 to $24,999 income range is the most frequent in Northwest, accounting for 20.2% of all households.
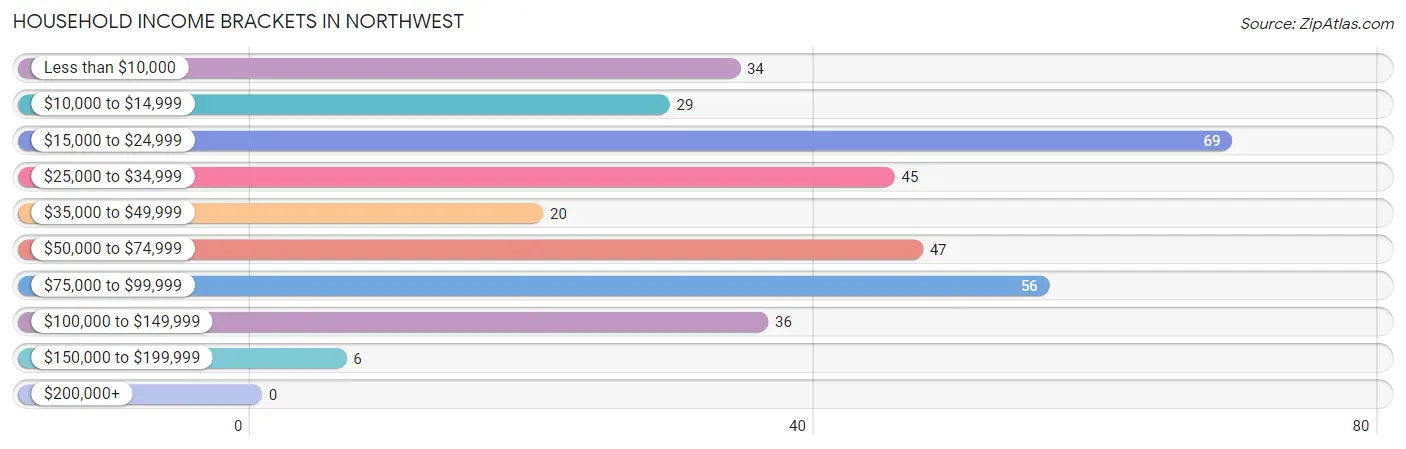
| Income Bracket | # Households | % Households |
| Less than $10,000 | 34 | 9.9% |
| $10,000 to $14,999 | 29 | 8.5% |
| $15,000 to $24,999 | 69 | 20.2% |
| $25,000 to $34,999 | 45 | 13.2% |
| $35,000 to $49,999 | 20 | 5.8% |
| $50,000 to $74,999 | 47 | 13.7% |
| $75,000 to $99,999 | 56 | 16.4% |
| $100,000 to $149,999 | 36 | 10.5% |
| $150,000 to $199,999 | 6 | 1.8% |
| $200,000+ | 0 | 0.0% |
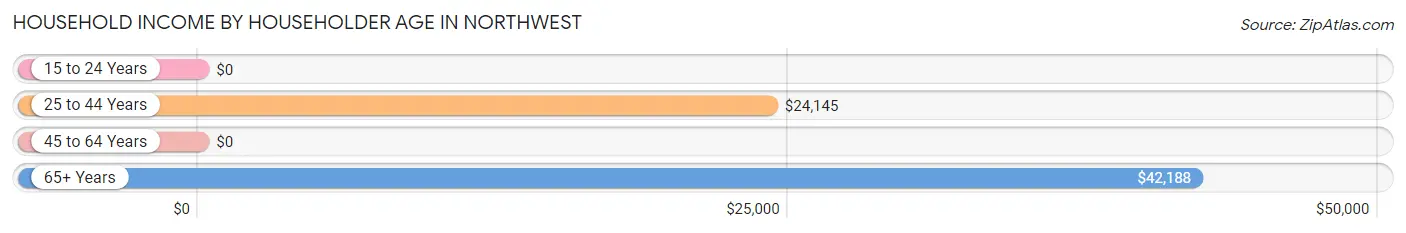
Household Income by Householder Age in Northwest
The median household income in Northwest is $31,750, with the highest median household income of $42,188 found in the 65+ years age bracket for the primary householder. A total of 85 households (24.8%) fall into this category.
| Income Bracket | # Households | Median Income |
| 15 to 24 Years | 0 (0.0%) | $0 |
| 25 to 44 Years | 43 (12.6%) | $24,145 |
| 45 to 64 Years | 214 (62.6%) | $0 |
| 65+ Years | 85 (24.8%) | $42,188 |
| Total | 342 (100.0%) | $31,750 |
Poverty in Northwest
Income Below Poverty by Sex and Age in Northwest
With 26.4% poverty level for males and 27.5% for females among the residents of Northwest, 5 year old males and 12 to 14 year old females are the most vulnerable to poverty, with 14 males (100.0%) and 14 females (70.0%) in their respective age groups living below the poverty level.
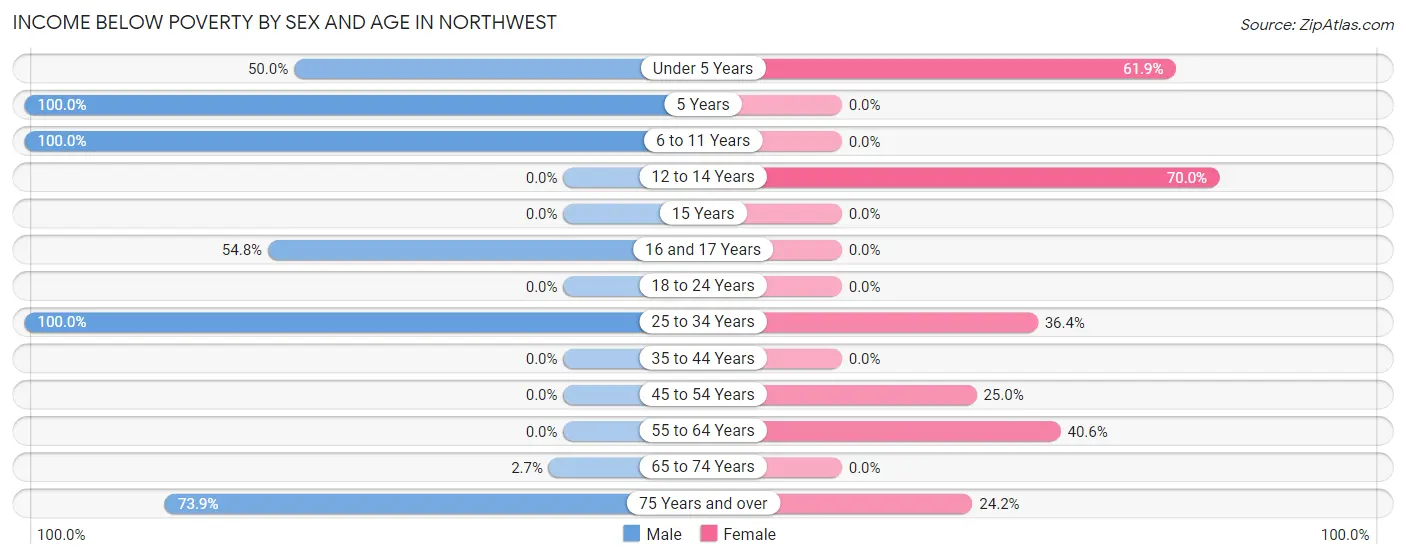
| Age Bracket | Male | Female |
| Under 5 Years | 3 (50.0%) | 13 (61.9%) |
| 5 Years | 14 (100.0%) | 0 (0.0%) |
| 6 to 11 Years | 9 (100.0%) | 0 (0.0%) |
| 12 to 14 Years | 0 (0.0%) | 14 (70.0%) |
| 15 Years | 0 (0.0%) | 0 (0.0%) |
| 16 and 17 Years | 17 (54.8%) | 0 (0.0%) |
| 18 to 24 Years | 0 (0.0%) | 0 (0.0%) |
| 25 to 34 Years | 20 (100.0%) | 20 (36.4%) |
| 35 to 44 Years | 0 (0.0%) | 0 (0.0%) |
| 45 to 54 Years | 0 (0.0%) | 18 (25.0%) |
| 55 to 64 Years | 0 (0.0%) | 54 (40.6%) |
| 65 to 74 Years | 1 (2.7%) | 0 (0.0%) |
| 75 Years and over | 17 (73.9%) | 8 (24.2%) |
| Total | 81 (26.4%) | 127 (27.5%) |
Income Above Poverty by Sex and Age in Northwest
According to the poverty statistics in Northwest, males aged 18 to 24 years and females aged 5 years are the age groups that are most secure financially, with 100.0% of males and 100.0% of females in these age groups living above the poverty line.
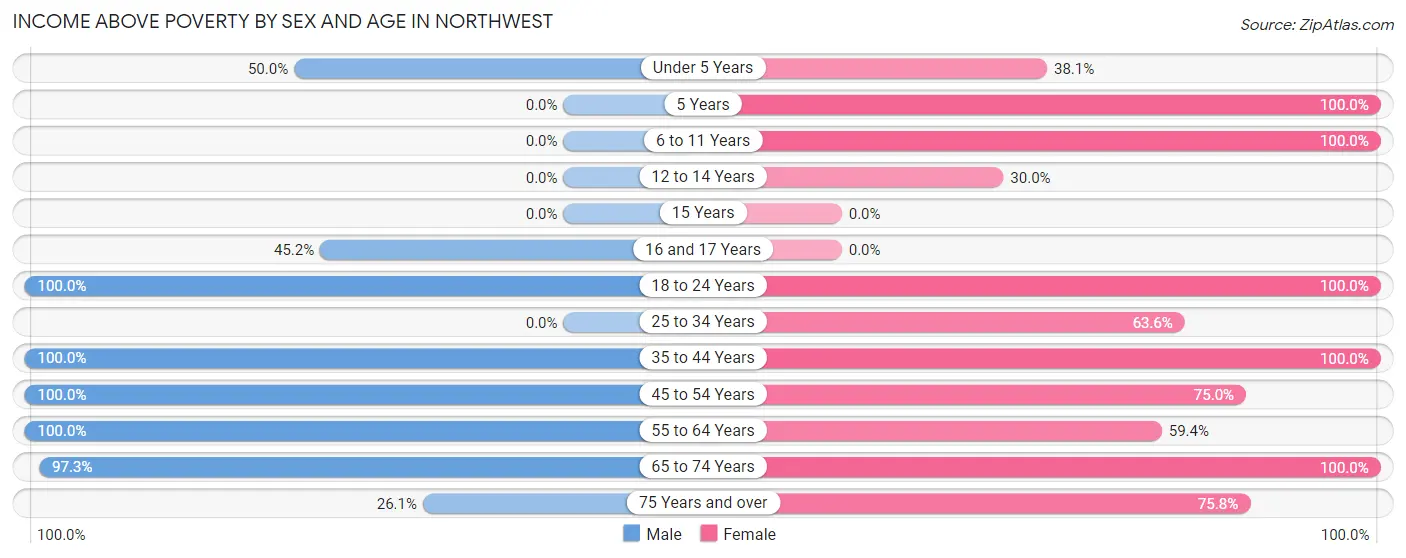
| Age Bracket | Male | Female |
| Under 5 Years | 3 (50.0%) | 8 (38.1%) |
| 5 Years | 0 (0.0%) | 3 (100.0%) |
| 6 to 11 Years | 0 (0.0%) | 19 (100.0%) |
| 12 to 14 Years | 0 (0.0%) | 6 (30.0%) |
| 15 Years | 0 (0.0%) | 0 (0.0%) |
| 16 and 17 Years | 14 (45.2%) | 0 (0.0%) |
| 18 to 24 Years | 56 (100.0%) | 6 (100.0%) |
| 25 to 34 Years | 0 (0.0%) | 35 (63.6%) |
| 35 to 44 Years | 22 (100.0%) | 43 (100.0%) |
| 45 to 54 Years | 38 (100.0%) | 54 (75.0%) |
| 55 to 64 Years | 51 (100.0%) | 79 (59.4%) |
| 65 to 74 Years | 36 (97.3%) | 57 (100.0%) |
| 75 Years and over | 6 (26.1%) | 25 (75.8%) |
| Total | 226 (73.6%) | 335 (72.5%) |
Income Below Poverty Among Married-Couple Families in Northwest
The poverty statistics for married-couple families in Northwest show that 7.8% or 9 of the total 116 families live below the poverty line. Families with 1 or 2 children have the highest poverty rate of 37.5%, comprising of 9 families. On the other hand, families with no children have the lowest poverty rate of 0.0%, which includes 0 families.
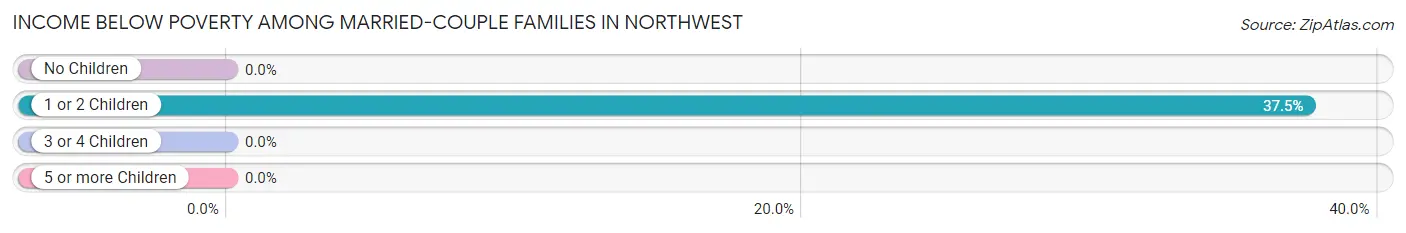
| Children | Above Poverty | Below Poverty |
| No Children | 92 (100.0%) | 0 (0.0%) |
| 1 or 2 Children | 15 (62.5%) | 9 (37.5%) |
| 3 or 4 Children | 0 (0.0%) | 0 (0.0%) |
| 5 or more Children | 0 (0.0%) | 0 (0.0%) |
| Total | 107 (92.2%) | 9 (7.8%) |
Income Below Poverty Among Single-Parent Households in Northwest
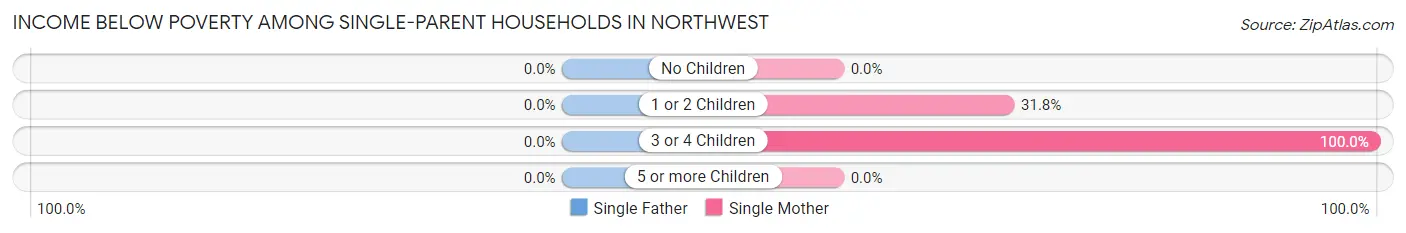
| Children | Single Father | Single Mother |
| No Children | 0 (0.0%) | 0 (0.0%) |
| 1 or 2 Children | 0 (0.0%) | 20 (31.8%) |
| 3 or 4 Children | 0 (0.0%) | 13 (100.0%) |
| 5 or more Children | 0 (0.0%) | 0 (0.0%) |
| Total | 0 (0.0%) | 33 (32.0%) |
Income Below Poverty Among Married-Couple vs Single-Parent Households in Northwest
The poverty data for Northwest shows that 9 of the married-couple family households (7.8%) and 33 of the single-parent households (32.0%) are living below the poverty level. Within the married-couple family households, those with 1 or 2 children have the highest poverty rate, with 9 households (37.5%) falling below the poverty line. Among the single-parent households, those with 3 or 4 children have the highest poverty rate, with 13 household (100.0%) living below poverty.
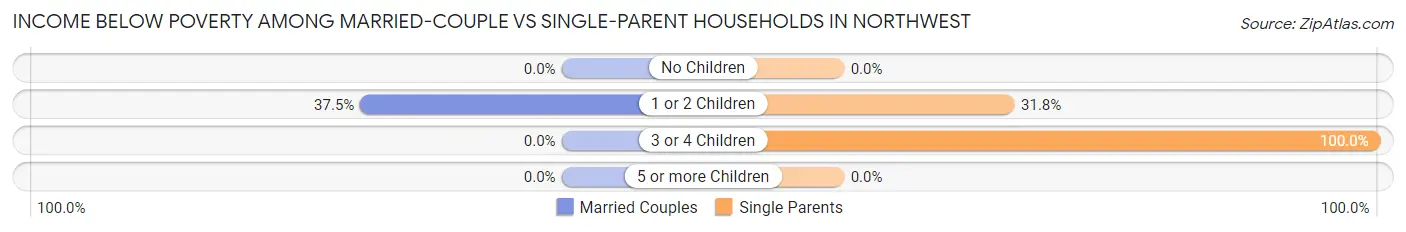
| Children | Married-Couple Families | Single-Parent Households |
| No Children | 0 (0.0%) | 0 (0.0%) |
| 1 or 2 Children | 9 (37.5%) | 20 (31.8%) |
| 3 or 4 Children | 0 (0.0%) | 13 (100.0%) |
| 5 or more Children | 0 (0.0%) | 0 (0.0%) |
| Total | 9 (7.8%) | 33 (32.0%) |
Race in Northwest
The most populous races in Northwest are Black / African American (611 | 79.4%), White / Caucasian (154 | 20.0%), and Hispanic or Latino (7 | 0.9%).
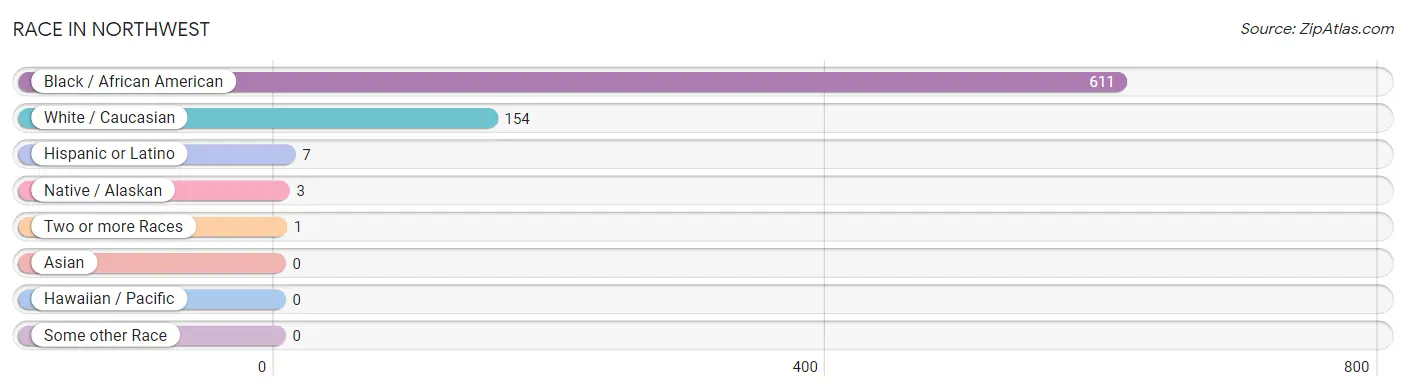
| Race | # Population | % Population |
| Asian | 0 | 0.0% |
| Black / African American | 611 | 79.4% |
| Hawaiian / Pacific | 0 | 0.0% |
| Hispanic or Latino | 7 | 0.9% |
| Native / Alaskan | 3 | 0.4% |
| White / Caucasian | 154 | 20.0% |
| Two or more Races | 1 | 0.1% |
| Some other Race | 0 | 0.0% |
| Total | 769 | 100.0% |
Ancestry in Northwest
The most populous ancestries reported in Northwest are English (50 | 6.5%), American (22 | 2.9%), Dutch (21 | 2.7%), African (17 | 2.2%), and Subsaharan African (17 | 2.2%), together accounting for 16.5% of all Northwest residents.
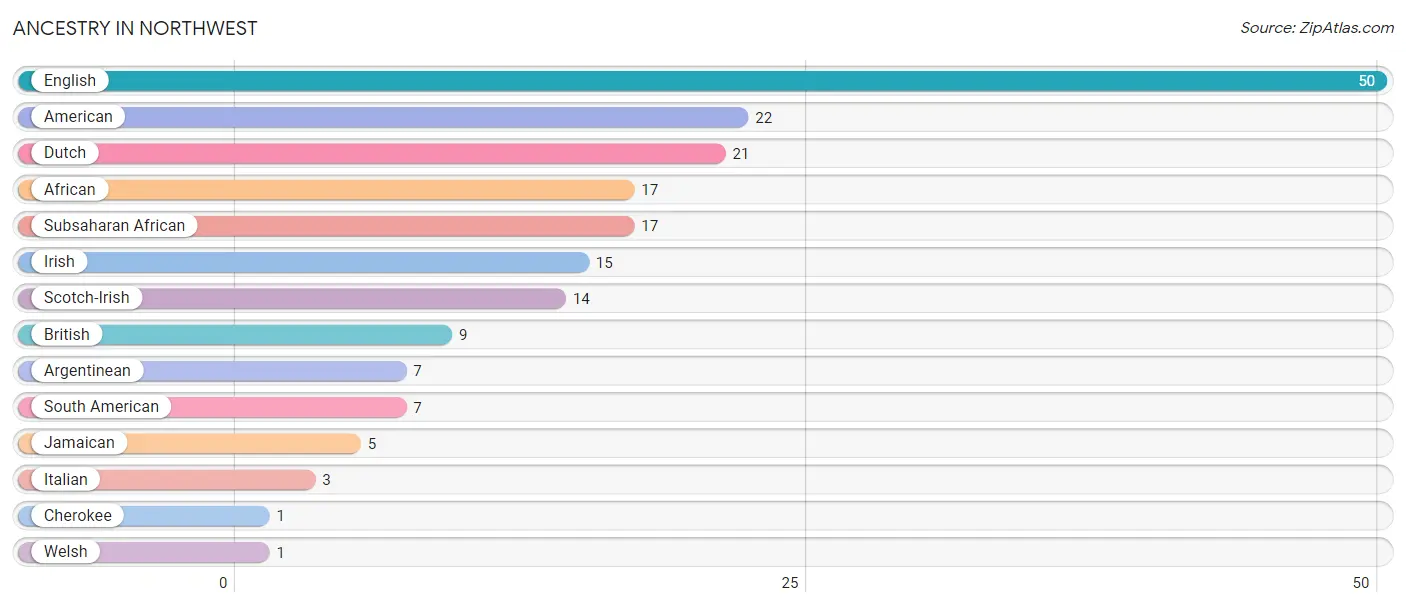
| Ancestry | # Population | % Population |
| African | 17 | 2.2% |
| American | 22 | 2.9% |
| Argentinean | 7 | 0.9% |
| British | 9 | 1.2% |
| Cherokee | 1 | 0.1% |
| Dutch | 21 | 2.7% |
| English | 50 | 6.5% |
| Irish | 15 | 1.9% |
| Italian | 3 | 0.4% |
| Jamaican | 5 | 0.6% |
| Scotch-Irish | 14 | 1.8% |
| South American | 7 | 0.9% |
| Subsaharan African | 17 | 2.2% |
| Welsh | 1 | 0.1% | View All 14 Rows |
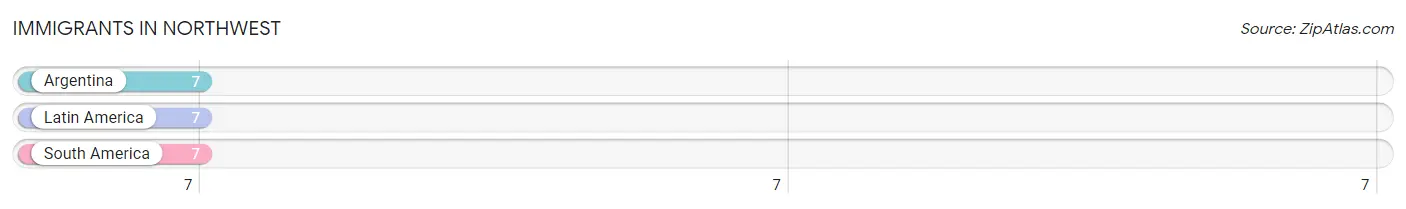
Immigrants in Northwest
The most numerous immigrant groups reported in Northwest came from Argentina (7 | 0.9%), Latin America (7 | 0.9%), and South America (7 | 0.9%), together accounting for 2.7% of all Northwest residents.
| Immigration Origin | # Population | % Population |
| Argentina | 7 | 0.9% |
| Latin America | 7 | 0.9% |
| South America | 7 | 0.9% | View All 3 Rows |
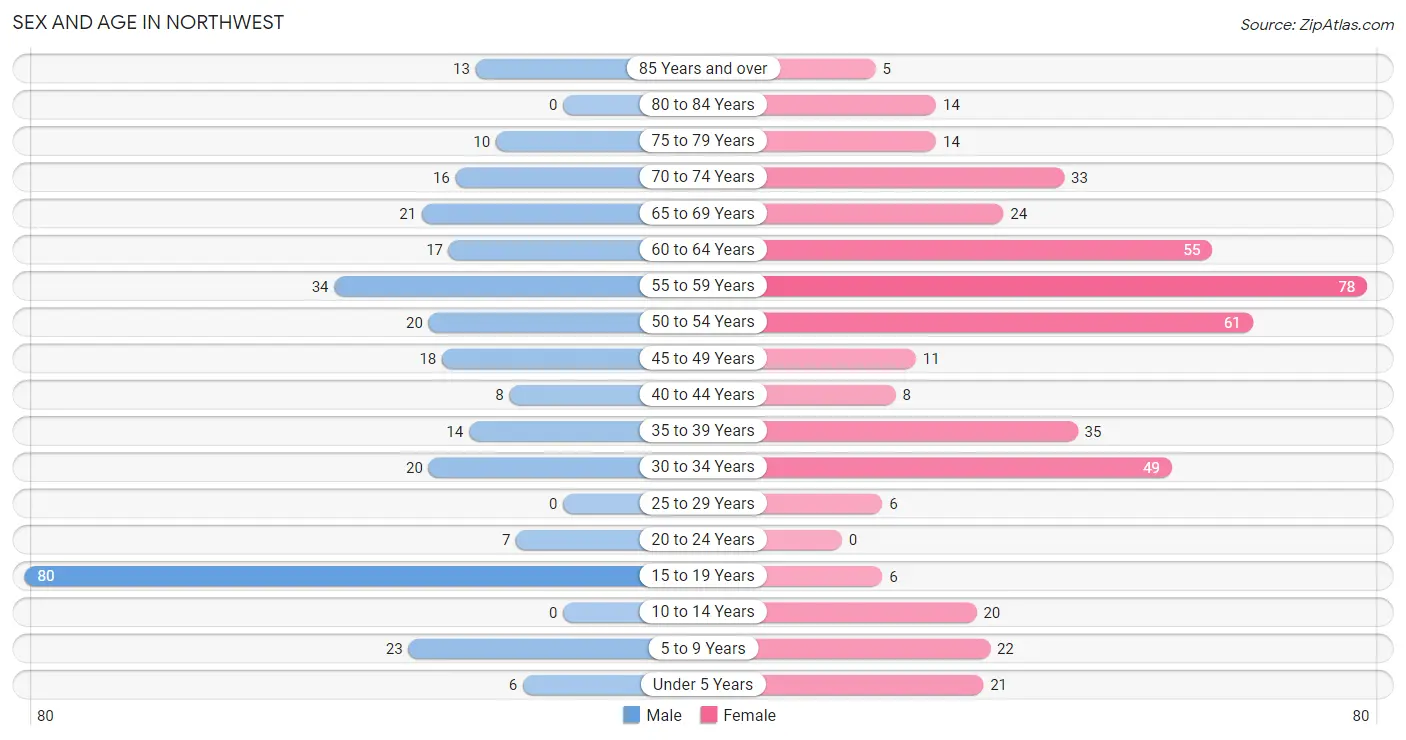
Sex and Age in Northwest
Sex and Age in Northwest
The most populous age groups in Northwest are 15 to 19 Years (80 | 26.1%) for men and 55 to 59 Years (78 | 16.9%) for women.
| Age Bracket | Male | Female |
| Under 5 Years | 6 (1.9%) | 21 (4.5%) |
| 5 to 9 Years | 23 (7.5%) | 22 (4.8%) |
| 10 to 14 Years | 0 (0.0%) | 20 (4.3%) |
| 15 to 19 Years | 80 (26.1%) | 6 (1.3%) |
| 20 to 24 Years | 7 (2.3%) | 0 (0.0%) |
| 25 to 29 Years | 0 (0.0%) | 6 (1.3%) |
| 30 to 34 Years | 20 (6.5%) | 49 (10.6%) |
| 35 to 39 Years | 14 (4.6%) | 35 (7.6%) |
| 40 to 44 Years | 8 (2.6%) | 8 (1.7%) |
| 45 to 49 Years | 18 (5.9%) | 11 (2.4%) |
| 50 to 54 Years | 20 (6.5%) | 61 (13.2%) |
| 55 to 59 Years | 34 (11.1%) | 78 (16.9%) |
| 60 to 64 Years | 17 (5.5%) | 55 (11.9%) |
| 65 to 69 Years | 21 (6.8%) | 24 (5.2%) |
| 70 to 74 Years | 16 (5.2%) | 33 (7.1%) |
| 75 to 79 Years | 10 (3.3%) | 14 (3.0%) |
| 80 to 84 Years | 0 (0.0%) | 14 (3.0%) |
| 85 Years and over | 13 (4.2%) | 5 (1.1%) |
| Total | 307 (100.0%) | 462 (100.0%) |
Families and Households in Northwest
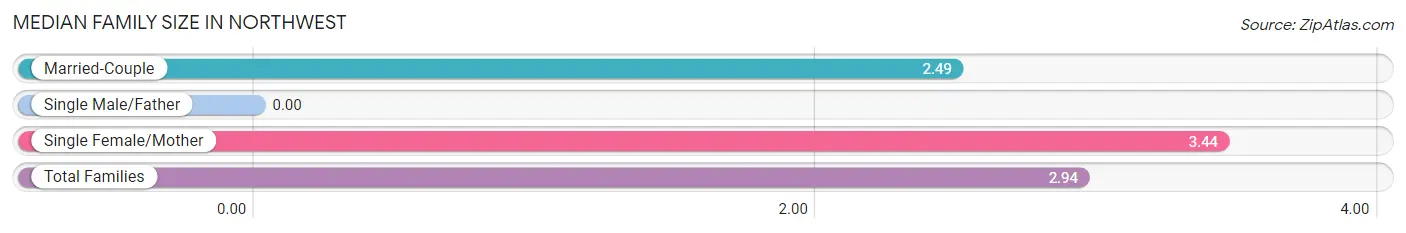
Median Family Size in Northwest
| Family Type | # Families | Family Size |
| Married-Couple | 116 (53.0%) | 2.49 |
| Single Male/Father | 0 (0.0%) | - |
| Single Female/Mother | 103 (47.0%) | 3.44 |
| Total Families | 219 (100.0%) | 2.94 |
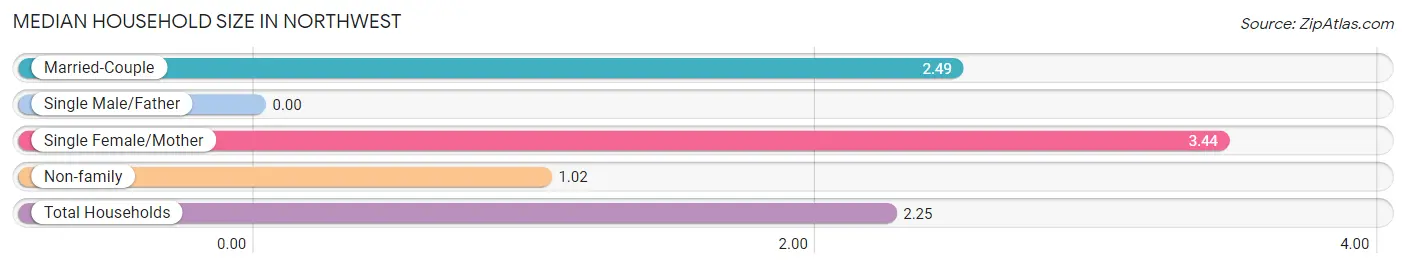
Median Household Size in Northwest
| Household Type | # Households | Household Size |
| Married-Couple | 116 (33.9%) | 2.49 |
| Single Male/Father | 0 (0.0%) | - |
| Single Female/Mother | 103 (30.1%) | 3.44 |
| Non-family | 123 (36.0%) | 1.02 |
| Total Households | 342 (100.0%) | 2.25 |
Household Size by Marriage Status in Northwest
Out of a total of 342 households in Northwest, 219 (64.0%) are family households, while 123 (36.0%) are nonfamily households. The most numerous type of family households are 2-person households, comprising 96, and the most common type of nonfamily households are 1-person households, comprising 121.
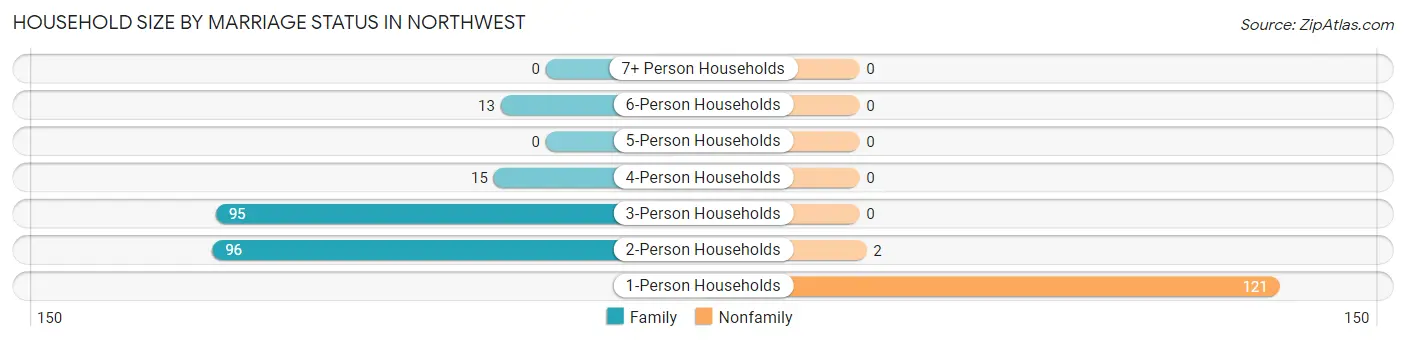
| Household Size | Family Households | Nonfamily Households |
| 1-Person Households | - | 121 (35.4%) |
| 2-Person Households | 96 (28.1%) | 2 (0.6%) |
| 3-Person Households | 95 (27.8%) | 0 (0.0%) |
| 4-Person Households | 15 (4.4%) | 0 (0.0%) |
| 5-Person Households | 0 (0.0%) | 0 (0.0%) |
| 6-Person Households | 13 (3.8%) | 0 (0.0%) |
| 7+ Person Households | 0 (0.0%) | 0 (0.0%) |
| Total | 219 (64.0%) | 123 (36.0%) |
Female Fertility in Northwest
Fertility by Age in Northwest
Average fertility rate in Northwest is 122.0 births per 1,000 women. Women in the age bracket of 20 to 34 years have the highest fertility rate with 255.0 births per 1,000 women. Women in the age bracket of 20 to 34 years acount for 100.0% of all women with births.
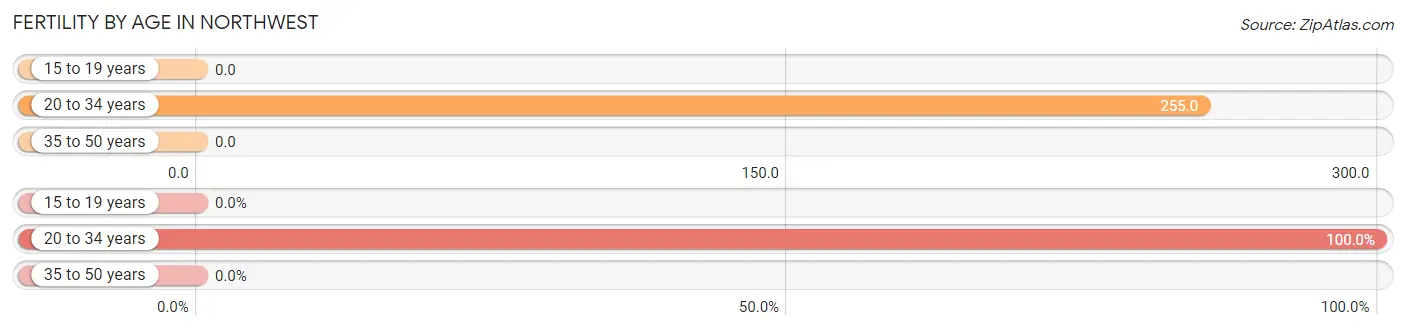
| Age Bracket | Women with Births | Births / 1,000 Women |
| 15 to 19 years | 0 (0.0%) | 0.0 |
| 20 to 34 years | 14 (100.0%) | 255.0 |
| 35 to 50 years | 0 (0.0%) | 0.0 |
| Total | 14 (100.0%) | 122.0 |
Fertility by Age by Marriage Status in Northwest
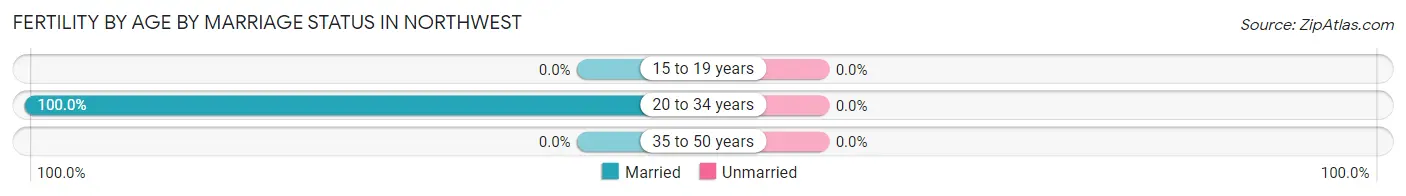
| Age Bracket | Married | Unmarried |
| 15 to 19 years | 0 (0.0%) | 0 (0.0%) |
| 20 to 34 years | 14 (100.0%) | 0 (0.0%) |
| 35 to 50 years | 0 (0.0%) | 0 (0.0%) |
| Total | 14 (100.0%) | 0 (0.0%) |
Fertility by Education in Northwest
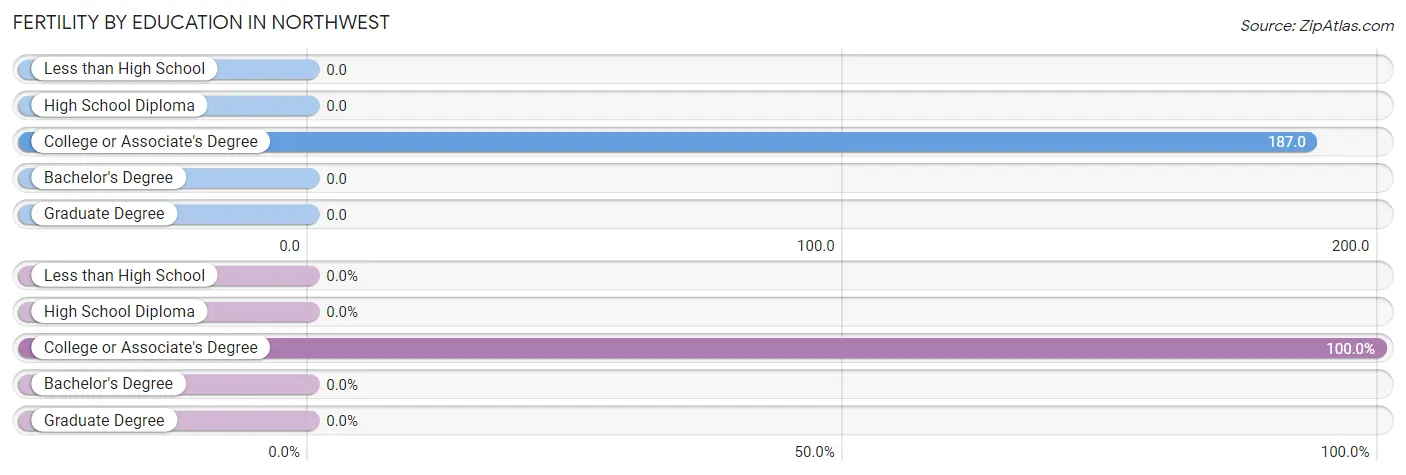
| Educational Attainment | Women with Births | Births / 1,000 Women |
| Less than High School | 0 (0.0%) | 0.0 |
| High School Diploma | 0 (0.0%) | 0.0 |
| College or Associate's Degree | 14 (100.0%) | 187.0 |
| Bachelor's Degree | 0 (0.0%) | 0.0 |
| Graduate Degree | 0 (0.0%) | 0.0 |
| Total | 14 (100.0%) | 122.0 |
Fertility by Education by Marriage Status in Northwest
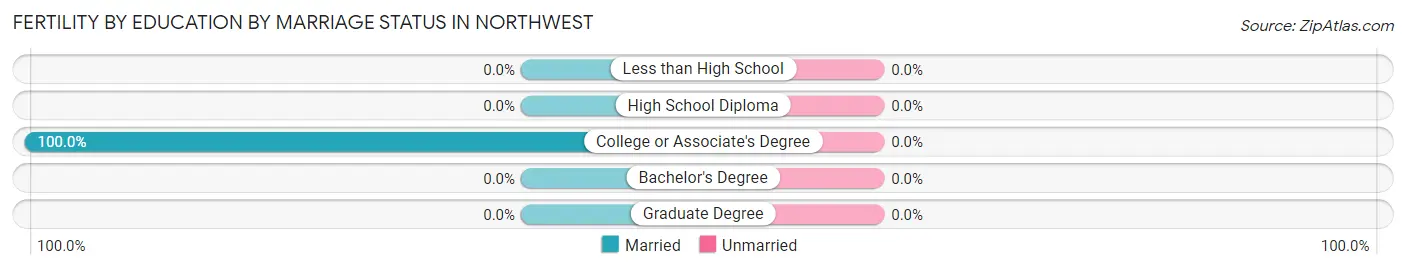
| Educational Attainment | Married | Unmarried |
| Less than High School | 0 (0.0%) | 0 (0.0%) |
| High School Diploma | 0 (0.0%) | 0 (0.0%) |
| College or Associate's Degree | 14 (100.0%) | 0 (0.0%) |
| Bachelor's Degree | 0 (0.0%) | 0 (0.0%) |
| Graduate Degree | 0 (0.0%) | 0 (0.0%) |
| Total | 14 (100.0%) | 0 (0.0%) |
Employment Characteristics in Northwest
Employment by Class of Employer in Northwest
Among the 338 employed individuals in Northwest, private company employees (243 | 71.9%), local government employees (46 | 13.6%), and self-employed (not incorporated) (20 | 5.9%) make up the most common classes of employment.
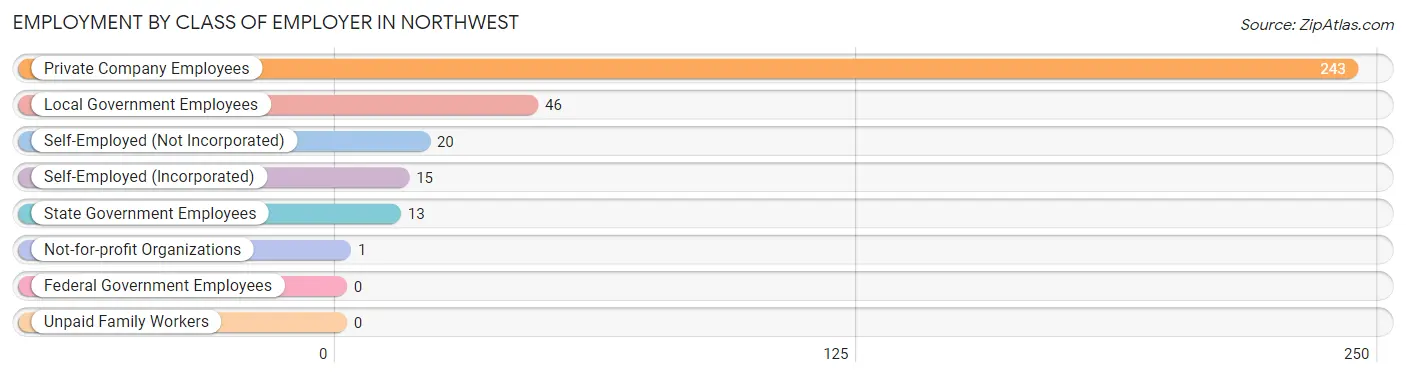
| Employer Class | # Employees | % Employees |
| Private Company Employees | 243 | 71.9% |
| Self-Employed (Incorporated) | 15 | 4.4% |
| Self-Employed (Not Incorporated) | 20 | 5.9% |
| Not-for-profit Organizations | 1 | 0.3% |
| Local Government Employees | 46 | 13.6% |
| State Government Employees | 13 | 3.8% |
| Federal Government Employees | 0 | 0.0% |
| Unpaid Family Workers | 0 | 0.0% |
| Total | 338 | 100.0% |
Employment Status by Age in Northwest
According to the labor force statistics for Northwest, out of the total population over 16 years of age (677), 56.0% or 379 individuals are in the labor force, with 10.8% or 41 of them unemployed. The age group with the highest labor force participation rate is 20 to 24 years, with 100.0% or 7 individuals in the labor force. Within the labor force, the 25 to 29 years age range has the highest percentage of unemployed individuals, with 100.0% or 6 of them being unemployed.
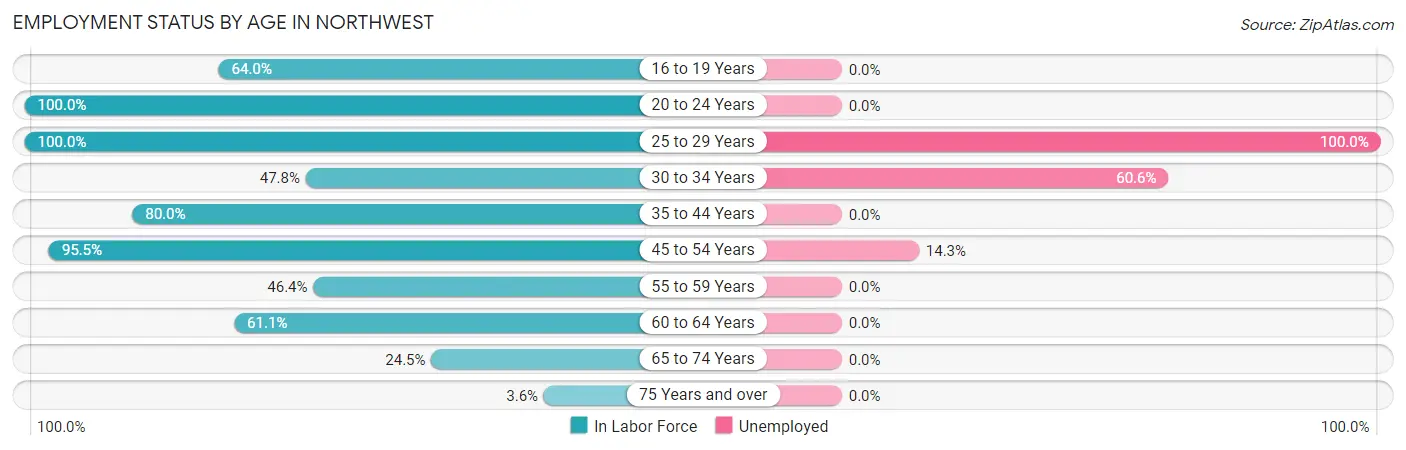
| Age Bracket | In Labor Force | Unemployed |
| 16 to 19 Years | 55 (64.0%) | 0 (0.0%) |
| 20 to 24 Years | 7 (100.0%) | 0 (0.0%) |
| 25 to 29 Years | 6 (100.0%) | 6 (100.0%) |
| 30 to 34 Years | 33 (47.8%) | 20 (60.6%) |
| 35 to 44 Years | 52 (80.0%) | 0 (0.0%) |
| 45 to 54 Years | 105 (95.5%) | 15 (14.3%) |
| 55 to 59 Years | 52 (46.4%) | 0 (0.0%) |
| 60 to 64 Years | 44 (61.1%) | 0 (0.0%) |
| 65 to 74 Years | 23 (24.5%) | 0 (0.0%) |
| 75 Years and over | 2 (3.6%) | 0 (0.0%) |
| Total | 379 (56.0%) | 41 (10.8%) |
Employment Status by Educational Attainment in Northwest
According to labor force statistics for Northwest, 67.3% of individuals (292) out of the total population between 25 and 64 years of age (434) are in the labor force, with 14.0% or 41 of them being unemployed. The group with the highest labor force participation rate are those with the educational attainment of high school diploma, with 81.4% or 140 individuals in the labor force. Within the labor force, individuals with college / associate degree education have the highest percentage of unemployment, with 26.4% or 28 of them being unemployed.
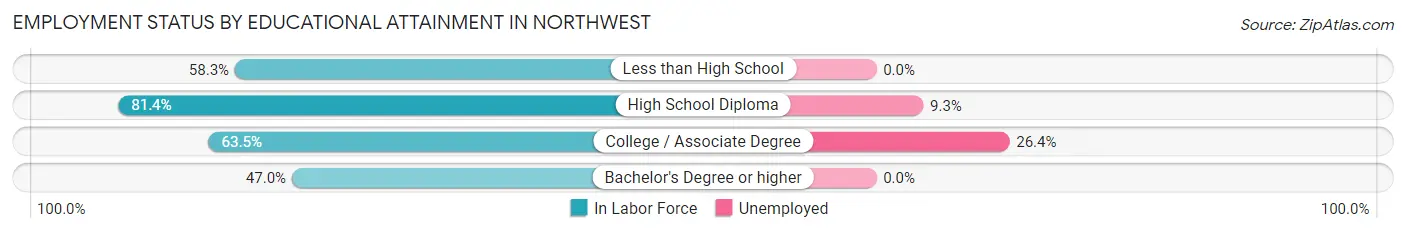
| Educational Attainment | In Labor Force | Unemployed |
| Less than High School | 7 (58.3%) | 0 (0.0%) |
| High School Diploma | 140 (81.4%) | 16 (9.3%) |
| College / Associate Degree | 106 (63.5%) | 44 (26.4%) |
| Bachelor's Degree or higher | 39 (47.0%) | 0 (0.0%) |
| Total | 292 (67.3%) | 61 (14.0%) |
Employment Occupations by Sex in Northwest
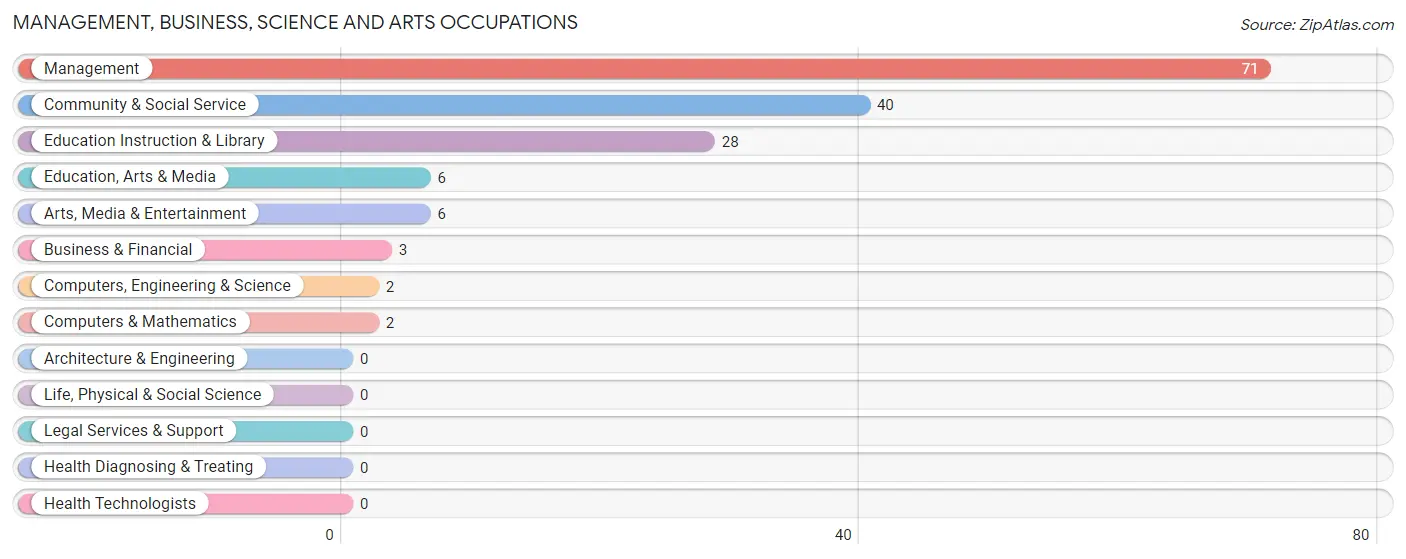
Management, Business, Science and Arts Occupations
The most common Management, Business, Science and Arts occupations in Northwest are Management (71 | 21.0%), Community & Social Service (40 | 11.8%), Education Instruction & Library (28 | 8.3%), Education, Arts & Media (6 | 1.8%), and Arts, Media & Entertainment (6 | 1.8%).
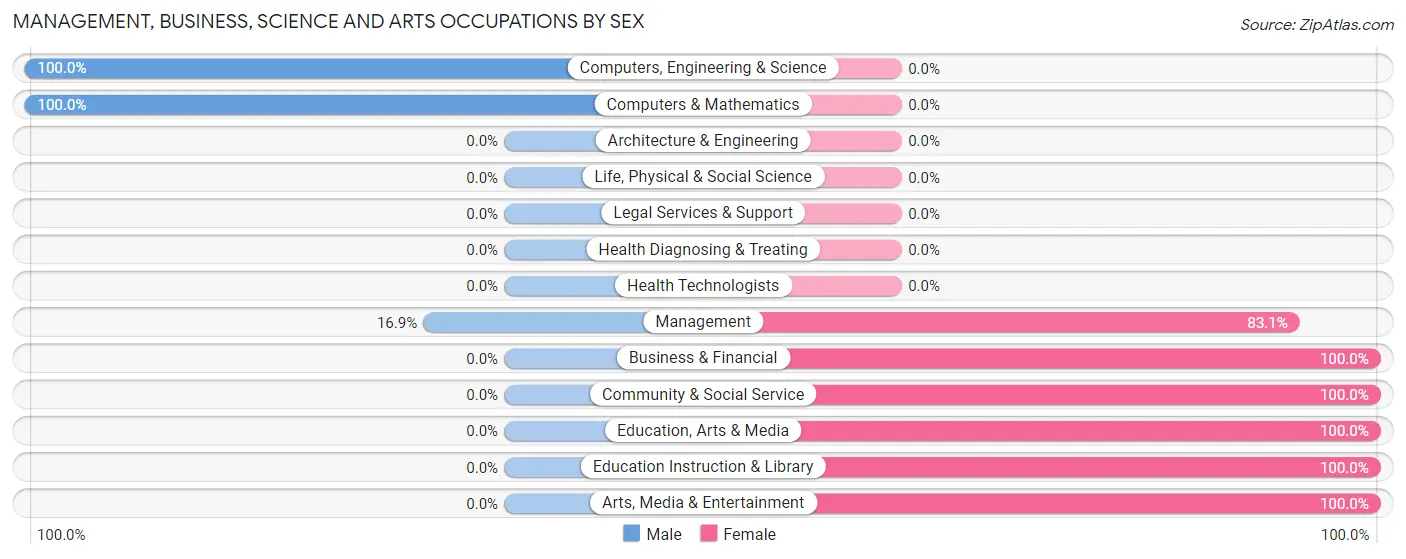
Management, Business, Science and Arts Occupations by Sex
Within the Management, Business, Science and Arts occupations in Northwest, the most male-oriented occupations are Computers, Engineering & Science (100.0%), Computers & Mathematics (100.0%), and Management (16.9%), while the most female-oriented occupations are Business & Financial (100.0%), Community & Social Service (100.0%), and Education, Arts & Media (100.0%).
| Occupation | Male | Female |
| Management | 12 (16.9%) | 59 (83.1%) |
| Business & Financial | 0 (0.0%) | 3 (100.0%) |
| Computers, Engineering & Science | 2 (100.0%) | 0 (0.0%) |
| Computers & Mathematics | 2 (100.0%) | 0 (0.0%) |
| Architecture & Engineering | 0 (0.0%) | 0 (0.0%) |
| Life, Physical & Social Science | 0 (0.0%) | 0 (0.0%) |
| Community & Social Service | 0 (0.0%) | 40 (100.0%) |
| Education, Arts & Media | 0 (0.0%) | 6 (100.0%) |
| Legal Services & Support | 0 (0.0%) | 0 (0.0%) |
| Education Instruction & Library | 0 (0.0%) | 28 (100.0%) |
| Arts, Media & Entertainment | 0 (0.0%) | 6 (100.0%) |
| Health Diagnosing & Treating | 0 (0.0%) | 0 (0.0%) |
| Health Technologists | 0 (0.0%) | 0 (0.0%) |
| Total (Category) | 14 (12.1%) | 102 (87.9%) |
| Total (Overall) | 150 (44.4%) | 188 (55.6%) |
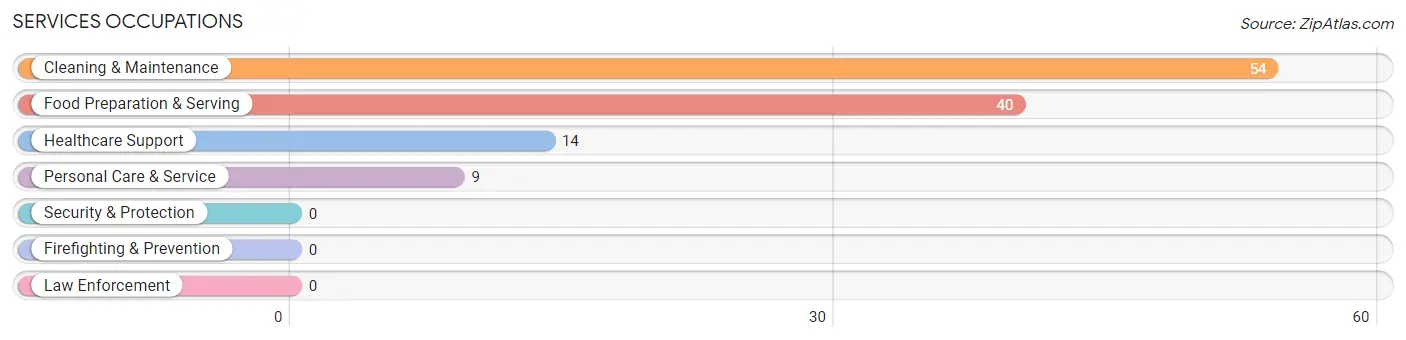
Services Occupations
The most common Services occupations in Northwest are Cleaning & Maintenance (54 | 16.0%), Food Preparation & Serving (40 | 11.8%), Healthcare Support (14 | 4.1%), and Personal Care & Service (9 | 2.7%).
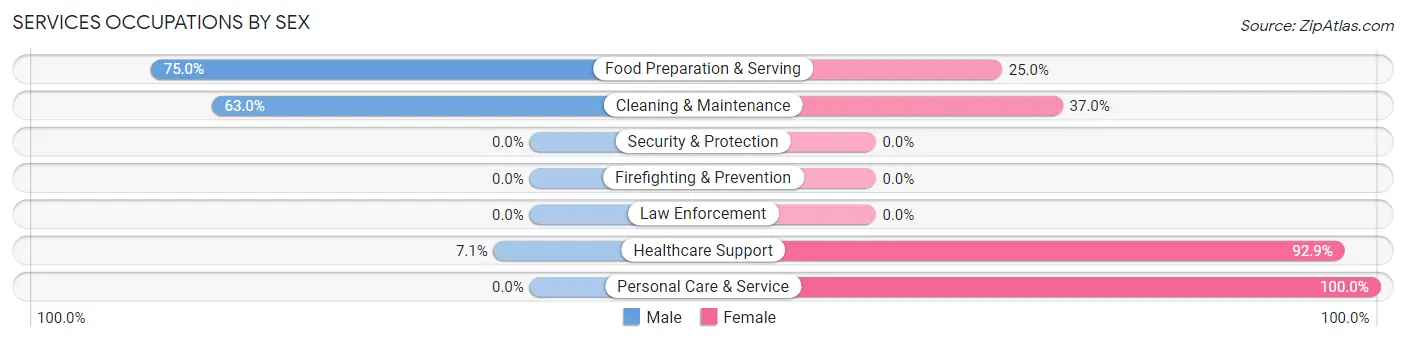
Services Occupations by Sex
Within the Services occupations in Northwest, the most male-oriented occupations are Food Preparation & Serving (75.0%), Cleaning & Maintenance (63.0%), and Healthcare Support (7.1%), while the most female-oriented occupations are Personal Care & Service (100.0%), Healthcare Support (92.9%), and Cleaning & Maintenance (37.0%).
| Occupation | Male | Female |
| Healthcare Support | 1 (7.1%) | 13 (92.9%) |
| Security & Protection | 0 (0.0%) | 0 (0.0%) |
| Firefighting & Prevention | 0 (0.0%) | 0 (0.0%) |
| Law Enforcement | 0 (0.0%) | 0 (0.0%) |
| Food Preparation & Serving | 30 (75.0%) | 10 (25.0%) |
| Cleaning & Maintenance | 34 (63.0%) | 20 (37.0%) |
| Personal Care & Service | 0 (0.0%) | 9 (100.0%) |
| Total (Category) | 65 (55.6%) | 52 (44.4%) |
| Total (Overall) | 150 (44.4%) | 188 (55.6%) |
Sales and Office Occupations
The most common Sales and Office occupations in Northwest are Office & Administration (19 | 5.6%), and Sales & Related (14 | 4.1%).
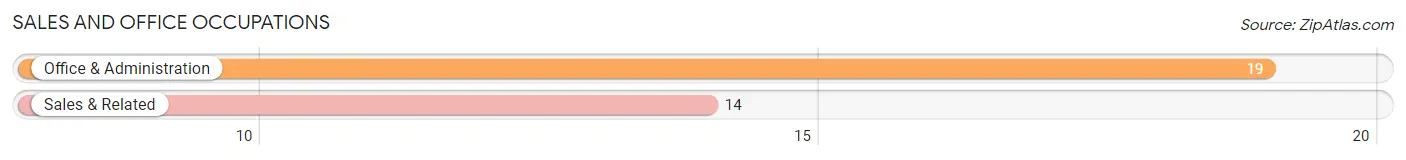
Sales and Office Occupations by Sex
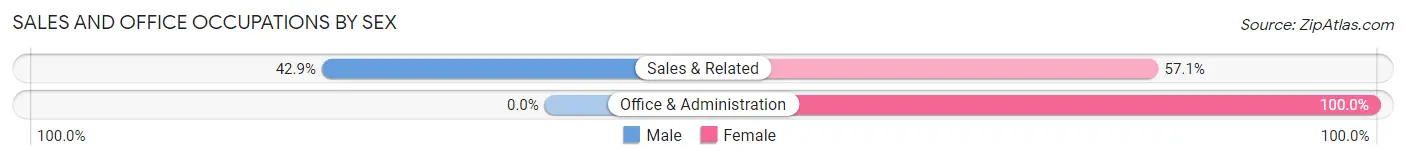
| Occupation | Male | Female |
| Sales & Related | 6 (42.9%) | 8 (57.1%) |
| Office & Administration | 0 (0.0%) | 19 (100.0%) |
| Total (Category) | 6 (18.2%) | 27 (81.8%) |
| Total (Overall) | 150 (44.4%) | 188 (55.6%) |
Natural Resources, Construction and Maintenance Occupations
The most common Natural Resources, Construction and Maintenance occupations in Northwest are Farming, Fishing & Forestry (13 | 3.8%), Construction & Extraction (12 | 3.5%), and Installation, Maintenance & Repair (5 | 1.5%).
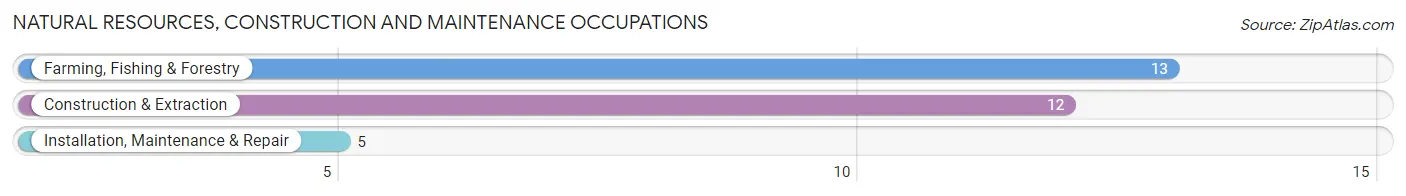
Natural Resources, Construction and Maintenance Occupations by Sex
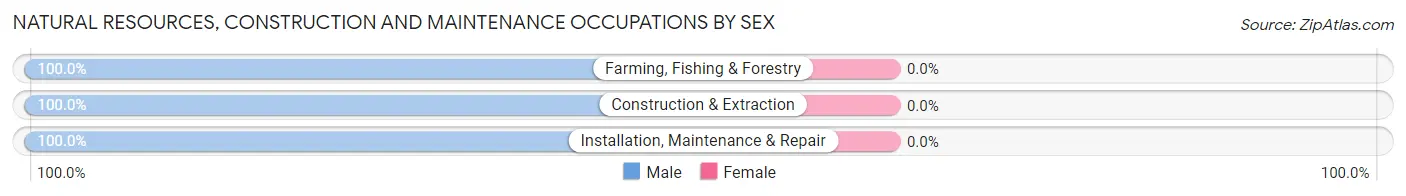
| Occupation | Male | Female |
| Farming, Fishing & Forestry | 13 (100.0%) | 0 (0.0%) |
| Construction & Extraction | 12 (100.0%) | 0 (0.0%) |
| Installation, Maintenance & Repair | 5 (100.0%) | 0 (0.0%) |
| Total (Category) | 30 (100.0%) | 0 (0.0%) |
| Total (Overall) | 150 (44.4%) | 188 (55.6%) |
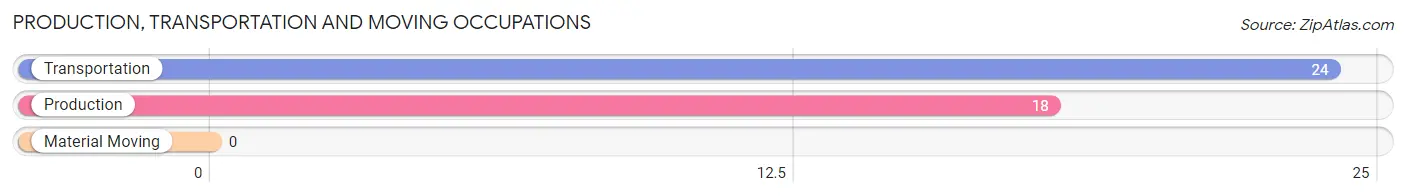
Production, Transportation and Moving Occupations
The most common Production, Transportation and Moving occupations in Northwest are Transportation (24 | 7.1%), and Production (18 | 5.3%).
Production, Transportation and Moving Occupations by Sex
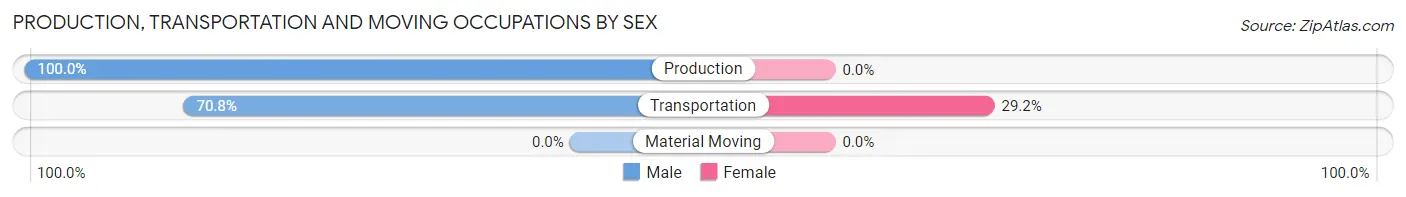
| Occupation | Male | Female |
| Production | 18 (100.0%) | 0 (0.0%) |
| Transportation | 17 (70.8%) | 7 (29.2%) |
| Material Moving | 0 (0.0%) | 0 (0.0%) |
| Total (Category) | 35 (83.3%) | 7 (16.7%) |
| Total (Overall) | 150 (44.4%) | 188 (55.6%) |
Employment Industries by Sex in Northwest
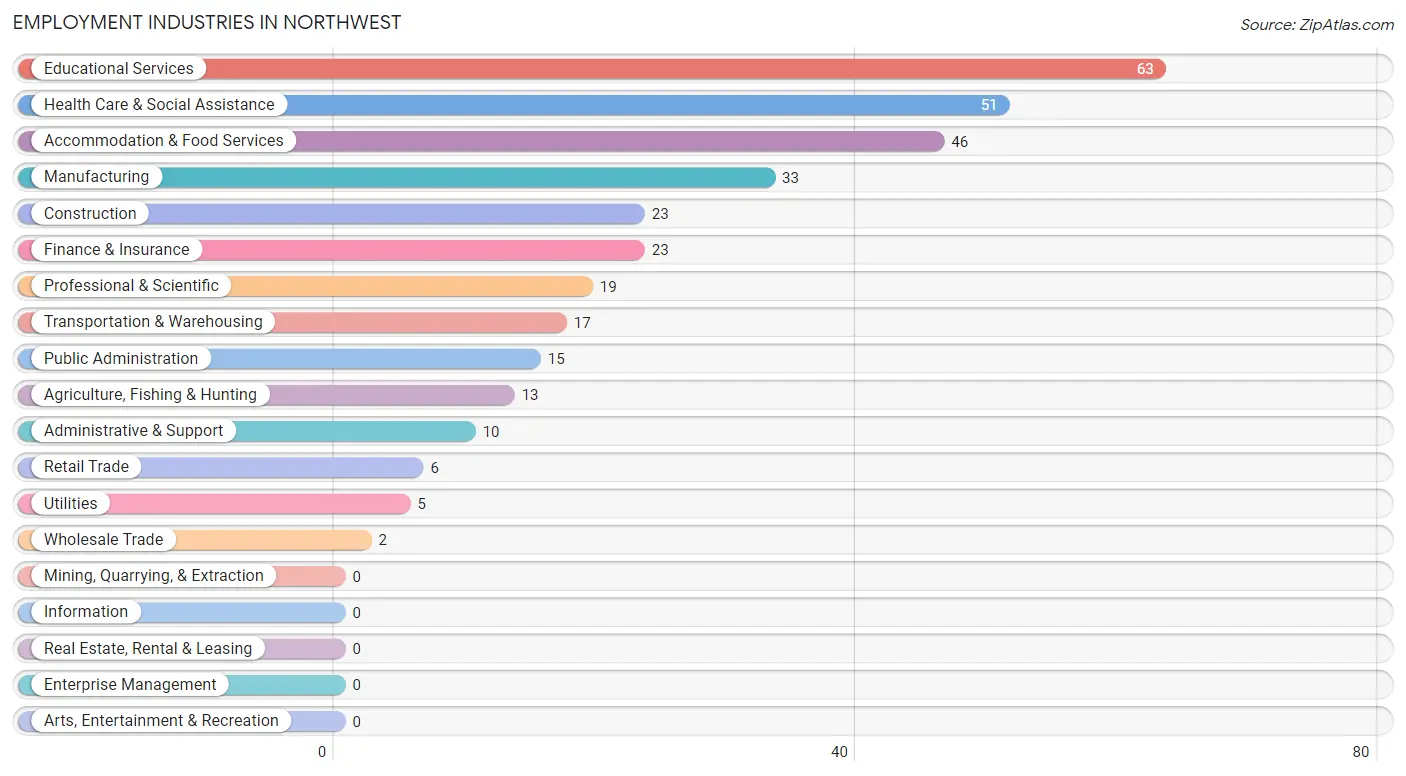
Employment Industries in Northwest
The major employment industries in Northwest include Educational Services (63 | 18.6%), Health Care & Social Assistance (51 | 15.1%), Accommodation & Food Services (46 | 13.6%), Manufacturing (33 | 9.8%), and Construction (23 | 6.8%).
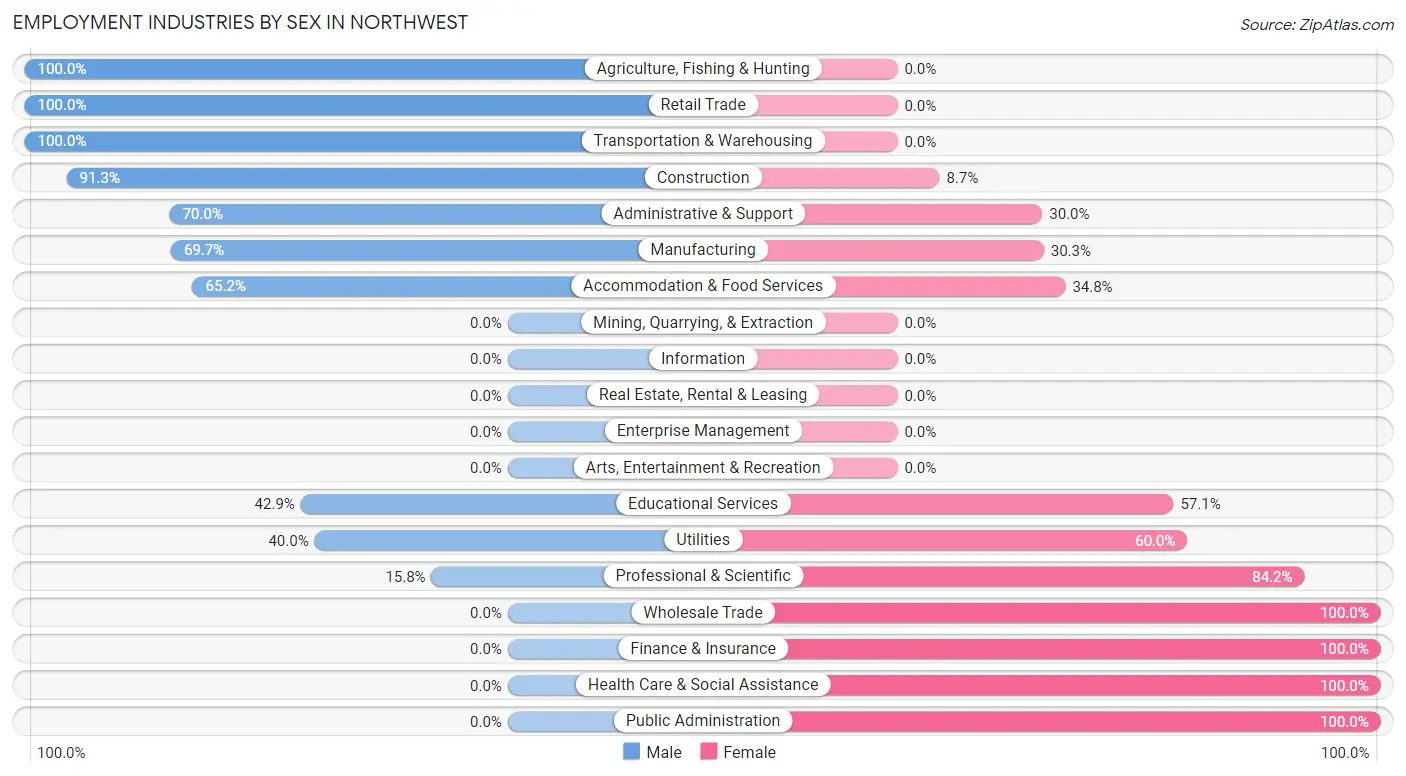
Employment Industries by Sex in Northwest
The Northwest industries that see more men than women are Agriculture, Fishing & Hunting (100.0%), Retail Trade (100.0%), and Transportation & Warehousing (100.0%), whereas the industries that tend to have a higher number of women are Wholesale Trade (100.0%), Finance & Insurance (100.0%), and Health Care & Social Assistance (100.0%).
| Industry | Male | Female |
| Agriculture, Fishing & Hunting | 13 (100.0%) | 0 (0.0%) |
| Mining, Quarrying, & Extraction | 0 (0.0%) | 0 (0.0%) |
| Construction | 21 (91.3%) | 2 (8.7%) |
| Manufacturing | 23 (69.7%) | 10 (30.3%) |
| Wholesale Trade | 0 (0.0%) | 2 (100.0%) |
| Retail Trade | 6 (100.0%) | 0 (0.0%) |
| Transportation & Warehousing | 17 (100.0%) | 0 (0.0%) |
| Utilities | 2 (40.0%) | 3 (60.0%) |
| Information | 0 (0.0%) | 0 (0.0%) |
| Finance & Insurance | 0 (0.0%) | 23 (100.0%) |
| Real Estate, Rental & Leasing | 0 (0.0%) | 0 (0.0%) |
| Professional & Scientific | 3 (15.8%) | 16 (84.2%) |
| Enterprise Management | 0 (0.0%) | 0 (0.0%) |
| Administrative & Support | 7 (70.0%) | 3 (30.0%) |
| Educational Services | 27 (42.9%) | 36 (57.1%) |
| Health Care & Social Assistance | 0 (0.0%) | 51 (100.0%) |
| Arts, Entertainment & Recreation | 0 (0.0%) | 0 (0.0%) |
| Accommodation & Food Services | 30 (65.2%) | 16 (34.8%) |
| Public Administration | 0 (0.0%) | 15 (100.0%) |
| Total | 150 (44.4%) | 188 (55.6%) |
Education in Northwest
School Enrollment in Northwest
The most common levels of schooling among the 150 students in Northwest are high school (60 | 40.0%), elementary school (28 | 18.7%), and college / undergraduate (22 | 14.7%).
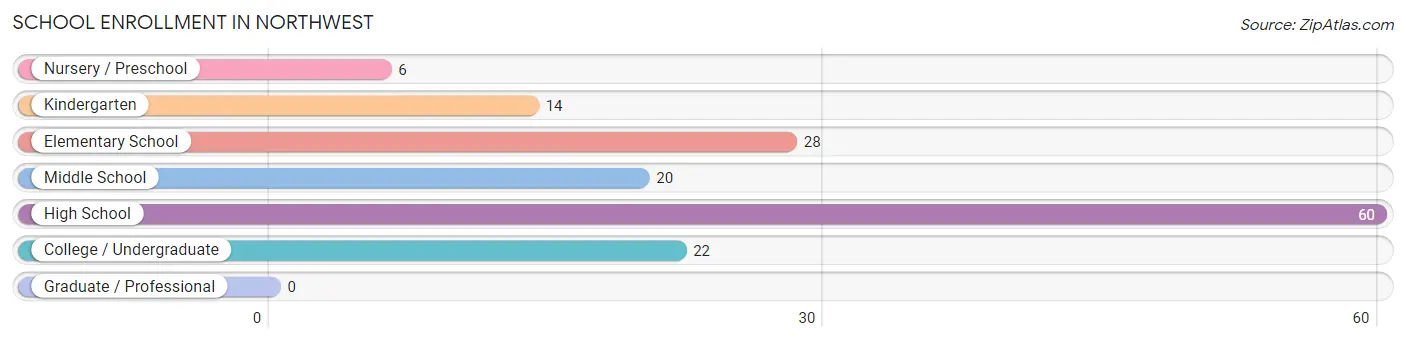
| School Level | # Students | % Students |
| Nursery / Preschool | 6 | 4.0% |
| Kindergarten | 14 | 9.3% |
| Elementary School | 28 | 18.7% |
| Middle School | 20 | 13.3% |
| High School | 60 | 40.0% |
| College / Undergraduate | 22 | 14.7% |
| Graduate / Professional | 0 | 0.0% |
| Total | 150 | 100.0% |
School Enrollment by Age by Funding Source in Northwest
Out of a total of 150 students who are enrolled in schools in Northwest, 23 (15.3%) attend a private institution, while the remaining 127 (84.7%) are enrolled in public schools. The age group of 3 to 4 year olds has the highest likelihood of being enrolled in private schools, with 3 (100.0% in the age bracket) enrolled. Conversely, the age group of 5 to 9 year old has the lowest likelihood of being enrolled in a private school, with 45 (100.0% in the age bracket) attending a public institution.
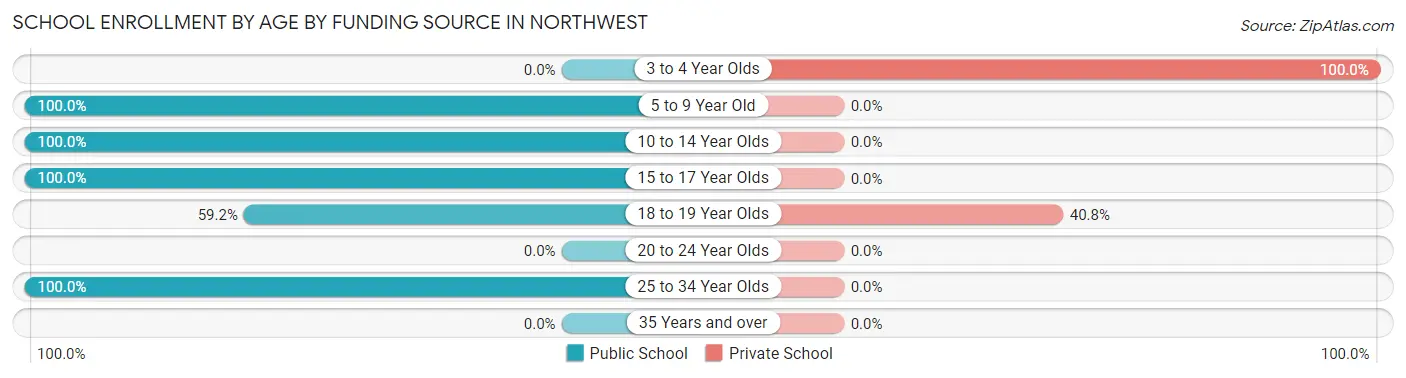
| Age Bracket | Public School | Private School |
| 3 to 4 Year Olds | 0 (0.0%) | 3 (100.0%) |
| 5 to 9 Year Old | 45 (100.0%) | 0 (0.0%) |
| 10 to 14 Year Olds | 20 (100.0%) | 0 (0.0%) |
| 15 to 17 Year Olds | 31 (100.0%) | 0 (0.0%) |
| 18 to 19 Year Olds | 29 (59.2%) | 20 (40.8%) |
| 20 to 24 Year Olds | 0 (0.0%) | 0 (0.0%) |
| 25 to 34 Year Olds | 2 (100.0%) | 0 (0.0%) |
| 35 Years and over | 0 (0.0%) | 0 (0.0%) |
| Total | 127 (84.7%) | 23 (15.3%) |
Educational Attainment by Field of Study in Northwest
Education (45 | 48.9%), arts & humanities (20 | 21.7%), business (14 | 15.2%), engineering (6 | 6.5%), and physical & health sciences (5 | 5.4%) are the most common fields of study among 92 individuals in Northwest who have obtained a bachelor's degree or higher.
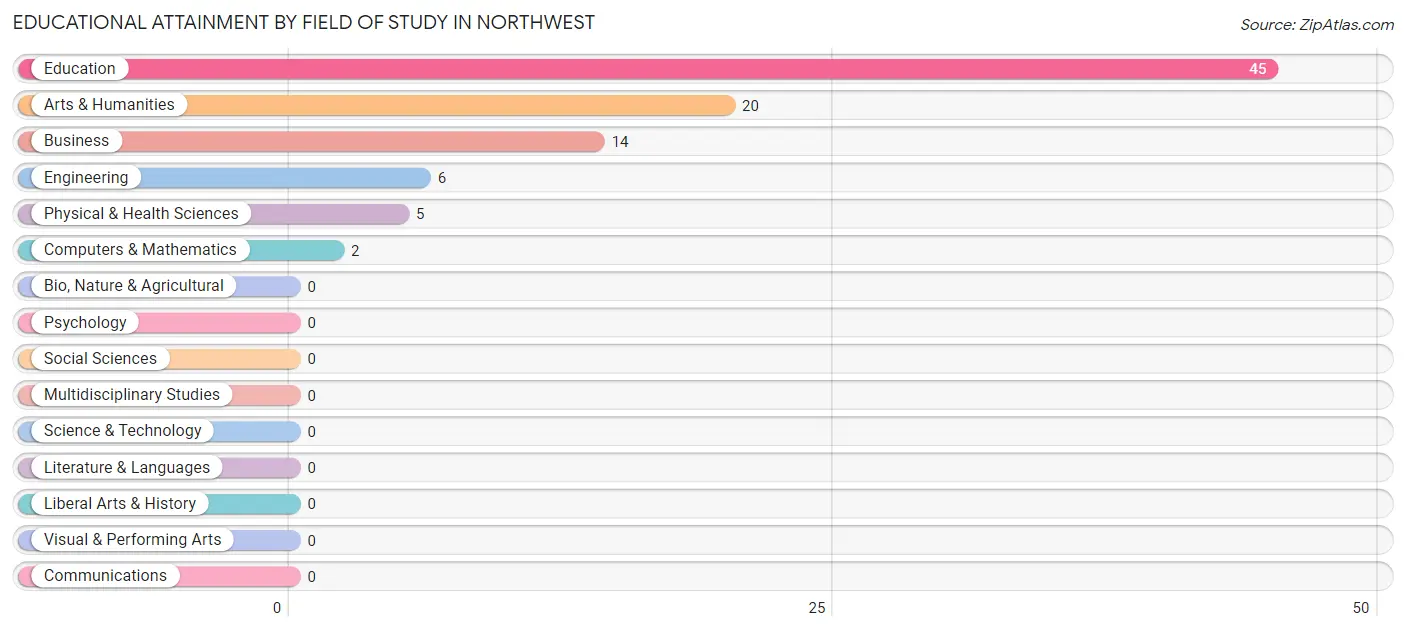
| Field of Study | # Graduates | % Graduates |
| Computers & Mathematics | 2 | 2.2% |
| Bio, Nature & Agricultural | 0 | 0.0% |
| Physical & Health Sciences | 5 | 5.4% |
| Psychology | 0 | 0.0% |
| Social Sciences | 0 | 0.0% |
| Engineering | 6 | 6.5% |
| Multidisciplinary Studies | 0 | 0.0% |
| Science & Technology | 0 | 0.0% |
| Business | 14 | 15.2% |
| Education | 45 | 48.9% |
| Literature & Languages | 0 | 0.0% |
| Liberal Arts & History | 0 | 0.0% |
| Visual & Performing Arts | 0 | 0.0% |
| Communications | 0 | 0.0% |
| Arts & Humanities | 20 | 21.7% |
| Total | 92 | 100.0% |
Transportation & Commute in Northwest
Vehicle Availability by Sex in Northwest
The most prevalent vehicle ownership categories in Northwest are males with 2 vehicles (86, accounting for 57.3%) and females with 2 vehicles (77, making up 45.7%).
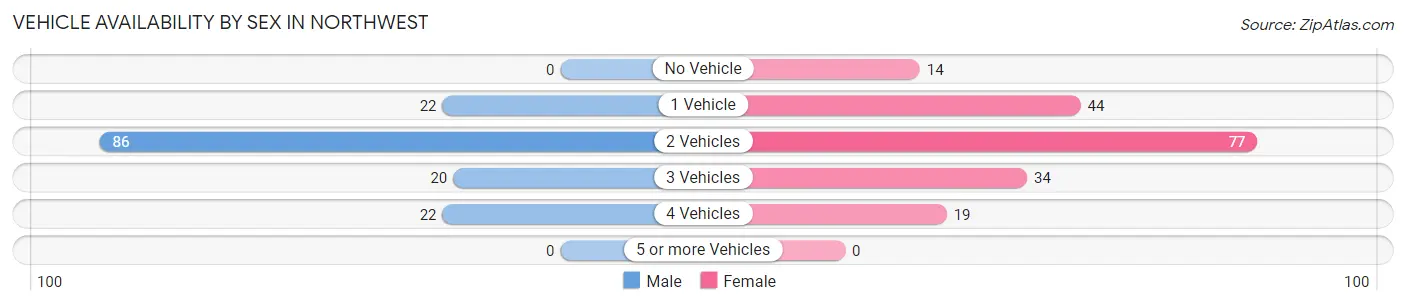
| Vehicles Available | Male | Female |
| No Vehicle | 0 (0.0%) | 14 (7.4%) |
| 1 Vehicle | 22 (14.7%) | 44 (23.4%) |
| 2 Vehicles | 86 (57.3%) | 77 (41.0%) |
| 3 Vehicles | 20 (13.3%) | 34 (18.1%) |
| 4 Vehicles | 22 (14.7%) | 19 (10.1%) |
| 5 or more Vehicles | 0 (0.0%) | 0 (0.0%) |
| Total | 150 (100.0%) | 188 (100.0%) |
Commute Time in Northwest
The most frequently occuring commute durations in Northwest are 15 to 19 minutes (58 commuters, 19.7%), 30 to 34 minutes (48 commuters, 16.3%), and 45 to 59 minutes (43 commuters, 14.6%).
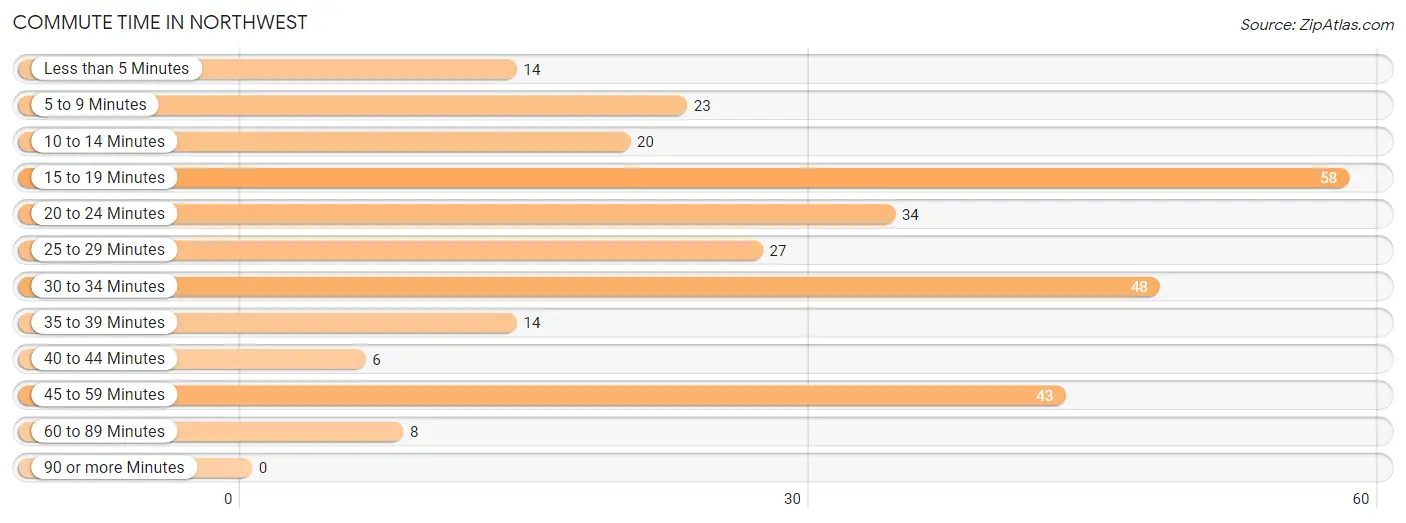
| Commute Time | # Commuters | % Commuters |
| Less than 5 Minutes | 14 | 4.8% |
| 5 to 9 Minutes | 23 | 7.8% |
| 10 to 14 Minutes | 20 | 6.8% |
| 15 to 19 Minutes | 58 | 19.7% |
| 20 to 24 Minutes | 34 | 11.5% |
| 25 to 29 Minutes | 27 | 9.1% |
| 30 to 34 Minutes | 48 | 16.3% |
| 35 to 39 Minutes | 14 | 4.8% |
| 40 to 44 Minutes | 6 | 2.0% |
| 45 to 59 Minutes | 43 | 14.6% |
| 60 to 89 Minutes | 8 | 2.7% |
| 90 or more Minutes | 0 | 0.0% |
Commute Time by Sex in Northwest
The most common commute times in Northwest are 15 to 19 minutes (35 commuters, 27.6%) for males and 30 to 34 minutes (30 commuters, 17.9%) for females.
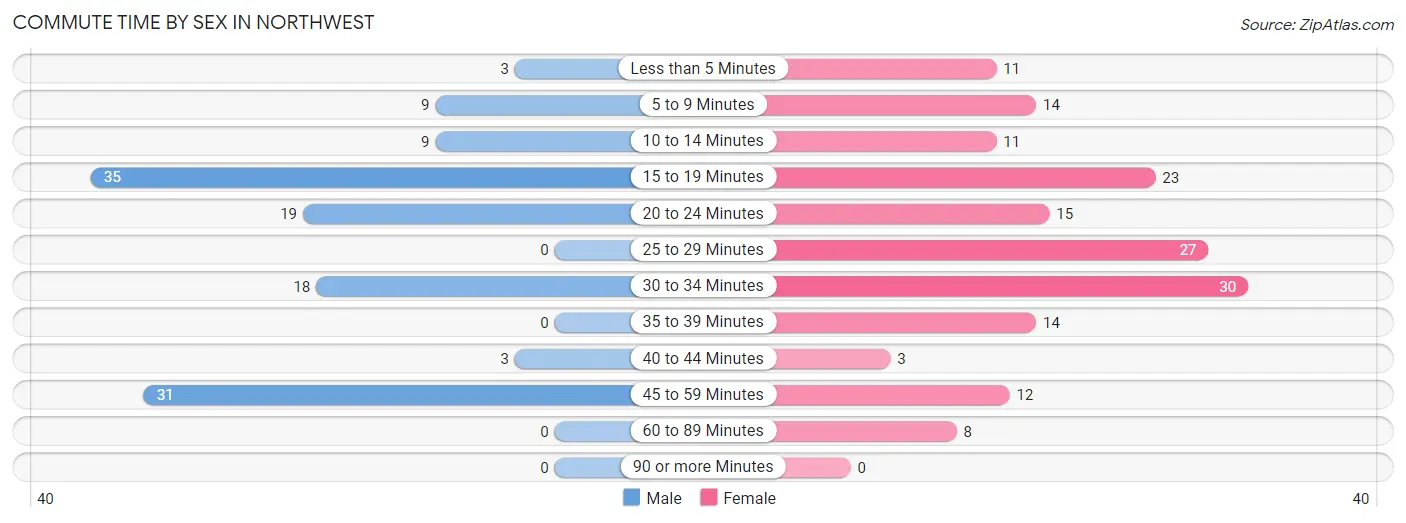
| Commute Time | Male | Female |
| Less than 5 Minutes | 3 (2.4%) | 11 (6.6%) |
| 5 to 9 Minutes | 9 (7.1%) | 14 (8.3%) |
| 10 to 14 Minutes | 9 (7.1%) | 11 (6.6%) |
| 15 to 19 Minutes | 35 (27.6%) | 23 (13.7%) |
| 20 to 24 Minutes | 19 (15.0%) | 15 (8.9%) |
| 25 to 29 Minutes | 0 (0.0%) | 27 (16.1%) |
| 30 to 34 Minutes | 18 (14.2%) | 30 (17.9%) |
| 35 to 39 Minutes | 0 (0.0%) | 14 (8.3%) |
| 40 to 44 Minutes | 3 (2.4%) | 3 (1.8%) |
| 45 to 59 Minutes | 31 (24.4%) | 12 (7.1%) |
| 60 to 89 Minutes | 0 (0.0%) | 8 (4.8%) |
| 90 or more Minutes | 0 (0.0%) | 0 (0.0%) |
Time of Departure to Work by Sex in Northwest
The most frequent times of departure to work in Northwest are 4:00 PM to 11:59 PM (42, 33.1%) for males and 5:30 AM to 5:59 AM (38, 22.6%) for females.
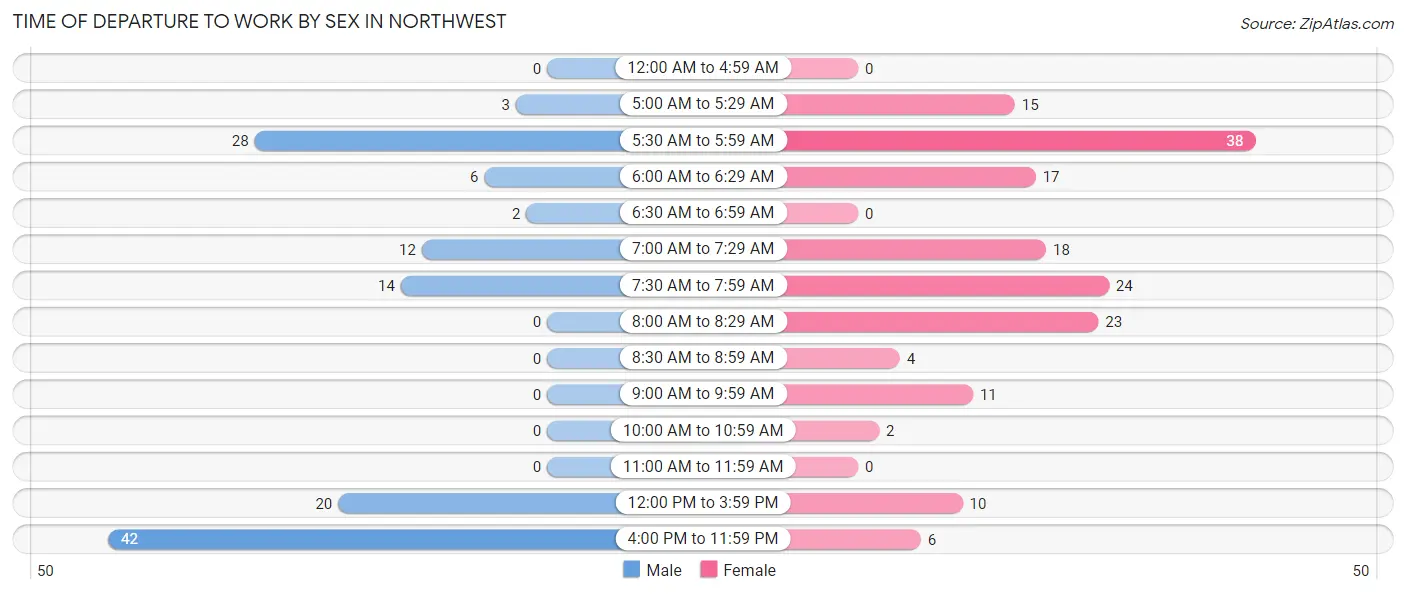
| Time of Departure | Male | Female |
| 12:00 AM to 4:59 AM | 0 (0.0%) | 0 (0.0%) |
| 5:00 AM to 5:29 AM | 3 (2.4%) | 15 (8.9%) |
| 5:30 AM to 5:59 AM | 28 (22.1%) | 38 (22.6%) |
| 6:00 AM to 6:29 AM | 6 (4.7%) | 17 (10.1%) |
| 6:30 AM to 6:59 AM | 2 (1.6%) | 0 (0.0%) |
| 7:00 AM to 7:29 AM | 12 (9.5%) | 18 (10.7%) |
| 7:30 AM to 7:59 AM | 14 (11.0%) | 24 (14.3%) |
| 8:00 AM to 8:29 AM | 0 (0.0%) | 23 (13.7%) |
| 8:30 AM to 8:59 AM | 0 (0.0%) | 4 (2.4%) |
| 9:00 AM to 9:59 AM | 0 (0.0%) | 11 (6.6%) |
| 10:00 AM to 10:59 AM | 0 (0.0%) | 2 (1.2%) |
| 11:00 AM to 11:59 AM | 0 (0.0%) | 0 (0.0%) |
| 12:00 PM to 3:59 PM | 20 (15.8%) | 10 (5.9%) |
| 4:00 PM to 11:59 PM | 42 (33.1%) | 6 (3.6%) |
| Total | 127 (100.0%) | 168 (100.0%) |
Housing Occupancy in Northwest
Occupancy by Ownership in Northwest
Of the total 342 dwellings in Northwest, owner-occupied units account for 283 (82.8%), while renter-occupied units make up 59 (17.2%).
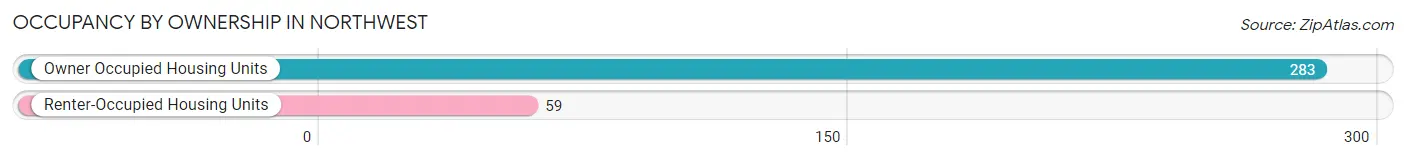
| Occupancy | # Housing Units | % Housing Units |
| Owner Occupied Housing Units | 283 | 82.8% |
| Renter-Occupied Housing Units | 59 | 17.2% |
| Total Occupied Housing Units | 342 | 100.0% |
Occupancy by Household Size in Northwest
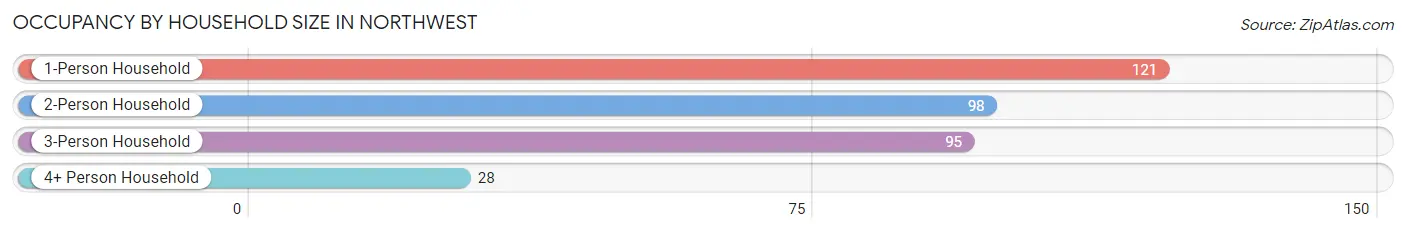
| Household Size | # Housing Units | % Housing Units |
| 1-Person Household | 121 | 35.4% |
| 2-Person Household | 98 | 28.6% |
| 3-Person Household | 95 | 27.8% |
| 4+ Person Household | 28 | 8.2% |
| Total Housing Units | 342 | 100.0% |
Occupancy by Ownership by Household Size in Northwest
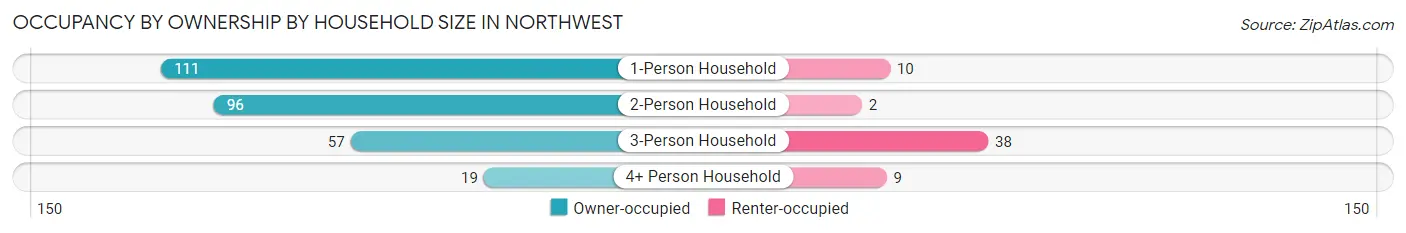
| Household Size | Owner-occupied | Renter-occupied |
| 1-Person Household | 111 (91.7%) | 10 (8.3%) |
| 2-Person Household | 96 (98.0%) | 2 (2.0%) |
| 3-Person Household | 57 (60.0%) | 38 (40.0%) |
| 4+ Person Household | 19 (67.9%) | 9 (32.1%) |
| Total Housing Units | 283 (82.8%) | 59 (17.2%) |
Occupancy by Educational Attainment in Northwest
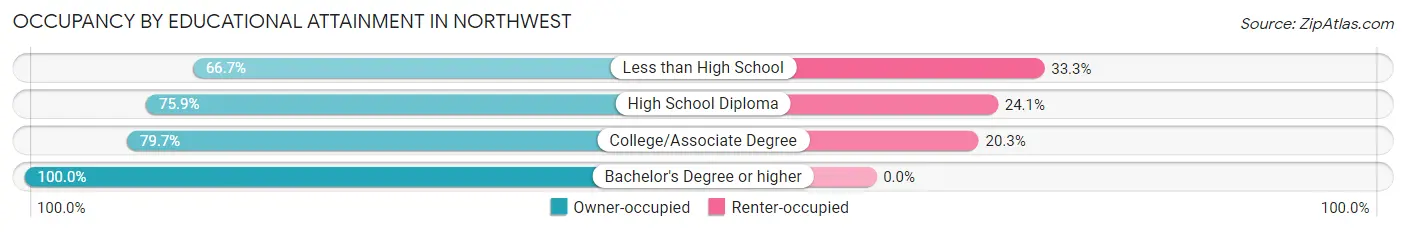
| Household Size | Owner-occupied | Renter-occupied |
| Less than High School | 10 (66.7%) | 5 (33.3%) |
| High School Diploma | 85 (75.9%) | 27 (24.1%) |
| College/Associate Degree | 106 (79.7%) | 27 (20.3%) |
| Bachelor's Degree or higher | 82 (100.0%) | 0 (0.0%) |
Occupancy by Age of Householder in Northwest
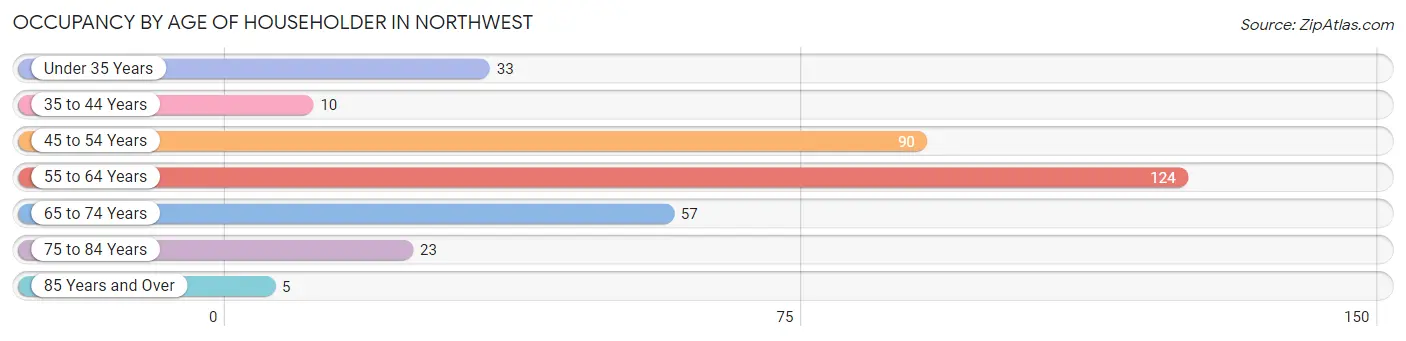
| Age Bracket | # Households | % Households |
| Under 35 Years | 33 | 9.7% |
| 35 to 44 Years | 10 | 2.9% |
| 45 to 54 Years | 90 | 26.3% |
| 55 to 64 Years | 124 | 36.3% |
| 65 to 74 Years | 57 | 16.7% |
| 75 to 84 Years | 23 | 6.7% |
| 85 Years and Over | 5 | 1.5% |
| Total | 342 | 100.0% |
Housing Finances in Northwest
Median Income by Occupancy in Northwest
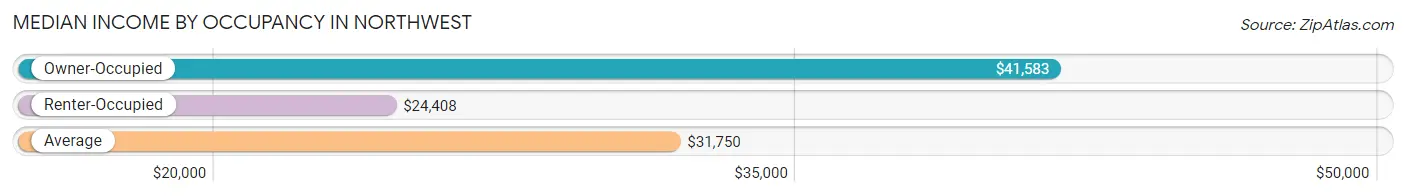
| Occupancy Type | # Households | Median Income |
| Owner-Occupied | 283 (82.8%) | $41,583 |
| Renter-Occupied | 59 (17.2%) | $24,408 |
| Average | 342 (100.0%) | $31,750 |
Occupancy by Householder Income Bracket in Northwest
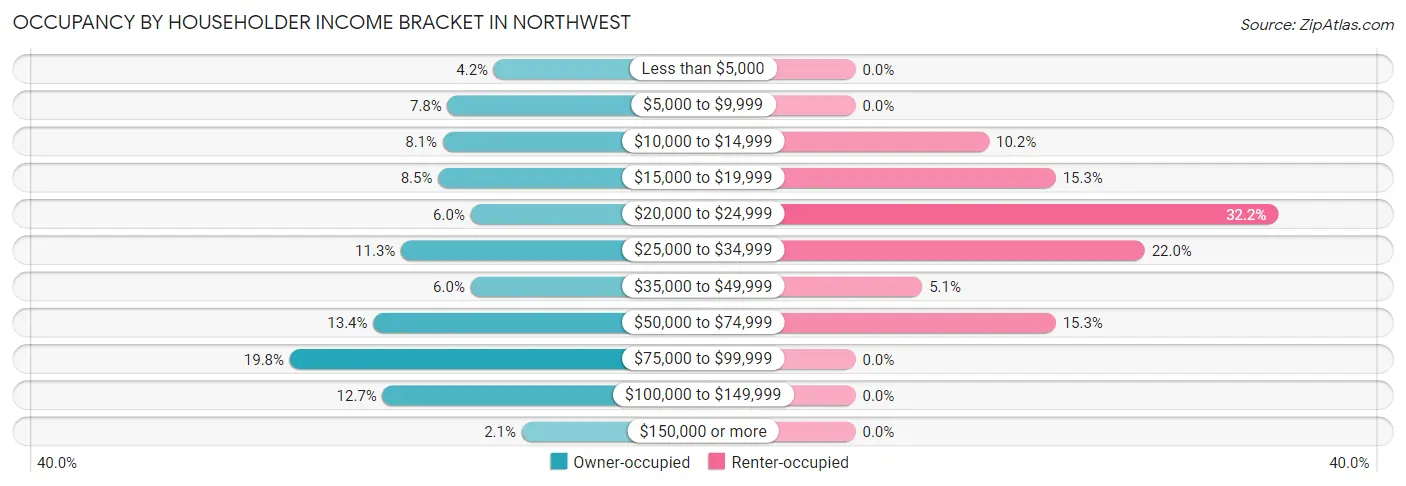
| Income Bracket | Owner-occupied | Renter-occupied |
| Less than $5,000 | 12 (4.2%) | 0 (0.0%) |
| $5,000 to $9,999 | 22 (7.8%) | 0 (0.0%) |
| $10,000 to $14,999 | 23 (8.1%) | 6 (10.2%) |
| $15,000 to $19,999 | 24 (8.5%) | 9 (15.2%) |
| $20,000 to $24,999 | 17 (6.0%) | 19 (32.2%) |
| $25,000 to $34,999 | 32 (11.3%) | 13 (22.0%) |
| $35,000 to $49,999 | 17 (6.0%) | 3 (5.1%) |
| $50,000 to $74,999 | 38 (13.4%) | 9 (15.2%) |
| $75,000 to $99,999 | 56 (19.8%) | 0 (0.0%) |
| $100,000 to $149,999 | 36 (12.7%) | 0 (0.0%) |
| $150,000 or more | 6 (2.1%) | 0 (0.0%) |
| Total | 283 (100.0%) | 59 (100.0%) |
Monthly Housing Cost Tiers in Northwest
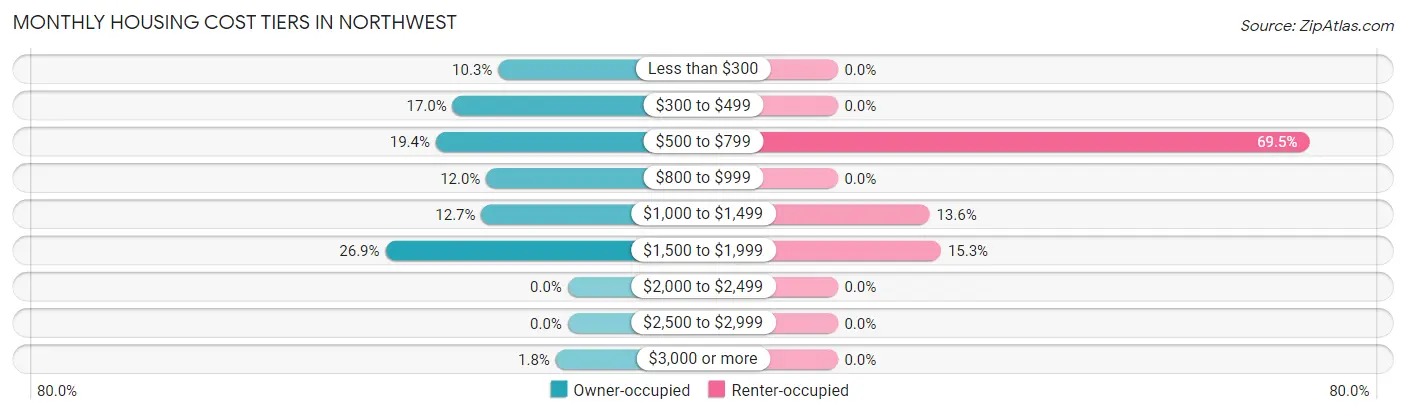
| Monthly Cost | Owner-occupied | Renter-occupied |
| Less than $300 | 29 (10.2%) | 0 (0.0%) |
| $300 to $499 | 48 (17.0%) | 0 (0.0%) |
| $500 to $799 | 55 (19.4%) | 41 (69.5%) |
| $800 to $999 | 34 (12.0%) | 0 (0.0%) |
| $1,000 to $1,499 | 36 (12.7%) | 8 (13.6%) |
| $1,500 to $1,999 | 76 (26.9%) | 9 (15.2%) |
| $2,000 to $2,499 | 0 (0.0%) | 0 (0.0%) |
| $2,500 to $2,999 | 0 (0.0%) | 0 (0.0%) |
| $3,000 or more | 5 (1.8%) | 0 (0.0%) |
| Total | 283 (100.0%) | 59 (100.0%) |
Physical Housing Characteristics in Northwest
Housing Structures in Northwest
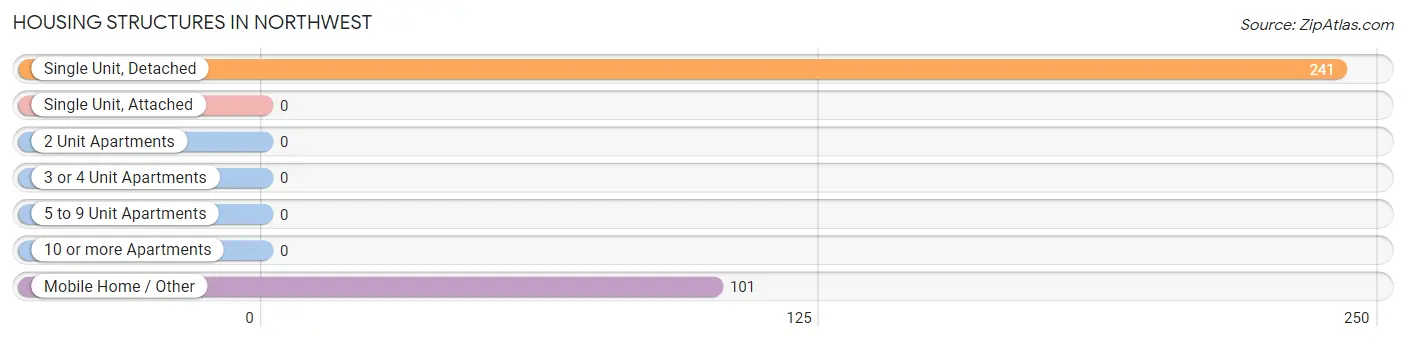
| Structure Type | # Housing Units | % Housing Units |
| Single Unit, Detached | 241 | 70.5% |
| Single Unit, Attached | 0 | 0.0% |
| 2 Unit Apartments | 0 | 0.0% |
| 3 or 4 Unit Apartments | 0 | 0.0% |
| 5 to 9 Unit Apartments | 0 | 0.0% |
| 10 or more Apartments | 0 | 0.0% |
| Mobile Home / Other | 101 | 29.5% |
| Total | 342 | 100.0% |
Housing Structures by Occupancy in Northwest
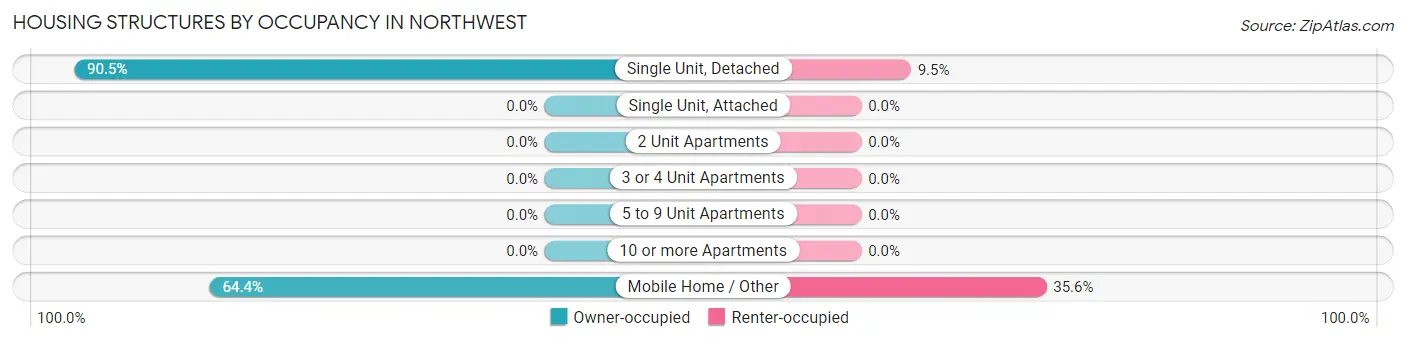
| Structure Type | Owner-occupied | Renter-occupied |
| Single Unit, Detached | 218 (90.5%) | 23 (9.5%) |
| Single Unit, Attached | 0 (0.0%) | 0 (0.0%) |
| 2 Unit Apartments | 0 (0.0%) | 0 (0.0%) |
| 3 or 4 Unit Apartments | 0 (0.0%) | 0 (0.0%) |
| 5 to 9 Unit Apartments | 0 (0.0%) | 0 (0.0%) |
| 10 or more Apartments | 0 (0.0%) | 0 (0.0%) |
| Mobile Home / Other | 65 (64.4%) | 36 (35.6%) |
| Total | 283 (82.8%) | 59 (17.2%) |
Housing Structures by Number of Rooms in Northwest
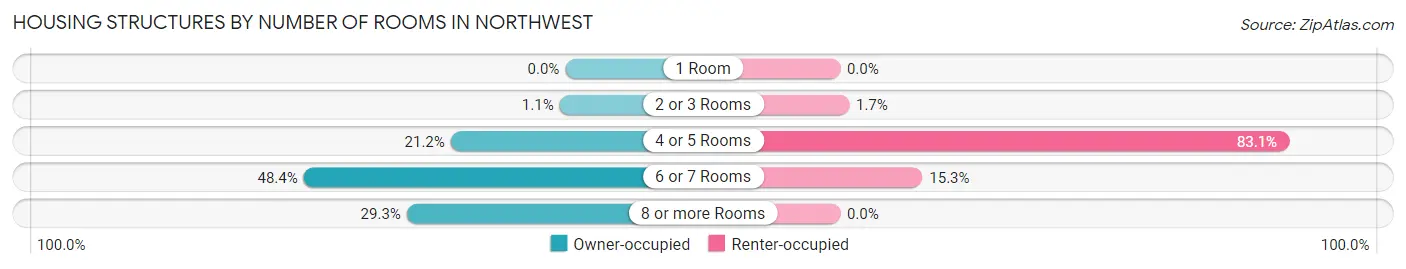
| Number of Rooms | Owner-occupied | Renter-occupied |
| 1 Room | 0 (0.0%) | 0 (0.0%) |
| 2 or 3 Rooms | 3 (1.1%) | 1 (1.7%) |
| 4 or 5 Rooms | 60 (21.2%) | 49 (83.1%) |
| 6 or 7 Rooms | 137 (48.4%) | 9 (15.2%) |
| 8 or more Rooms | 83 (29.3%) | 0 (0.0%) |
| Total | 283 (100.0%) | 59 (100.0%) |
Housing Structure by Heating Type in Northwest
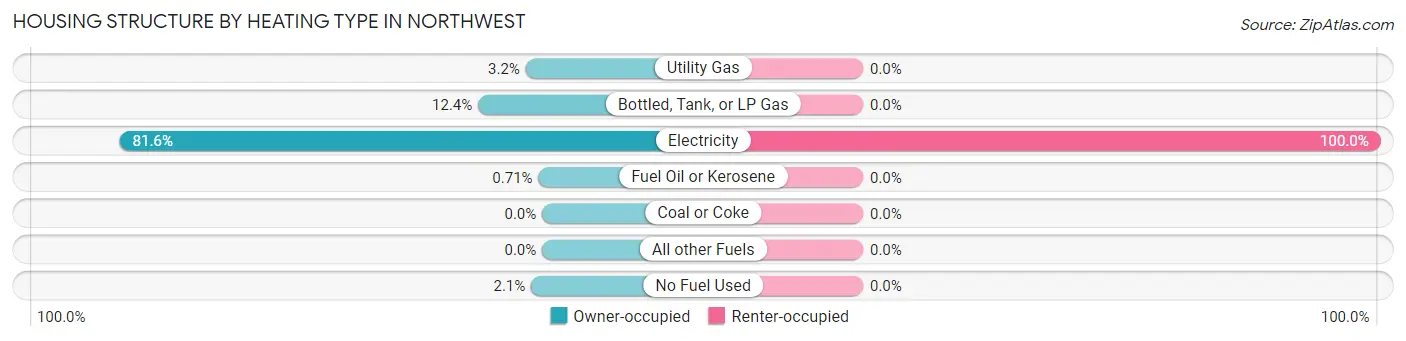
| Heating Type | Owner-occupied | Renter-occupied |
| Utility Gas | 9 (3.2%) | 0 (0.0%) |
| Bottled, Tank, or LP Gas | 35 (12.4%) | 0 (0.0%) |
| Electricity | 231 (81.6%) | 59 (100.0%) |
| Fuel Oil or Kerosene | 2 (0.7%) | 0 (0.0%) |
| Coal or Coke | 0 (0.0%) | 0 (0.0%) |
| All other Fuels | 0 (0.0%) | 0 (0.0%) |
| No Fuel Used | 6 (2.1%) | 0 (0.0%) |
| Total | 283 (100.0%) | 59 (100.0%) |
Household Vehicle Usage in Northwest
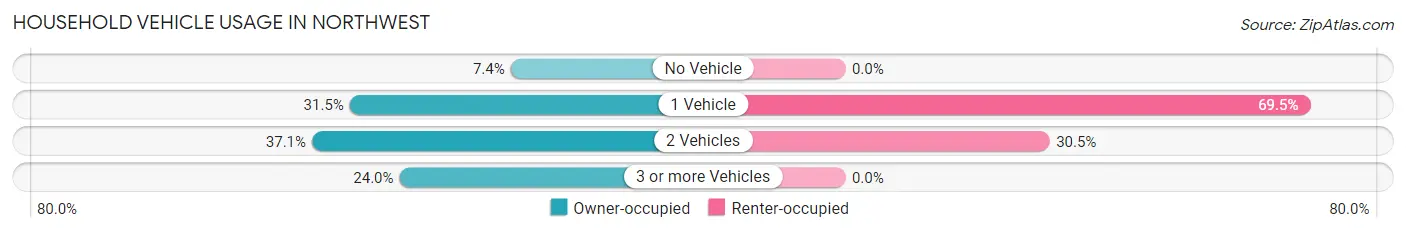
| Vehicles per Household | Owner-occupied | Renter-occupied |
| No Vehicle | 21 (7.4%) | 0 (0.0%) |
| 1 Vehicle | 89 (31.5%) | 41 (69.5%) |
| 2 Vehicles | 105 (37.1%) | 18 (30.5%) |
| 3 or more Vehicles | 68 (24.0%) | 0 (0.0%) |
| Total | 283 (100.0%) | 59 (100.0%) |
Real Estate & Mortgages in Northwest
Real Estate and Mortgage Overview in Northwest
| Characteristic | Without Mortgage | With Mortgage |
| Housing Units | 160 | 123 |
| Median Property Value | $123,300 | $94,400 |
| Median Household Income | - | - |
| Monthly Housing Costs | $522 | $5 |
| Real Estate Taxes | $900 | $16 |
Property Value by Mortgage Status in Northwest
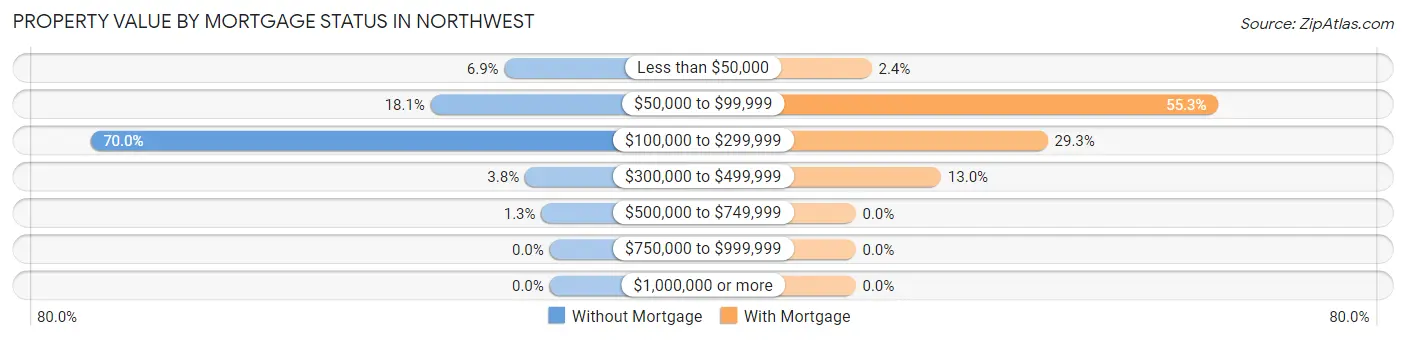
| Property Value | Without Mortgage | With Mortgage |
| Less than $50,000 | 11 (6.9%) | 3 (2.4%) |
| $50,000 to $99,999 | 29 (18.1%) | 68 (55.3%) |
| $100,000 to $299,999 | 112 (70.0%) | 36 (29.3%) |
| $300,000 to $499,999 | 6 (3.7%) | 16 (13.0%) |
| $500,000 to $749,999 | 2 (1.3%) | 0 (0.0%) |
| $750,000 to $999,999 | 0 (0.0%) | 0 (0.0%) |
| $1,000,000 or more | 0 (0.0%) | 0 (0.0%) |
| Total | 160 (100.0%) | 123 (100.0%) |
Household Income by Mortgage Status in Northwest
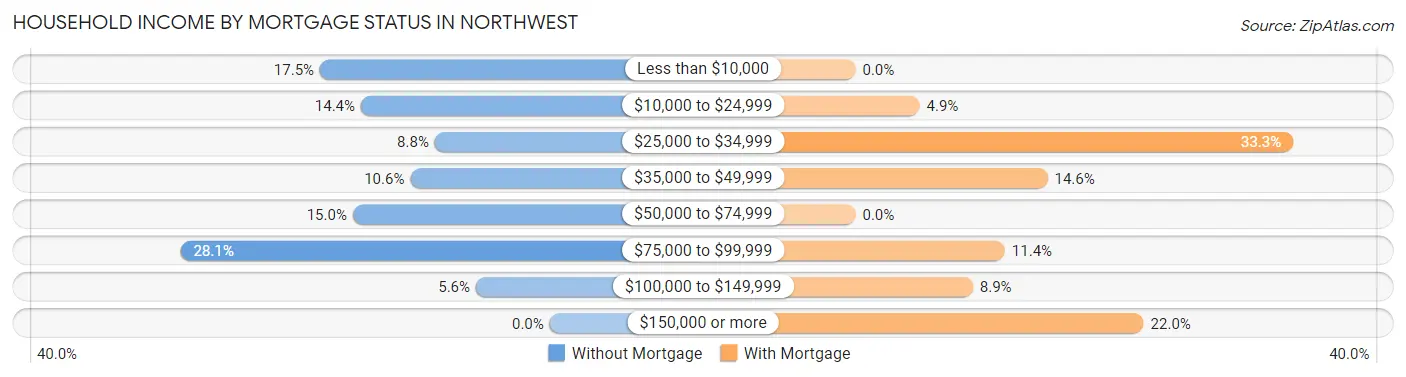
| Household Income | Without Mortgage | With Mortgage |
| Less than $10,000 | 28 (17.5%) | 0 (0.0%) |
| $10,000 to $24,999 | 23 (14.4%) | 6 (4.9%) |
| $25,000 to $34,999 | 14 (8.7%) | 41 (33.3%) |
| $35,000 to $49,999 | 17 (10.6%) | 18 (14.6%) |
| $50,000 to $74,999 | 24 (15.0%) | 0 (0.0%) |
| $75,000 to $99,999 | 45 (28.1%) | 14 (11.4%) |
| $100,000 to $149,999 | 9 (5.6%) | 11 (8.9%) |
| $150,000 or more | 0 (0.0%) | 27 (22.0%) |
| Total | 160 (100.0%) | 123 (100.0%) |
Property Value to Household Income Ratio in Northwest
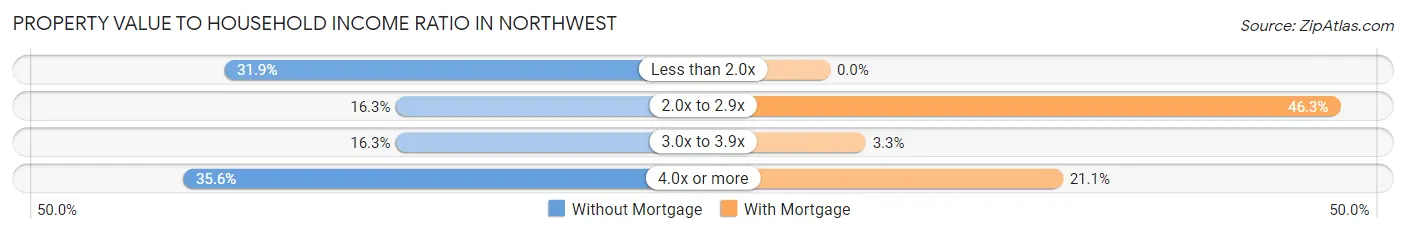
| Value-to-Income Ratio | Without Mortgage | With Mortgage |
| Less than 2.0x | 51 (31.9%) | 0 (0.0%) |
| 2.0x to 2.9x | 26 (16.3%) | 57 (46.3%) |
| 3.0x to 3.9x | 26 (16.3%) | 4 (3.3%) |
| 4.0x or more | 57 (35.6%) | 26 (21.1%) |
| Total | 160 (100.0%) | 123 (100.0%) |
Real Estate Taxes by Mortgage Status in Northwest
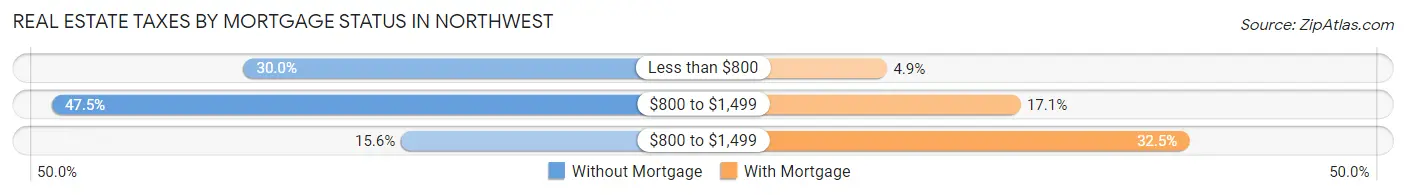
| Property Taxes | Without Mortgage | With Mortgage |
| Less than $800 | 48 (30.0%) | 6 (4.9%) |
| $800 to $1,499 | 76 (47.5%) | 21 (17.1%) |
| $800 to $1,499 | 25 (15.6%) | 40 (32.5%) |
| Total | 160 (100.0%) | 123 (100.0%) |
Health & Disability in Northwest
Health Insurance Coverage by Age in Northwest
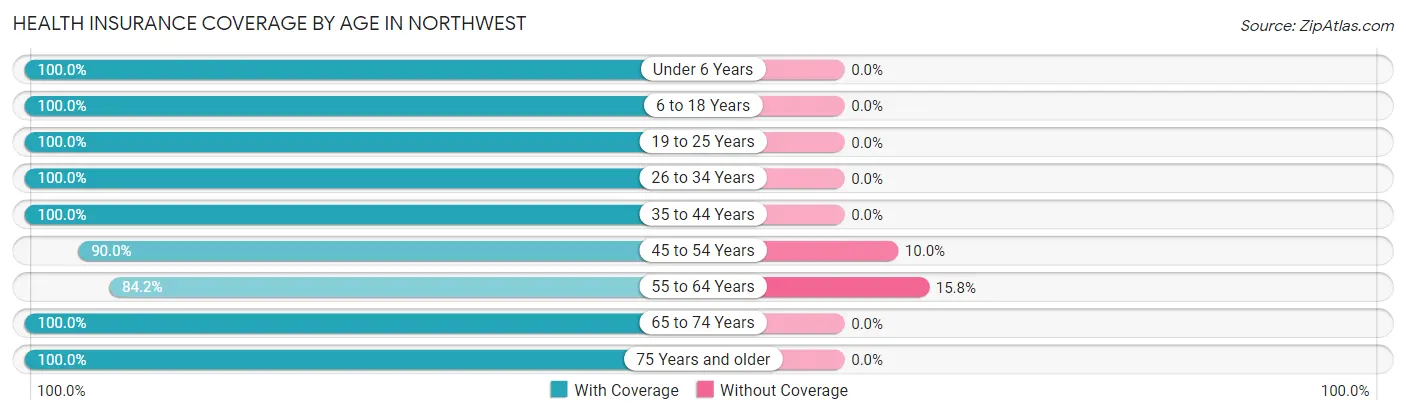
| Age Bracket | With Coverage | Without Coverage |
| Under 6 Years | 44 (100.0%) | 0 (0.0%) |
| 6 to 18 Years | 95 (100.0%) | 0 (0.0%) |
| 19 to 25 Years | 46 (100.0%) | 0 (0.0%) |
| 26 to 34 Years | 75 (100.0%) | 0 (0.0%) |
| 35 to 44 Years | 65 (100.0%) | 0 (0.0%) |
| 45 to 54 Years | 99 (90.0%) | 11 (10.0%) |
| 55 to 64 Years | 155 (84.2%) | 29 (15.8%) |
| 65 to 74 Years | 94 (100.0%) | 0 (0.0%) |
| 75 Years and older | 56 (100.0%) | 0 (0.0%) |
| Total | 729 (94.8%) | 40 (5.2%) |
Health Insurance Coverage by Citizenship Status in Northwest
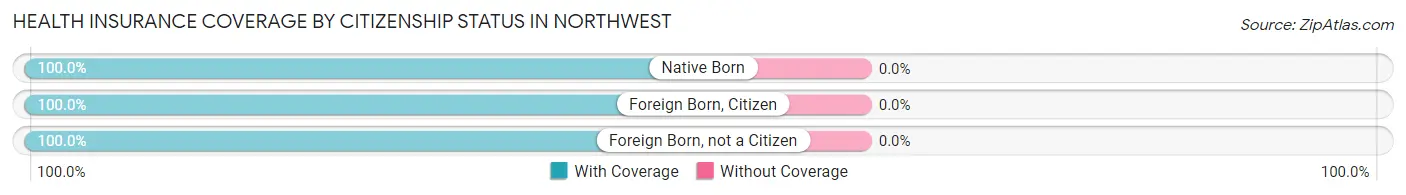
| Citizenship Status | With Coverage | Without Coverage |
| Native Born | 44 (100.0%) | 0 (0.0%) |
| Foreign Born, Citizen | 95 (100.0%) | 0 (0.0%) |
| Foreign Born, not a Citizen | 46 (100.0%) | 0 (0.0%) |
Health Insurance Coverage by Household Income in Northwest
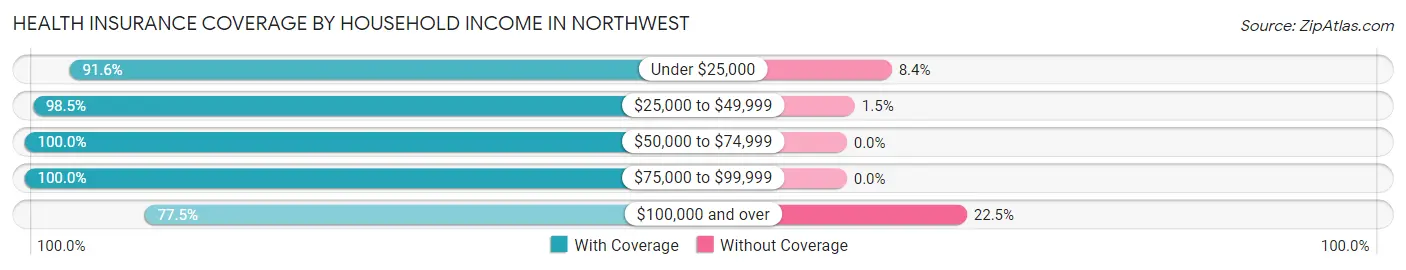
| Household Income | With Coverage | Without Coverage |
| Under $25,000 | 207 (91.6%) | 19 (8.4%) |
| $25,000 to $49,999 | 195 (98.5%) | 3 (1.5%) |
| $50,000 to $74,999 | 135 (100.0%) | 0 (0.0%) |
| $75,000 to $99,999 | 130 (100.0%) | 0 (0.0%) |
| $100,000 and over | 62 (77.5%) | 18 (22.5%) |
Public vs Private Health Insurance Coverage by Age in Northwest
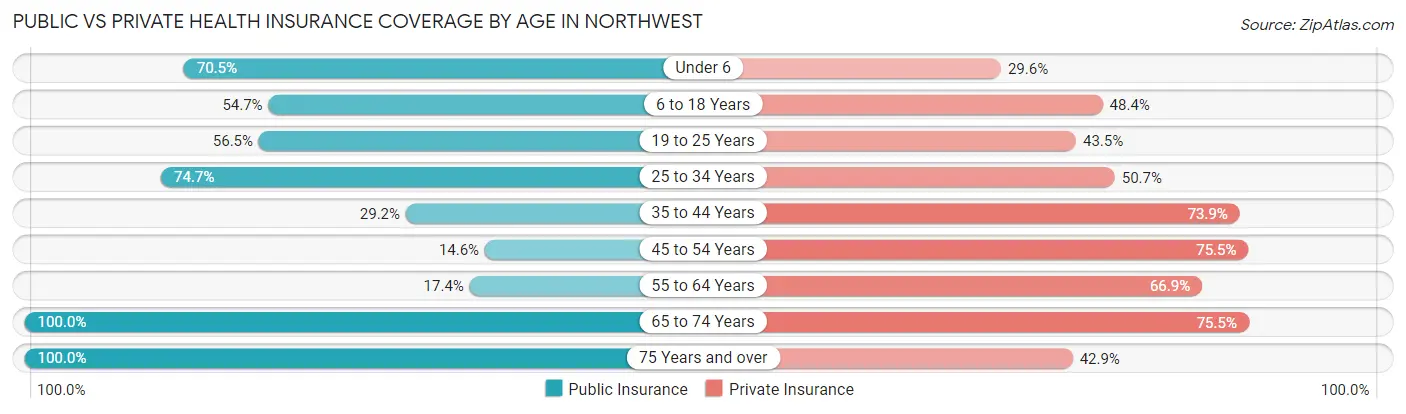
| Age Bracket | Public Insurance | Private Insurance |
| Under 6 | 31 (70.5%) | 13 (29.5%) |
| 6 to 18 Years | 52 (54.7%) | 46 (48.4%) |
| 19 to 25 Years | 26 (56.5%) | 20 (43.5%) |
| 25 to 34 Years | 56 (74.7%) | 38 (50.7%) |
| 35 to 44 Years | 19 (29.2%) | 48 (73.9%) |
| 45 to 54 Years | 16 (14.5%) | 83 (75.4%) |
| 55 to 64 Years | 32 (17.4%) | 123 (66.8%) |
| 65 to 74 Years | 94 (100.0%) | 71 (75.5%) |
| 75 Years and over | 56 (100.0%) | 24 (42.9%) |
| Total | 382 (49.7%) | 466 (60.6%) |
Disability Status by Sex by Age in Northwest
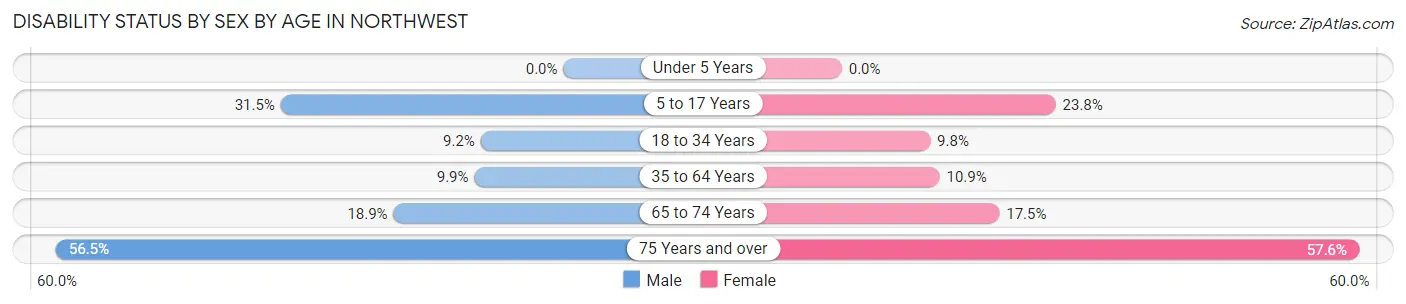
| Age Bracket | Male | Female |
| Under 5 Years | 0 (0.0%) | 0 (0.0%) |
| 5 to 17 Years | 17 (31.5%) | 10 (23.8%) |
| 18 to 34 Years | 7 (9.2%) | 6 (9.8%) |
| 35 to 64 Years | 11 (9.9%) | 27 (10.9%) |
| 65 to 74 Years | 7 (18.9%) | 10 (17.5%) |
| 75 Years and over | 13 (56.5%) | 19 (57.6%) |
Disability Class by Sex by Age in Northwest
Disability Class: Hearing Difficulty
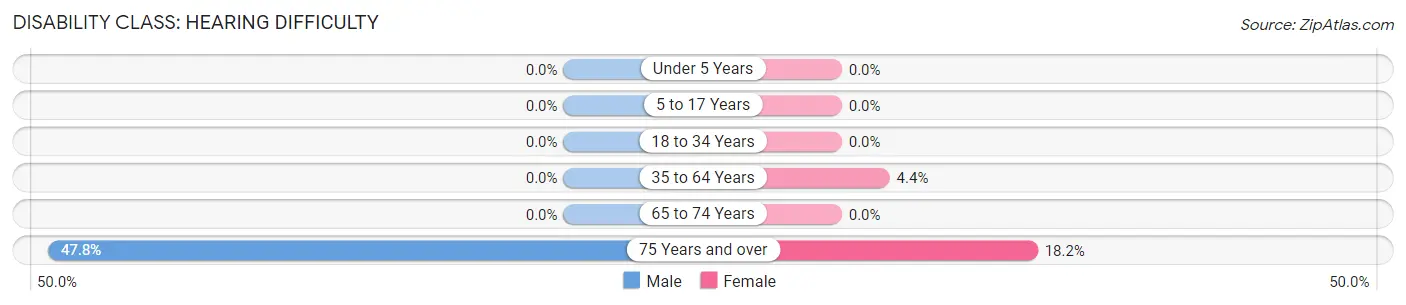
| Age Bracket | Male | Female |
| Under 5 Years | 0 (0.0%) | 0 (0.0%) |
| 5 to 17 Years | 0 (0.0%) | 0 (0.0%) |
| 18 to 34 Years | 0 (0.0%) | 0 (0.0%) |
| 35 to 64 Years | 0 (0.0%) | 11 (4.4%) |
| 65 to 74 Years | 0 (0.0%) | 0 (0.0%) |
| 75 Years and over | 11 (47.8%) | 6 (18.2%) |
Disability Class: Vision Difficulty
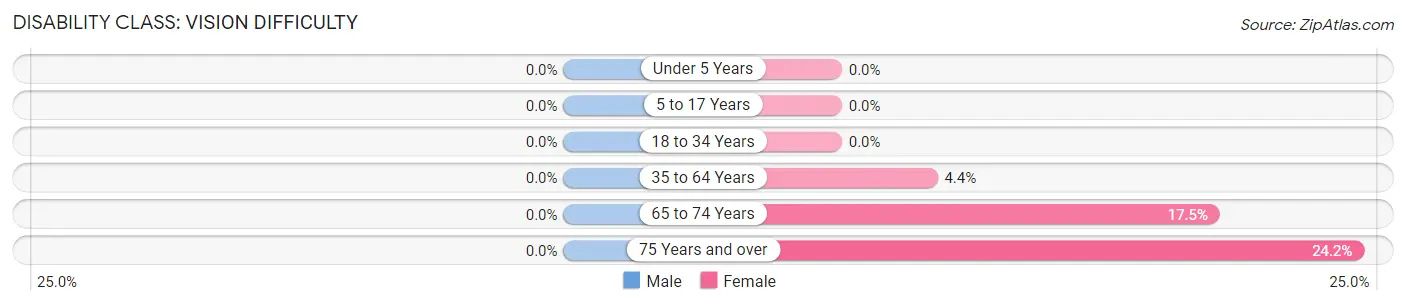
| Age Bracket | Male | Female |
| Under 5 Years | 0 (0.0%) | 0 (0.0%) |
| 5 to 17 Years | 0 (0.0%) | 0 (0.0%) |
| 18 to 34 Years | 0 (0.0%) | 0 (0.0%) |
| 35 to 64 Years | 0 (0.0%) | 11 (4.4%) |
| 65 to 74 Years | 0 (0.0%) | 10 (17.5%) |
| 75 Years and over | 0 (0.0%) | 8 (24.2%) |
Disability Class: Cognitive Difficulty
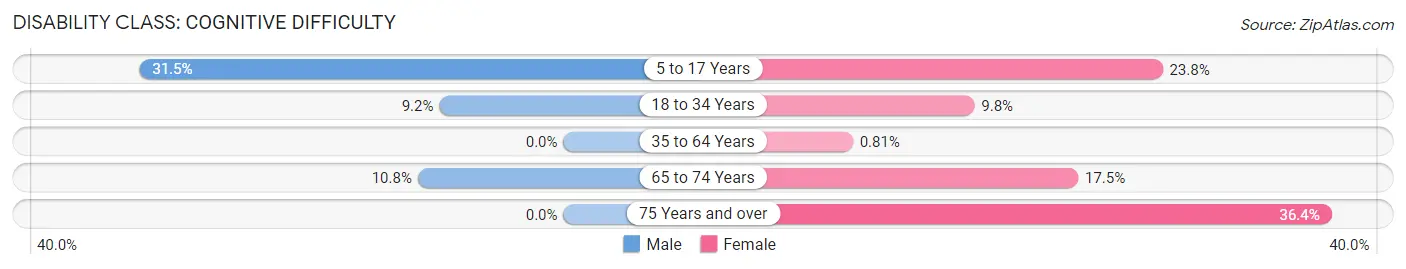
| Age Bracket | Male | Female |
| 5 to 17 Years | 17 (31.5%) | 10 (23.8%) |
| 18 to 34 Years | 7 (9.2%) | 6 (9.8%) |
| 35 to 64 Years | 0 (0.0%) | 2 (0.8%) |
| 65 to 74 Years | 4 (10.8%) | 10 (17.5%) |
| 75 Years and over | 0 (0.0%) | 12 (36.4%) |
Disability Class: Ambulatory Difficulty
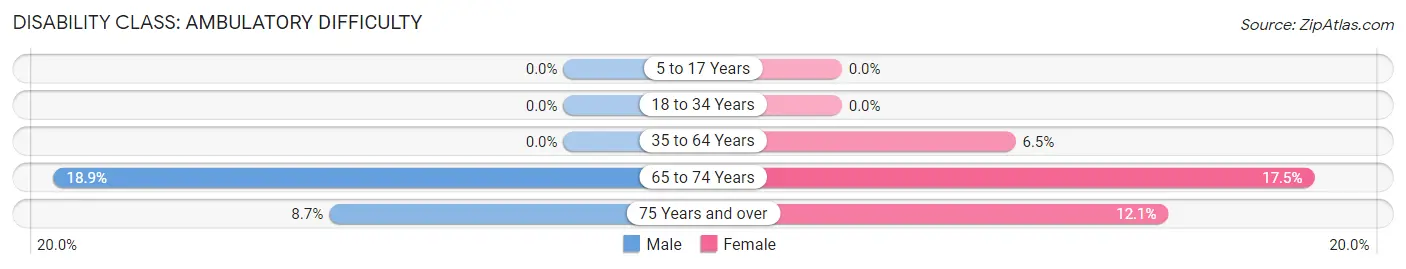
| Age Bracket | Male | Female |
| 5 to 17 Years | 0 (0.0%) | 0 (0.0%) |
| 18 to 34 Years | 0 (0.0%) | 0 (0.0%) |
| 35 to 64 Years | 0 (0.0%) | 16 (6.5%) |
| 65 to 74 Years | 7 (18.9%) | 10 (17.5%) |
| 75 Years and over | 2 (8.7%) | 4 (12.1%) |
Disability Class: Self-Care Difficulty
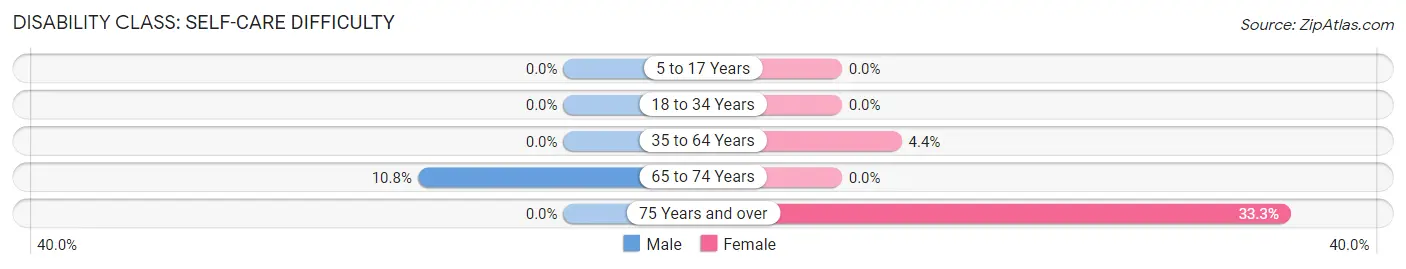
| Age Bracket | Male | Female |
| 5 to 17 Years | 0 (0.0%) | 0 (0.0%) |
| 18 to 34 Years | 0 (0.0%) | 0 (0.0%) |
| 35 to 64 Years | 0 (0.0%) | 11 (4.4%) |
| 65 to 74 Years | 4 (10.8%) | 0 (0.0%) |
| 75 Years and over | 0 (0.0%) | 11 (33.3%) |
Technology Access in Northwest
Computing Device Access in Northwest
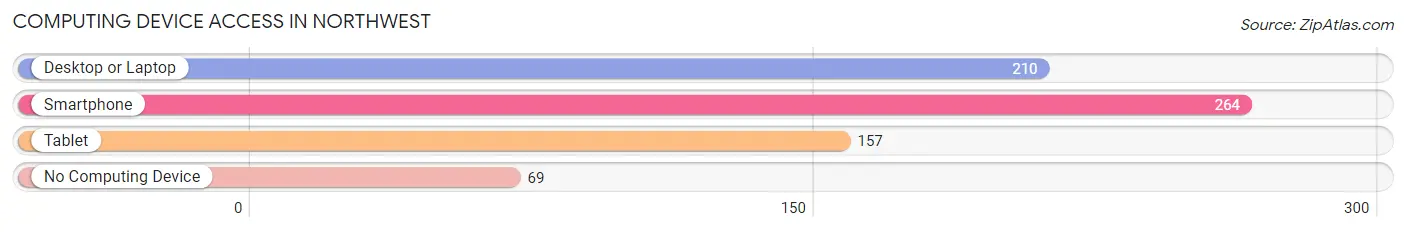
| Device Type | # Households | % Households |
| Desktop or Laptop | 210 | 61.4% |
| Smartphone | 264 | 77.2% |
| Tablet | 157 | 45.9% |
| No Computing Device | 69 | 20.2% |
| Total | 342 | 100.0% |
Internet Access in Northwest
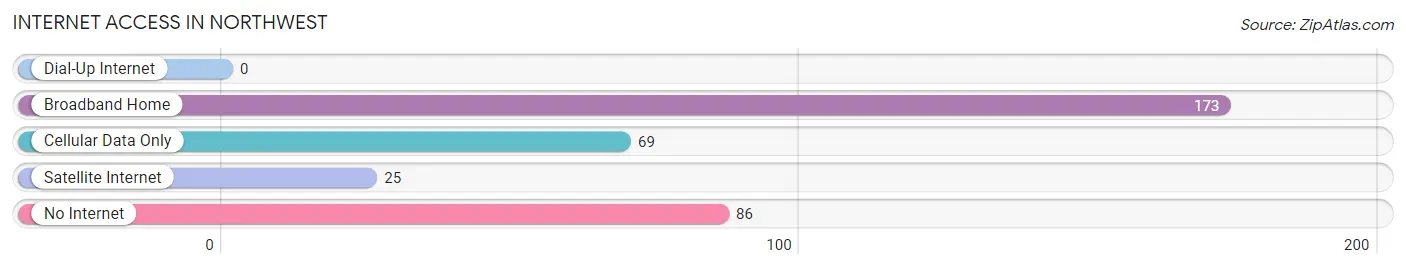
| Internet Type | # Households | % Households |
| Dial-Up Internet | 0 | 0.0% |
| Broadband Home | 173 | 50.6% |
| Cellular Data Only | 69 | 20.2% |
| Satellite Internet | 25 | 7.3% |
| No Internet | 86 | 25.2% |
| Total | 342 | 100.0% |
Northwest Summary
Northwest North Carolina is a region of the state that is known for its rich history, diverse geography, and vibrant economy. The region is home to a variety of people, cultures, and industries, making it an important part of the state’s economy and culture.
History
Northwest North Carolina has a long and varied history. The region was first inhabited by Native American tribes, including the Cherokee, Catawba, and Tuscarora. These tribes were largely displaced by European settlers in the 18th and 19th centuries. The region was also home to a number of African American communities, many of which were established after the Civil War.
The region was also home to a number of important industries, including textiles, furniture, and tobacco. These industries helped to shape the region’s economy and culture. The region was also home to a number of important educational institutions, including Appalachian State University and Wake Forest University.
Geography
Northwest North Carolina is located in the western part of the state, bordering Tennessee and Virginia. The region is largely mountainous, with the Blue Ridge Mountains to the east and the Great Smoky Mountains to the west. The region is also home to a number of rivers, including the Catawba, French Broad, and Yadkin.
The region is also home to a number of national and state parks, including the Great Smoky Mountains National Park, the Blue Ridge Parkway, and the Appalachian Trail. These parks provide a variety of recreational opportunities for visitors and locals alike.
Economy
Northwest North Carolina is home to a diverse economy. The region is home to a number of industries, including manufacturing, agriculture, and tourism. The region is also home to a number of educational institutions, including Appalachian State University and Wake Forest University.
The region is also home to a number of major employers, including the North Carolina Department of Transportation, Duke Energy, and the North Carolina Department of Commerce. These employers provide a variety of jobs and economic opportunities for the region’s residents.
Demographics
Northwest North Carolina is home to a diverse population. According to the 2010 census, the region’s population was 1,845,922. The region is home to a variety of ethnic and racial groups, including African Americans, Hispanics, and Native Americans. The region is also home to a number of religious groups, including Baptists, Methodists, and Catholics.
The region is also home to a number of cities and towns, including Asheville, Boone, and Winston-Salem. These cities and towns provide a variety of services and amenities for the region’s residents.
Conclusion
Northwest North Carolina is a region of the state that is known for its rich history, diverse geography, and vibrant economy. The region is home to a variety of people, cultures, and industries, making it an important part of the state’s economy and culture. The region is home to a number of important industries, educational institutions, and employers, providing a variety of jobs and economic opportunities for the region’s residents. The region is also home to a diverse population, with a variety of ethnic and racial groups, religious groups, and cities and towns. Northwest North Carolina is an important part of the state’s economy and culture, and its residents are proud to call it home.
Common Questions
What is Per Capita Income in Northwest?
Per Capita income in Northwest is $22,615.
What is the Median Household income in Northwest?
Median Household Income in Northwest is $31,750.
What is Income or Wage Gap in Northwest?
Income or Wage Gap in Northwest is 17.8%.
Women in Northwest earn 82.2 cents for every dollar earned by a man.
What is Inequality or Gini Index in Northwest?
Inequality or Gini Index in Northwest is 0.43.
What is the Total Population of Northwest?
Total Population of Northwest is 769.
What is the Total Male Population of Northwest?
Total Male Population of Northwest is 307.
What is the Total Female Population of Northwest?
Total Female Population of Northwest is 462.
What is the Ratio of Males per 100 Females in Northwest?
There are 66.45 Males per 100 Females in Northwest.
What is the Ratio of Females per 100 Males in Northwest?
There are 150.49 Females per 100 Males in Northwest.
What is the Median Population Age in Northwest?
Median Population Age in Northwest is 52.5 Years.
What is the Average Family Size in Northwest
Average Family Size in Northwest is 2.9 People.
What is the Average Household Size in Northwest
Average Household Size in Northwest is 2.2 People.
How Large is the Labor Force in Northwest?
There are 379 People in the Labor Forcein in Northwest.
What is the Percentage of People in the Labor Force in Northwest?
56.0% of People are in the Labor Force in Northwest.
What is the Unemployment Rate in Northwest?
Unemployment Rate in Northwest is 10.8%.