Zip Codes with the Highest Percentage of Population Employed in Food Preparation & Serving in Chapel Hill, NC
RELATED REPORTS & OPTIONS
Food Preparation & Serving
Chapel Hill
Compare Zip Codes
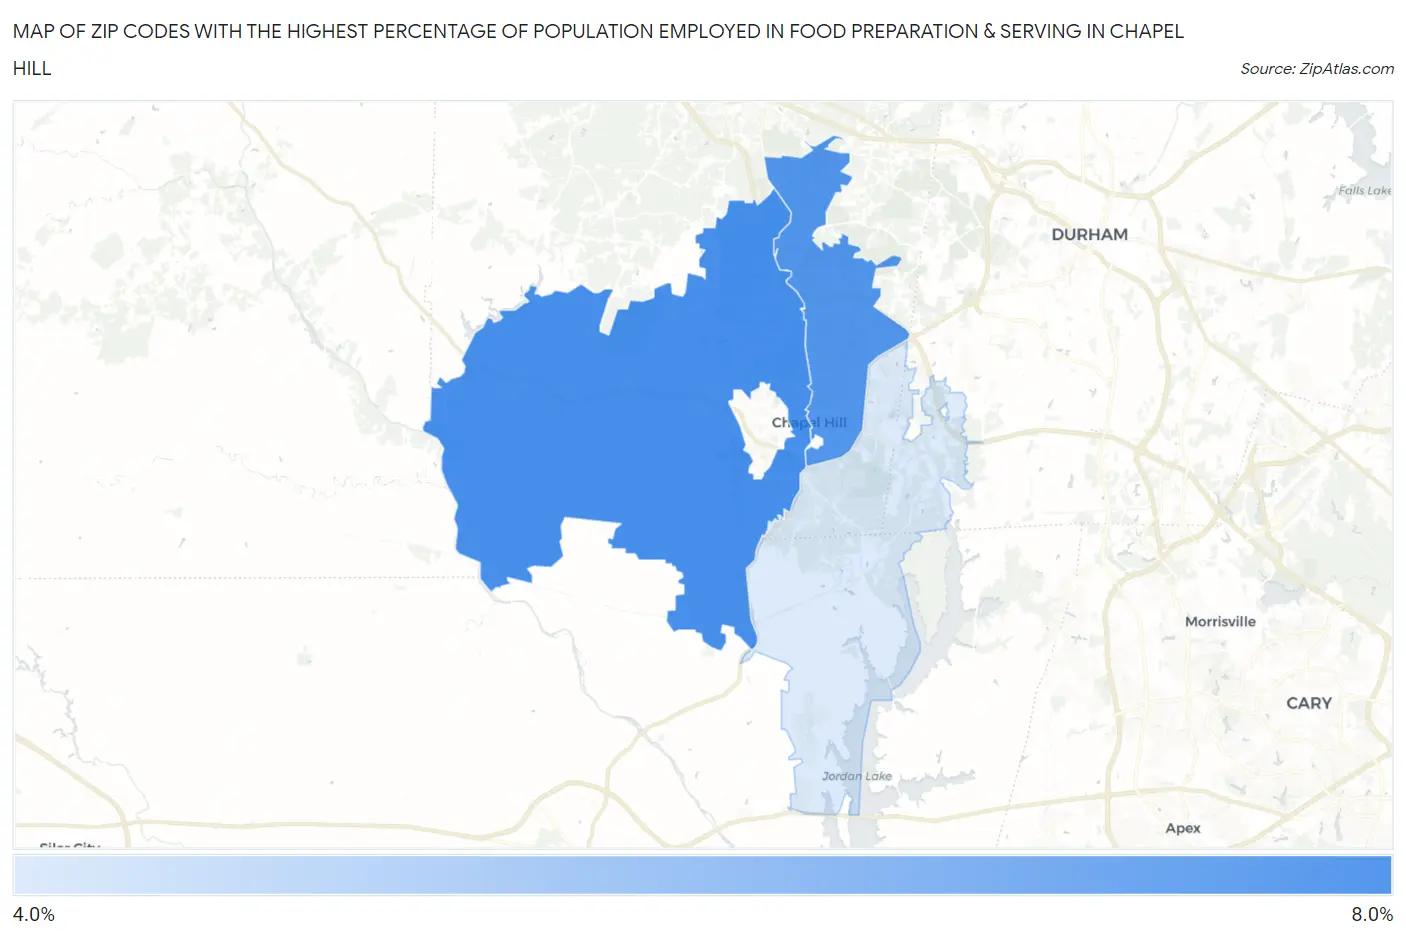
Map of Zip Codes with the Highest Percentage of Population Employed in Food Preparation & Serving in Chapel Hill
4.1%
6.3%
Zip Codes with the Highest Percentage of Population Employed in Food Preparation & Serving in Chapel Hill, NC
| Zip Code | % Employed | vs State | vs National | |
| 1. | 27516 | 6.3% | 5.3%(+1.03)#222 | 5.3%(+1.04)#8,354 |
| 2. | 27514 | 6.2% | 5.3%(+0.875)#235 | 5.3%(+0.880)#8,832 |
| 3. | 27517 | 4.1% | 5.3%(-1.24)#468 | 5.3%(-1.23)#16,912 |
1
Common Questions
What are the Top Zip Codes with the Highest Percentage of Population Employed in Food Preparation & Serving in Chapel Hill, NC?
Top Zip Codes with the Highest Percentage of Population Employed in Food Preparation & Serving in Chapel Hill, NC are:
What zip code has the Highest Percentage of Population Employed in Food Preparation & Serving in Chapel Hill, NC?
27516 has the Highest Percentage of Population Employed in Food Preparation & Serving in Chapel Hill, NC with 6.3%.
What is the Percentage of Population Employed in Food Preparation & Serving in Chapel Hill, NC?
Percentage of Population Employed in Food Preparation & Serving in Chapel Hill is 6.5%.
What is the Percentage of Population Employed in Food Preparation & Serving in North Carolina?
Percentage of Population Employed in Food Preparation & Serving in North Carolina is 5.3%.
What is the Percentage of Population Employed in Food Preparation & Serving in the United States?
Percentage of Population Employed in Food Preparation & Serving in the United States is 5.3%.