Cities with the Highest Percentage of Lumbee Population in North Carolina
RELATED REPORTS & OPTIONS
Lumbee
North Carolina
Compare Cities
Map of Cities with the Highest Percentage of Lumbee Population in North Carolina
0.00%
100.00%
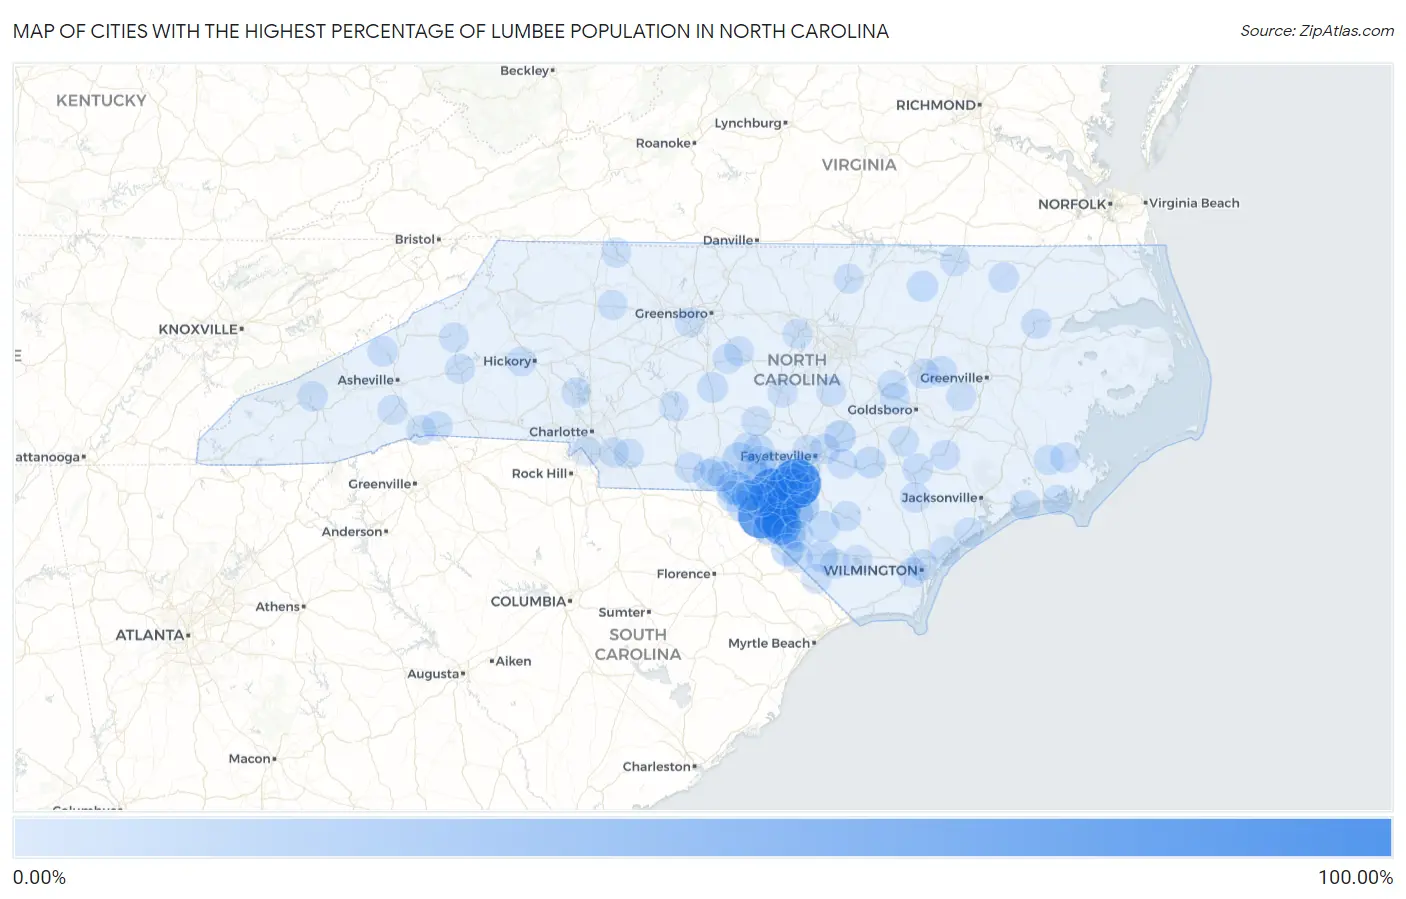
Cities with the Highest Percentage of Lumbee Population in North Carolina
| City | Lumbee | vs State | vs National | |
| 1. | Rex | 100.00% | 0.60% (+99.4)#1 | 0.024% (+100.0)#1 |
| 2. | Raemon | 84.92% | 0.60% (+84.3)#2 | 0.024% (+84.9)#2 |
| 3. | Prospect | 81.54% | 0.60% (+80.9)#3 | 0.024% (+81.5)#3 |
| 4. | Wakulla | 79.59% | 0.60% (+79.0)#4 | 0.024% (+79.6)#4 |
| 5. | Elrod | 62.12% | 0.60% (+61.5)#5 | 0.024% (+62.1)#5 |
| 6. | Pembroke | 55.51% | 0.60% (+54.9)#6 | 0.024% (+55.5)#6 |
| 7. | Rennert | 54.00% | 0.60% (+53.4)#7 | 0.024% (+54.0)#7 |
| 8. | Mcdonald | 48.45% | 0.60% (+47.8)#8 | 0.024% (+48.4)#8 |
| 9. | Raynham | 37.84% | 0.60% (+37.2)#9 | 0.024% (+37.8)#9 |
| 10. | Shannon | 22.45% | 0.60% (+21.8)#10 | 0.024% (+22.4)#10 |
| 11. | Old Hundred | 20.57% | 0.60% (+20.0)#11 | 0.024% (+20.5)#11 |
| 12. | Red Springs | 18.38% | 0.60% (+17.8)#12 | 0.024% (+18.4)#12 |
| 13. | Barker Ten Mile | 16.12% | 0.60% (+15.5)#13 | 0.024% (+16.1)#13 |
| 14. | Fairmont | 15.52% | 0.60% (+14.9)#14 | 0.024% (+15.5)#14 |
| 15. | Laurel Hill | 14.61% | 0.60% (+14.0)#15 | 0.024% (+14.6)#15 |
| 16. | Rowland | 12.96% | 0.60% (+12.4)#16 | 0.024% (+12.9)#16 |
| 17. | Maxton | 12.87% | 0.60% (+12.3)#17 | 0.024% (+12.8)#17 |
| 18. | Marietta | 12.73% | 0.60% (+12.1)#18 | 0.024% (+12.7)#18 |
| 19. | Hoffman | 12.67% | 0.60% (+12.1)#19 | 0.024% (+12.6)#19 |
| 20. | Lumberton | 11.96% | 0.60% (+11.4)#20 | 0.024% (+11.9)#20 |
| 21. | Wagram | 10.57% | 0.60% (+9.97)#21 | 0.024% (+10.5)#22 |
| 22. | Falcon | 9.68% | 0.60% (+9.07)#22 | 0.024% (+9.65)#24 |
| 23. | Cordova | 8.86% | 0.60% (+8.26)#23 | 0.024% (+8.84)#25 |
| 24. | Chadbourn | 8.27% | 0.60% (+7.66)#24 | 0.024% (+8.24)#26 |
| 25. | Scotch Meadows | 7.91% | 0.60% (+7.30)#25 | 0.024% (+7.88)#27 |
| 26. | Laurinburg | 7.27% | 0.60% (+6.67)#26 | 0.024% (+7.25)#30 |
| 27. | Bonnetsville | 7.25% | 0.60% (+6.64)#27 | 0.024% (+7.22)#31 |
| 28. | Proctorville | 7.14% | 0.60% (+6.54)#28 | 0.024% (+7.12)#32 |
| 29. | Bladenboro | 7.00% | 0.60% (+6.40)#29 | 0.024% (+6.98)#33 |
| 30. | Gibson | 6.69% | 0.60% (+6.09)#30 | 0.024% (+6.67)#34 |
| 31. | East Laurinburg | 5.90% | 0.60% (+5.30)#31 | 0.024% (+5.88)#35 |
| 32. | Lumber Bridge | 5.80% | 0.60% (+5.19)#32 | 0.024% (+5.77)#36 |
| 33. | Ashley Heights | 5.48% | 0.60% (+4.87)#33 | 0.024% (+5.46)#37 |
| 34. | Hollister | 5.19% | 0.60% (+4.59)#34 | 0.024% (+5.17)#38 |
| 35. | Raeford | 4.62% | 0.60% (+4.01)#35 | 0.024% (+4.59)#41 |
| 36. | St Pauls | 4.56% | 0.60% (+3.95)#36 | 0.024% (+4.53)#42 |
| 37. | Hightsville | 4.40% | 0.60% (+3.80)#37 | 0.024% (+4.38)#43 |
| 38. | Kenansville | 4.31% | 0.60% (+3.70)#38 | 0.024% (+4.28)#44 |
| 39. | Fair Bluff | 4.12% | 0.60% (+3.51)#39 | 0.024% (+4.09)#45 |
| 40. | Saratoga | 4.06% | 0.60% (+3.45)#40 | 0.024% (+4.03)#46 |
| 41. | Five Points | 3.35% | 0.60% (+2.74)#41 | 0.024% (+3.32)#49 |
| 42. | Seagrove | 3.21% | 0.60% (+2.60)#42 | 0.024% (+3.19)#50 |
| 43. | Eastover | 2.79% | 0.60% (+2.18)#43 | 0.024% (+2.76)#51 |
| 44. | Parkton | 2.66% | 0.60% (+2.06)#44 | 0.024% (+2.64)#52 |
| 45. | Deercroft | 2.46% | 0.60% (+1.85)#45 | 0.024% (+2.43)#53 |
| 46. | Black Creek | 2.37% | 0.60% (+1.77)#46 | 0.024% (+2.35)#55 |
| 47. | Lilesville | 2.31% | 0.60% (+1.71)#47 | 0.024% (+2.29)#57 |
| 48. | Pink Hill | 2.27% | 0.60% (+1.67)#48 | 0.024% (+2.25)#58 |
| 49. | Cherokee | 2.24% | 0.60% (+1.64)#49 | 0.024% (+2.22)#59 |
| 50. | Rockfish | 1.88% | 0.60% (+1.27)#50 | 0.024% (+1.85)#62 |
| 51. | Wallace | 1.86% | 0.60% (+1.25)#51 | 0.024% (+1.83)#64 |
| 52. | Marshall | 1.79% | 0.60% (+1.18)#52 | 0.024% (+1.76)#65 |
| 53. | New Hope | 1.73% | 0.60% (+1.13)#53 | 0.024% (+1.71)#66 |
| 54. | Windsor | 1.72% | 0.60% (+1.11)#54 | 0.024% (+1.69)#67 |
| 55. | Brunswick | 1.70% | 0.60% (+1.10)#55 | 0.024% (+1.68)#68 |
| 56. | Arapahoe | 1.65% | 0.60% (+1.04)#56 | 0.024% (+1.62)#69 |
| 57. | Autryville | 1.49% | 0.60% (+0.888)#57 | 0.024% (+1.47)#74 |
| 58. | Oriental | 1.45% | 0.60% (+0.841)#58 | 0.024% (+1.42)#75 |
| 59. | Belville | 1.30% | 0.60% (+0.697)#59 | 0.024% (+1.28)#80 |
| 60. | Woodland | 1.27% | 0.60% (+0.665)#60 | 0.024% (+1.25)#81 |
| 61. | Columbus | 1.20% | 0.60% (+0.591)#61 | 0.024% (+1.17)#83 |
| 62. | Tabor City | 1.19% | 0.60% (+0.581)#62 | 0.024% (+1.16)#84 |
| 63. | Elizabethtown | 1.18% | 0.60% (+0.575)#63 | 0.024% (+1.16)#85 |
| 64. | Calypso | 1.17% | 0.60% (+0.561)#64 | 0.024% (+1.14)#86 |
| 65. | Dobbins Heights | 1.09% | 0.60% (+0.480)#65 | 0.024% (+1.06)#88 |
| 66. | Hope Mills | 1.06% | 0.60% (+0.453)#66 | 0.024% (+1.03)#89 |
| 67. | Micro | 1.05% | 0.60% (+0.443)#67 | 0.024% (+1.02)#90 |
| 68. | Governors | 0.99% | 0.60% (+0.388)#68 | 0.024% (+0.969)#95 |
| 69. | Maury | 0.95% | 0.60% (+0.343)#69 | 0.024% (+0.924)#96 |
| 70. | Unionville | 0.94% | 0.60% (+0.336)#70 | 0.024% (+0.917)#97 |
| 71. | Morehead City | 0.93% | 0.60% (+0.329)#71 | 0.024% (+0.910)#98 |
| 72. | Roanoke Rapids | 0.90% | 0.60% (+0.293)#72 | 0.024% (+0.874)#99 |
| 73. | Angier | 0.86% | 0.60% (+0.255)#73 | 0.024% (+0.836)#101 |
| 74. | Indian Trail | 0.75% | 0.60% (+0.149)#74 | 0.024% (+0.730)#103 |
| 75. | Fayetteville | 0.71% | 0.60% (+0.100)#75 | 0.024% (+0.681)#104 |
| 76. | Ramseur | 0.69% | 0.60% (+0.088)#76 | 0.024% (+0.669)#105 |
| 77. | Anderson Creek | 0.62% | 0.60% (+0.018)#77 | 0.024% (+0.599)#109 |
| 78. | Lake Waccamaw | 0.62% | 0.60% (+0.011)#78 | 0.024% (+0.592)#111 |
| 79. | Pineville | 0.61% | 0.60% (+0.003)#79 | 0.024% (+0.584)#112 |
| 80. | Staley | 0.59% | 0.60% (-0.011)#80 | 0.024% (+0.570)#115 |
| 81. | Holly Ridge | 0.59% | 0.60% (-0.015)#81 | 0.024% (+0.566)#116 |
| 82. | Sanford | 0.57% | 0.60% (-0.032)#82 | 0.024% (+0.549)#119 |
| 83. | Mills River | 0.51% | 0.60% (-0.098)#83 | 0.024% (+0.483)#122 |
| 84. | Yadkinville | 0.50% | 0.60% (-0.100)#84 | 0.024% (+0.481)#123 |
| 85. | Toast | 0.50% | 0.60% (-0.109)#85 | 0.024% (+0.472)#124 |
| 86. | Saluda | 0.49% | 0.60% (-0.119)#86 | 0.024% (+0.462)#125 |
| 87. | Marion | 0.47% | 0.60% (-0.134)#87 | 0.024% (+0.446)#128 |
| 88. | Chapel Hill | 0.44% | 0.60% (-0.169)#88 | 0.024% (+0.412)#134 |
| 89. | Hampstead | 0.43% | 0.60% (-0.173)#89 | 0.024% (+0.408)#135 |
| 90. | High Point | 0.40% | 0.60% (-0.201)#90 | 0.024% (+0.380)#139 |
| 91. | Oxford | 0.40% | 0.60% (-0.202)#91 | 0.024% (+0.379)#140 |
| 92. | Westport | 0.39% | 0.60% (-0.211)#92 | 0.024% (+0.370)#144 |
| 93. | Bogue | 0.37% | 0.60% (-0.237)#93 | 0.024% (+0.344)#150 |
| 94. | Icard | 0.35% | 0.60% (-0.252)#94 | 0.024% (+0.329)#153 |
| 95. | Rockingham | 0.35% | 0.60% (-0.256)#95 | 0.024% (+0.325)#155 |
| 96. | Spruce Pine | 0.34% | 0.60% (-0.264)#96 | 0.024% (+0.317)#158 |
| 97. | Princeton | 0.34% | 0.60% (-0.265)#97 | 0.024% (+0.316)#161 |
| 98. | Pinebluff | 0.34% | 0.60% (-0.265)#98 | 0.024% (+0.316)#162 |
| 99. | Badin | 0.34% | 0.60% (-0.268)#99 | 0.024% (+0.313)#164 |
| 100. | Carthage | 0.32% | 0.60% (-0.281)#100 | 0.024% (+0.300)#166 |
Common Questions
What are the Top 10 Cities with the Highest Percentage of Lumbee Population in North Carolina?
Top 10 Cities with the Highest Percentage of Lumbee Population in North Carolina are:
What city has the Highest Percentage of Lumbee Population in North Carolina?
Rex has the Highest Percentage of Lumbee Population in North Carolina with 100.00%.
What is the Percentage of Lumbee Population in the State of North Carolina?
Percentage of Lumbee Population in North Carolina is 0.60%.
What is the Percentage of Lumbee Population in the United States?
Percentage of Lumbee Population in the United States is 0.024%.