Oriental, NC Map & Demographics
Oriental Map
Oriental Overview
$45,274
PER CAPITA INCOME
$101,161
AVG FAMILY INCOME
$51,563
AVG HOUSEHOLD INCOME
26.6%
WAGE / INCOME GAP [ % ]
73.4¢/ $1
WAGE / INCOME GAP [ $ ]
0.46
INEQUALITY / GINI INDEX
968
TOTAL POPULATION
431
MALE POPULATION
537
FEMALE POPULATION
80.26
MALES / 100 FEMALES
124.59
FEMALES / 100 MALES
68.7
MEDIAN AGE
2.1
AVG FAMILY SIZE
1.7
AVG HOUSEHOLD SIZE
240
LABOR FORCE [ PEOPLE ]
25.9%
PERCENT IN LABOR FORCE
1.3%
UNEMPLOYMENT RATE
Oriental Zip Codes
Oriental Area Codes
Income in Oriental
Income Overview in Oriental
Per Capita Income in Oriental is $45,274, while median incomes of families and households are $101,161 and $51,563 respectively.
| Characteristic | Number | Measure |
| Per Capita Income | 968 | $45,274 |
| Median Family Income | 325 | $101,161 |
| Mean Family Income | 325 | $104,088 |
| Median Household Income | 571 | $51,563 |
| Mean Household Income | 571 | $75,725 |
| Income Deficit | 325 | $0 |
| Wage / Income Gap (%) | 968 | 26.64% |
| Wage / Income Gap ($) | 968 | 73.36¢ per $1 |
| Gini / Inequality Index | 968 | 0.46 |
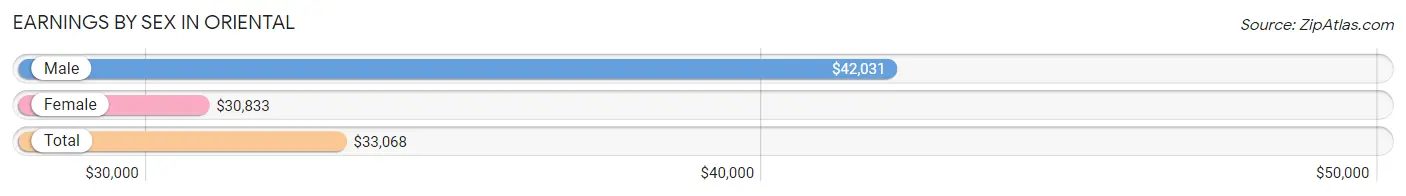
Earnings by Sex in Oriental
Average Earnings in Oriental are $33,068, $42,031 for men and $30,833 for women, a difference of 26.6%.
| Sex | Number | Average Earnings |
| Male | 103 (39.8%) | $42,031 |
| Female | 156 (60.2%) | $30,833 |
| Total | 259 (100.0%) | $33,068 |
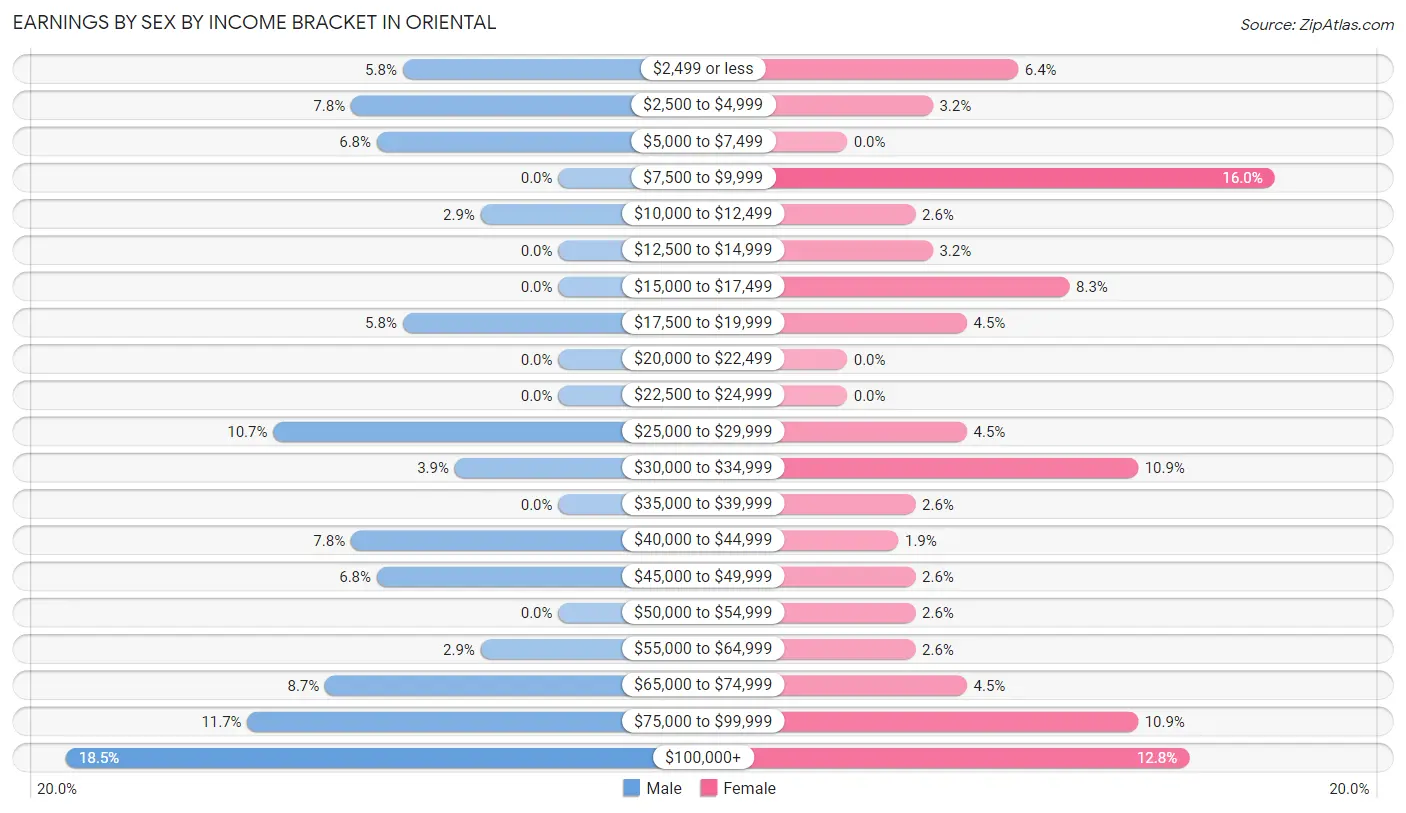
Earnings by Sex by Income Bracket in Oriental
The most common earnings brackets in Oriental are $100,000+ for men (19 | 18.4%) and $7,500 to $9,999 for women (25 | 16.0%).
| Income | Male | Female |
| $2,499 or less | 6 (5.8%) | 10 (6.4%) |
| $2,500 to $4,999 | 8 (7.8%) | 5 (3.2%) |
| $5,000 to $7,499 | 7 (6.8%) | 0 (0.0%) |
| $7,500 to $9,999 | 0 (0.0%) | 25 (16.0%) |
| $10,000 to $12,499 | 3 (2.9%) | 4 (2.6%) |
| $12,500 to $14,999 | 0 (0.0%) | 5 (3.2%) |
| $15,000 to $17,499 | 0 (0.0%) | 13 (8.3%) |
| $17,500 to $19,999 | 6 (5.8%) | 7 (4.5%) |
| $20,000 to $22,499 | 0 (0.0%) | 0 (0.0%) |
| $22,500 to $24,999 | 0 (0.0%) | 0 (0.0%) |
| $25,000 to $29,999 | 11 (10.7%) | 7 (4.5%) |
| $30,000 to $34,999 | 4 (3.9%) | 17 (10.9%) |
| $35,000 to $39,999 | 0 (0.0%) | 4 (2.6%) |
| $40,000 to $44,999 | 8 (7.8%) | 3 (1.9%) |
| $45,000 to $49,999 | 7 (6.8%) | 4 (2.6%) |
| $50,000 to $54,999 | 0 (0.0%) | 4 (2.6%) |
| $55,000 to $64,999 | 3 (2.9%) | 4 (2.6%) |
| $65,000 to $74,999 | 9 (8.7%) | 7 (4.5%) |
| $75,000 to $99,999 | 12 (11.7%) | 17 (10.9%) |
| $100,000+ | 19 (18.4%) | 20 (12.8%) |
| Total | 103 (100.0%) | 156 (100.0%) |
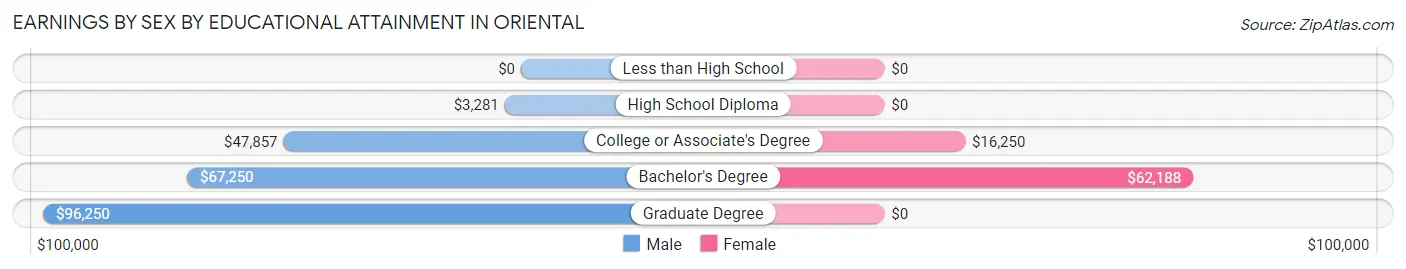
Earnings by Sex by Educational Attainment in Oriental
Average earnings in Oriental are $47,679 for men and $32,083 for women, a difference of 32.7%. Men with an educational attainment of graduate degree enjoy the highest average annual earnings of $96,250, while those with high school diploma education earn the least with $3,281. Women with an educational attainment of bachelor's degree earn the most with the average annual earnings of $62,188, while those with college or associate's degree education have the smallest earnings of $16,250.
| Educational Attainment | Male Income | Female Income |
| Less than High School | - | - |
| High School Diploma | $3,281 | $0 |
| College or Associate's Degree | $47,857 | $16,250 |
| Bachelor's Degree | $67,250 | $62,188 |
| Graduate Degree | $96,250 | $0 |
| Total | $47,679 | $32,083 |
Family Income in Oriental
Family Income Brackets in Oriental
According to the Oriental family income data, there are 137 families falling into the $100,000 to $149,999 income range, which is the most common income bracket and makes up 42.1% of all families. Conversely, the less than $10,000 income bracket is the least frequent group with only 2 families (0.6%) belonging to this category.
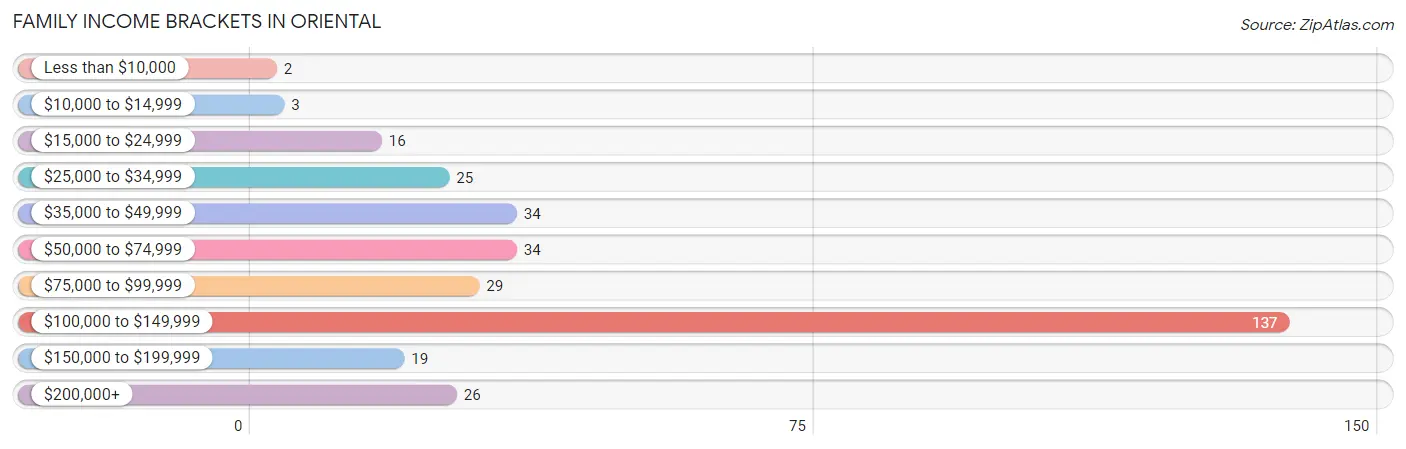
| Income Bracket | # Families | % Families |
| Less than $10,000 | 2 | 0.6% |
| $10,000 to $14,999 | 3 | 0.9% |
| $15,000 to $24,999 | 16 | 4.9% |
| $25,000 to $34,999 | 25 | 7.7% |
| $35,000 to $49,999 | 34 | 10.5% |
| $50,000 to $74,999 | 34 | 10.5% |
| $75,000 to $99,999 | 29 | 8.9% |
| $100,000 to $149,999 | 137 | 42.2% |
| $150,000 to $199,999 | 19 | 5.8% |
| $200,000+ | 26 | 8.0% |
Family Income by Famaliy Size in Oriental
4-person families (12 | 3.7%) account for the highest median family income in Oriental with $123,750 per family, while 2-person families (280 | 86.2%) have the highest median income of $50,416 per family member.
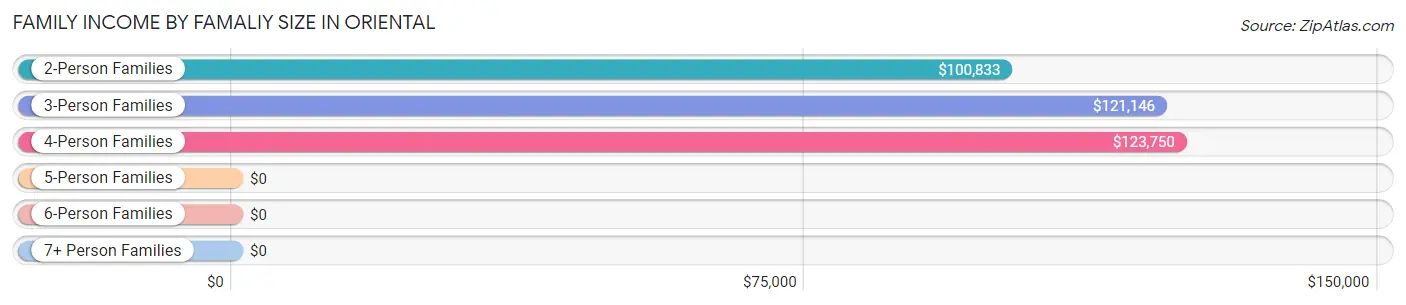
| Income Bracket | # Families | Median Income |
| 2-Person Families | 280 (86.2%) | $100,833 |
| 3-Person Families | 33 (10.2%) | $121,146 |
| 4-Person Families | 12 (3.7%) | $123,750 |
| 5-Person Families | 0 (0.0%) | $0 |
| 6-Person Families | 0 (0.0%) | $0 |
| 7+ Person Families | 0 (0.0%) | $0 |
| Total | 325 (100.0%) | $101,161 |
Family Income by Number of Earners in Oriental
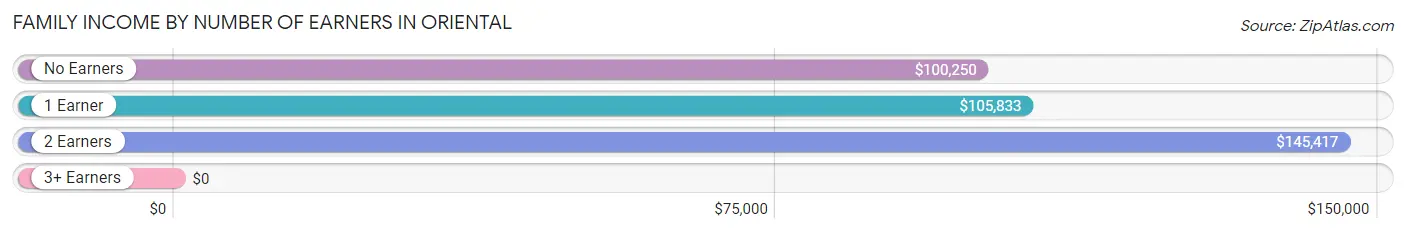
| Number of Earners | # Families | Median Income |
| No Earners | 207 (63.7%) | $100,250 |
| 1 Earner | 72 (22.2%) | $105,833 |
| 2 Earners | 43 (13.2%) | $145,417 |
| 3+ Earners | 3 (0.9%) | $0 |
| Total | 325 (100.0%) | $101,161 |
Household Income in Oriental
Household Income Brackets in Oriental
With 150 households falling in the category, the $100,000 to $149,999 income range is the most frequent in Oriental, accounting for 26.3% of all households. In contrast, only 6 households (1.1%) fall into the $10,000 to $14,999 income bracket, making it the least populous group.
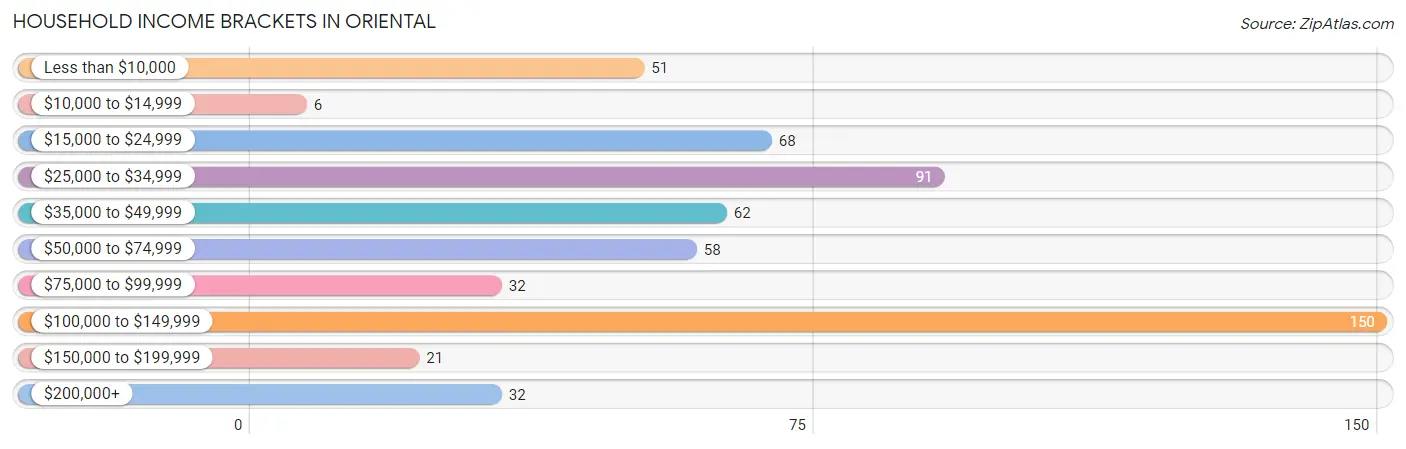
| Income Bracket | # Households | % Households |
| Less than $10,000 | 51 | 8.9% |
| $10,000 to $14,999 | 6 | 1.1% |
| $15,000 to $24,999 | 68 | 11.9% |
| $25,000 to $34,999 | 91 | 15.9% |
| $35,000 to $49,999 | 62 | 10.9% |
| $50,000 to $74,999 | 58 | 10.2% |
| $75,000 to $99,999 | 32 | 5.6% |
| $100,000 to $149,999 | 150 | 26.3% |
| $150,000 to $199,999 | 21 | 3.7% |
| $200,000+ | 32 | 5.6% |
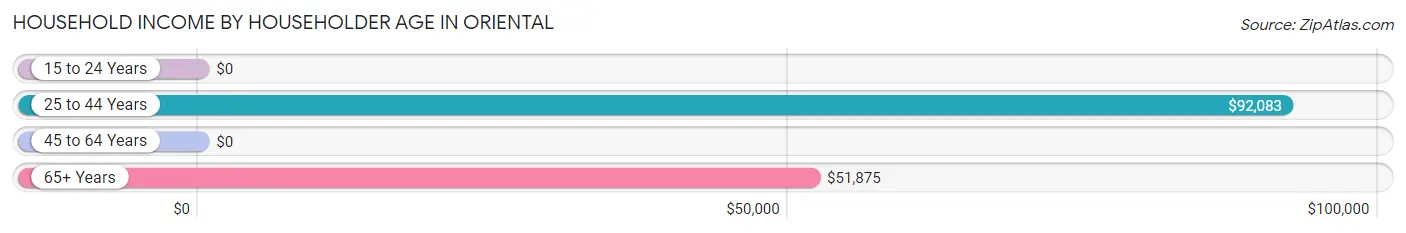
Household Income by Householder Age in Oriental
The median household income in Oriental is $51,563, with the highest median household income of $92,083 found in the 25 to 44 years age bracket for the primary householder. A total of 17 households (3.0%) fall into this category. Meanwhile, the 15 to 24 years age bracket for the primary householder has the lowest median household income of $0, with 4 households (0.7%) in this group.
| Income Bracket | # Households | Median Income |
| 15 to 24 Years | 4 (0.7%) | $0 |
| 25 to 44 Years | 17 (3.0%) | $92,083 |
| 45 to 64 Years | 166 (29.1%) | $0 |
| 65+ Years | 384 (67.2%) | $51,875 |
| Total | 571 (100.0%) | $51,563 |
Poverty in Oriental
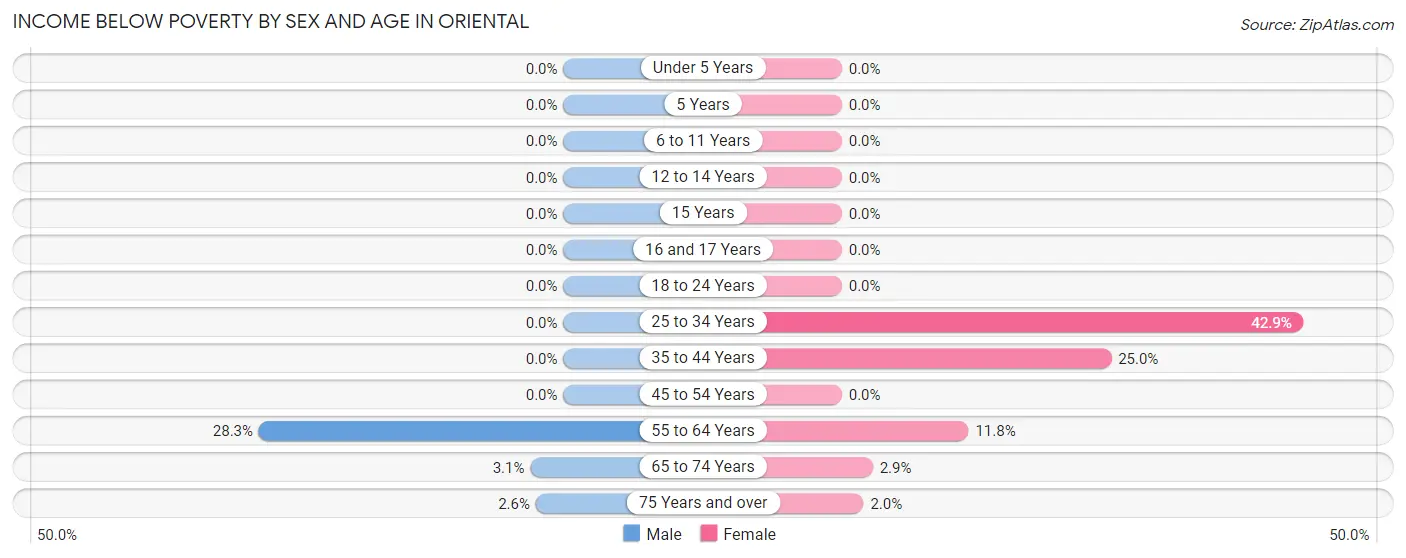
Income Below Poverty by Sex and Age in Oriental
With 7.9% poverty level for males and 5.3% for females among the residents of Oriental, 55 to 64 year old males and 25 to 34 year old females are the most vulnerable to poverty, with 26 males (28.3%) and 3 females (42.9%) in their respective age groups living below the poverty level.
| Age Bracket | Male | Female |
| Under 5 Years | 0 (0.0%) | 0 (0.0%) |
| 5 Years | 0 (0.0%) | 0 (0.0%) |
| 6 to 11 Years | 0 (0.0%) | 0 (0.0%) |
| 12 to 14 Years | 0 (0.0%) | 0 (0.0%) |
| 15 Years | 0 (0.0%) | 0 (0.0%) |
| 16 and 17 Years | 0 (0.0%) | 0 (0.0%) |
| 18 to 24 Years | 0 (0.0%) | 0 (0.0%) |
| 25 to 34 Years | 0 (0.0%) | 3 (42.9%) |
| 35 to 44 Years | 0 (0.0%) | 3 (25.0%) |
| 45 to 54 Years | 0 (0.0%) | 0 (0.0%) |
| 55 to 64 Years | 26 (28.3%) | 14 (11.8%) |
| 65 to 74 Years | 5 (3.1%) | 5 (2.9%) |
| 75 Years and over | 3 (2.6%) | 3 (2.0%) |
| Total | 34 (7.9%) | 28 (5.3%) |
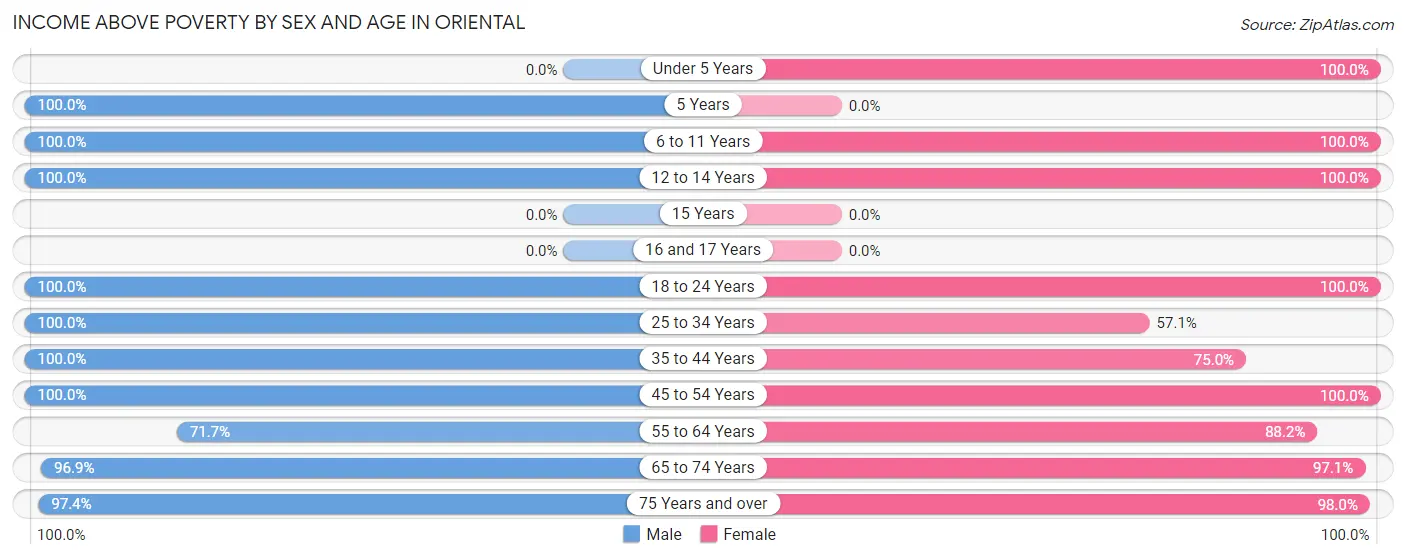
Income Above Poverty by Sex and Age in Oriental
According to the poverty statistics in Oriental, males aged 5 years and females aged under 5 years are the age groups that are most secure financially, with 100.0% of males and 100.0% of females in these age groups living above the poverty line.
| Age Bracket | Male | Female |
| Under 5 Years | 0 (0.0%) | 5 (100.0%) |
| 5 Years | 1 (100.0%) | 0 (0.0%) |
| 6 to 11 Years | 6 (100.0%) | 5 (100.0%) |
| 12 to 14 Years | 3 (100.0%) | 14 (100.0%) |
| 15 Years | 0 (0.0%) | 0 (0.0%) |
| 16 and 17 Years | 0 (0.0%) | 0 (0.0%) |
| 18 to 24 Years | 8 (100.0%) | 6 (100.0%) |
| 25 to 34 Years | 13 (100.0%) | 4 (57.1%) |
| 35 to 44 Years | 11 (100.0%) | 9 (75.0%) |
| 45 to 54 Years | 15 (100.0%) | 41 (100.0%) |
| 55 to 64 Years | 66 (71.7%) | 105 (88.2%) |
| 65 to 74 Years | 158 (96.9%) | 169 (97.1%) |
| 75 Years and over | 114 (97.4%) | 146 (98.0%) |
| Total | 395 (92.1%) | 504 (94.7%) |
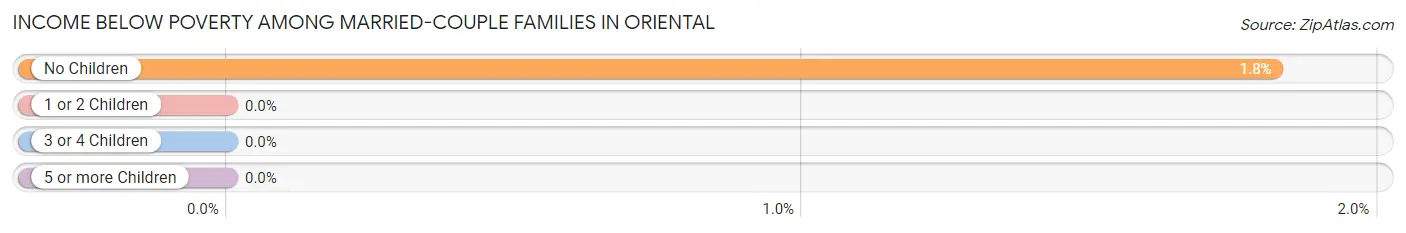
Income Below Poverty Among Married-Couple Families in Oriental
The poverty statistics for married-couple families in Oriental show that 1.7% or 5 of the total 287 families live below the poverty line. Families with no children have the highest poverty rate of 1.8%, comprising of 5 families. On the other hand, families with 1 or 2 children have the lowest poverty rate of 0.0%, which includes 0 families.
| Children | Above Poverty | Below Poverty |
| No Children | 269 (98.2%) | 5 (1.8%) |
| 1 or 2 Children | 13 (100.0%) | 0 (0.0%) |
| 3 or 4 Children | 0 (0.0%) | 0 (0.0%) |
| 5 or more Children | 0 (0.0%) | 0 (0.0%) |
| Total | 282 (98.3%) | 5 (1.7%) |
Income Below Poverty Among Single-Parent Households in Oriental
| Children | Single Father | Single Mother |
| No Children | 0 (0.0%) | 0 (0.0%) |
| 1 or 2 Children | 0 (0.0%) | 0 (0.0%) |
| 3 or 4 Children | 0 (0.0%) | 0 (0.0%) |
| 5 or more Children | 0 (0.0%) | 0 (0.0%) |
| Total | 0 (0.0%) | 0 (0.0%) |
Income Below Poverty Among Married-Couple vs Single-Parent Households in Oriental
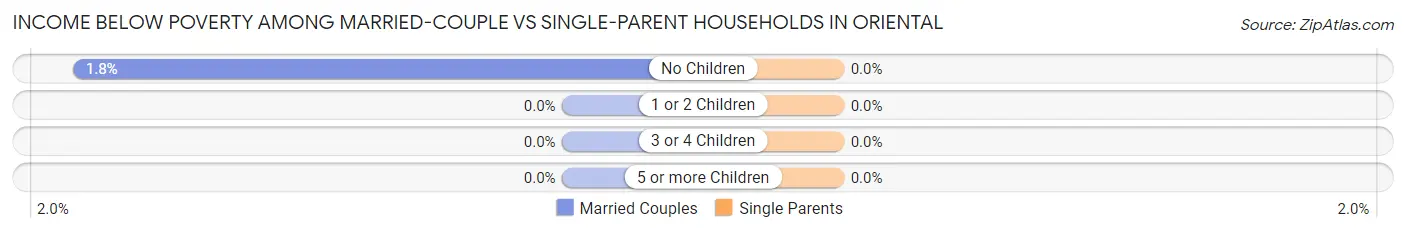
| Children | Married-Couple Families | Single-Parent Households |
| No Children | 5 (1.8%) | 0 (0.0%) |
| 1 or 2 Children | 0 (0.0%) | 0 (0.0%) |
| 3 or 4 Children | 0 (0.0%) | 0 (0.0%) |
| 5 or more Children | 0 (0.0%) | 0 (0.0%) |
| Total | 5 (1.7%) | 0 (0.0%) |
Race in Oriental
The most populous races in Oriental are White / Caucasian (900 | 93.0%), Two or more Races (52 | 5.4%), and Hispanic or Latino (33 | 3.4%).
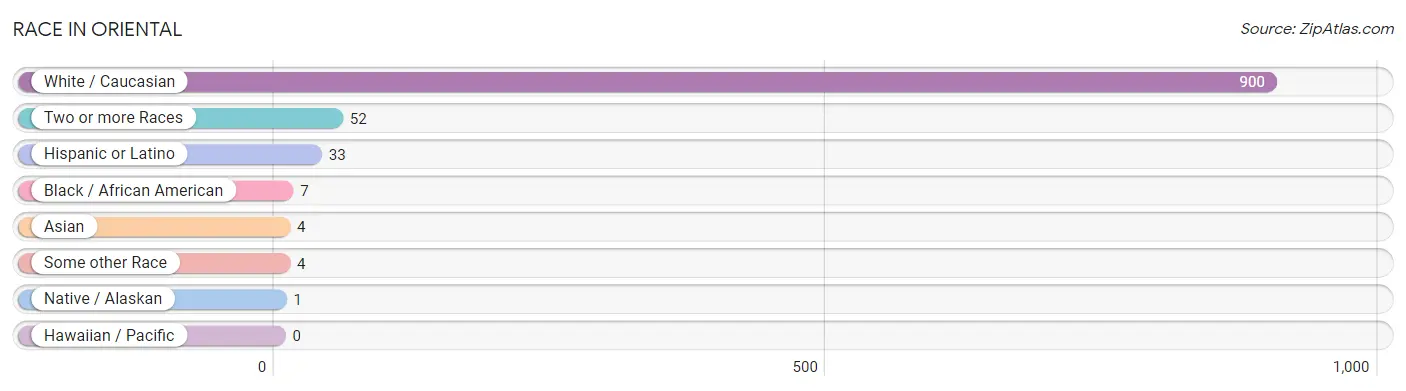
| Race | # Population | % Population |
| Asian | 4 | 0.4% |
| Black / African American | 7 | 0.7% |
| Hawaiian / Pacific | 0 | 0.0% |
| Hispanic or Latino | 33 | 3.4% |
| Native / Alaskan | 1 | 0.1% |
| White / Caucasian | 900 | 93.0% |
| Two or more Races | 52 | 5.4% |
| Some other Race | 4 | 0.4% |
| Total | 968 | 100.0% |
Ancestry in Oriental
The most populous ancestries reported in Oriental are English (261 | 27.0%), German (178 | 18.4%), Irish (138 | 14.3%), American (123 | 12.7%), and Polish (50 | 5.2%), together accounting for 77.5% of all Oriental residents.
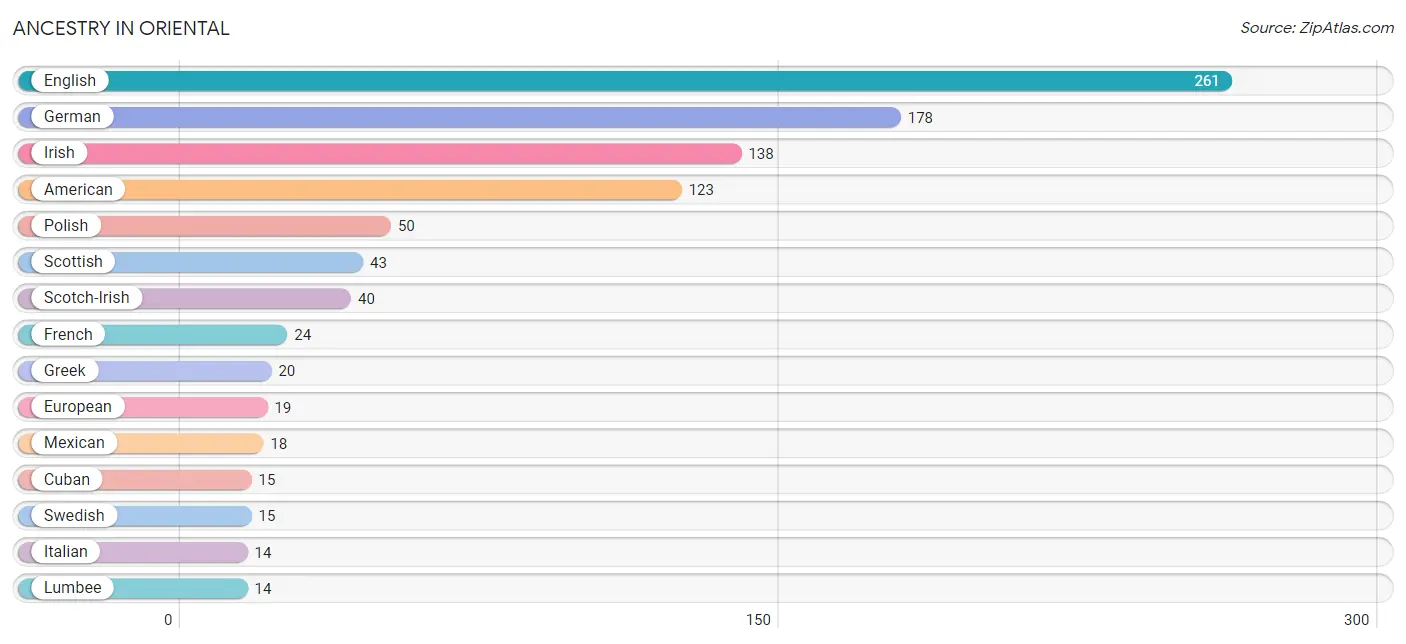
| Ancestry | # Population | % Population |
| American | 123 | 12.7% |
| Arab | 3 | 0.3% |
| Austrian | 3 | 0.3% |
| Belgian | 6 | 0.6% |
| Bhutanese | 4 | 0.4% |
| British | 9 | 0.9% |
| Cuban | 15 | 1.5% |
| Czech | 13 | 1.3% |
| Danish | 8 | 0.8% |
| Dutch | 10 | 1.0% |
| Eastern European | 7 | 0.7% |
| English | 261 | 27.0% |
| European | 19 | 2.0% |
| French | 24 | 2.5% |
| French Canadian | 11 | 1.1% |
| German | 178 | 18.4% |
| Greek | 20 | 2.1% |
| Irish | 138 | 14.3% |
| Italian | 14 | 1.5% |
| Lebanese | 3 | 0.3% |
| Lithuanian | 2 | 0.2% |
| Lumbee | 14 | 1.5% |
| Luxembourger | 4 | 0.4% |
| Mexican | 18 | 1.9% |
| Northern European | 3 | 0.3% |
| Norwegian | 7 | 0.7% |
| Polish | 50 | 5.2% |
| Russian | 3 | 0.3% |
| Scandinavian | 4 | 0.4% |
| Scotch-Irish | 40 | 4.1% |
| Scottish | 43 | 4.4% |
| Swedish | 15 | 1.5% |
| Swiss | 6 | 0.6% |
| Turkish | 2 | 0.2% |
| Ukrainian | 3 | 0.3% |
| Welsh | 3 | 0.3% | View All 36 Rows |
Immigrants in Oriental
The most numerous immigrant groups reported in Oriental came from Latin America (23 | 2.4%), Central America (18 | 1.9%), Mexico (18 | 1.9%), Europe (12 | 1.2%), and Northern Europe (12 | 1.2%), together accounting for 8.6% of all Oriental residents.
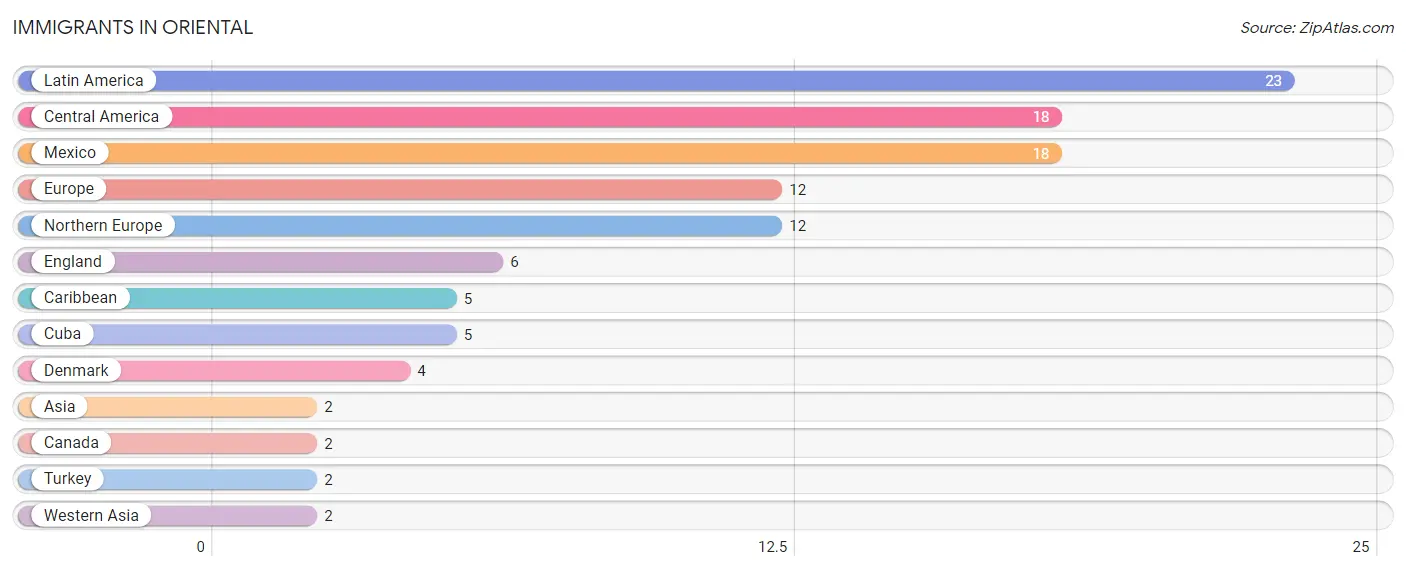
| Immigration Origin | # Population | % Population |
| Asia | 2 | 0.2% |
| Canada | 2 | 0.2% |
| Caribbean | 5 | 0.5% |
| Central America | 18 | 1.9% |
| Cuba | 5 | 0.5% |
| Denmark | 4 | 0.4% |
| England | 6 | 0.6% |
| Europe | 12 | 1.2% |
| Latin America | 23 | 2.4% |
| Mexico | 18 | 1.9% |
| Northern Europe | 12 | 1.2% |
| Turkey | 2 | 0.2% |
| Western Asia | 2 | 0.2% | View All 13 Rows |
Sex and Age in Oriental
Sex and Age in Oriental
The most populous age groups in Oriental are 70 to 74 Years (91 | 21.1%) for men and 65 to 69 Years (119 | 22.2%) for women.

| Age Bracket | Male | Female |
| Under 5 Years | 0 (0.0%) | 10 (1.9%) |
| 5 to 9 Years | 6 (1.4%) | 3 (0.6%) |
| 10 to 14 Years | 6 (1.4%) | 16 (3.0%) |
| 15 to 19 Years | 4 (0.9%) | 0 (0.0%) |
| 20 to 24 Years | 4 (0.9%) | 6 (1.1%) |
| 25 to 29 Years | 13 (3.0%) | 7 (1.3%) |
| 30 to 34 Years | 0 (0.0%) | 0 (0.0%) |
| 35 to 39 Years | 10 (2.3%) | 9 (1.7%) |
| 40 to 44 Years | 1 (0.2%) | 3 (0.6%) |
| 45 to 49 Years | 0 (0.0%) | 7 (1.3%) |
| 50 to 54 Years | 15 (3.5%) | 34 (6.3%) |
| 55 to 59 Years | 22 (5.1%) | 40 (7.4%) |
| 60 to 64 Years | 70 (16.2%) | 79 (14.7%) |
| 65 to 69 Years | 72 (16.7%) | 119 (22.2%) |
| 70 to 74 Years | 91 (21.1%) | 55 (10.2%) |
| 75 to 79 Years | 62 (14.4%) | 66 (12.3%) |
| 80 to 84 Years | 23 (5.3%) | 29 (5.4%) |
| 85 Years and over | 32 (7.4%) | 54 (10.1%) |
| Total | 431 (100.0%) | 537 (100.0%) |
Families and Households in Oriental
Median Family Size in Oriental
The median family size in Oriental is 2.15 persons per family, with single male/father families (4 | 1.2%) accounting for the largest median family size of 2.5 persons per family. On the other hand, married-couple families (287 | 88.3%) represent the smallest median family size with 2.14 persons per family.
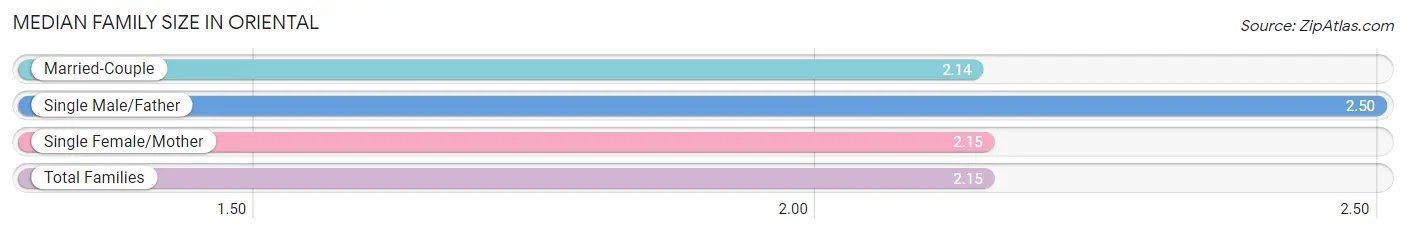
| Family Type | # Families | Family Size |
| Married-Couple | 287 (88.3%) | 2.14 |
| Single Male/Father | 4 (1.2%) | 2.50 |
| Single Female/Mother | 34 (10.5%) | 2.15 |
| Total Families | 325 (100.0%) | 2.15 |
Median Household Size in Oriental
The median household size in Oriental is 1.70 persons per household, with single male/father households (4 | 0.7%) accounting for the largest median household size of 2.5 persons per household. non-family households (246 | 43.1%) represent the smallest median household size with 1.04 persons per household.
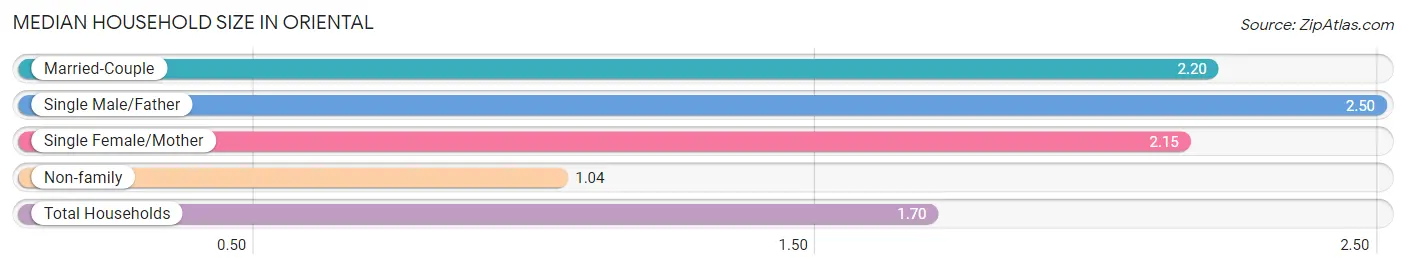
| Household Type | # Households | Household Size |
| Married-Couple | 287 (50.3%) | 2.20 |
| Single Male/Father | 4 (0.7%) | 2.50 |
| Single Female/Mother | 34 (5.9%) | 2.15 |
| Non-family | 246 (43.1%) | 1.04 |
| Total Households | 571 (100.0%) | 1.70 |
Household Size by Marriage Status in Oriental
Out of a total of 571 households in Oriental, 325 (56.9%) are family households, while 246 (43.1%) are nonfamily households. The most numerous type of family households are 2-person households, comprising 280, and the most common type of nonfamily households are 1-person households, comprising 236.
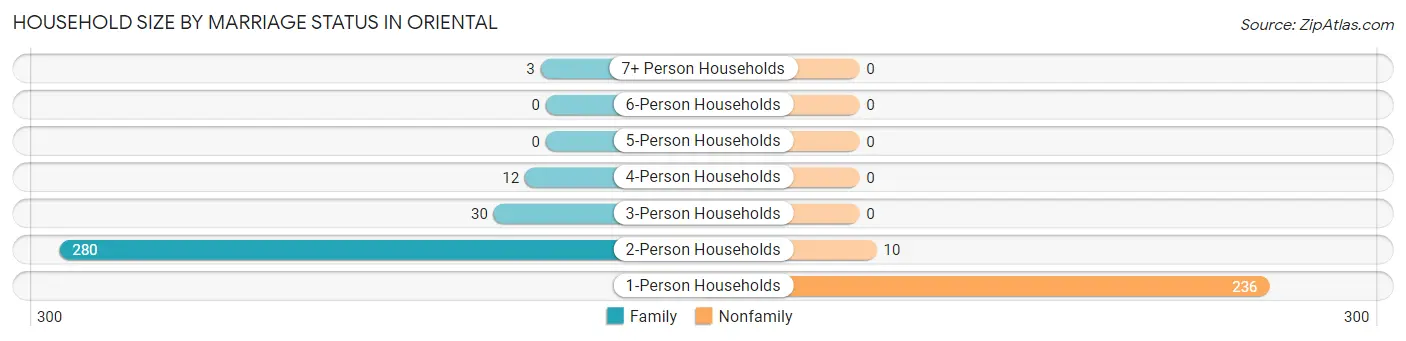
| Household Size | Family Households | Nonfamily Households |
| 1-Person Households | - | 236 (41.3%) |
| 2-Person Households | 280 (49.0%) | 10 (1.8%) |
| 3-Person Households | 30 (5.2%) | 0 (0.0%) |
| 4-Person Households | 12 (2.1%) | 0 (0.0%) |
| 5-Person Households | 0 (0.0%) | 0 (0.0%) |
| 6-Person Households | 0 (0.0%) | 0 (0.0%) |
| 7+ Person Households | 3 (0.5%) | 0 (0.0%) |
| Total | 325 (56.9%) | 246 (43.1%) |
Female Fertility in Oriental
Fertility by Age in Oriental
Average fertility rate in Oriental is 86.0 births per 1,000 women. Women in the age bracket of 20 to 34 years have the highest fertility rate with 231.0 births per 1,000 women. Women in the age bracket of 20 to 34 years acount for 100.0% of all women with births.
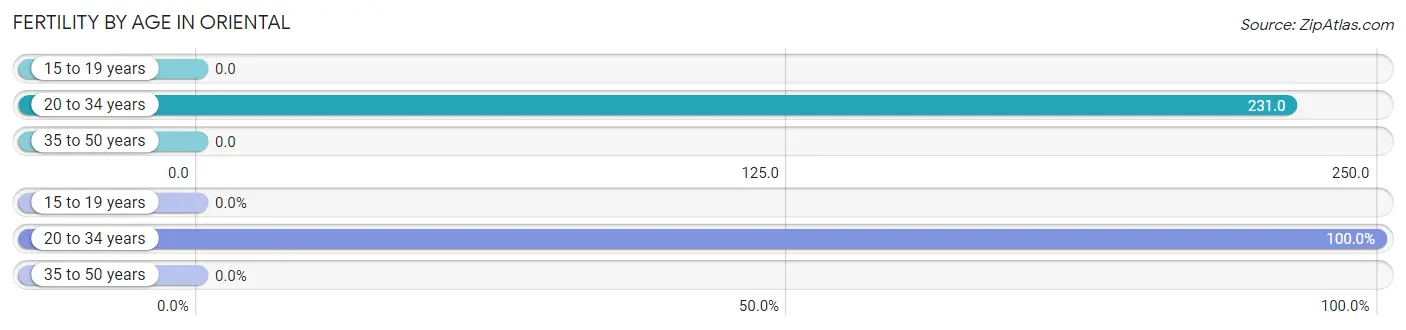
| Age Bracket | Women with Births | Births / 1,000 Women |
| 15 to 19 years | 0 (0.0%) | 0.0 |
| 20 to 34 years | 3 (100.0%) | 231.0 |
| 35 to 50 years | 0 (0.0%) | 0.0 |
| Total | 3 (100.0%) | 86.0 |
Fertility by Age by Marriage Status in Oriental
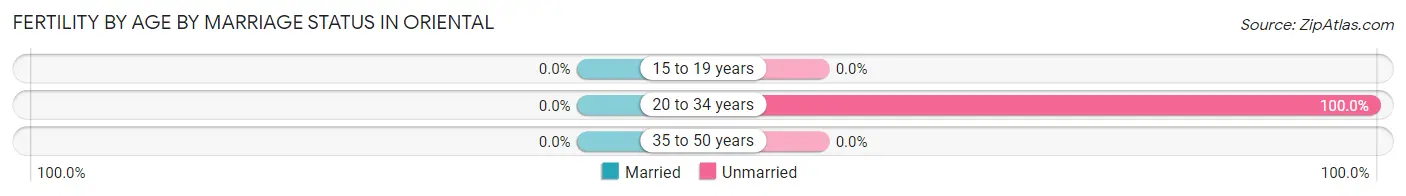
| Age Bracket | Married | Unmarried |
| 15 to 19 years | 0 (0.0%) | 0 (0.0%) |
| 20 to 34 years | 0 (0.0%) | 3 (100.0%) |
| 35 to 50 years | 0 (0.0%) | 0 (0.0%) |
| Total | 0 (0.0%) | 3 (100.0%) |
Fertility by Education in Oriental
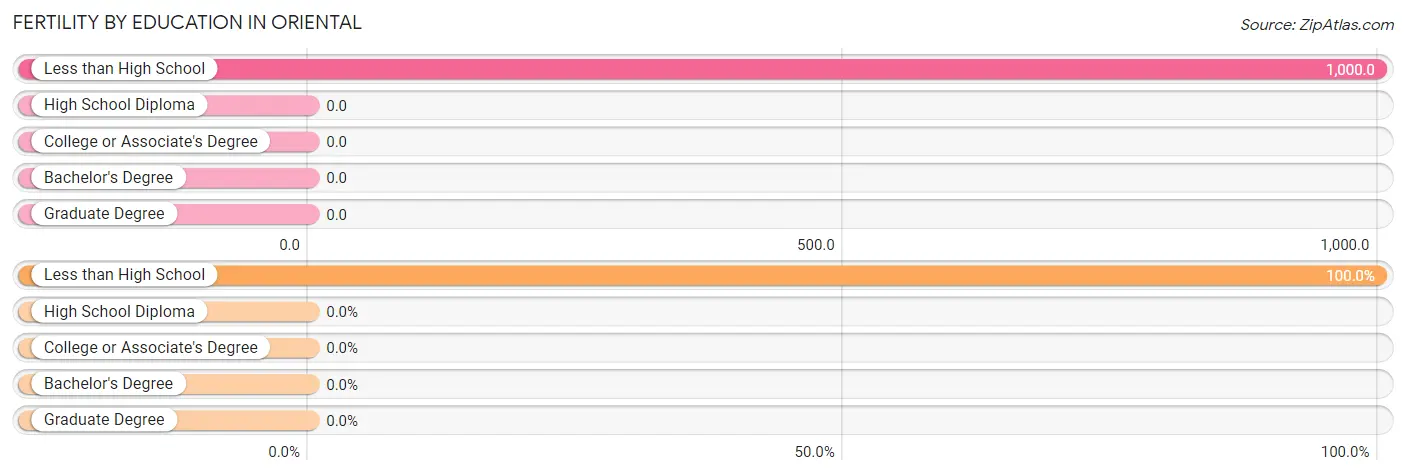
| Educational Attainment | Women with Births | Births / 1,000 Women |
| Less than High School | 3 (100.0%) | 1,000.0 |
| High School Diploma | 0 (0.0%) | 0.0 |
| College or Associate's Degree | 0 (0.0%) | 0.0 |
| Bachelor's Degree | 0 (0.0%) | 0.0 |
| Graduate Degree | 0 (0.0%) | 0.0 |
| Total | 3 (100.0%) | 86.0 |
Fertility by Education by Marriage Status in Oriental
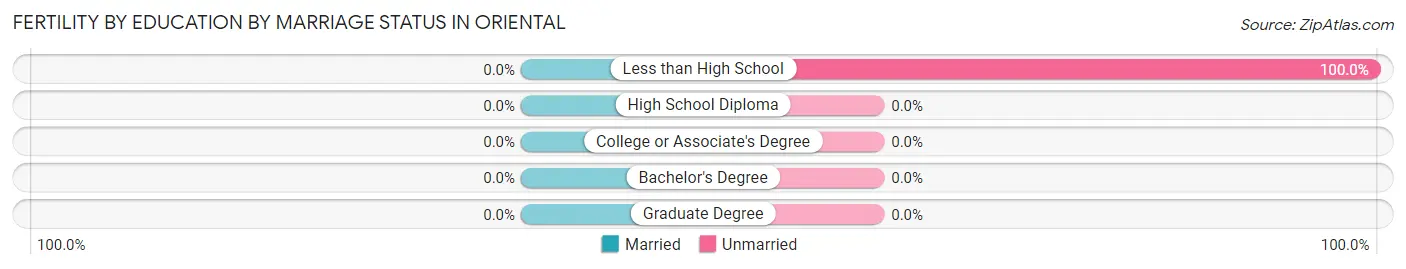
| Educational Attainment | Married | Unmarried |
| Less than High School | 0 (0.0%) | 3 (100.0%) |
| High School Diploma | 0 (0.0%) | 0 (0.0%) |
| College or Associate's Degree | 0 (0.0%) | 0 (0.0%) |
| Bachelor's Degree | 0 (0.0%) | 0 (0.0%) |
| Graduate Degree | 0 (0.0%) | 0 (0.0%) |
| Total | 0 (0.0%) | 3 (100.0%) |
Employment Characteristics in Oriental
Employment by Class of Employer in Oriental
Among the 231 employed individuals in Oriental, private company employees (117 | 50.6%), state government employees (32 | 13.9%), and self-employed (not incorporated) (23 | 10.0%) make up the most common classes of employment.
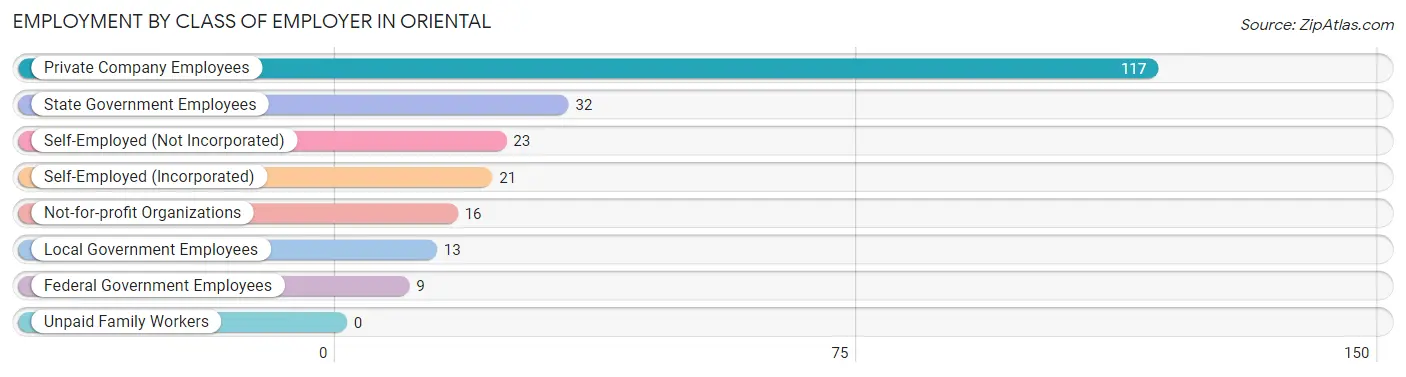
| Employer Class | # Employees | % Employees |
| Private Company Employees | 117 | 50.6% |
| Self-Employed (Incorporated) | 21 | 9.1% |
| Self-Employed (Not Incorporated) | 23 | 10.0% |
| Not-for-profit Organizations | 16 | 6.9% |
| Local Government Employees | 13 | 5.6% |
| State Government Employees | 32 | 13.9% |
| Federal Government Employees | 9 | 3.9% |
| Unpaid Family Workers | 0 | 0.0% |
| Total | 231 | 100.0% |
Employment Status by Age in Oriental
According to the labor force statistics for Oriental, out of the total population over 16 years of age (927), 25.9% or 240 individuals are in the labor force, with 1.3% or 3 of them unemployed. The age group with the highest labor force participation rate is 45 to 54 years, with 100.0% or 56 individuals in the labor force. Within the labor force, the 25 to 29 years age range has the highest percentage of unemployed individuals, with 27.3% or 3 of them being unemployed.
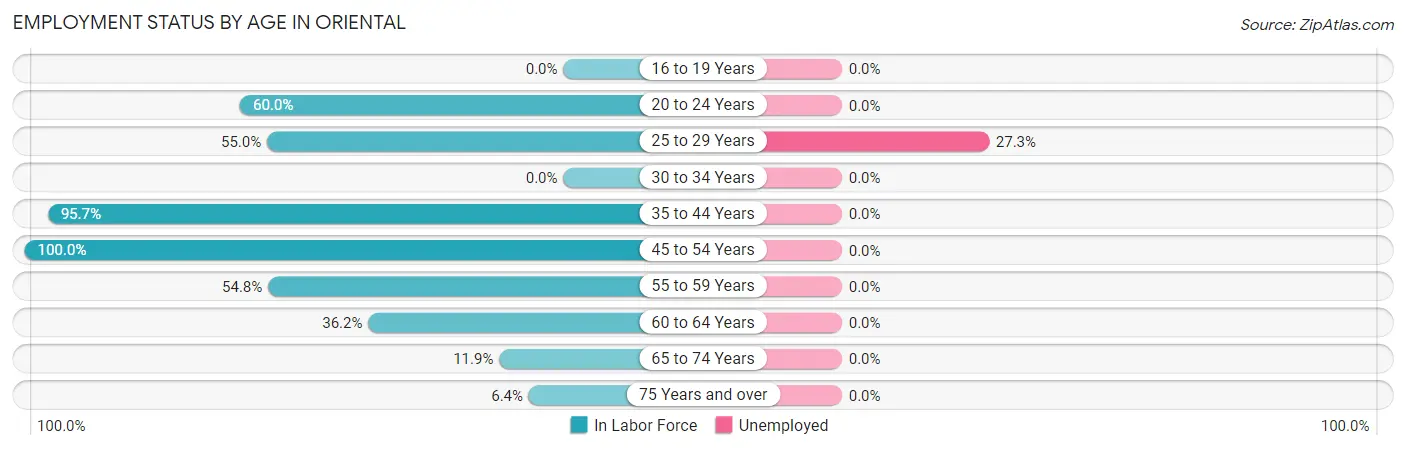
| Age Bracket | In Labor Force | Unemployed |
| 16 to 19 Years | 0 (0.0%) | 0 (0.0%) |
| 20 to 24 Years | 6 (60.0%) | 0 (0.0%) |
| 25 to 29 Years | 11 (55.0%) | 3 (27.3%) |
| 30 to 34 Years | 0 (0.0%) | 0 (0.0%) |
| 35 to 44 Years | 22 (95.7%) | 0 (0.0%) |
| 45 to 54 Years | 56 (100.0%) | 0 (0.0%) |
| 55 to 59 Years | 34 (54.8%) | 0 (0.0%) |
| 60 to 64 Years | 54 (36.2%) | 0 (0.0%) |
| 65 to 74 Years | 40 (11.9%) | 0 (0.0%) |
| 75 Years and over | 17 (6.4%) | 0 (0.0%) |
| Total | 240 (25.9%) | 3 (1.3%) |
Employment Status by Educational Attainment in Oriental
According to labor force statistics for Oriental, 57.1% of individuals (177) out of the total population between 25 and 64 years of age (310) are in the labor force, with 1.7% or 3 of them being unemployed. The group with the highest labor force participation rate are those with the educational attainment of bachelor's degree or higher, with 78.0% or 96 individuals in the labor force. Within the labor force, individuals with bachelor's degree or higher education have the highest percentage of unemployment, with 3.1% or 3 of them being unemployed.
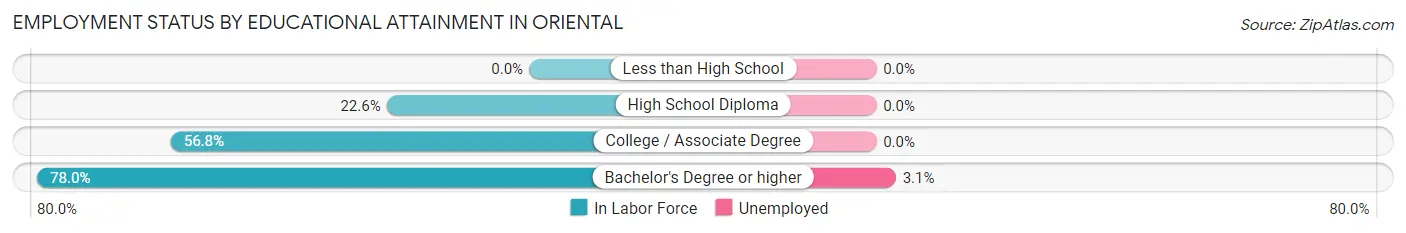
| Educational Attainment | In Labor Force | Unemployed |
| Less than High School | 0 (0.0%) | 0 (0.0%) |
| High School Diploma | 14 (22.6%) | 0 (0.0%) |
| College / Associate Degree | 67 (56.8%) | 0 (0.0%) |
| Bachelor's Degree or higher | 96 (78.0%) | 4 (3.1%) |
| Total | 177 (57.1%) | 5 (1.7%) |
Employment Occupations by Sex in Oriental
Management, Business, Science and Arts Occupations
The most common Management, Business, Science and Arts occupations in Oriental are Management (34 | 14.3%), Community & Social Service (34 | 14.3%), Computers, Engineering & Science (21 | 8.9%), Computers & Mathematics (18 | 7.6%), and Arts, Media & Entertainment (13 | 5.5%).
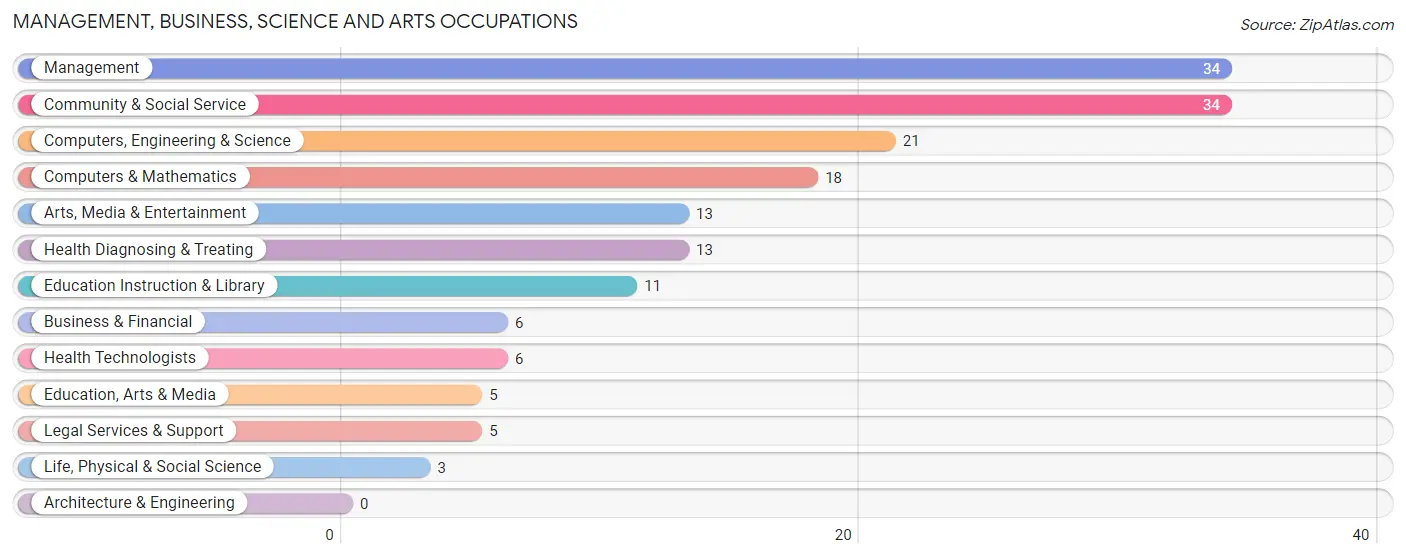
Management, Business, Science and Arts Occupations by Sex
Within the Management, Business, Science and Arts occupations in Oriental, the most male-oriented occupations are Computers & Mathematics (100.0%), Computers, Engineering & Science (85.7%), and Education Instruction & Library (36.4%), while the most female-oriented occupations are Business & Financial (100.0%), Life, Physical & Social Science (100.0%), and Education, Arts & Media (100.0%).
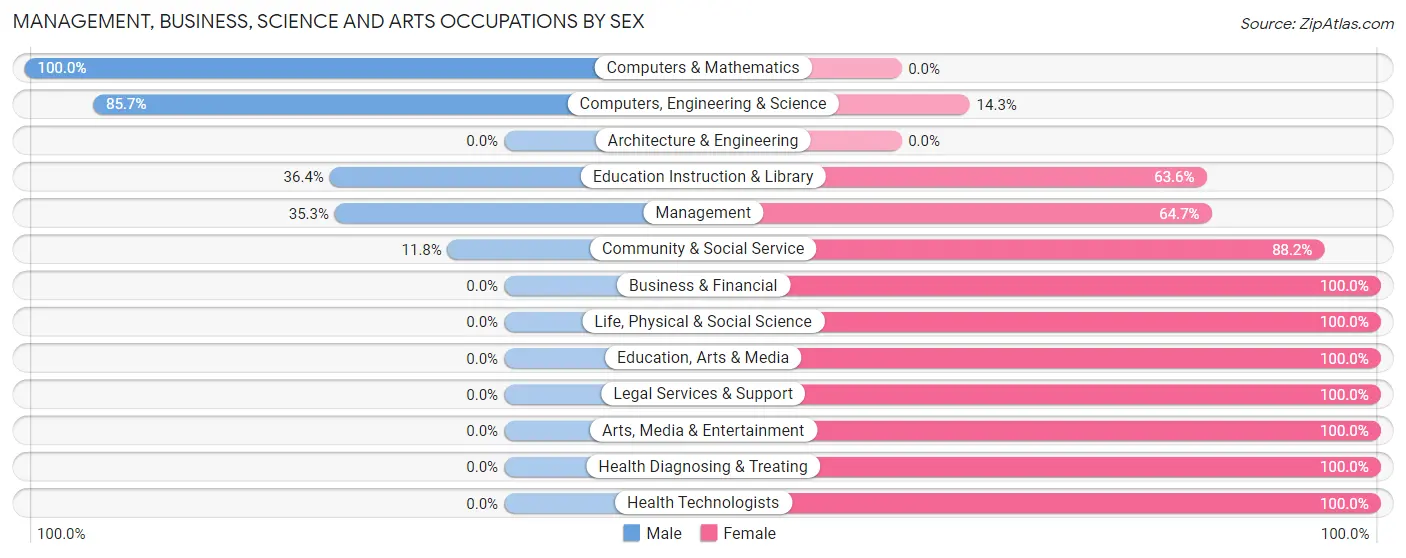
| Occupation | Male | Female |
| Management | 12 (35.3%) | 22 (64.7%) |
| Business & Financial | 0 (0.0%) | 6 (100.0%) |
| Computers, Engineering & Science | 18 (85.7%) | 3 (14.3%) |
| Computers & Mathematics | 18 (100.0%) | 0 (0.0%) |
| Architecture & Engineering | 0 (0.0%) | 0 (0.0%) |
| Life, Physical & Social Science | 0 (0.0%) | 3 (100.0%) |
| Community & Social Service | 4 (11.8%) | 30 (88.2%) |
| Education, Arts & Media | 0 (0.0%) | 5 (100.0%) |
| Legal Services & Support | 0 (0.0%) | 5 (100.0%) |
| Education Instruction & Library | 4 (36.4%) | 7 (63.6%) |
| Arts, Media & Entertainment | 0 (0.0%) | 13 (100.0%) |
| Health Diagnosing & Treating | 0 (0.0%) | 13 (100.0%) |
| Health Technologists | 0 (0.0%) | 6 (100.0%) |
| Total (Category) | 34 (31.5%) | 74 (68.5%) |
| Total (Overall) | 83 (35.0%) | 154 (65.0%) |
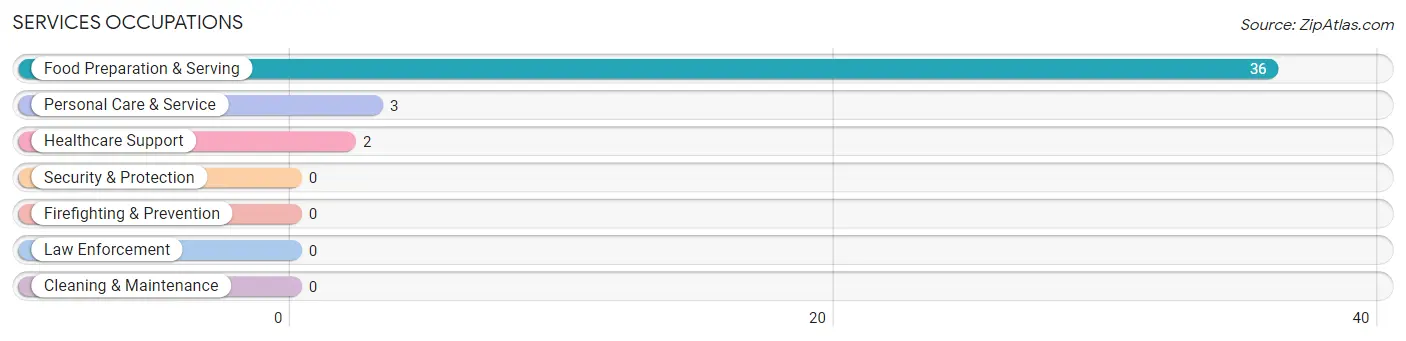
Services Occupations
The most common Services occupations in Oriental are Food Preparation & Serving (36 | 15.2%), Personal Care & Service (3 | 1.3%), and Healthcare Support (2 | 0.8%).
Services Occupations by Sex
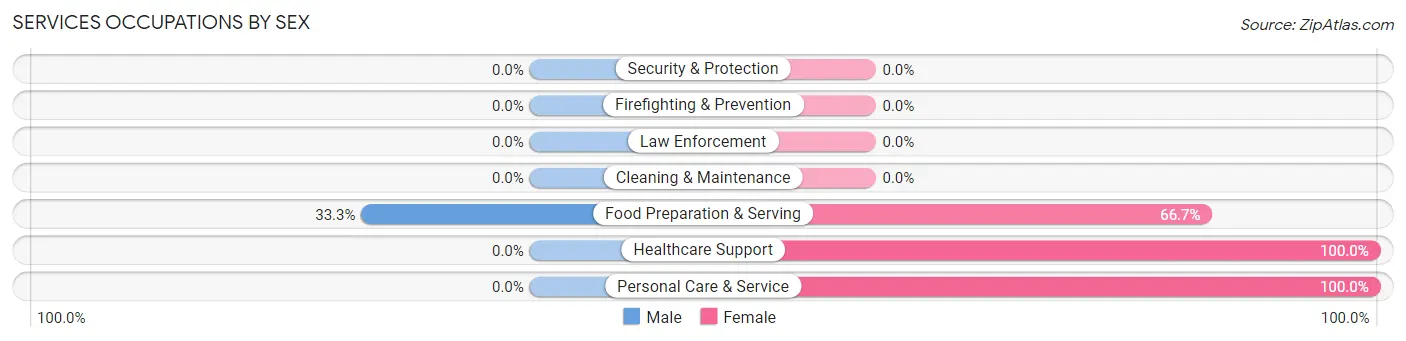
| Occupation | Male | Female |
| Healthcare Support | 0 (0.0%) | 2 (100.0%) |
| Security & Protection | 0 (0.0%) | 0 (0.0%) |
| Firefighting & Prevention | 0 (0.0%) | 0 (0.0%) |
| Law Enforcement | 0 (0.0%) | 0 (0.0%) |
| Food Preparation & Serving | 12 (33.3%) | 24 (66.7%) |
| Cleaning & Maintenance | 0 (0.0%) | 0 (0.0%) |
| Personal Care & Service | 0 (0.0%) | 3 (100.0%) |
| Total (Category) | 12 (29.3%) | 29 (70.7%) |
| Total (Overall) | 83 (35.0%) | 154 (65.0%) |
Sales and Office Occupations
The most common Sales and Office occupations in Oriental are Office & Administration (34 | 14.3%), and Sales & Related (27 | 11.4%).

Sales and Office Occupations by Sex

| Occupation | Male | Female |
| Sales & Related | 10 (37.0%) | 17 (63.0%) |
| Office & Administration | 0 (0.0%) | 34 (100.0%) |
| Total (Category) | 10 (16.4%) | 51 (83.6%) |
| Total (Overall) | 83 (35.0%) | 154 (65.0%) |
Natural Resources, Construction and Maintenance Occupations
The most common Natural Resources, Construction and Maintenance occupations in Oriental are , and Installation, Maintenance & Repair (13 | 5.5%).
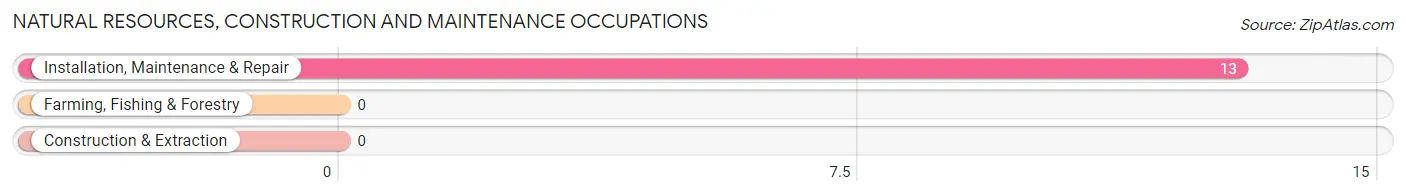
Natural Resources, Construction and Maintenance Occupations by Sex
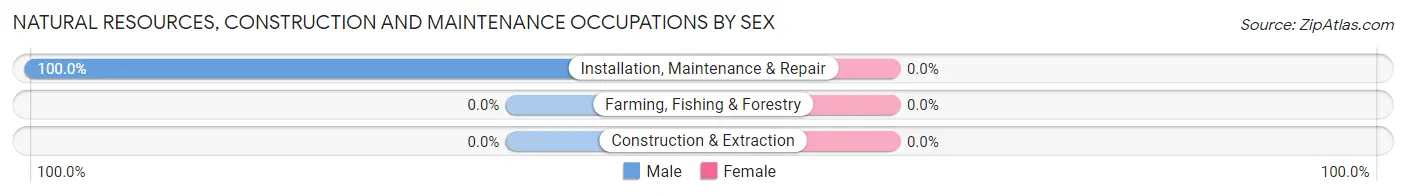
| Occupation | Male | Female |
| Farming, Fishing & Forestry | 0 (0.0%) | 0 (0.0%) |
| Construction & Extraction | 0 (0.0%) | 0 (0.0%) |
| Installation, Maintenance & Repair | 13 (100.0%) | 0 (0.0%) |
| Total (Category) | 13 (100.0%) | 0 (0.0%) |
| Total (Overall) | 83 (35.0%) | 154 (65.0%) |
Production, Transportation and Moving Occupations
The most common Production, Transportation and Moving occupations in Oriental are Material Moving (9 | 3.8%), and Production (5 | 2.1%).
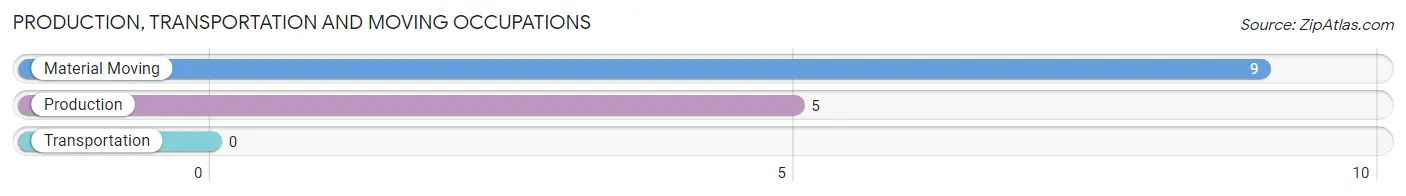
Production, Transportation and Moving Occupations by Sex
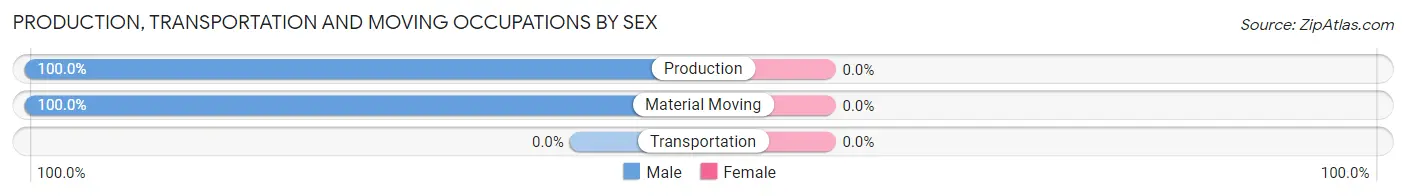
| Occupation | Male | Female |
| Production | 5 (100.0%) | 0 (0.0%) |
| Transportation | 0 (0.0%) | 0 (0.0%) |
| Material Moving | 9 (100.0%) | 0 (0.0%) |
| Total (Category) | 14 (100.0%) | 0 (0.0%) |
| Total (Overall) | 83 (35.0%) | 154 (65.0%) |
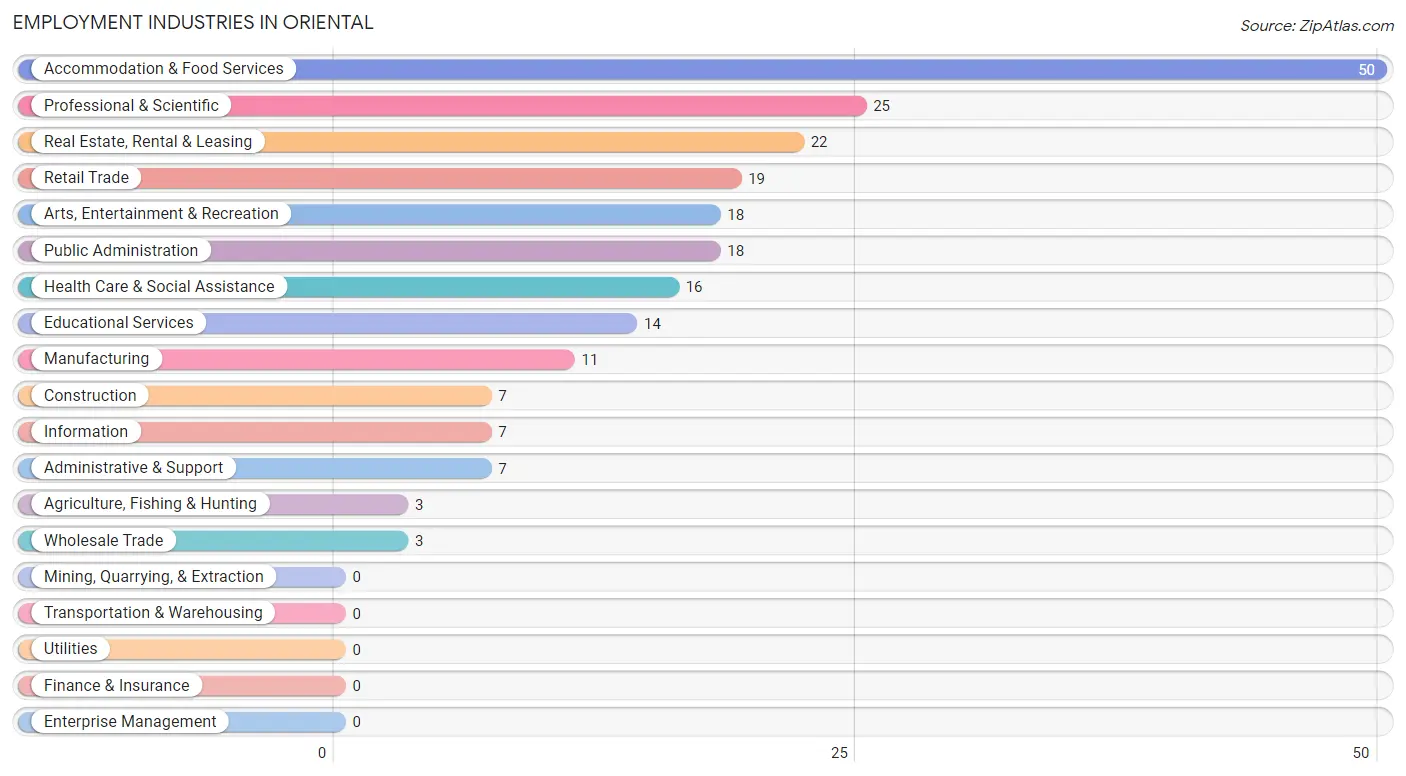
Employment Industries by Sex in Oriental
Employment Industries in Oriental
The major employment industries in Oriental include Accommodation & Food Services (50 | 21.1%), Professional & Scientific (25 | 10.5%), Real Estate, Rental & Leasing (22 | 9.3%), Retail Trade (19 | 8.0%), and Arts, Entertainment & Recreation (18 | 7.6%).
Employment Industries by Sex in Oriental
The Oriental industries that see more men than women are Public Administration (72.2%), Construction (57.1%), and Information (57.1%), whereas the industries that tend to have a higher number of women are Agriculture, Fishing & Hunting (100.0%), Wholesale Trade (100.0%), and Real Estate, Rental & Leasing (100.0%).
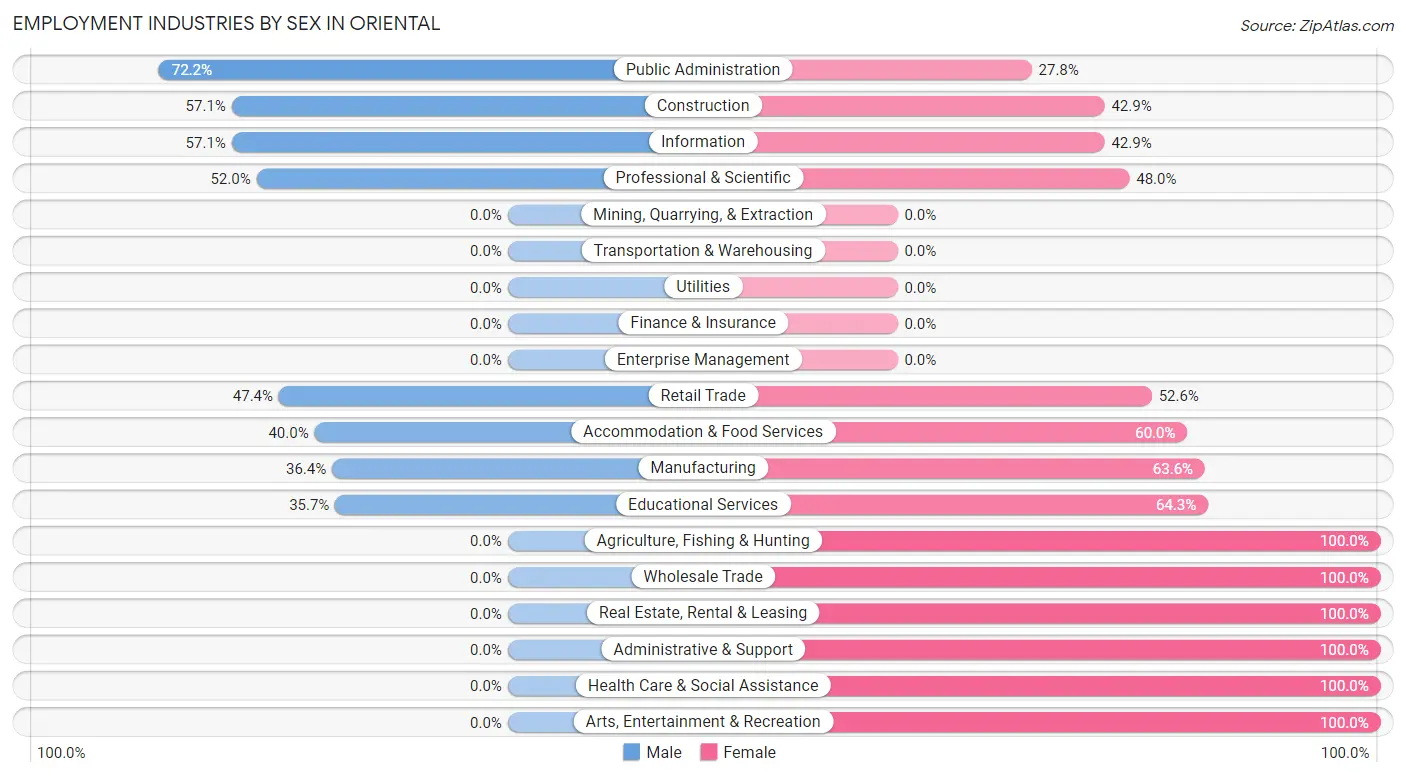
| Industry | Male | Female |
| Agriculture, Fishing & Hunting | 0 (0.0%) | 3 (100.0%) |
| Mining, Quarrying, & Extraction | 0 (0.0%) | 0 (0.0%) |
| Construction | 4 (57.1%) | 3 (42.9%) |
| Manufacturing | 4 (36.4%) | 7 (63.6%) |
| Wholesale Trade | 0 (0.0%) | 3 (100.0%) |
| Retail Trade | 9 (47.4%) | 10 (52.6%) |
| Transportation & Warehousing | 0 (0.0%) | 0 (0.0%) |
| Utilities | 0 (0.0%) | 0 (0.0%) |
| Information | 4 (57.1%) | 3 (42.9%) |
| Finance & Insurance | 0 (0.0%) | 0 (0.0%) |
| Real Estate, Rental & Leasing | 0 (0.0%) | 22 (100.0%) |
| Professional & Scientific | 13 (52.0%) | 12 (48.0%) |
| Enterprise Management | 0 (0.0%) | 0 (0.0%) |
| Administrative & Support | 0 (0.0%) | 7 (100.0%) |
| Educational Services | 5 (35.7%) | 9 (64.3%) |
| Health Care & Social Assistance | 0 (0.0%) | 16 (100.0%) |
| Arts, Entertainment & Recreation | 0 (0.0%) | 18 (100.0%) |
| Accommodation & Food Services | 20 (40.0%) | 30 (60.0%) |
| Public Administration | 13 (72.2%) | 5 (27.8%) |
| Total | 83 (35.0%) | 154 (65.0%) |
Education in Oriental
School Enrollment in Oriental
The most common levels of schooling among the 40 students in Oriental are middle school (22 | 55.0%), elementary school (6 | 15.0%), and graduate / professional (5 | 12.5%).
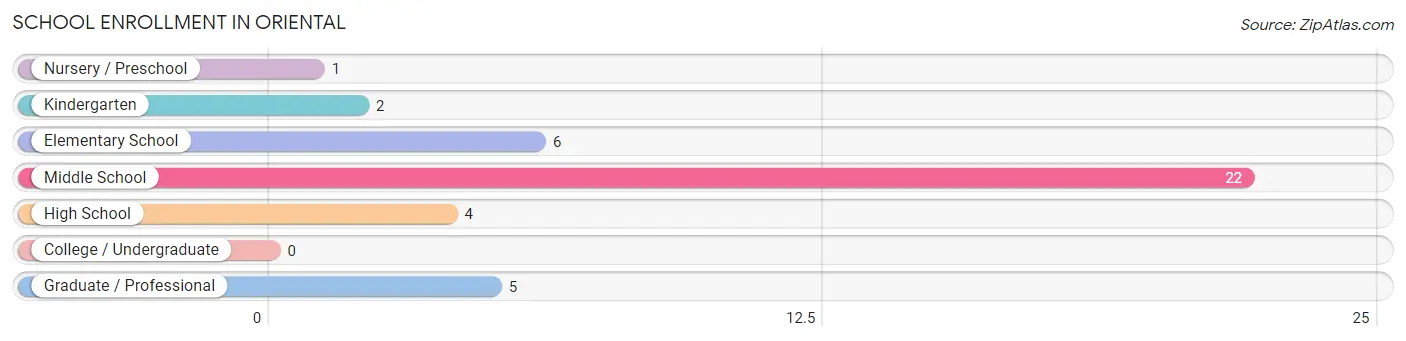
| School Level | # Students | % Students |
| Nursery / Preschool | 1 | 2.5% |
| Kindergarten | 2 | 5.0% |
| Elementary School | 6 | 15.0% |
| Middle School | 22 | 55.0% |
| High School | 4 | 10.0% |
| College / Undergraduate | 0 | 0.0% |
| Graduate / Professional | 5 | 12.5% |
| Total | 40 | 100.0% |
School Enrollment by Age by Funding Source in Oriental
Out of a total of 40 students who are enrolled in schools in Oriental, 18 (45.0%) attend a private institution, while the remaining 22 (55.0%) are enrolled in public schools. The age group of 10 to 14 year olds has the highest likelihood of being enrolled in private schools, with 14 (63.6% in the age bracket) enrolled. Conversely, the age group of 18 to 19 year olds has the lowest likelihood of being enrolled in a private school, with 4 (100.0% in the age bracket) attending a public institution.
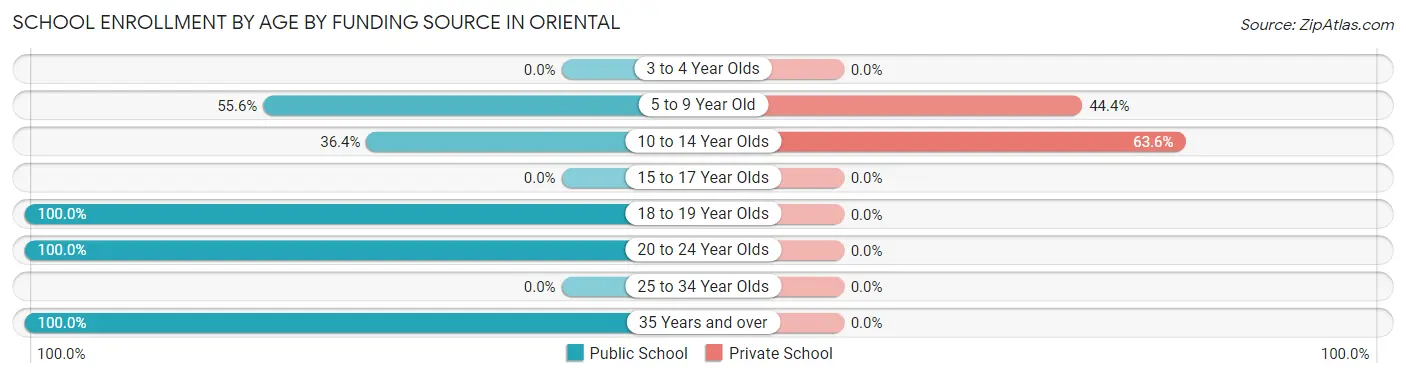
| Age Bracket | Public School | Private School |
| 3 to 4 Year Olds | 0 (0.0%) | 0 (0.0%) |
| 5 to 9 Year Old | 5 (55.6%) | 4 (44.4%) |
| 10 to 14 Year Olds | 8 (36.4%) | 14 (63.6%) |
| 15 to 17 Year Olds | 0 (0.0%) | 0 (0.0%) |
| 18 to 19 Year Olds | 4 (100.0%) | 0 (0.0%) |
| 20 to 24 Year Olds | 4 (100.0%) | 0 (0.0%) |
| 25 to 34 Year Olds | 0 (0.0%) | 0 (0.0%) |
| 35 Years and over | 1 (100.0%) | 0 (0.0%) |
| Total | 22 (55.0%) | 18 (45.0%) |
Educational Attainment by Field of Study in Oriental
Bio, nature & agricultural (98 | 19.1%), education (70 | 13.7%), engineering (62 | 12.1%), psychology (60 | 11.7%), and literature & languages (46 | 9.0%) are the most common fields of study among 512 individuals in Oriental who have obtained a bachelor's degree or higher.
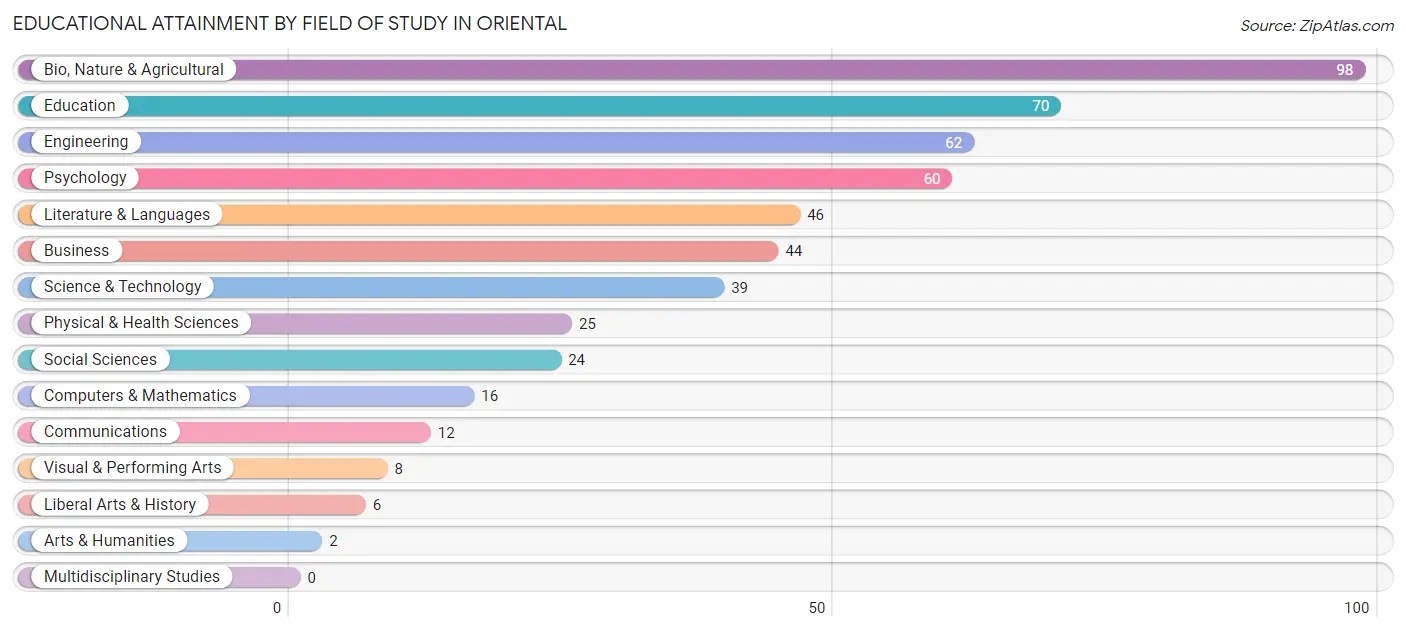
| Field of Study | # Graduates | % Graduates |
| Computers & Mathematics | 16 | 3.1% |
| Bio, Nature & Agricultural | 98 | 19.1% |
| Physical & Health Sciences | 25 | 4.9% |
| Psychology | 60 | 11.7% |
| Social Sciences | 24 | 4.7% |
| Engineering | 62 | 12.1% |
| Multidisciplinary Studies | 0 | 0.0% |
| Science & Technology | 39 | 7.6% |
| Business | 44 | 8.6% |
| Education | 70 | 13.7% |
| Literature & Languages | 46 | 9.0% |
| Liberal Arts & History | 6 | 1.2% |
| Visual & Performing Arts | 8 | 1.6% |
| Communications | 12 | 2.3% |
| Arts & Humanities | 2 | 0.4% |
| Total | 512 | 100.0% |
Transportation & Commute in Oriental
Vehicle Availability by Sex in Oriental
The most prevalent vehicle ownership categories in Oriental are males with 2 vehicles (40, accounting for 48.2%) and females with 2 vehicles (58, making up 27.0%).
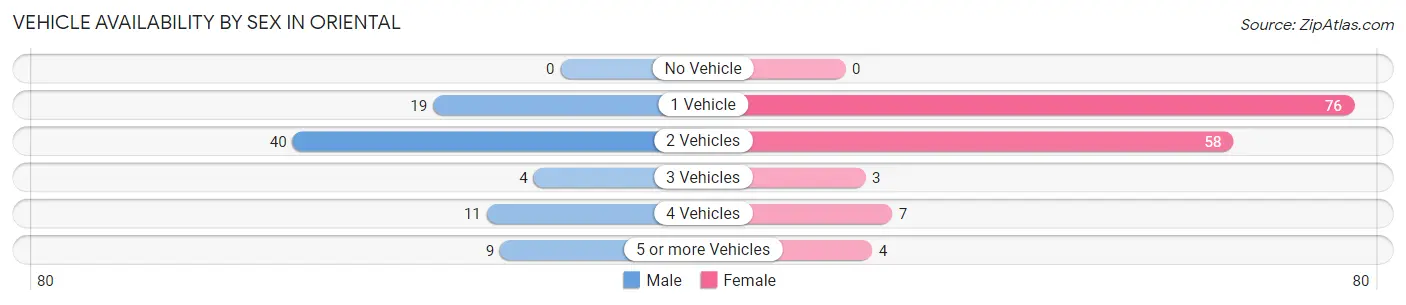
| Vehicles Available | Male | Female |
| No Vehicle | 0 (0.0%) | 0 (0.0%) |
| 1 Vehicle | 19 (22.9%) | 76 (51.3%) |
| 2 Vehicles | 40 (48.2%) | 58 (39.2%) |
| 3 Vehicles | 4 (4.8%) | 3 (2.0%) |
| 4 Vehicles | 11 (13.3%) | 7 (4.7%) |
| 5 or more Vehicles | 9 (10.8%) | 4 (2.7%) |
| Total | 83 (100.0%) | 148 (100.0%) |
Commute Time in Oriental
The most frequently occuring commute durations in Oriental are 5 to 9 minutes (58 commuters, 32.6%), 10 to 14 minutes (26 commuters, 14.6%), and less than 5 minutes (23 commuters, 12.9%).
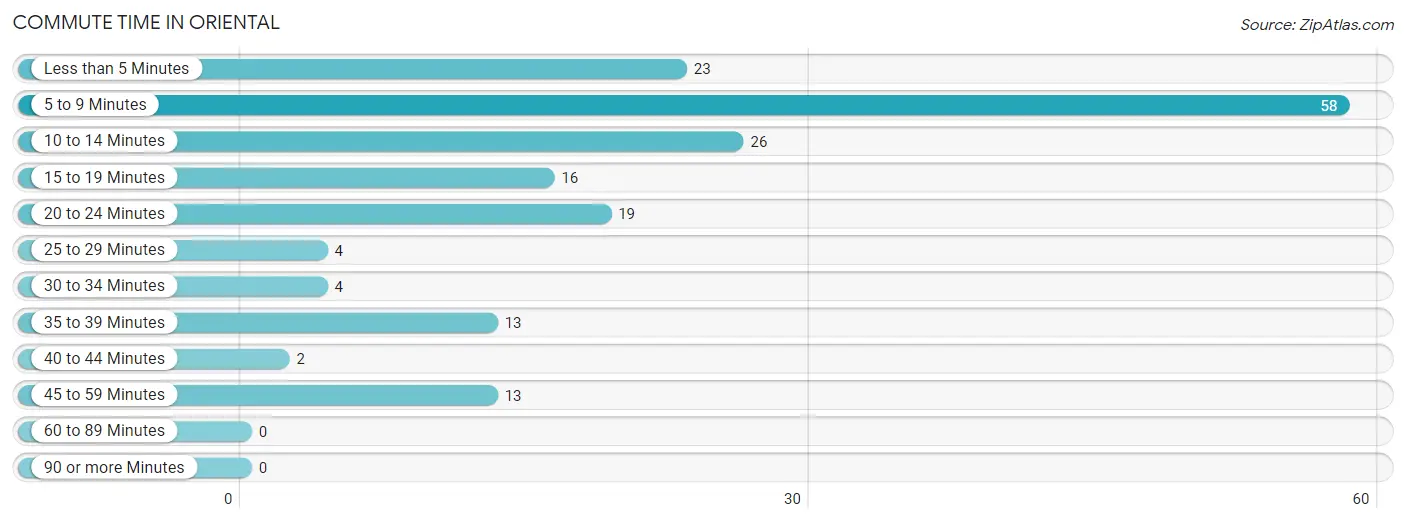
| Commute Time | # Commuters | % Commuters |
| Less than 5 Minutes | 23 | 12.9% |
| 5 to 9 Minutes | 58 | 32.6% |
| 10 to 14 Minutes | 26 | 14.6% |
| 15 to 19 Minutes | 16 | 9.0% |
| 20 to 24 Minutes | 19 | 10.7% |
| 25 to 29 Minutes | 4 | 2.2% |
| 30 to 34 Minutes | 4 | 2.2% |
| 35 to 39 Minutes | 13 | 7.3% |
| 40 to 44 Minutes | 2 | 1.1% |
| 45 to 59 Minutes | 13 | 7.3% |
| 60 to 89 Minutes | 0 | 0.0% |
| 90 or more Minutes | 0 | 0.0% |
Commute Time by Sex in Oriental
The most common commute times in Oriental are less than 5 minutes (14 commuters, 25.9%) for males and 5 to 9 minutes (51 commuters, 41.1%) for females.
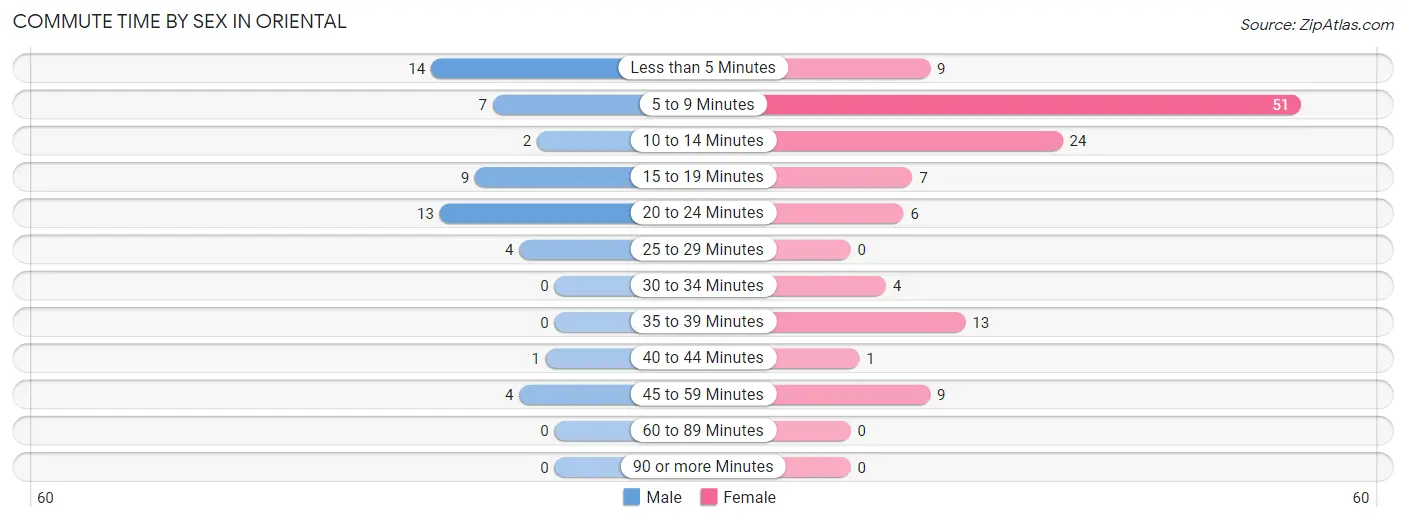
| Commute Time | Male | Female |
| Less than 5 Minutes | 14 (25.9%) | 9 (7.3%) |
| 5 to 9 Minutes | 7 (13.0%) | 51 (41.1%) |
| 10 to 14 Minutes | 2 (3.7%) | 24 (19.4%) |
| 15 to 19 Minutes | 9 (16.7%) | 7 (5.7%) |
| 20 to 24 Minutes | 13 (24.1%) | 6 (4.8%) |
| 25 to 29 Minutes | 4 (7.4%) | 0 (0.0%) |
| 30 to 34 Minutes | 0 (0.0%) | 4 (3.2%) |
| 35 to 39 Minutes | 0 (0.0%) | 13 (10.5%) |
| 40 to 44 Minutes | 1 (1.8%) | 1 (0.8%) |
| 45 to 59 Minutes | 4 (7.4%) | 9 (7.3%) |
| 60 to 89 Minutes | 0 (0.0%) | 0 (0.0%) |
| 90 or more Minutes | 0 (0.0%) | 0 (0.0%) |
Time of Departure to Work by Sex in Oriental
The most frequent times of departure to work in Oriental are 9:00 AM to 9:59 AM (14, 25.9%) for males and 8:30 AM to 8:59 AM (36, 29.0%) for females.
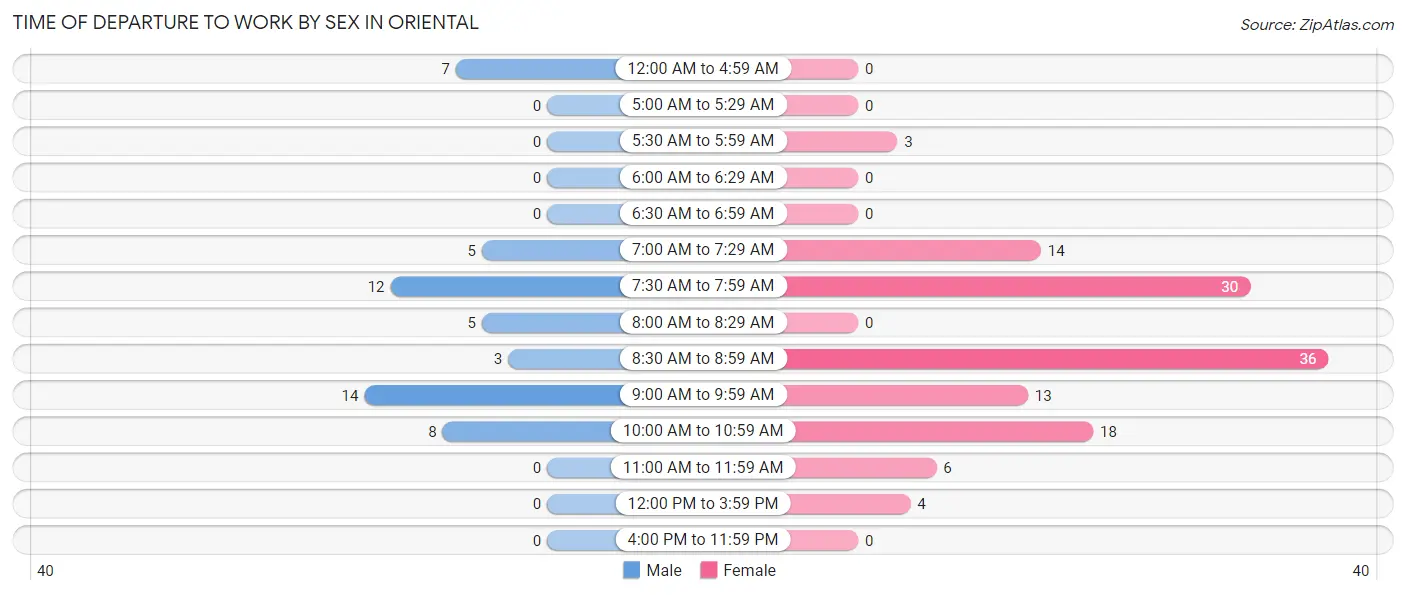
| Time of Departure | Male | Female |
| 12:00 AM to 4:59 AM | 7 (13.0%) | 0 (0.0%) |
| 5:00 AM to 5:29 AM | 0 (0.0%) | 0 (0.0%) |
| 5:30 AM to 5:59 AM | 0 (0.0%) | 3 (2.4%) |
| 6:00 AM to 6:29 AM | 0 (0.0%) | 0 (0.0%) |
| 6:30 AM to 6:59 AM | 0 (0.0%) | 0 (0.0%) |
| 7:00 AM to 7:29 AM | 5 (9.3%) | 14 (11.3%) |
| 7:30 AM to 7:59 AM | 12 (22.2%) | 30 (24.2%) |
| 8:00 AM to 8:29 AM | 5 (9.3%) | 0 (0.0%) |
| 8:30 AM to 8:59 AM | 3 (5.6%) | 36 (29.0%) |
| 9:00 AM to 9:59 AM | 14 (25.9%) | 13 (10.5%) |
| 10:00 AM to 10:59 AM | 8 (14.8%) | 18 (14.5%) |
| 11:00 AM to 11:59 AM | 0 (0.0%) | 6 (4.8%) |
| 12:00 PM to 3:59 PM | 0 (0.0%) | 4 (3.2%) |
| 4:00 PM to 11:59 PM | 0 (0.0%) | 0 (0.0%) |
| Total | 54 (100.0%) | 124 (100.0%) |
Housing Occupancy in Oriental
Occupancy by Ownership in Oriental
Of the total 571 dwellings in Oriental, owner-occupied units account for 474 (83.0%), while renter-occupied units make up 97 (17.0%).
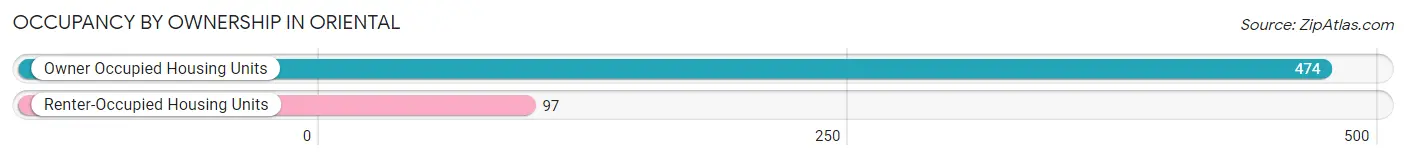
| Occupancy | # Housing Units | % Housing Units |
| Owner Occupied Housing Units | 474 | 83.0% |
| Renter-Occupied Housing Units | 97 | 17.0% |
| Total Occupied Housing Units | 571 | 100.0% |
Occupancy by Household Size in Oriental
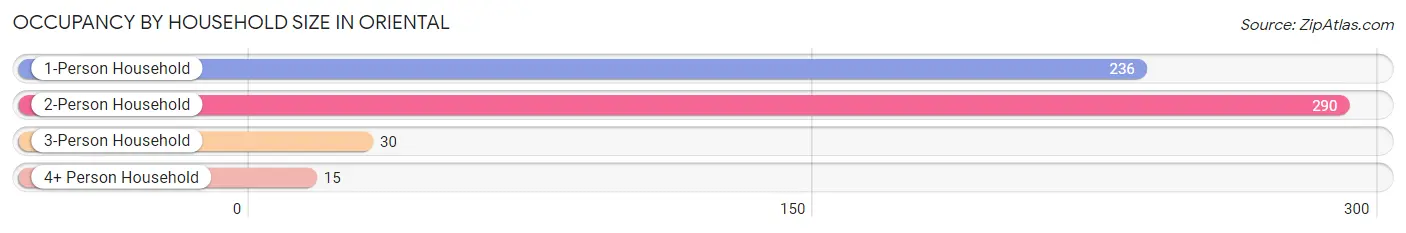
| Household Size | # Housing Units | % Housing Units |
| 1-Person Household | 236 | 41.3% |
| 2-Person Household | 290 | 50.8% |
| 3-Person Household | 30 | 5.2% |
| 4+ Person Household | 15 | 2.6% |
| Total Housing Units | 571 | 100.0% |
Occupancy by Ownership by Household Size in Oriental
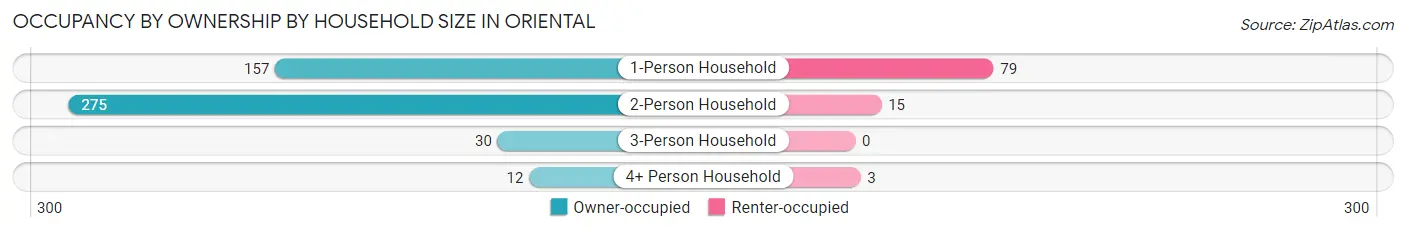
| Household Size | Owner-occupied | Renter-occupied |
| 1-Person Household | 157 (66.5%) | 79 (33.5%) |
| 2-Person Household | 275 (94.8%) | 15 (5.2%) |
| 3-Person Household | 30 (100.0%) | 0 (0.0%) |
| 4+ Person Household | 12 (80.0%) | 3 (20.0%) |
| Total Housing Units | 474 (83.0%) | 97 (17.0%) |
Occupancy by Educational Attainment in Oriental
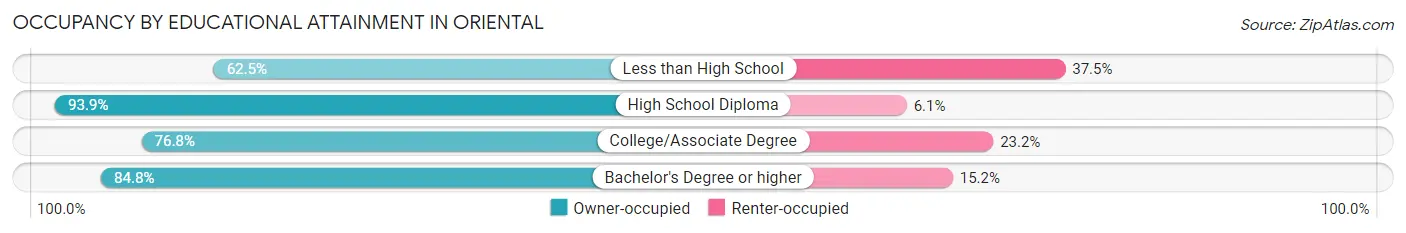
| Household Size | Owner-occupied | Renter-occupied |
| Less than High School | 5 (62.5%) | 3 (37.5%) |
| High School Diploma | 62 (93.9%) | 4 (6.1%) |
| College/Associate Degree | 139 (76.8%) | 42 (23.2%) |
| Bachelor's Degree or higher | 268 (84.8%) | 48 (15.2%) |
Occupancy by Age of Householder in Oriental
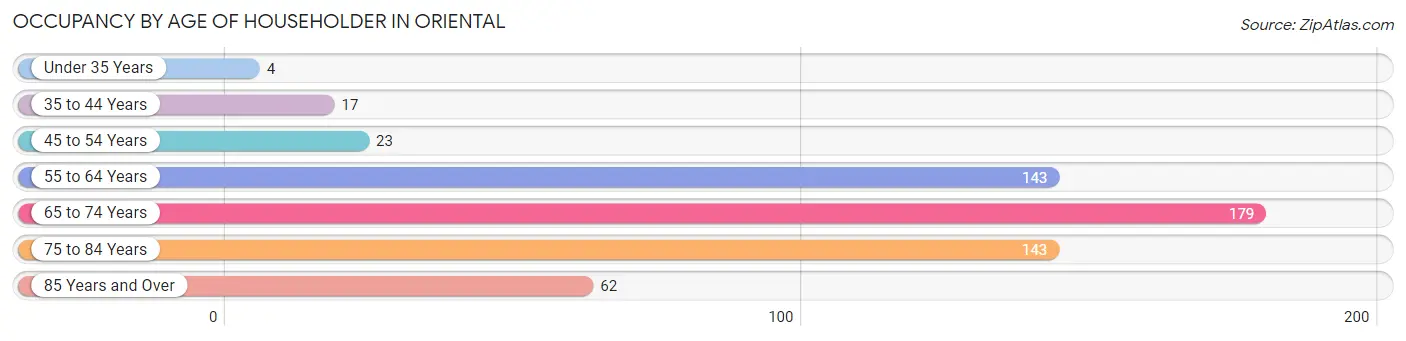
| Age Bracket | # Households | % Households |
| Under 35 Years | 4 | 0.7% |
| 35 to 44 Years | 17 | 3.0% |
| 45 to 54 Years | 23 | 4.0% |
| 55 to 64 Years | 143 | 25.0% |
| 65 to 74 Years | 179 | 31.4% |
| 75 to 84 Years | 143 | 25.0% |
| 85 Years and Over | 62 | 10.9% |
| Total | 571 | 100.0% |
Housing Finances in Oriental
Median Income by Occupancy in Oriental
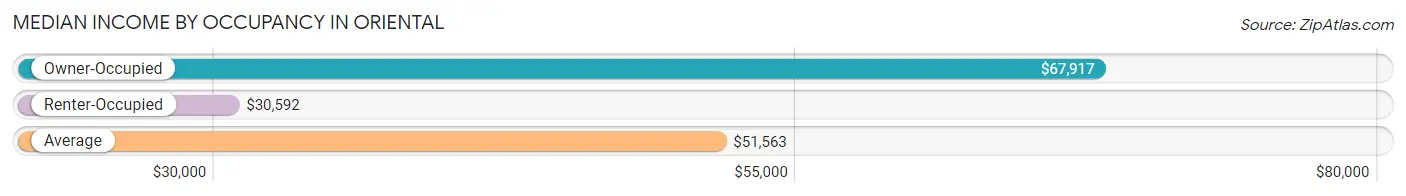
| Occupancy Type | # Households | Median Income |
| Owner-Occupied | 474 (83.0%) | $67,917 |
| Renter-Occupied | 97 (17.0%) | $30,592 |
| Average | 571 (100.0%) | $51,563 |
Occupancy by Householder Income Bracket in Oriental
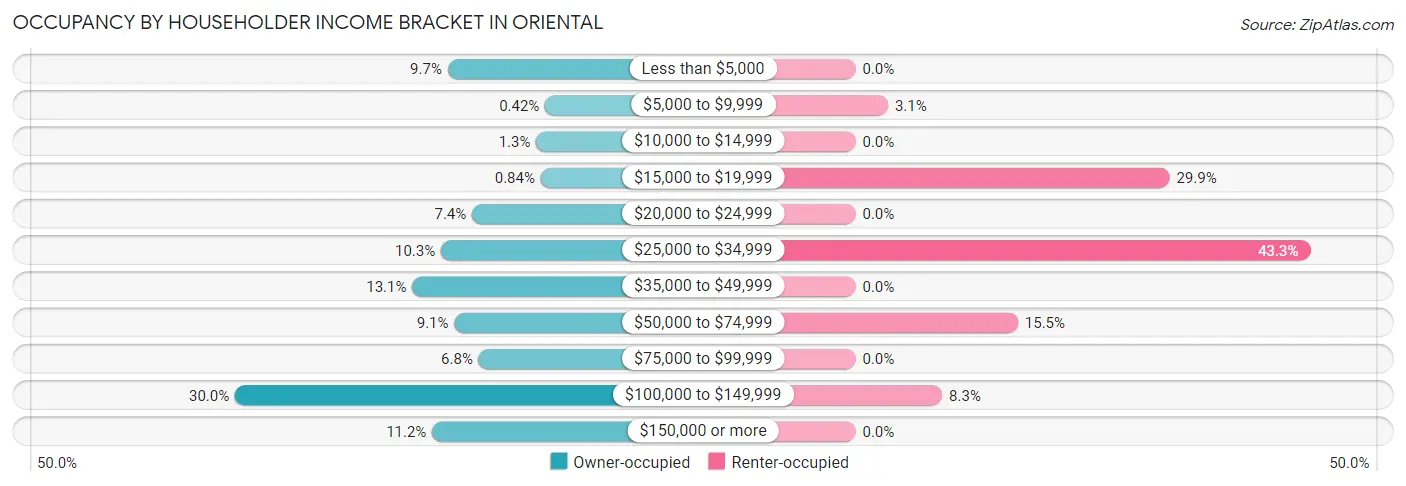
| Income Bracket | Owner-occupied | Renter-occupied |
| Less than $5,000 | 46 (9.7%) | 0 (0.0%) |
| $5,000 to $9,999 | 2 (0.4%) | 3 (3.1%) |
| $10,000 to $14,999 | 6 (1.3%) | 0 (0.0%) |
| $15,000 to $19,999 | 4 (0.8%) | 29 (29.9%) |
| $20,000 to $24,999 | 35 (7.4%) | 0 (0.0%) |
| $25,000 to $34,999 | 49 (10.3%) | 42 (43.3%) |
| $35,000 to $49,999 | 62 (13.1%) | 0 (0.0%) |
| $50,000 to $74,999 | 43 (9.1%) | 15 (15.5%) |
| $75,000 to $99,999 | 32 (6.8%) | 0 (0.0%) |
| $100,000 to $149,999 | 142 (30.0%) | 8 (8.3%) |
| $150,000 or more | 53 (11.2%) | 0 (0.0%) |
| Total | 474 (100.0%) | 97 (100.0%) |
Monthly Housing Cost Tiers in Oriental
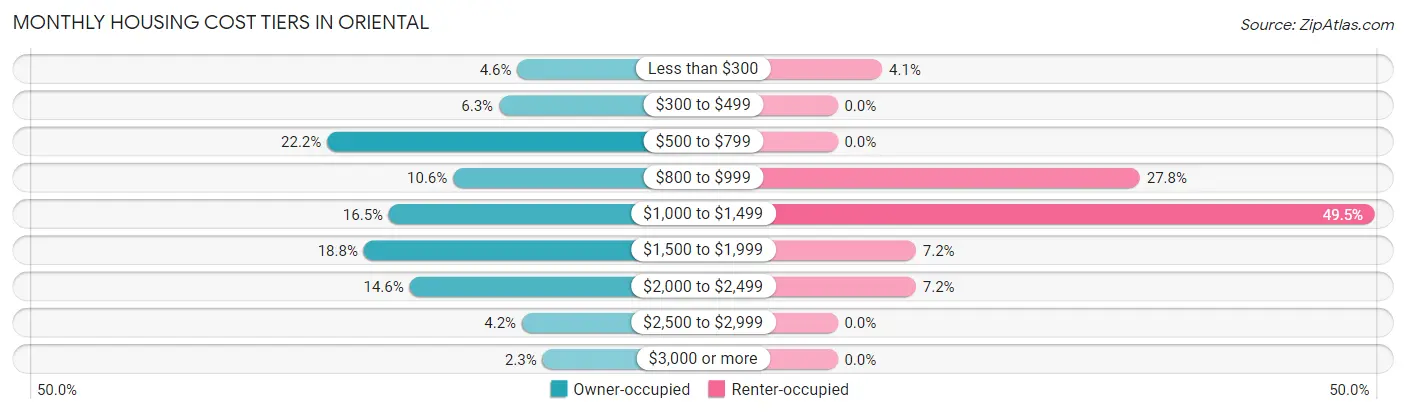
| Monthly Cost | Owner-occupied | Renter-occupied |
| Less than $300 | 22 (4.6%) | 4 (4.1%) |
| $300 to $499 | 30 (6.3%) | 0 (0.0%) |
| $500 to $799 | 105 (22.2%) | 0 (0.0%) |
| $800 to $999 | 50 (10.5%) | 27 (27.8%) |
| $1,000 to $1,499 | 78 (16.5%) | 48 (49.5%) |
| $1,500 to $1,999 | 89 (18.8%) | 7 (7.2%) |
| $2,000 to $2,499 | 69 (14.6%) | 7 (7.2%) |
| $2,500 to $2,999 | 20 (4.2%) | 0 (0.0%) |
| $3,000 or more | 11 (2.3%) | 0 (0.0%) |
| Total | 474 (100.0%) | 97 (100.0%) |
Physical Housing Characteristics in Oriental
Housing Structures in Oriental
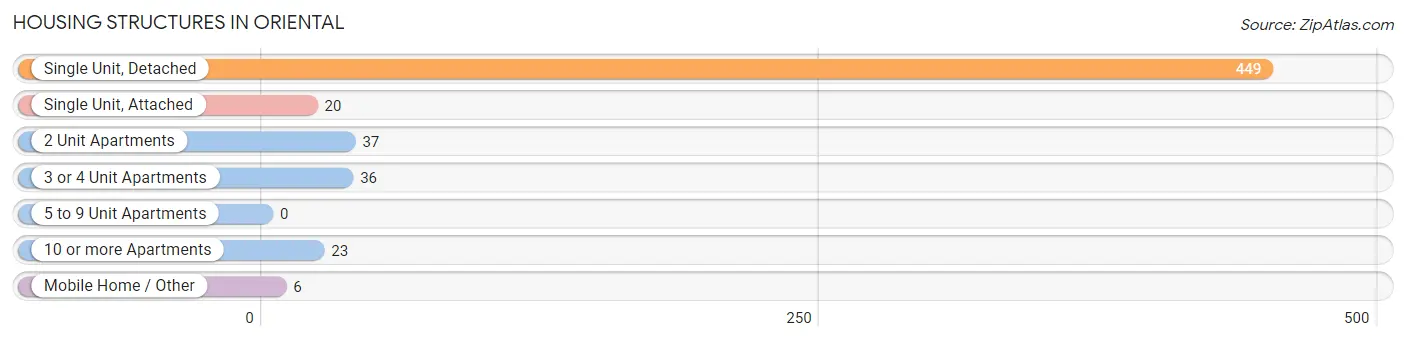
| Structure Type | # Housing Units | % Housing Units |
| Single Unit, Detached | 449 | 78.6% |
| Single Unit, Attached | 20 | 3.5% |
| 2 Unit Apartments | 37 | 6.5% |
| 3 or 4 Unit Apartments | 36 | 6.3% |
| 5 to 9 Unit Apartments | 0 | 0.0% |
| 10 or more Apartments | 23 | 4.0% |
| Mobile Home / Other | 6 | 1.1% |
| Total | 571 | 100.0% |
Housing Structures by Occupancy in Oriental
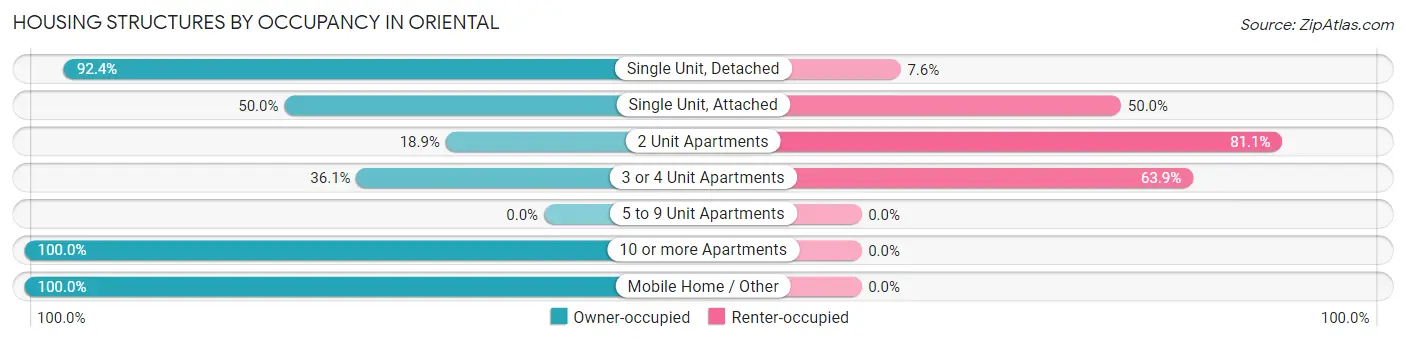
| Structure Type | Owner-occupied | Renter-occupied |
| Single Unit, Detached | 415 (92.4%) | 34 (7.6%) |
| Single Unit, Attached | 10 (50.0%) | 10 (50.0%) |
| 2 Unit Apartments | 7 (18.9%) | 30 (81.1%) |
| 3 or 4 Unit Apartments | 13 (36.1%) | 23 (63.9%) |
| 5 to 9 Unit Apartments | 0 (0.0%) | 0 (0.0%) |
| 10 or more Apartments | 23 (100.0%) | 0 (0.0%) |
| Mobile Home / Other | 6 (100.0%) | 0 (0.0%) |
| Total | 474 (83.0%) | 97 (17.0%) |
Housing Structures by Number of Rooms in Oriental
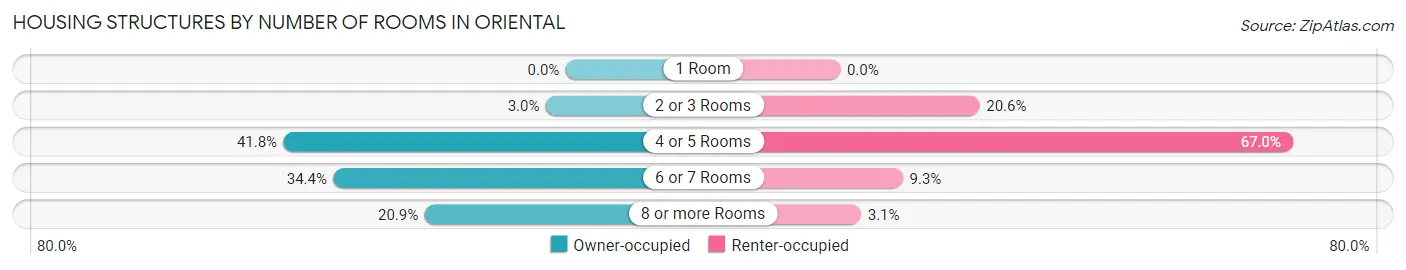
| Number of Rooms | Owner-occupied | Renter-occupied |
| 1 Room | 0 (0.0%) | 0 (0.0%) |
| 2 or 3 Rooms | 14 (2.9%) | 20 (20.6%) |
| 4 or 5 Rooms | 198 (41.8%) | 65 (67.0%) |
| 6 or 7 Rooms | 163 (34.4%) | 9 (9.3%) |
| 8 or more Rooms | 99 (20.9%) | 3 (3.1%) |
| Total | 474 (100.0%) | 97 (100.0%) |
Housing Structure by Heating Type in Oriental
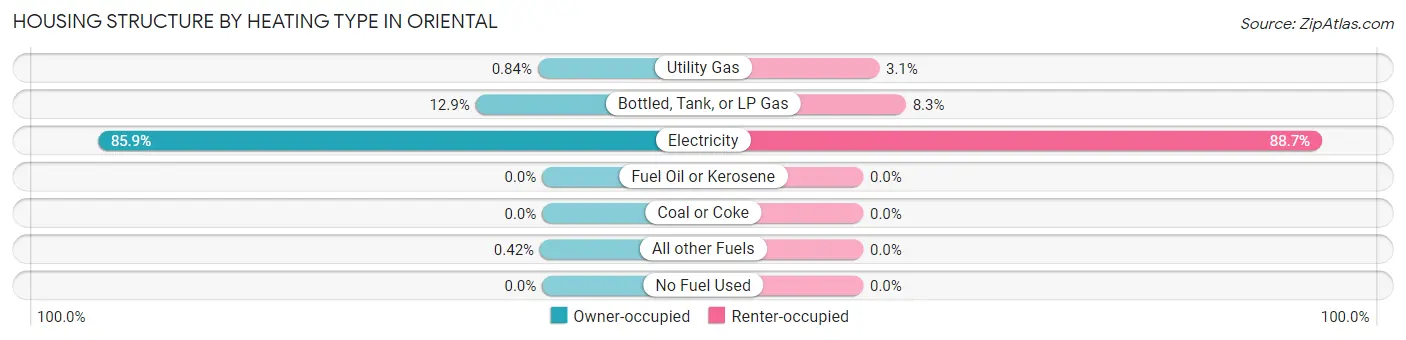
| Heating Type | Owner-occupied | Renter-occupied |
| Utility Gas | 4 (0.8%) | 3 (3.1%) |
| Bottled, Tank, or LP Gas | 61 (12.9%) | 8 (8.3%) |
| Electricity | 407 (85.9%) | 86 (88.7%) |
| Fuel Oil or Kerosene | 0 (0.0%) | 0 (0.0%) |
| Coal or Coke | 0 (0.0%) | 0 (0.0%) |
| All other Fuels | 2 (0.4%) | 0 (0.0%) |
| No Fuel Used | 0 (0.0%) | 0 (0.0%) |
| Total | 474 (100.0%) | 97 (100.0%) |
Household Vehicle Usage in Oriental
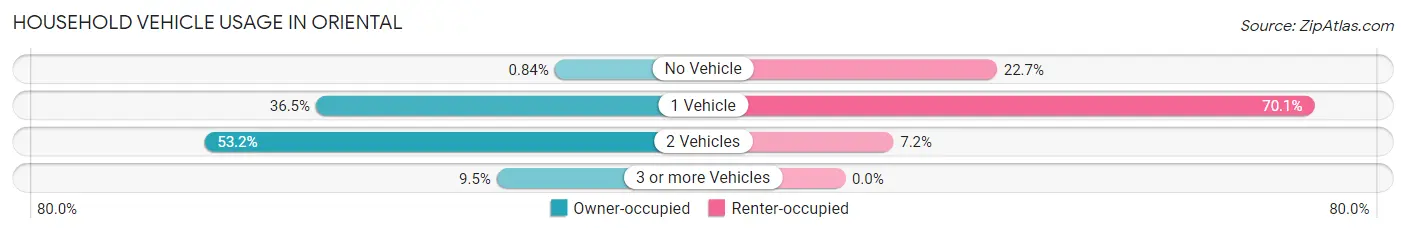
| Vehicles per Household | Owner-occupied | Renter-occupied |
| No Vehicle | 4 (0.8%) | 22 (22.7%) |
| 1 Vehicle | 173 (36.5%) | 68 (70.1%) |
| 2 Vehicles | 252 (53.2%) | 7 (7.2%) |
| 3 or more Vehicles | 45 (9.5%) | 0 (0.0%) |
| Total | 474 (100.0%) | 97 (100.0%) |
Real Estate & Mortgages in Oriental
Real Estate and Mortgage Overview in Oriental
| Characteristic | Without Mortgage | With Mortgage |
| Housing Units | 217 | 257 |
| Median Property Value | $330,600 | $430,000 |
| Median Household Income | $39,375 | $30 |
| Monthly Housing Costs | $654 | $11 |
| Real Estate Taxes | $1,891 | $0 |
Property Value by Mortgage Status in Oriental
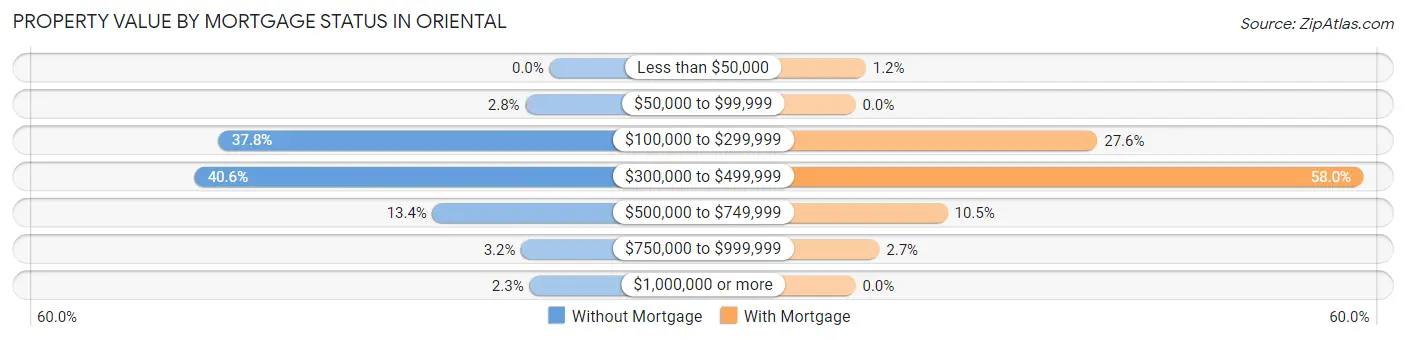
| Property Value | Without Mortgage | With Mortgage |
| Less than $50,000 | 0 (0.0%) | 3 (1.2%) |
| $50,000 to $99,999 | 6 (2.8%) | 0 (0.0%) |
| $100,000 to $299,999 | 82 (37.8%) | 71 (27.6%) |
| $300,000 to $499,999 | 88 (40.6%) | 149 (58.0%) |
| $500,000 to $749,999 | 29 (13.4%) | 27 (10.5%) |
| $750,000 to $999,999 | 7 (3.2%) | 7 (2.7%) |
| $1,000,000 or more | 5 (2.3%) | 0 (0.0%) |
| Total | 217 (100.0%) | 257 (100.0%) |
Household Income by Mortgage Status in Oriental
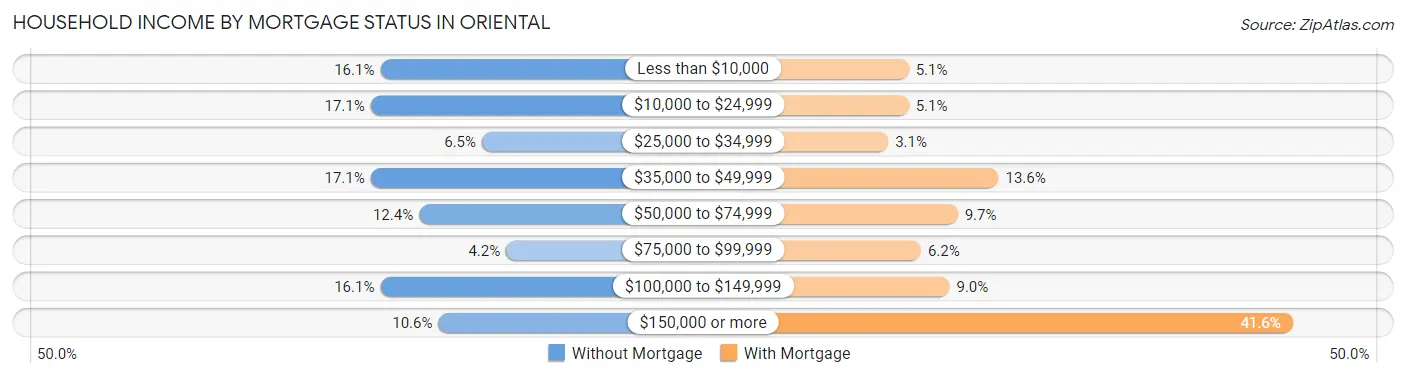
| Household Income | Without Mortgage | With Mortgage |
| Less than $10,000 | 35 (16.1%) | 13 (5.1%) |
| $10,000 to $24,999 | 37 (17.1%) | 13 (5.1%) |
| $25,000 to $34,999 | 14 (6.5%) | 8 (3.1%) |
| $35,000 to $49,999 | 37 (17.1%) | 35 (13.6%) |
| $50,000 to $74,999 | 27 (12.4%) | 25 (9.7%) |
| $75,000 to $99,999 | 9 (4.2%) | 16 (6.2%) |
| $100,000 to $149,999 | 35 (16.1%) | 23 (8.9%) |
| $150,000 or more | 23 (10.6%) | 107 (41.6%) |
| Total | 217 (100.0%) | 257 (100.0%) |
Property Value to Household Income Ratio in Oriental
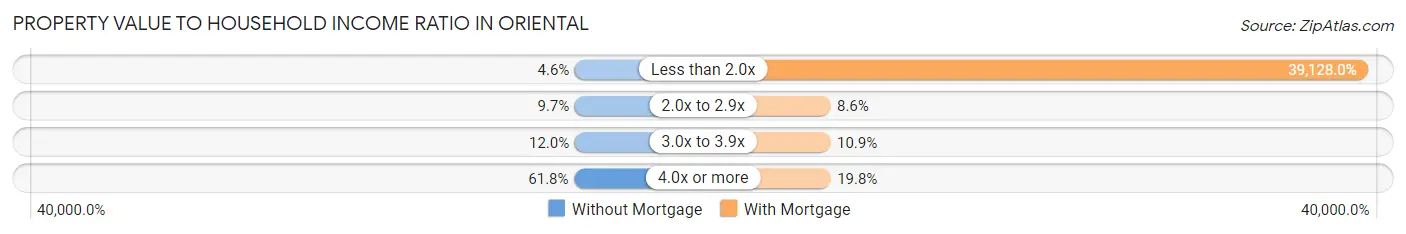
| Value-to-Income Ratio | Without Mortgage | With Mortgage |
| Less than 2.0x | 10 (4.6%) | 100,559 (39,128.0%) |
| 2.0x to 2.9x | 21 (9.7%) | 22 (8.6%) |
| 3.0x to 3.9x | 26 (12.0%) | 28 (10.9%) |
| 4.0x or more | 134 (61.8%) | 51 (19.8%) |
| Total | 217 (100.0%) | 257 (100.0%) |
Real Estate Taxes by Mortgage Status in Oriental
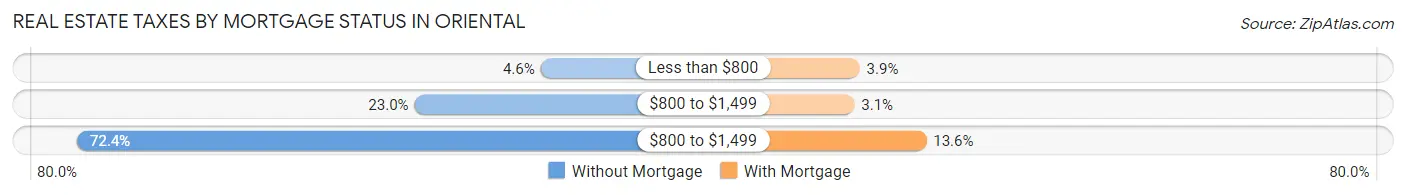
| Property Taxes | Without Mortgage | With Mortgage |
| Less than $800 | 10 (4.6%) | 10 (3.9%) |
| $800 to $1,499 | 50 (23.0%) | 8 (3.1%) |
| $800 to $1,499 | 157 (72.4%) | 35 (13.6%) |
| Total | 217 (100.0%) | 257 (100.0%) |
Health & Disability in Oriental
Health Insurance Coverage by Age in Oriental
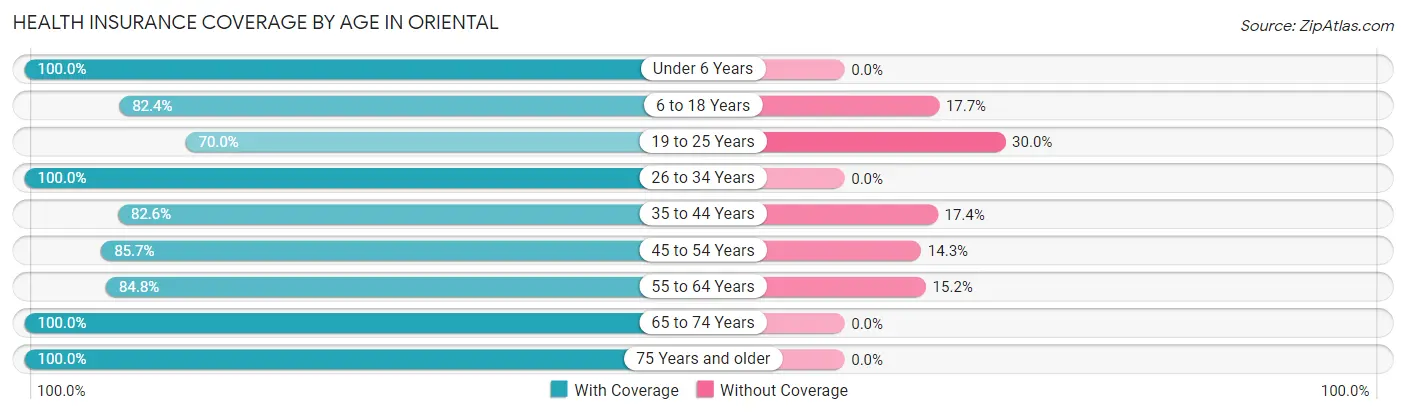
| Age Bracket | With Coverage | Without Coverage |
| Under 6 Years | 11 (100.0%) | 0 (0.0%) |
| 6 to 18 Years | 28 (82.4%) | 6 (17.6%) |
| 19 to 25 Years | 14 (70.0%) | 6 (30.0%) |
| 26 to 34 Years | 10 (100.0%) | 0 (0.0%) |
| 35 to 44 Years | 19 (82.6%) | 4 (17.4%) |
| 45 to 54 Years | 48 (85.7%) | 8 (14.3%) |
| 55 to 64 Years | 179 (84.8%) | 32 (15.2%) |
| 65 to 74 Years | 337 (100.0%) | 0 (0.0%) |
| 75 Years and older | 266 (100.0%) | 0 (0.0%) |
| Total | 912 (94.2%) | 56 (5.8%) |
Health Insurance Coverage by Citizenship Status in Oriental
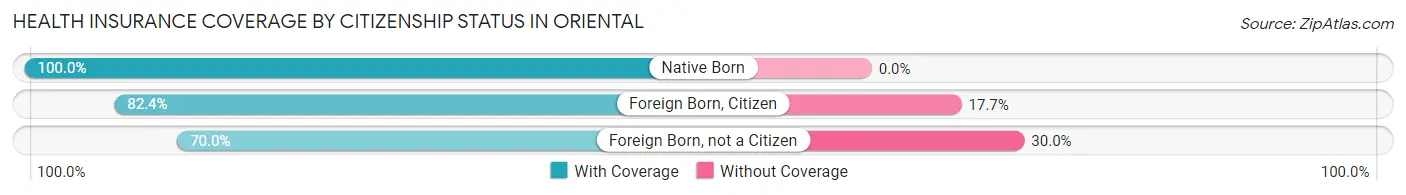
| Citizenship Status | With Coverage | Without Coverage |
| Native Born | 11 (100.0%) | 0 (0.0%) |
| Foreign Born, Citizen | 28 (82.4%) | 6 (17.6%) |
| Foreign Born, not a Citizen | 14 (70.0%) | 6 (30.0%) |
Health Insurance Coverage by Household Income in Oriental
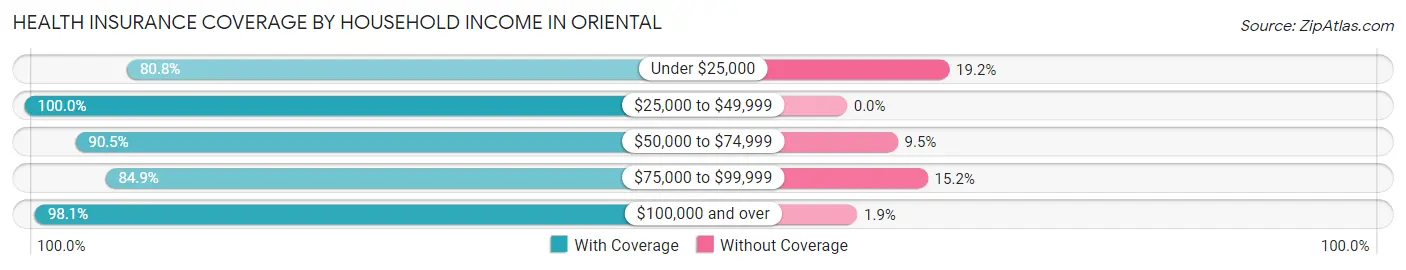
| Household Income | With Coverage | Without Coverage |
| Under $25,000 | 118 (80.8%) | 28 (19.2%) |
| $25,000 to $49,999 | 237 (100.0%) | 0 (0.0%) |
| $50,000 to $74,999 | 95 (90.5%) | 10 (9.5%) |
| $75,000 to $99,999 | 56 (84.9%) | 10 (15.1%) |
| $100,000 and over | 406 (98.1%) | 8 (1.9%) |
Public vs Private Health Insurance Coverage by Age in Oriental
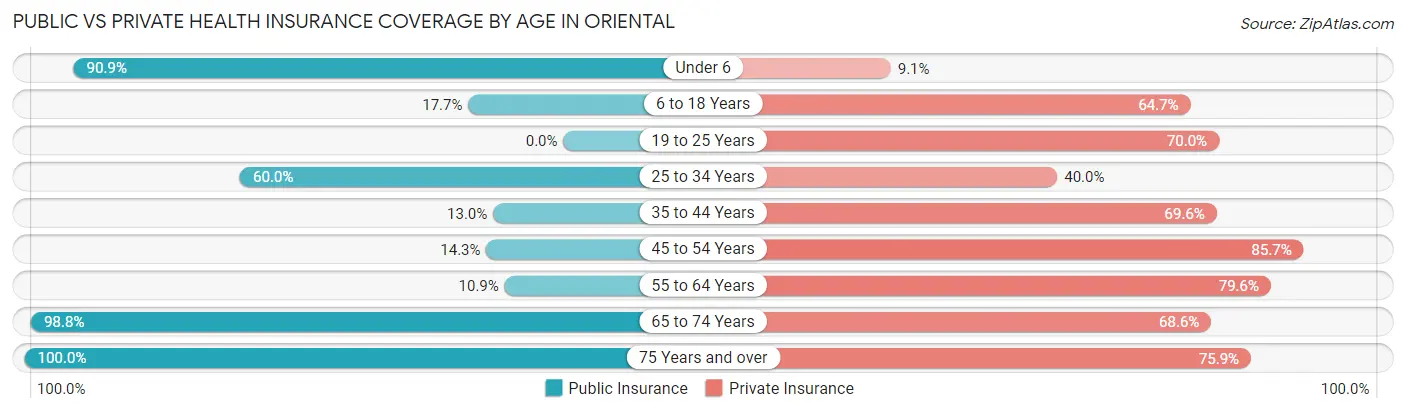
| Age Bracket | Public Insurance | Private Insurance |
| Under 6 | 10 (90.9%) | 1 (9.1%) |
| 6 to 18 Years | 6 (17.6%) | 22 (64.7%) |
| 19 to 25 Years | 0 (0.0%) | 14 (70.0%) |
| 25 to 34 Years | 6 (60.0%) | 4 (40.0%) |
| 35 to 44 Years | 3 (13.0%) | 16 (69.6%) |
| 45 to 54 Years | 8 (14.3%) | 48 (85.7%) |
| 55 to 64 Years | 23 (10.9%) | 168 (79.6%) |
| 65 to 74 Years | 333 (98.8%) | 231 (68.5%) |
| 75 Years and over | 266 (100.0%) | 202 (75.9%) |
| Total | 655 (67.7%) | 706 (72.9%) |
Disability Status by Sex by Age in Oriental
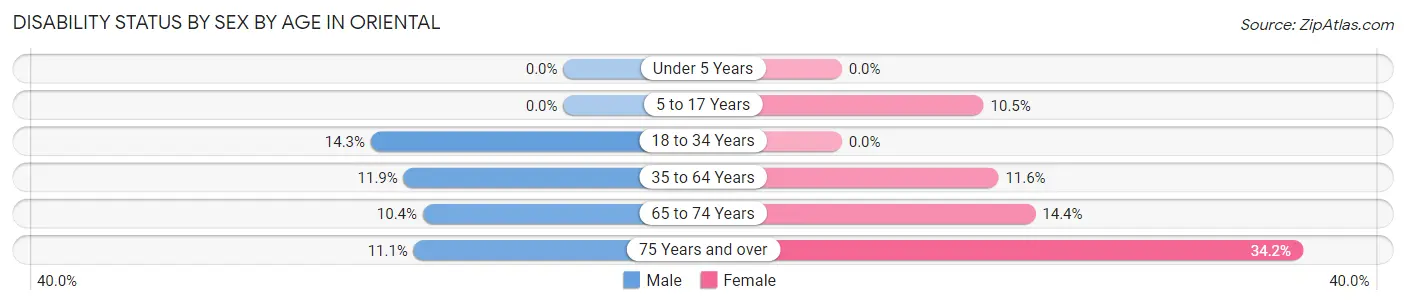
| Age Bracket | Male | Female |
| Under 5 Years | 0 (0.0%) | 0 (0.0%) |
| 5 to 17 Years | 0 (0.0%) | 2 (10.5%) |
| 18 to 34 Years | 3 (14.3%) | 0 (0.0%) |
| 35 to 64 Years | 14 (11.9%) | 20 (11.6%) |
| 65 to 74 Years | 17 (10.4%) | 25 (14.4%) |
| 75 Years and over | 13 (11.1%) | 51 (34.2%) |
Disability Class by Sex by Age in Oriental
Disability Class: Hearing Difficulty
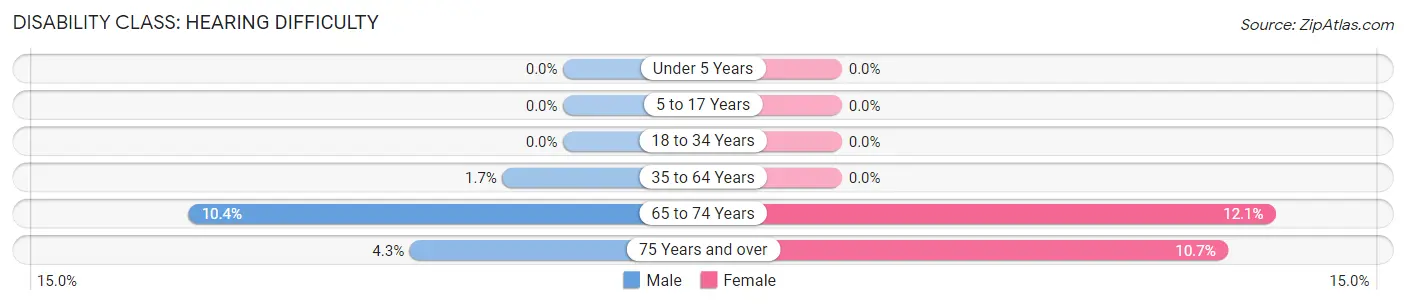
| Age Bracket | Male | Female |
| Under 5 Years | 0 (0.0%) | 0 (0.0%) |
| 5 to 17 Years | 0 (0.0%) | 0 (0.0%) |
| 18 to 34 Years | 0 (0.0%) | 0 (0.0%) |
| 35 to 64 Years | 2 (1.7%) | 0 (0.0%) |
| 65 to 74 Years | 17 (10.4%) | 21 (12.1%) |
| 75 Years and over | 5 (4.3%) | 16 (10.7%) |
Disability Class: Vision Difficulty
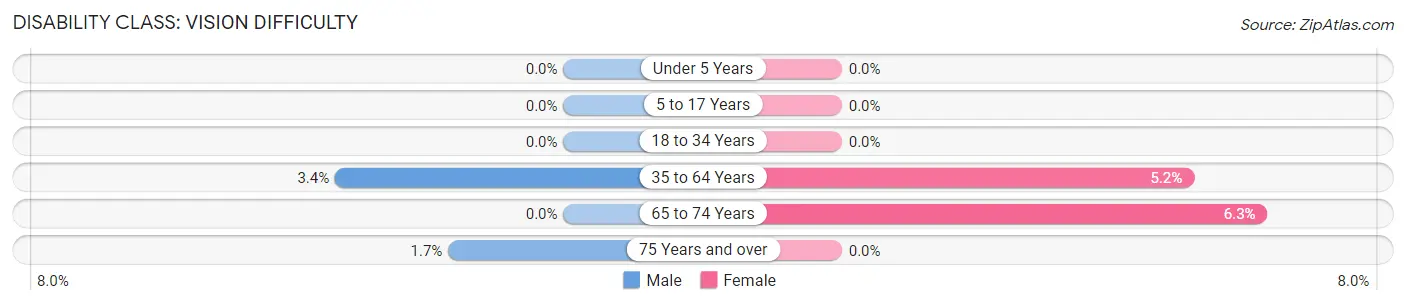
| Age Bracket | Male | Female |
| Under 5 Years | 0 (0.0%) | 0 (0.0%) |
| 5 to 17 Years | 0 (0.0%) | 0 (0.0%) |
| 18 to 34 Years | 0 (0.0%) | 0 (0.0%) |
| 35 to 64 Years | 4 (3.4%) | 9 (5.2%) |
| 65 to 74 Years | 0 (0.0%) | 11 (6.3%) |
| 75 Years and over | 2 (1.7%) | 0 (0.0%) |
Disability Class: Cognitive Difficulty
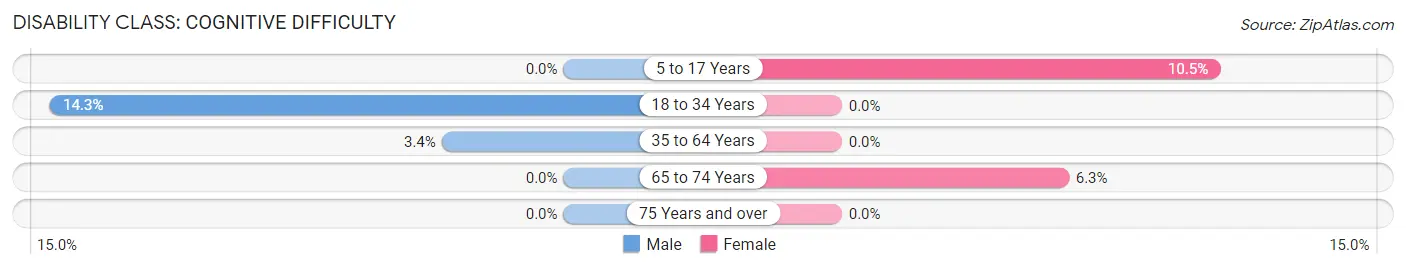
| Age Bracket | Male | Female |
| 5 to 17 Years | 0 (0.0%) | 2 (10.5%) |
| 18 to 34 Years | 3 (14.3%) | 0 (0.0%) |
| 35 to 64 Years | 4 (3.4%) | 0 (0.0%) |
| 65 to 74 Years | 0 (0.0%) | 11 (6.3%) |
| 75 Years and over | 0 (0.0%) | 0 (0.0%) |
Disability Class: Ambulatory Difficulty
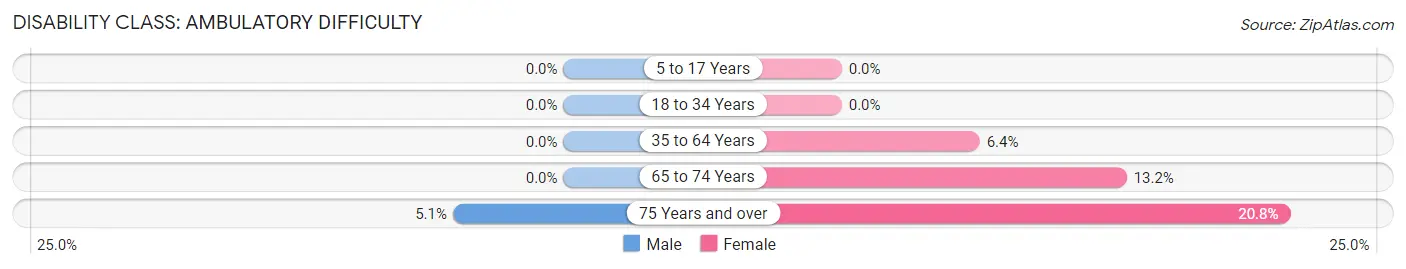
| Age Bracket | Male | Female |
| 5 to 17 Years | 0 (0.0%) | 0 (0.0%) |
| 18 to 34 Years | 0 (0.0%) | 0 (0.0%) |
| 35 to 64 Years | 0 (0.0%) | 11 (6.4%) |
| 65 to 74 Years | 0 (0.0%) | 23 (13.2%) |
| 75 Years and over | 6 (5.1%) | 31 (20.8%) |
Disability Class: Self-Care Difficulty
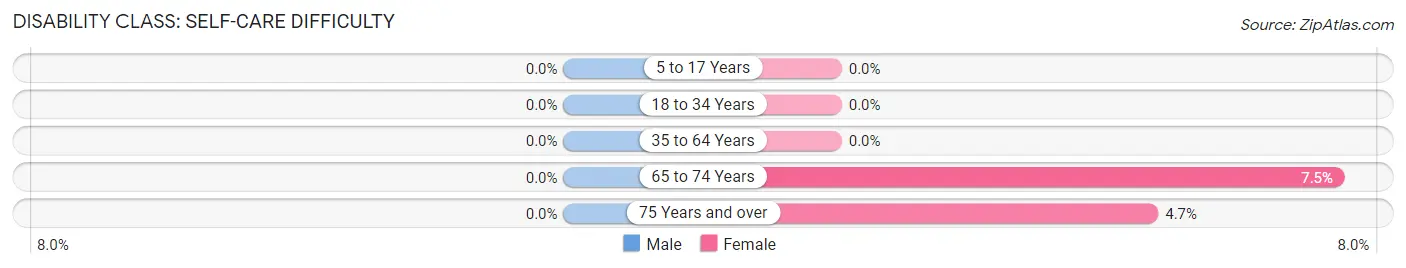
| Age Bracket | Male | Female |
| 5 to 17 Years | 0 (0.0%) | 0 (0.0%) |
| 18 to 34 Years | 0 (0.0%) | 0 (0.0%) |
| 35 to 64 Years | 0 (0.0%) | 0 (0.0%) |
| 65 to 74 Years | 0 (0.0%) | 13 (7.5%) |
| 75 Years and over | 0 (0.0%) | 7 (4.7%) |
Technology Access in Oriental
Computing Device Access in Oriental
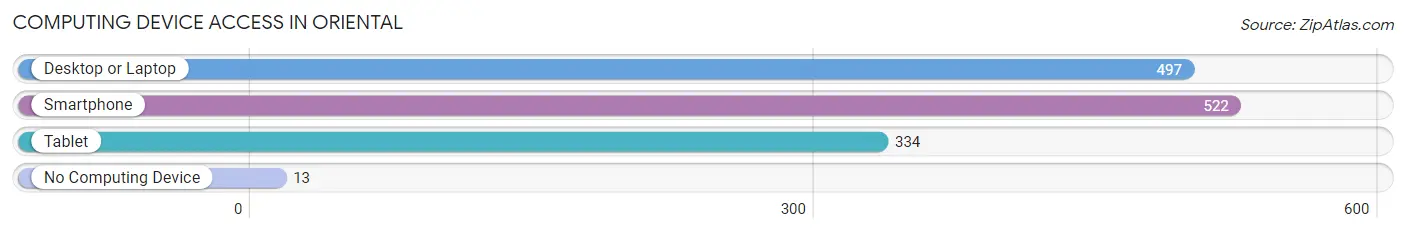
| Device Type | # Households | % Households |
| Desktop or Laptop | 497 | 87.0% |
| Smartphone | 522 | 91.4% |
| Tablet | 334 | 58.5% |
| No Computing Device | 13 | 2.3% |
| Total | 571 | 100.0% |
Internet Access in Oriental
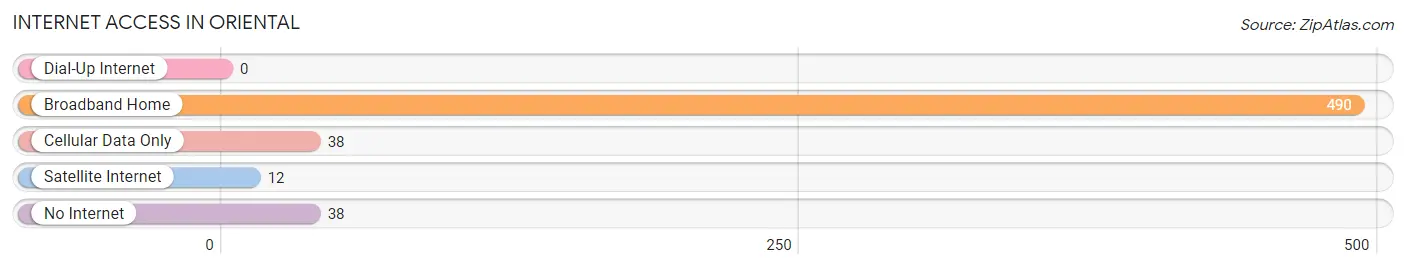
| Internet Type | # Households | % Households |
| Dial-Up Internet | 0 | 0.0% |
| Broadband Home | 490 | 85.8% |
| Cellular Data Only | 38 | 6.7% |
| Satellite Internet | 12 | 2.1% |
| No Internet | 38 | 6.7% |
| Total | 571 | 100.0% |
Oriental Summary
Oriental, North Carolina is a small town located in Pamlico County, North Carolina. It is situated on the banks of the Neuse River, approximately 30 miles from New Bern, the county seat. The town has a population of approximately 900 people and is known as the “Sailing Capital of North Carolina” due to its large number of marinas and sailing clubs.
Geography
Oriental is located in the coastal plain region of North Carolina, which is characterized by flat terrain and sandy soils. The town is situated on the banks of the Neuse River, which is the longest river in the state. The Neuse River is a major source of recreation for the town, with many marinas and sailing clubs located along its banks. The town is also located near the Pamlico Sound, which is a large body of water that separates the mainland from the Outer Banks.
The town is located in a humid subtropical climate zone, which is characterized by hot, humid summers and mild winters. The average temperature in the summer is around 80 degrees Fahrenheit, while the average temperature in the winter is around 50 degrees Fahrenheit. The town receives an average of 48 inches of precipitation per year, with most of it falling in the summer months.
Economy
Oriental’s economy is largely based on tourism and recreation. The town is home to several marinas and sailing clubs, which attract visitors from all over the world. The town also has a number of restaurants, shops, and other businesses that cater to tourists. In addition, the town is home to a number of boat builders and marine supply stores.
The town is also home to a number of small businesses, including a grocery store, a hardware store, and a pharmacy. The town also has a number of art galleries and antique stores.
Demographics
As of the 2010 census, the population of Oriental was 895 people. The racial makeup of the town was 94.3% White, 2.2% African American, 0.7% Native American, 0.7% Asian, 0.2% Pacific Islander, and 1.9% from other races. The median household income was $37,500, and the median family income was $45,000.
Conclusion
Oriental, North Carolina is a small town located in Pamlico County, North Carolina. It is situated on the banks of the Neuse River and is known as the “Sailing Capital of North Carolina” due to its large number of marinas and sailing clubs. The town has a population of approximately 900 people and is home to a number of businesses that cater to tourists. The town’s economy is largely based on tourism and recreation, and the town is home to a number of small businesses. The racial makeup of the town is 94.3% White, 2.2% African American, 0.7% Native American, 0.7% Asian, 0.2% Pacific Islander, and 1.9% from other races. The median household income was $37,500, and the median family income was $45,000.
Common Questions
What is Per Capita Income in Oriental?
Per Capita income in Oriental is $45,274.
What is the Median Family Income in Oriental?
Median Family Income in Oriental is $101,161.
What is the Median Household income in Oriental?
Median Household Income in Oriental is $51,563.
What is Income or Wage Gap in Oriental?
Income or Wage Gap in Oriental is 26.6%.
Women in Oriental earn 73.4 cents for every dollar earned by a man.
What is Inequality or Gini Index in Oriental?
Inequality or Gini Index in Oriental is 0.46.
What is the Total Population of Oriental?
Total Population of Oriental is 968.
What is the Total Male Population of Oriental?
Total Male Population of Oriental is 431.
What is the Total Female Population of Oriental?
Total Female Population of Oriental is 537.
What is the Ratio of Males per 100 Females in Oriental?
There are 80.26 Males per 100 Females in Oriental.
What is the Ratio of Females per 100 Males in Oriental?
There are 124.59 Females per 100 Males in Oriental.
What is the Median Population Age in Oriental?
Median Population Age in Oriental is 68.7 Years.
What is the Average Family Size in Oriental
Average Family Size in Oriental is 2.1 People.
What is the Average Household Size in Oriental
Average Household Size in Oriental is 1.7 People.
How Large is the Labor Force in Oriental?
There are 240 People in the Labor Forcein in Oriental.
What is the Percentage of People in the Labor Force in Oriental?
25.9% of People are in the Labor Force in Oriental.
What is the Unemployment Rate in Oriental?
Unemployment Rate in Oriental is 1.3%.