Valley Hill, NC Map & Demographics
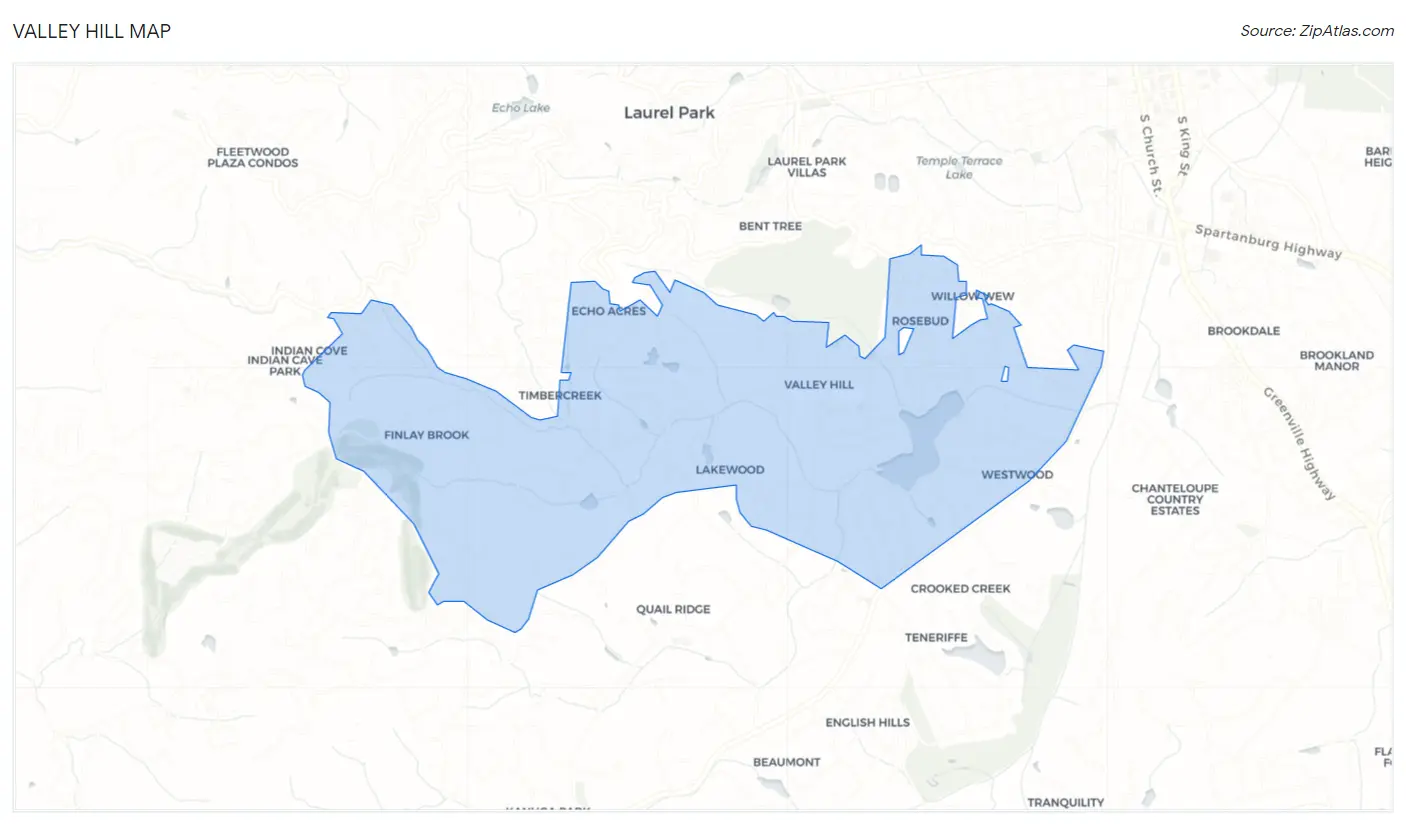
Valley Hill Map
Valley Hill Overview
$41,681
PER CAPITA INCOME
$95,855
AVG FAMILY INCOME
$82,436
AVG HOUSEHOLD INCOME
54.3%
WAGE / INCOME GAP [ % ]
45.7¢/ $1
WAGE / INCOME GAP [ $ ]
0.39
INEQUALITY / GINI INDEX
2,417
TOTAL POPULATION
1,109
MALE POPULATION
1,308
FEMALE POPULATION
84.79
MALES / 100 FEMALES
117.94
FEMALES / 100 MALES
47.7
MEDIAN AGE
2.7
AVG FAMILY SIZE
2.4
AVG HOUSEHOLD SIZE
1,225
LABOR FORCE [ PEOPLE ]
62.2%
PERCENT IN LABOR FORCE
Income in Valley Hill
Income Overview in Valley Hill
Per Capita Income in Valley Hill is $41,681, while median incomes of families and households are $95,855 and $82,436 respectively.
| Characteristic | Number | Measure |
| Per Capita Income | 2,417 | $41,681 |
| Median Family Income | 743 | $95,855 |
| Mean Family Income | 743 | $111,671 |
| Median Household Income | 1,011 | $82,436 |
| Mean Household Income | 1,011 | $101,631 |
| Income Deficit | 743 | $0 |
| Wage / Income Gap (%) | 2,417 | 54.26% |
| Wage / Income Gap ($) | 2,417 | 45.74¢ per $1 |
| Gini / Inequality Index | 2,417 | 0.39 |
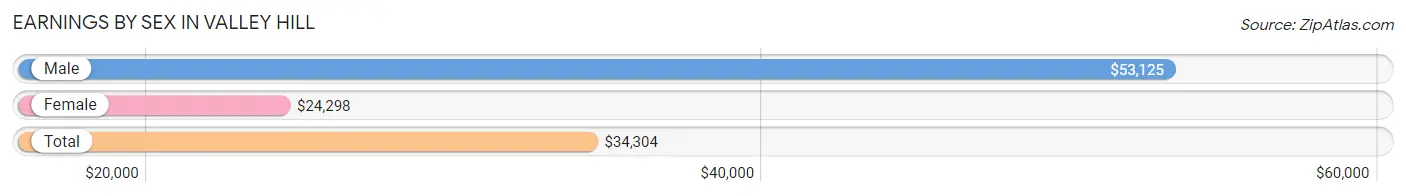
Earnings by Sex in Valley Hill
Average Earnings in Valley Hill are $34,304, $53,125 for men and $24,298 for women, a difference of 54.3%.
| Sex | Number | Average Earnings |
| Male | 683 (53.8%) | $53,125 |
| Female | 586 (46.2%) | $24,298 |
| Total | 1,269 (100.0%) | $34,304 |
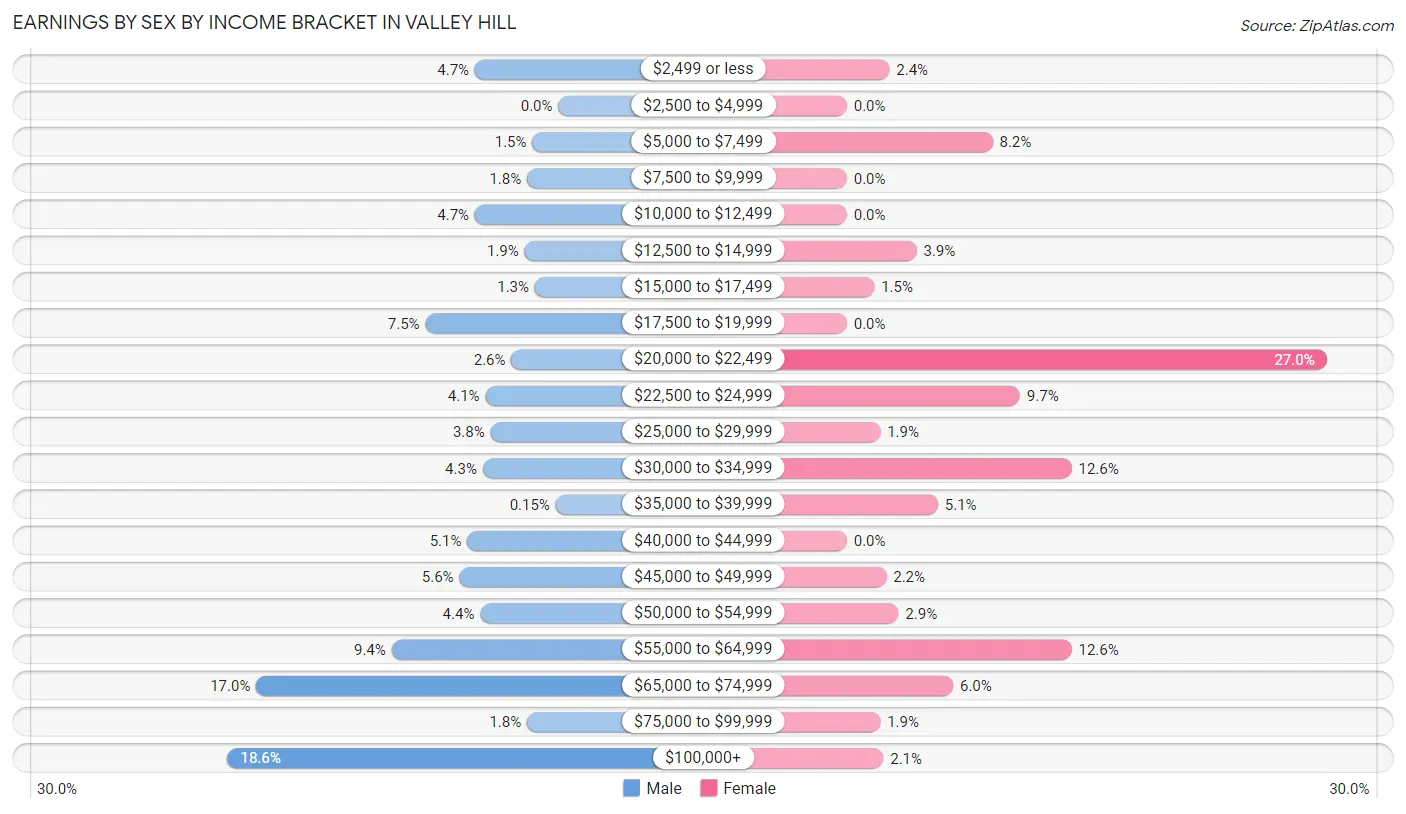
Earnings by Sex by Income Bracket in Valley Hill
The most common earnings brackets in Valley Hill are $100,000+ for men (127 | 18.6%) and $20,000 to $22,499 for women (158 | 27.0%).
| Income | Male | Female |
| $2,499 or less | 32 (4.7%) | 14 (2.4%) |
| $2,500 to $4,999 | 0 (0.0%) | 0 (0.0%) |
| $5,000 to $7,499 | 10 (1.5%) | 48 (8.2%) |
| $7,500 to $9,999 | 12 (1.8%) | 0 (0.0%) |
| $10,000 to $12,499 | 32 (4.7%) | 0 (0.0%) |
| $12,500 to $14,999 | 13 (1.9%) | 23 (3.9%) |
| $15,000 to $17,499 | 9 (1.3%) | 9 (1.5%) |
| $17,500 to $19,999 | 51 (7.5%) | 0 (0.0%) |
| $20,000 to $22,499 | 18 (2.6%) | 158 (27.0%) |
| $22,500 to $24,999 | 28 (4.1%) | 57 (9.7%) |
| $25,000 to $29,999 | 26 (3.8%) | 11 (1.9%) |
| $30,000 to $34,999 | 29 (4.3%) | 74 (12.6%) |
| $35,000 to $39,999 | 1 (0.2%) | 30 (5.1%) |
| $40,000 to $44,999 | 35 (5.1%) | 0 (0.0%) |
| $45,000 to $49,999 | 38 (5.6%) | 13 (2.2%) |
| $50,000 to $54,999 | 30 (4.4%) | 17 (2.9%) |
| $55,000 to $64,999 | 64 (9.4%) | 74 (12.6%) |
| $65,000 to $74,999 | 116 (17.0%) | 35 (6.0%) |
| $75,000 to $99,999 | 12 (1.8%) | 11 (1.9%) |
| $100,000+ | 127 (18.6%) | 12 (2.1%) |
| Total | 683 (100.0%) | 586 (100.0%) |
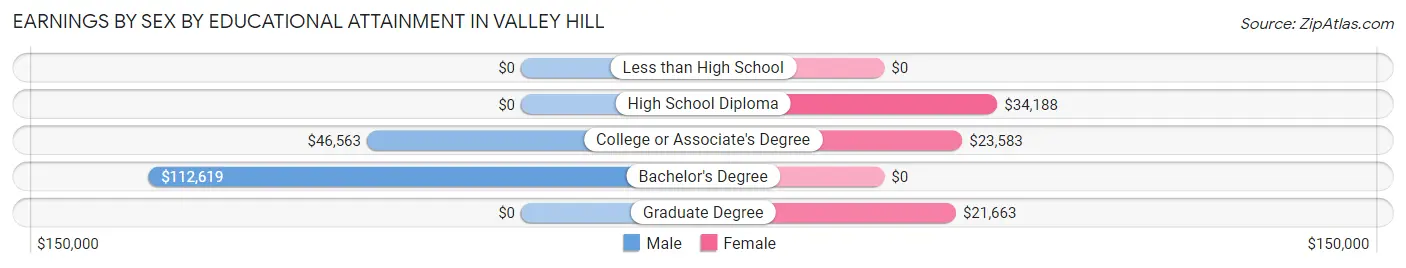
Earnings by Sex by Educational Attainment in Valley Hill
Average earnings in Valley Hill are $55,114 for men and $27,727 for women, a difference of 49.7%. Men with an educational attainment of bachelor's degree enjoy the highest average annual earnings of $112,619, while those with college or associate's degree education earn the least with $46,563. Women with an educational attainment of high school diploma earn the most with the average annual earnings of $34,188, while those with graduate degree education have the smallest earnings of $21,663.
| Educational Attainment | Male Income | Female Income |
| Less than High School | - | - |
| High School Diploma | - | - |
| College or Associate's Degree | $46,563 | $23,583 |
| Bachelor's Degree | $112,619 | $0 |
| Graduate Degree | - | - |
| Total | $55,114 | $27,727 |
Family Income in Valley Hill
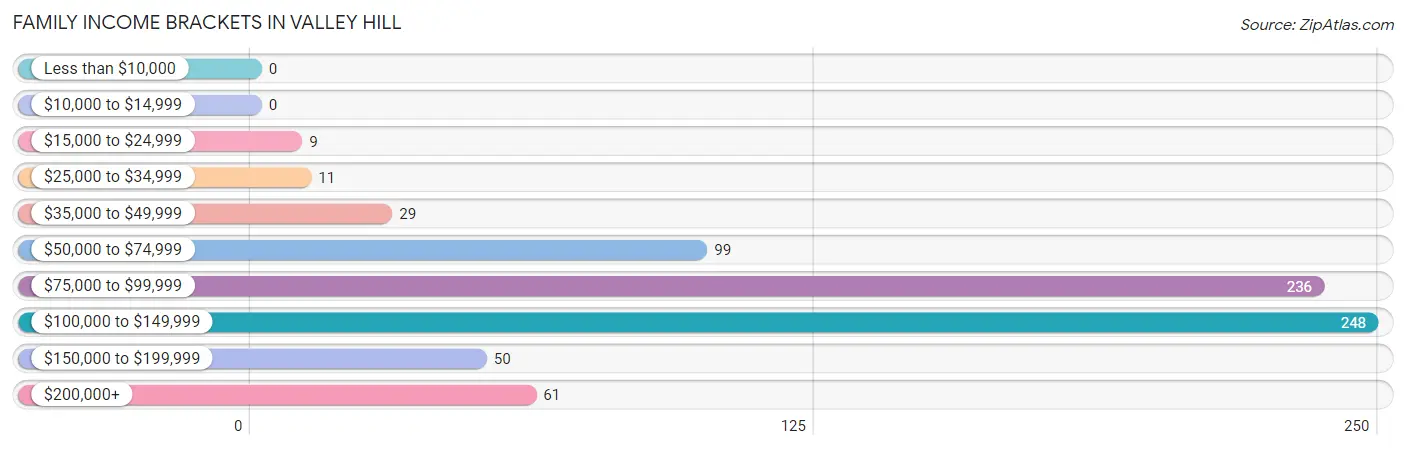
Family Income Brackets in Valley Hill
According to the Valley Hill family income data, there are 248 families falling into the $100,000 to $149,999 income range, which is the most common income bracket and makes up 33.4% of all families.
| Income Bracket | # Families | % Families |
| Less than $10,000 | 0 | 0.0% |
| $10,000 to $14,999 | 0 | 0.0% |
| $15,000 to $24,999 | 9 | 1.2% |
| $25,000 to $34,999 | 11 | 1.5% |
| $35,000 to $49,999 | 29 | 3.9% |
| $50,000 to $74,999 | 99 | 13.3% |
| $75,000 to $99,999 | 236 | 31.8% |
| $100,000 to $149,999 | 248 | 33.4% |
| $150,000 to $199,999 | 50 | 6.7% |
| $200,000+ | 61 | 8.2% |
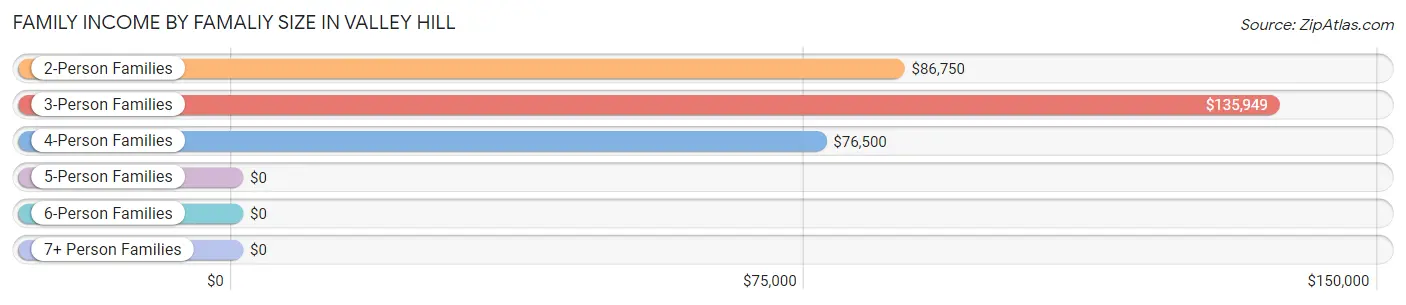
Family Income by Famaliy Size in Valley Hill
3-person families (170 | 22.9%) account for the highest median family income in Valley Hill with $135,949 per family, while 3-person families (170 | 22.9%) have the highest median income of $45,316 per family member.
| Income Bracket | # Families | Median Income |
| 2-Person Families | 438 (59.0%) | $86,750 |
| 3-Person Families | 170 (22.9%) | $135,949 |
| 4-Person Families | 66 (8.9%) | $76,500 |
| 5-Person Families | 32 (4.3%) | $0 |
| 6-Person Families | 37 (5.0%) | $0 |
| 7+ Person Families | 0 (0.0%) | $0 |
| Total | 743 (100.0%) | $95,855 |
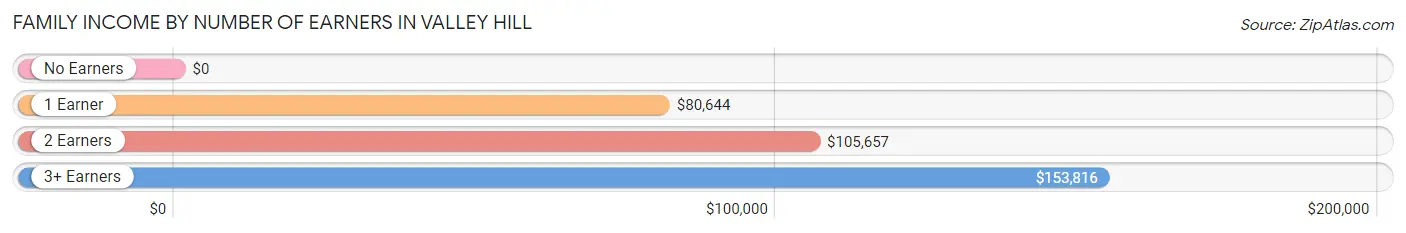
Family Income by Number of Earners in Valley Hill
| Number of Earners | # Families | Median Income |
| No Earners | 92 (12.4%) | $0 |
| 1 Earner | 246 (33.1%) | $80,644 |
| 2 Earners | 363 (48.9%) | $105,657 |
| 3+ Earners | 42 (5.7%) | $153,816 |
| Total | 743 (100.0%) | $95,855 |
Household Income in Valley Hill
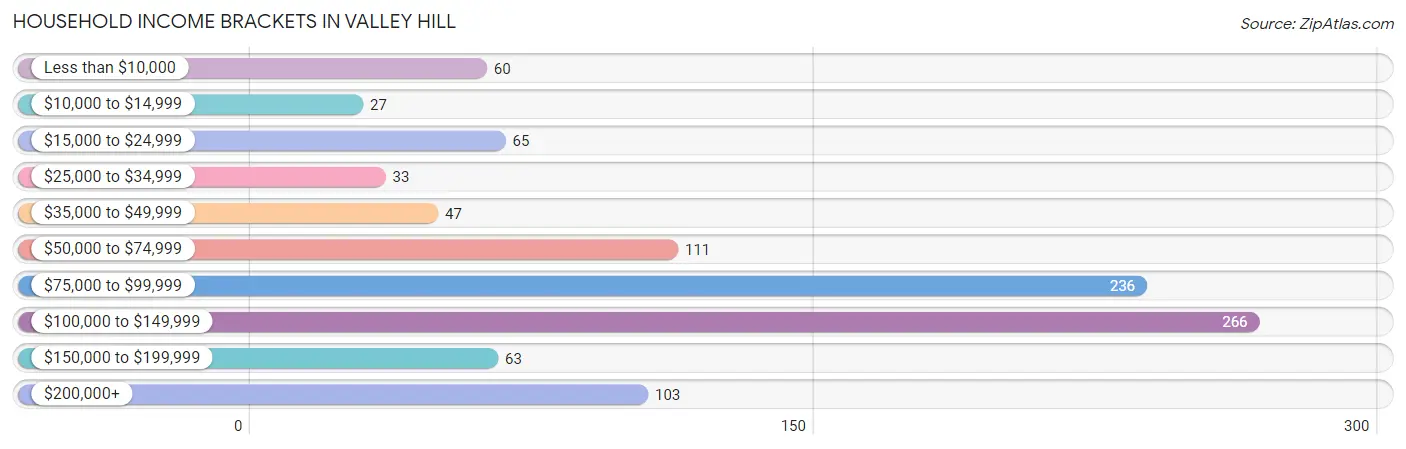
Household Income Brackets in Valley Hill
With 266 households falling in the category, the $100,000 to $149,999 income range is the most frequent in Valley Hill, accounting for 26.3% of all households. In contrast, only 27 households (2.7%) fall into the $10,000 to $14,999 income bracket, making it the least populous group.
| Income Bracket | # Households | % Households |
| Less than $10,000 | 60 | 5.9% |
| $10,000 to $14,999 | 27 | 2.7% |
| $15,000 to $24,999 | 65 | 6.4% |
| $25,000 to $34,999 | 33 | 3.3% |
| $35,000 to $49,999 | 47 | 4.6% |
| $50,000 to $74,999 | 111 | 11.0% |
| $75,000 to $99,999 | 236 | 23.3% |
| $100,000 to $149,999 | 266 | 26.3% |
| $150,000 to $199,999 | 63 | 6.2% |
| $200,000+ | 103 | 10.2% |
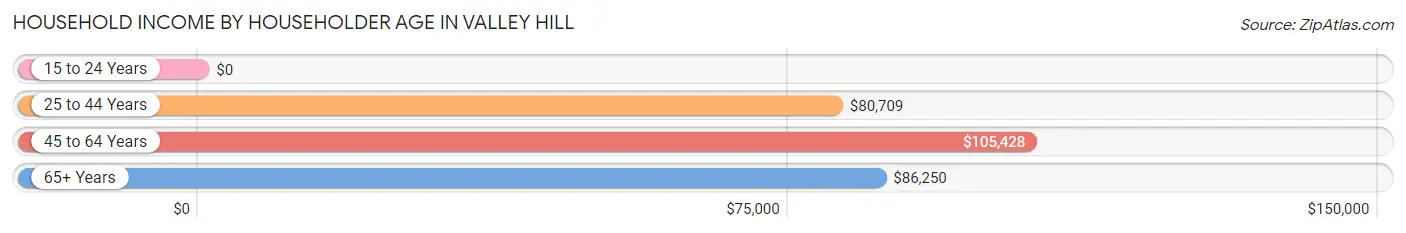
Household Income by Householder Age in Valley Hill
The median household income in Valley Hill is $82,436, with the highest median household income of $105,428 found in the 45 to 64 years age bracket for the primary householder. A total of 373 households (36.9%) fall into this category. Meanwhile, the 15 to 24 years age bracket for the primary householder has the lowest median household income of $0, with 13 households (1.3%) in this group.
| Income Bracket | # Households | Median Income |
| 15 to 24 Years | 13 (1.3%) | $0 |
| 25 to 44 Years | 321 (31.8%) | $80,709 |
| 45 to 64 Years | 373 (36.9%) | $105,428 |
| 65+ Years | 304 (30.1%) | $86,250 |
| Total | 1,011 (100.0%) | $82,436 |
Poverty in Valley Hill
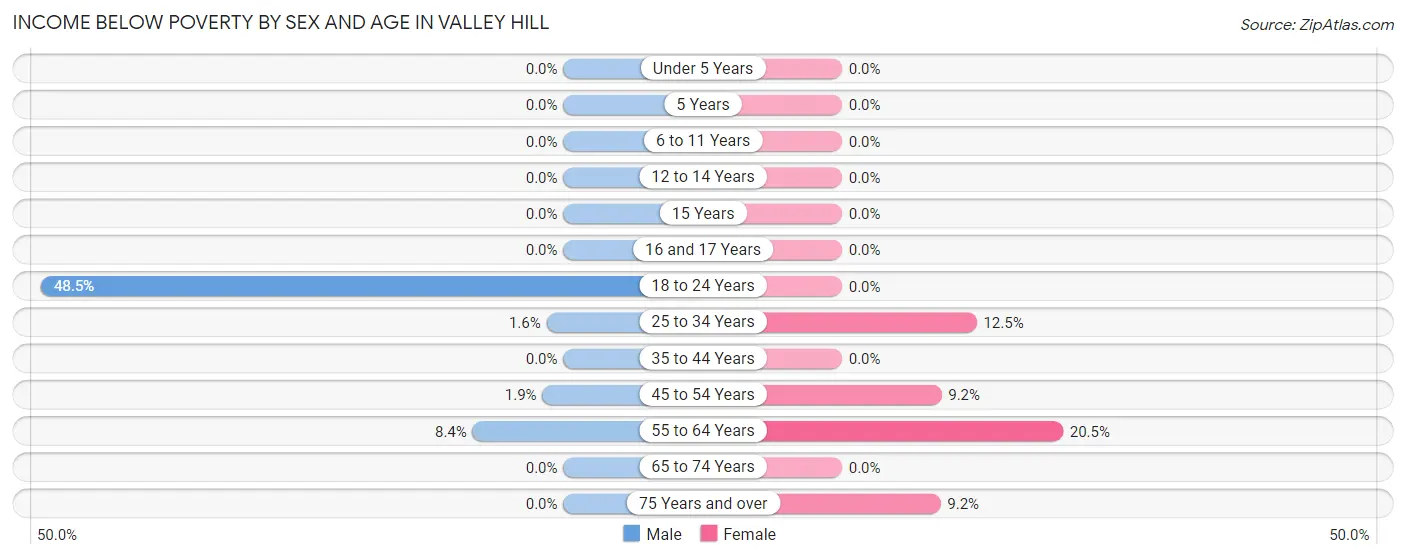
Income Below Poverty by Sex and Age in Valley Hill
With 5.5% poverty level for males and 6.9% for females among the residents of Valley Hill, 18 to 24 year old males and 55 to 64 year old females are the most vulnerable to poverty, with 32 males (48.5%) and 48 females (20.5%) in their respective age groups living below the poverty level.
| Age Bracket | Male | Female |
| Under 5 Years | 0 (0.0%) | 0 (0.0%) |
| 5 Years | 0 (0.0%) | 0 (0.0%) |
| 6 to 11 Years | 0 (0.0%) | 0 (0.0%) |
| 12 to 14 Years | 0 (0.0%) | 0 (0.0%) |
| 15 Years | 0 (0.0%) | 0 (0.0%) |
| 16 and 17 Years | 0 (0.0%) | 0 (0.0%) |
| 18 to 24 Years | 32 (48.5%) | 0 (0.0%) |
| 25 to 34 Years | 2 (1.6%) | 14 (12.5%) |
| 35 to 44 Years | 0 (0.0%) | 0 (0.0%) |
| 45 to 54 Years | 2 (1.9%) | 12 (9.2%) |
| 55 to 64 Years | 25 (8.4%) | 48 (20.5%) |
| 65 to 74 Years | 0 (0.0%) | 0 (0.0%) |
| 75 Years and over | 0 (0.0%) | 14 (9.1%) |
| Total | 61 (5.5%) | 88 (6.9%) |
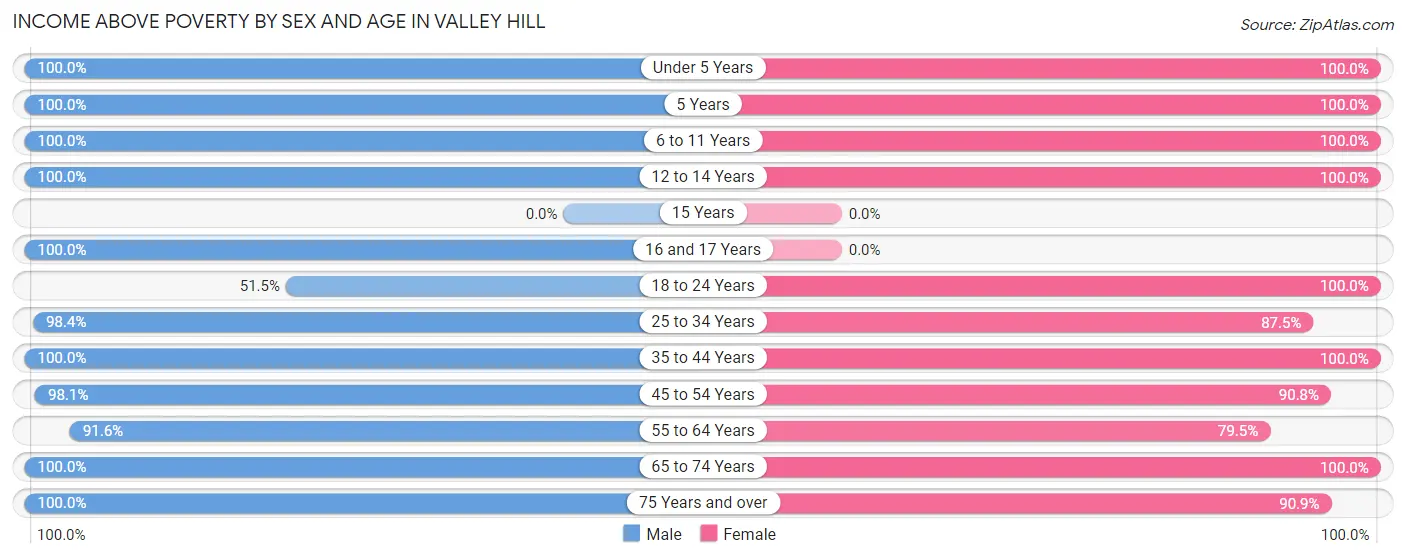
Income Above Poverty by Sex and Age in Valley Hill
According to the poverty statistics in Valley Hill, males aged under 5 years and females aged under 5 years are the age groups that are most secure financially, with 100.0% of males and 100.0% of females in these age groups living above the poverty line.
| Age Bracket | Male | Female |
| Under 5 Years | 111 (100.0%) | 117 (100.0%) |
| 5 Years | 11 (100.0%) | 13 (100.0%) |
| 6 to 11 Years | 45 (100.0%) | 95 (100.0%) |
| 12 to 14 Years | 27 (100.0%) | 28 (100.0%) |
| 15 Years | 0 (0.0%) | 0 (0.0%) |
| 16 and 17 Years | 10 (100.0%) | 0 (0.0%) |
| 18 to 24 Years | 34 (51.5%) | 48 (100.0%) |
| 25 to 34 Years | 126 (98.4%) | 98 (87.5%) |
| 35 to 44 Years | 83 (100.0%) | 210 (100.0%) |
| 45 to 54 Years | 101 (98.1%) | 118 (90.8%) |
| 55 to 64 Years | 272 (91.6%) | 186 (79.5%) |
| 65 to 74 Years | 100 (100.0%) | 136 (100.0%) |
| 75 Years and over | 128 (100.0%) | 139 (90.8%) |
| Total | 1,048 (94.5%) | 1,188 (93.1%) |
Income Below Poverty Among Married-Couple Families in Valley Hill
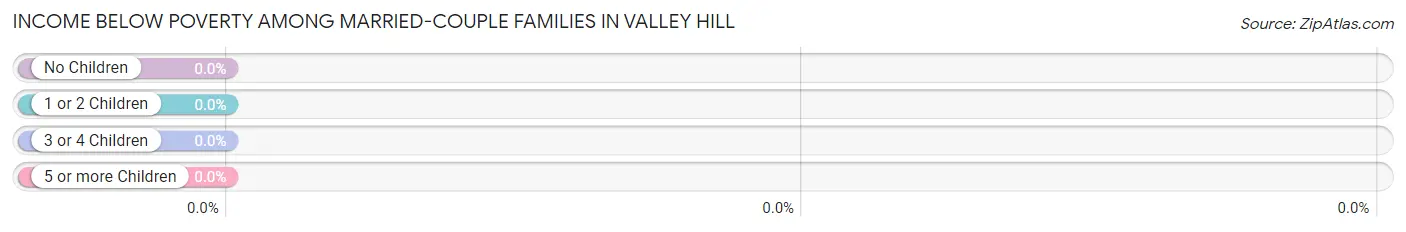
| Children | Above Poverty | Below Poverty |
| No Children | 423 (100.0%) | 0 (0.0%) |
| 1 or 2 Children | 215 (100.0%) | 0 (0.0%) |
| 3 or 4 Children | 50 (100.0%) | 0 (0.0%) |
| 5 or more Children | 0 (0.0%) | 0 (0.0%) |
| Total | 688 (100.0%) | 0 (0.0%) |
Income Below Poverty Among Single-Parent Households in Valley Hill
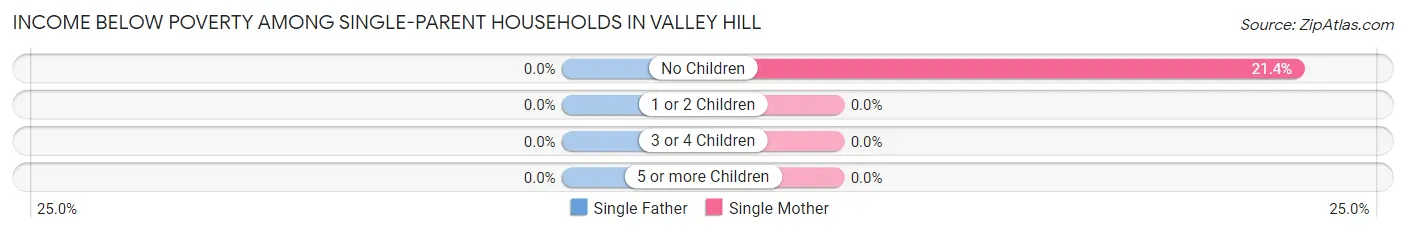
| Children | Single Father | Single Mother |
| No Children | 0 (0.0%) | 9 (21.4%) |
| 1 or 2 Children | 0 (0.0%) | 0 (0.0%) |
| 3 or 4 Children | 0 (0.0%) | 0 (0.0%) |
| 5 or more Children | 0 (0.0%) | 0 (0.0%) |
| Total | 0 (0.0%) | 9 (16.4%) |
Income Below Poverty Among Married-Couple vs Single-Parent Households in Valley Hill
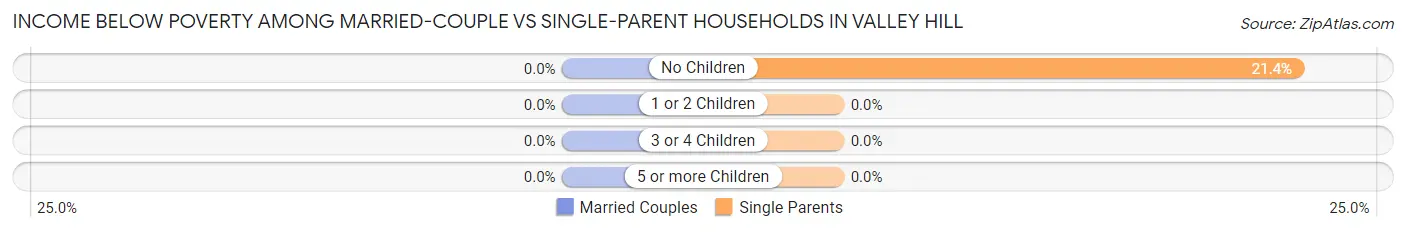
| Children | Married-Couple Families | Single-Parent Households |
| No Children | 0 (0.0%) | 9 (21.4%) |
| 1 or 2 Children | 0 (0.0%) | 0 (0.0%) |
| 3 or 4 Children | 0 (0.0%) | 0 (0.0%) |
| 5 or more Children | 0 (0.0%) | 0 (0.0%) |
| Total | 0 (0.0%) | 9 (16.4%) |
Race in Valley Hill
The most populous races in Valley Hill are White / Caucasian (2,274 | 94.1%), Hispanic or Latino (284 | 11.7%), and Two or more Races (116 | 4.8%).
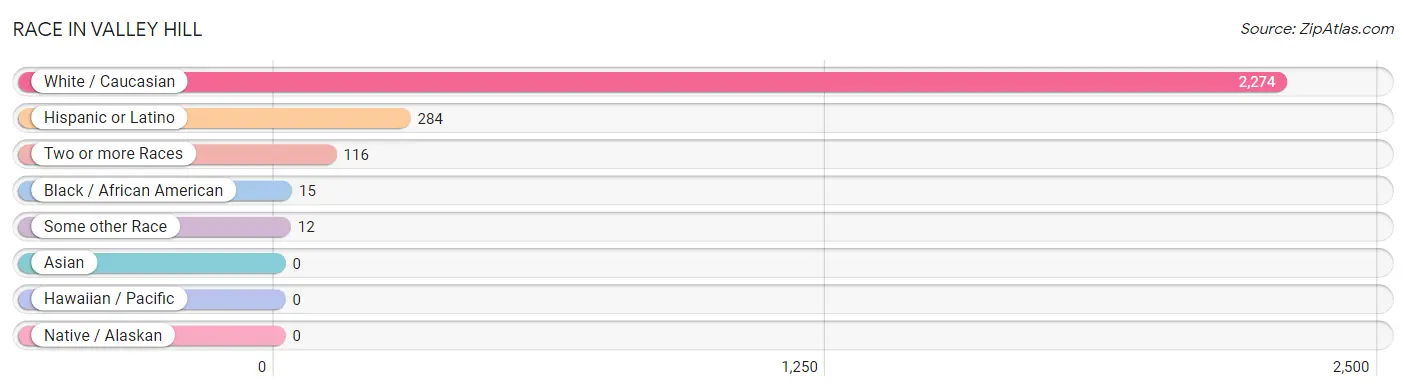
| Race | # Population | % Population |
| Asian | 0 | 0.0% |
| Black / African American | 15 | 0.6% |
| Hawaiian / Pacific | 0 | 0.0% |
| Hispanic or Latino | 284 | 11.7% |
| Native / Alaskan | 0 | 0.0% |
| White / Caucasian | 2,274 | 94.1% |
| Two or more Races | 116 | 4.8% |
| Some other Race | 12 | 0.5% |
| Total | 2,417 | 100.0% |
Ancestry in Valley Hill
The most populous ancestries reported in Valley Hill are English (477 | 19.7%), American (404 | 16.7%), Mexican (239 | 9.9%), Irish (234 | 9.7%), and European (174 | 7.2%), together accounting for 63.2% of all Valley Hill residents.
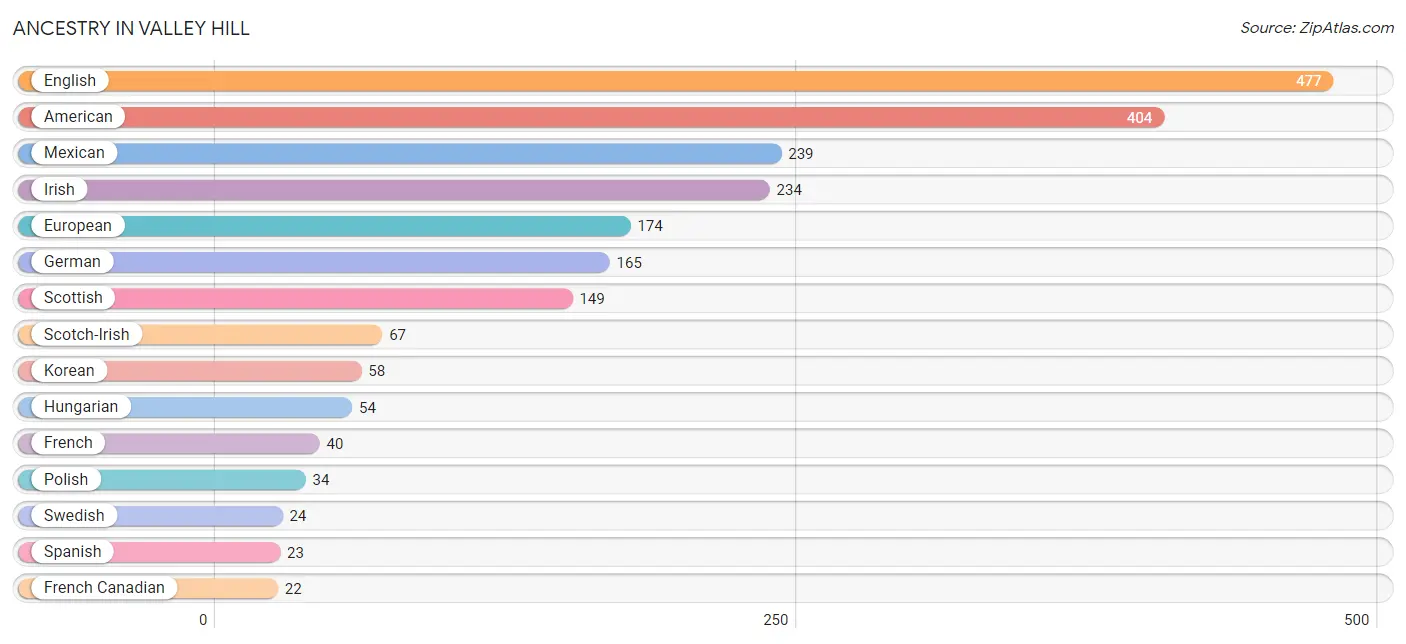
| Ancestry | # Population | % Population |
| African | 1 | 0.0% |
| American | 404 | 16.7% |
| Austrian | 7 | 0.3% |
| Cherokee | 13 | 0.5% |
| Cuban | 7 | 0.3% |
| Danish | 8 | 0.3% |
| Dutch | 12 | 0.5% |
| English | 477 | 19.7% |
| European | 174 | 7.2% |
| Finnish | 7 | 0.3% |
| French | 40 | 1.7% |
| French Canadian | 22 | 0.9% |
| German | 165 | 6.8% |
| Hungarian | 54 | 2.2% |
| Irish | 234 | 9.7% |
| Italian | 19 | 0.8% |
| Korean | 58 | 2.4% |
| Mexican | 239 | 9.9% |
| Norwegian | 15 | 0.6% |
| Polish | 34 | 1.4% |
| Scotch-Irish | 67 | 2.8% |
| Scottish | 149 | 6.2% |
| Slovak | 18 | 0.7% |
| South American | 15 | 0.6% |
| Spanish | 23 | 0.9% |
| Subsaharan African | 1 | 0.0% |
| Swedish | 24 | 1.0% |
| Venezuelan | 15 | 0.6% |
| Welsh | 21 | 0.9% | View All 29 Rows |
Immigrants in Valley Hill
The most numerous immigrant groups reported in Valley Hill came from Eastern Europe (39 | 1.6%), Europe (39 | 1.6%), Hungary (39 | 1.6%), Latin America (15 | 0.6%), and South America (15 | 0.6%), together accounting for 6.1% of all Valley Hill residents.
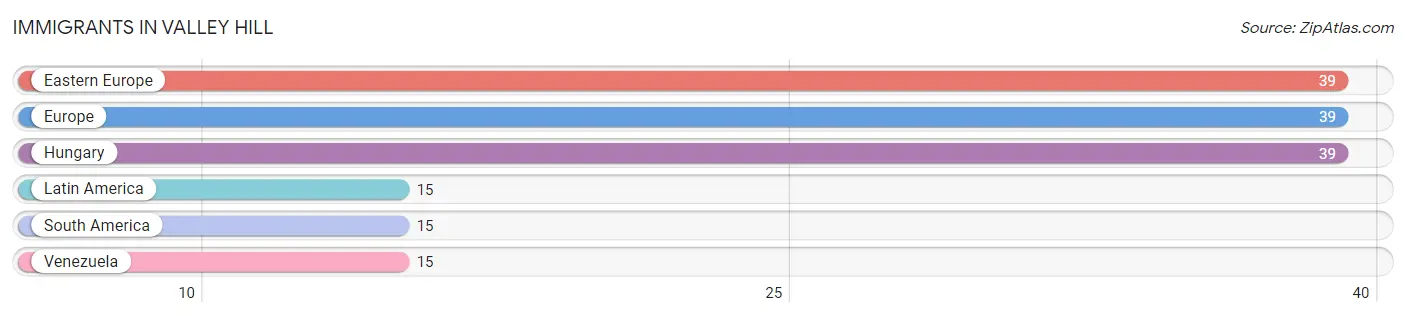
| Immigration Origin | # Population | % Population |
| Eastern Europe | 39 | 1.6% |
| Europe | 39 | 1.6% |
| Hungary | 39 | 1.6% |
| Latin America | 15 | 0.6% |
| South America | 15 | 0.6% |
| Venezuela | 15 | 0.6% | View All 6 Rows |
Sex and Age in Valley Hill
Sex and Age in Valley Hill
The most populous age groups in Valley Hill are 60 to 64 Years (160 | 14.4%) for men and 55 to 59 Years (199 | 15.2%) for women.
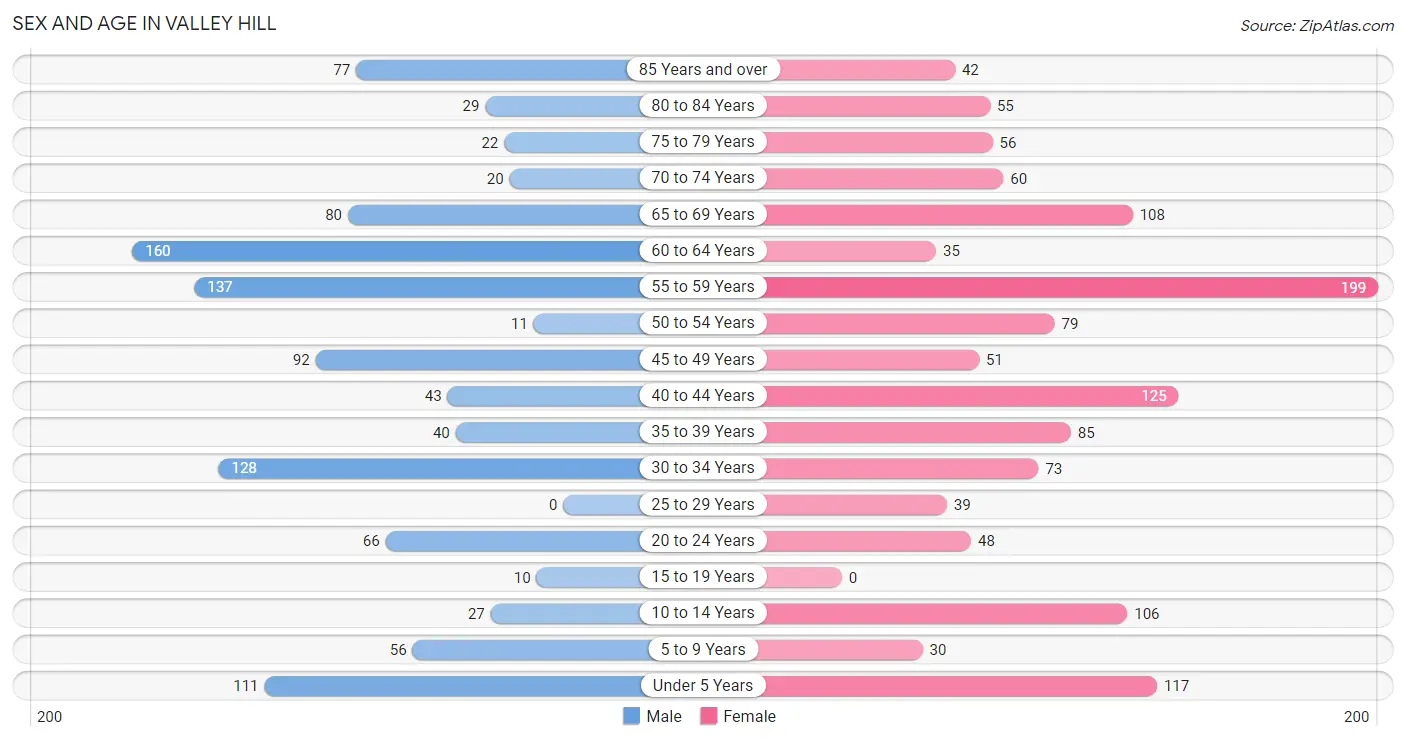
| Age Bracket | Male | Female |
| Under 5 Years | 111 (10.0%) | 117 (8.9%) |
| 5 to 9 Years | 56 (5.1%) | 30 (2.3%) |
| 10 to 14 Years | 27 (2.4%) | 106 (8.1%) |
| 15 to 19 Years | 10 (0.9%) | 0 (0.0%) |
| 20 to 24 Years | 66 (5.9%) | 48 (3.7%) |
| 25 to 29 Years | 0 (0.0%) | 39 (3.0%) |
| 30 to 34 Years | 128 (11.5%) | 73 (5.6%) |
| 35 to 39 Years | 40 (3.6%) | 85 (6.5%) |
| 40 to 44 Years | 43 (3.9%) | 125 (9.6%) |
| 45 to 49 Years | 92 (8.3%) | 51 (3.9%) |
| 50 to 54 Years | 11 (1.0%) | 79 (6.0%) |
| 55 to 59 Years | 137 (12.3%) | 199 (15.2%) |
| 60 to 64 Years | 160 (14.4%) | 35 (2.7%) |
| 65 to 69 Years | 80 (7.2%) | 108 (8.3%) |
| 70 to 74 Years | 20 (1.8%) | 60 (4.6%) |
| 75 to 79 Years | 22 (2.0%) | 56 (4.3%) |
| 80 to 84 Years | 29 (2.6%) | 55 (4.2%) |
| 85 Years and over | 77 (6.9%) | 42 (3.2%) |
| Total | 1,109 (100.0%) | 1,308 (100.0%) |
Families and Households in Valley Hill
Median Family Size in Valley Hill
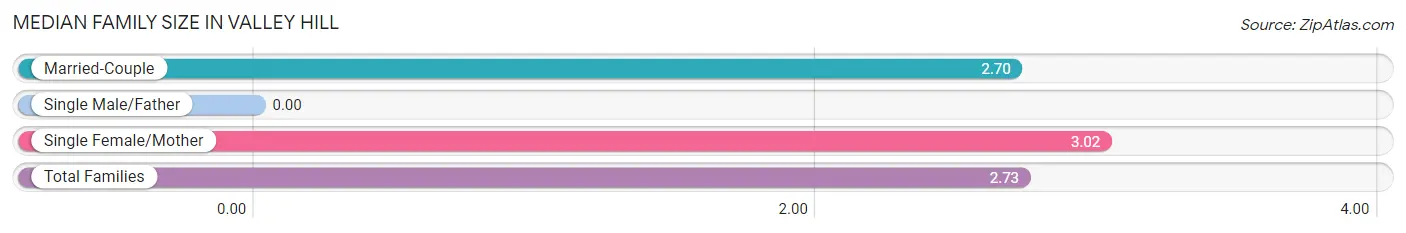
| Family Type | # Families | Family Size |
| Married-Couple | 688 (92.6%) | 2.70 |
| Single Male/Father | 0 (0.0%) | - |
| Single Female/Mother | 55 (7.4%) | 3.02 |
| Total Families | 743 (100.0%) | 2.73 |
Median Household Size in Valley Hill
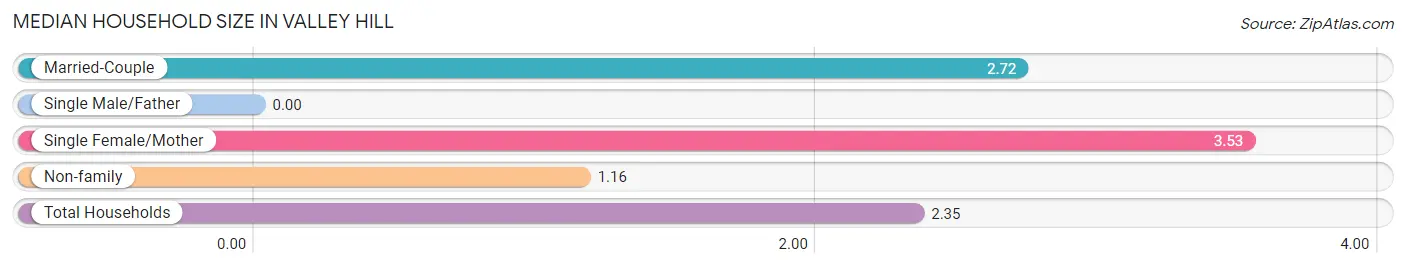
| Household Type | # Households | Household Size |
| Married-Couple | 688 (68.0%) | 2.72 |
| Single Male/Father | 0 (0.0%) | - |
| Single Female/Mother | 55 (5.4%) | 3.53 |
| Non-family | 268 (26.5%) | 1.16 |
| Total Households | 1,011 (100.0%) | 2.35 |
Household Size by Marriage Status in Valley Hill
Out of a total of 1,011 households in Valley Hill, 743 (73.5%) are family households, while 268 (26.5%) are nonfamily households. The most numerous type of family households are 2-person households, comprising 429, and the most common type of nonfamily households are 1-person households, comprising 232.
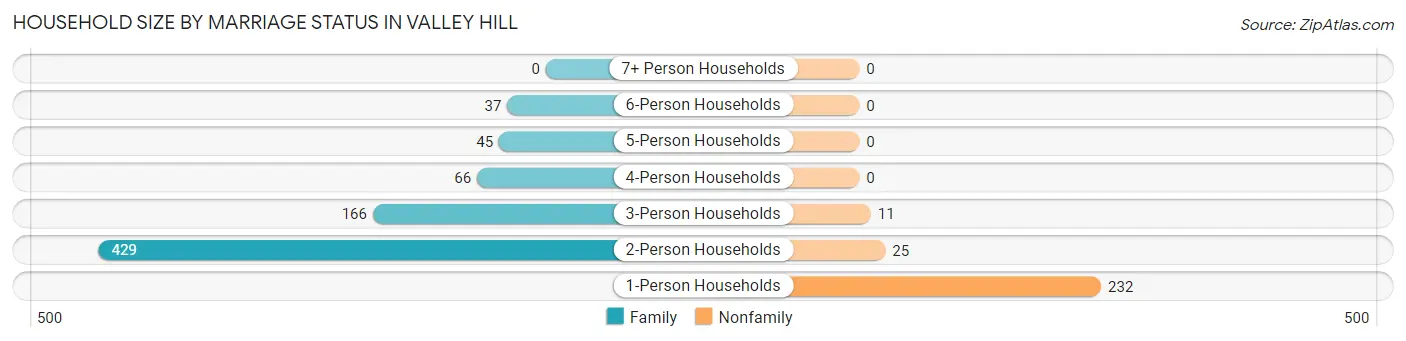
| Household Size | Family Households | Nonfamily Households |
| 1-Person Households | - | 232 (23.0%) |
| 2-Person Households | 429 (42.4%) | 25 (2.5%) |
| 3-Person Households | 166 (16.4%) | 11 (1.1%) |
| 4-Person Households | 66 (6.5%) | 0 (0.0%) |
| 5-Person Households | 45 (4.4%) | 0 (0.0%) |
| 6-Person Households | 37 (3.7%) | 0 (0.0%) |
| 7+ Person Households | 0 (0.0%) | 0 (0.0%) |
| Total | 743 (73.5%) | 268 (26.5%) |
Female Fertility in Valley Hill
Fertility by Age in Valley Hill
Average fertility rate in Valley Hill is 202.0 births per 1,000 women. Women in the age bracket of 20 to 34 years have the highest fertility rate with 313.0 births per 1,000 women. Women in the age bracket of 20 to 34 years acount for 57.5% of all women with births.
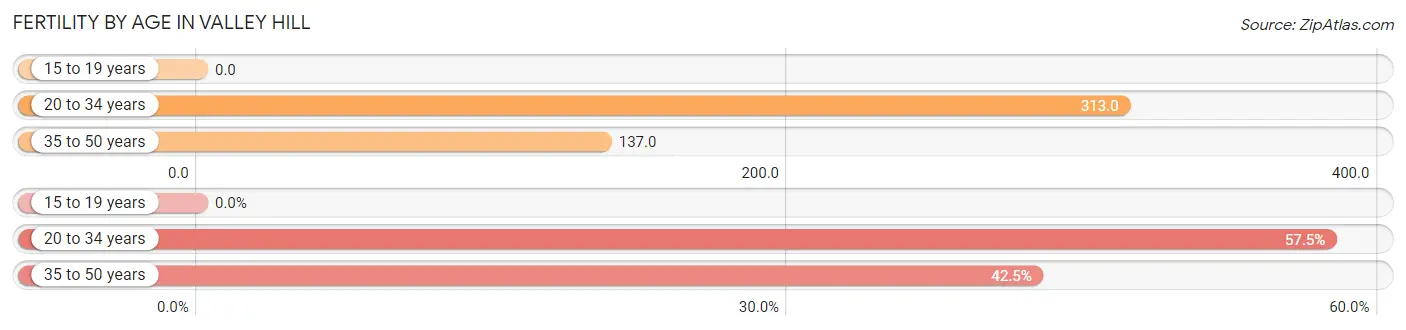
| Age Bracket | Women with Births | Births / 1,000 Women |
| 15 to 19 years | 0 (0.0%) | 0.0 |
| 20 to 34 years | 50 (57.5%) | 313.0 |
| 35 to 50 years | 37 (42.5%) | 137.0 |
| Total | 87 (100.0%) | 202.0 |
Fertility by Age by Marriage Status in Valley Hill
83.9% of women with births (87) in Valley Hill are married. The highest percentage of unmarried women with births falls into 20 to 34 years age bracket with 28.0% of them unmarried at the time of birth, while the lowest percentage of unmarried women with births belong to 35 to 50 years age bracket with 0.0% of them unmarried.
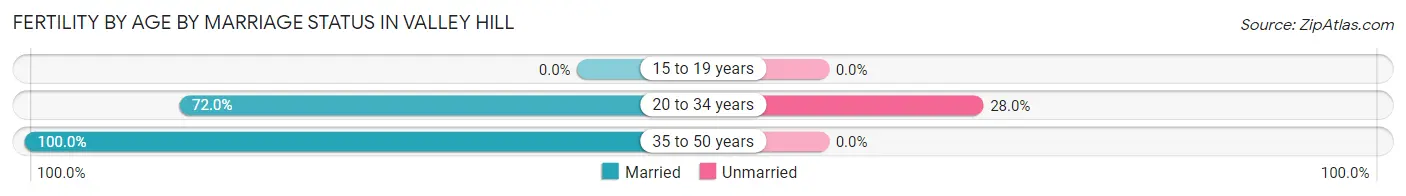
| Age Bracket | Married | Unmarried |
| 15 to 19 years | 0 (0.0%) | 0 (0.0%) |
| 20 to 34 years | 36 (72.0%) | 14 (28.0%) |
| 35 to 50 years | 37 (100.0%) | 0 (0.0%) |
| Total | 73 (83.9%) | 14 (16.1%) |
Fertility by Education in Valley Hill
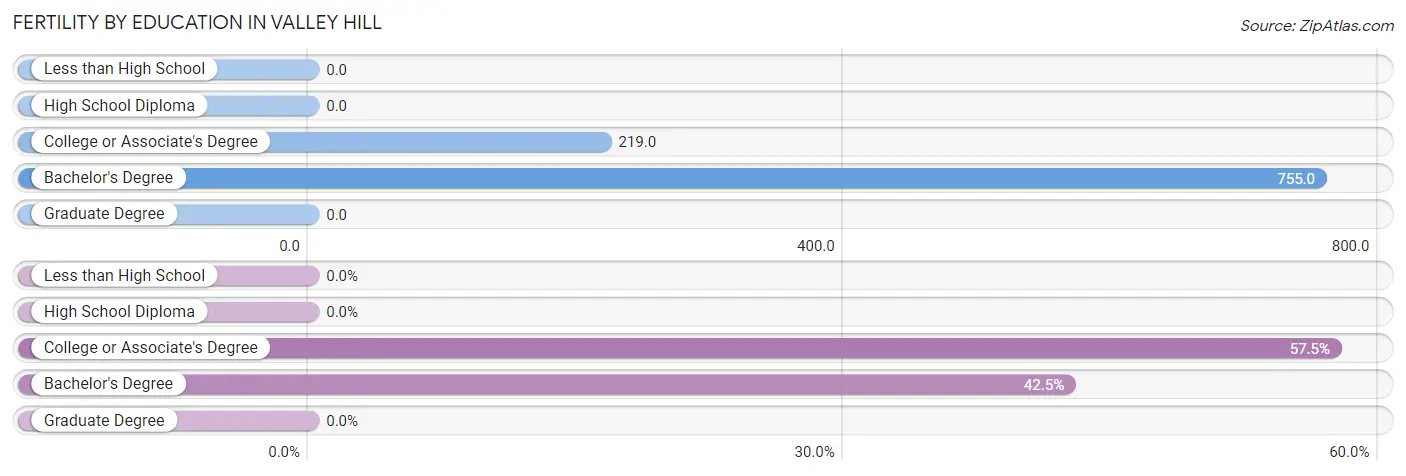
| Educational Attainment | Women with Births | Births / 1,000 Women |
| Less than High School | 0 (0.0%) | 0.0 |
| High School Diploma | 0 (0.0%) | 0.0 |
| College or Associate's Degree | 50 (57.5%) | 219.0 |
| Bachelor's Degree | 37 (42.5%) | 755.0 |
| Graduate Degree | 0 (0.0%) | 0.0 |
| Total | 87 (100.0%) | 202.0 |
Fertility by Education by Marriage Status in Valley Hill
16.1% of women with births in Valley Hill are unmarried. Women with the educational attainment of bachelor's degree are most likely to be married with 100.0% of them married at childbirth, while women with the educational attainment of college or associate's degree are least likely to be married with 28.0% of them unmarried at childbirth.
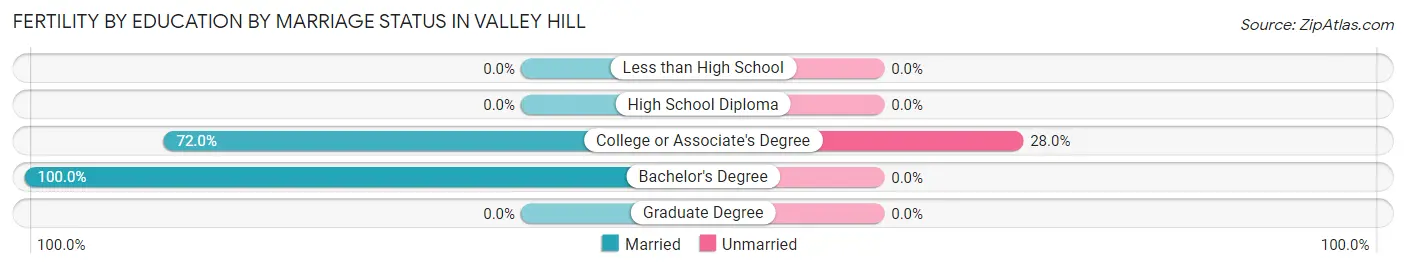
| Educational Attainment | Married | Unmarried |
| Less than High School | 0 (0.0%) | 0 (0.0%) |
| High School Diploma | 0 (0.0%) | 0 (0.0%) |
| College or Associate's Degree | 36 (72.0%) | 14 (28.0%) |
| Bachelor's Degree | 37 (100.0%) | 0 (0.0%) |
| Graduate Degree | 0 (0.0%) | 0 (0.0%) |
| Total | 73 (83.9%) | 14 (16.1%) |
Employment Characteristics in Valley Hill
Employment by Class of Employer in Valley Hill
Among the 1,225 employed individuals in Valley Hill, private company employees (777 | 63.4%), local government employees (153 | 12.5%), and self-employed (not incorporated) (121 | 9.9%) make up the most common classes of employment.
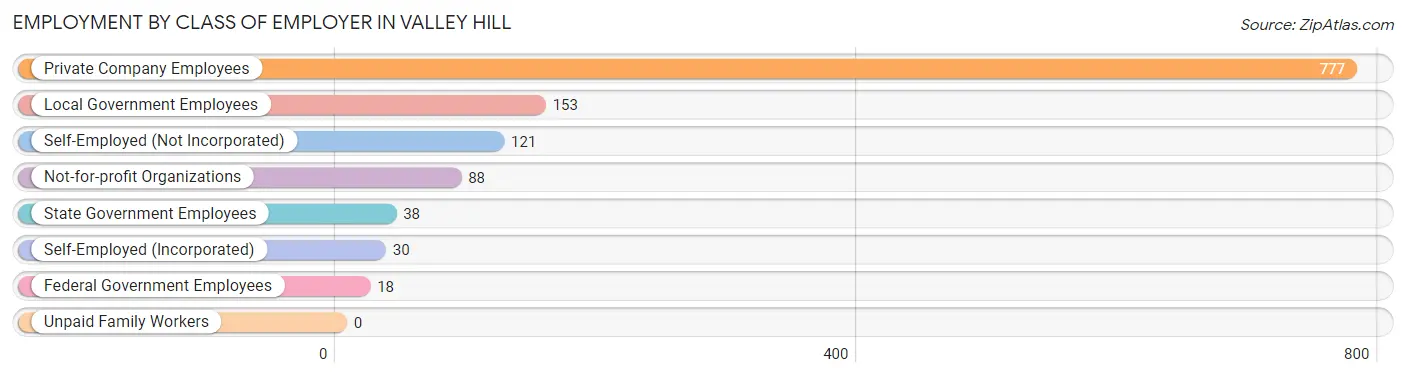
| Employer Class | # Employees | % Employees |
| Private Company Employees | 777 | 63.4% |
| Self-Employed (Incorporated) | 30 | 2.5% |
| Self-Employed (Not Incorporated) | 121 | 9.9% |
| Not-for-profit Organizations | 88 | 7.2% |
| Local Government Employees | 153 | 12.5% |
| State Government Employees | 38 | 3.1% |
| Federal Government Employees | 18 | 1.5% |
| Unpaid Family Workers | 0 | 0.0% |
| Total | 1,225 | 100.0% |
Employment Status by Age in Valley Hill
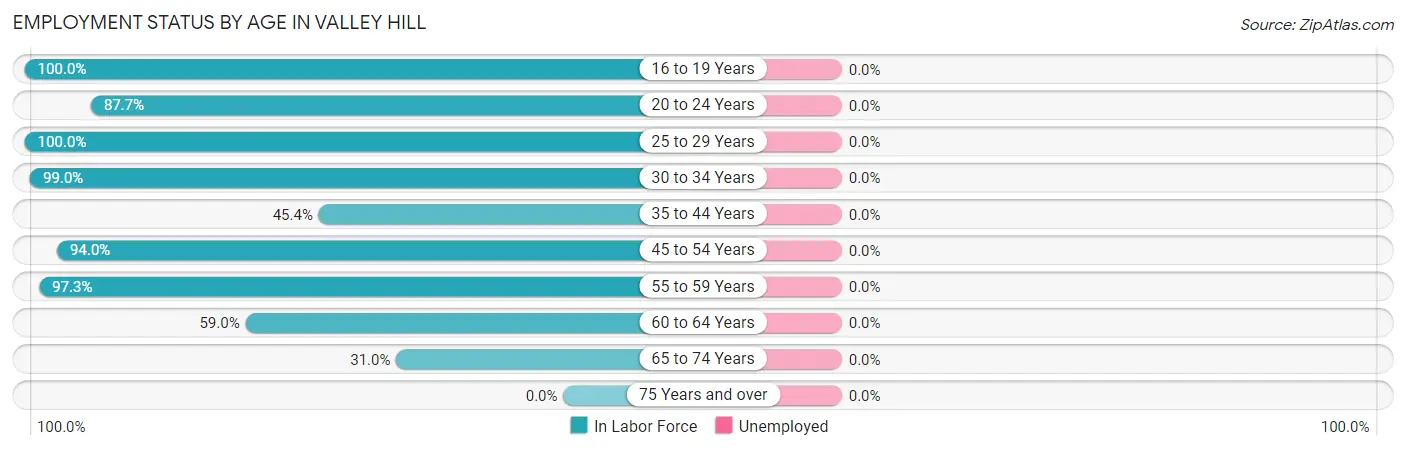
| Age Bracket | In Labor Force | Unemployed |
| 16 to 19 Years | 10 (100.0%) | 0 (0.0%) |
| 20 to 24 Years | 100 (87.7%) | 0 (0.0%) |
| 25 to 29 Years | 39 (100.0%) | 0 (0.0%) |
| 30 to 34 Years | 199 (99.0%) | 0 (0.0%) |
| 35 to 44 Years | 133 (45.4%) | 0 (0.0%) |
| 45 to 54 Years | 219 (94.0%) | 0 (0.0%) |
| 55 to 59 Years | 327 (97.3%) | 0 (0.0%) |
| 60 to 64 Years | 115 (59.0%) | 0 (0.0%) |
| 65 to 74 Years | 83 (31.0%) | 0 (0.0%) |
| 75 Years and over | 0 (0.0%) | 0 (0.0%) |
| Total | 1,225 (62.2%) | 0 (0.0%) |
Employment Status by Educational Attainment in Valley Hill
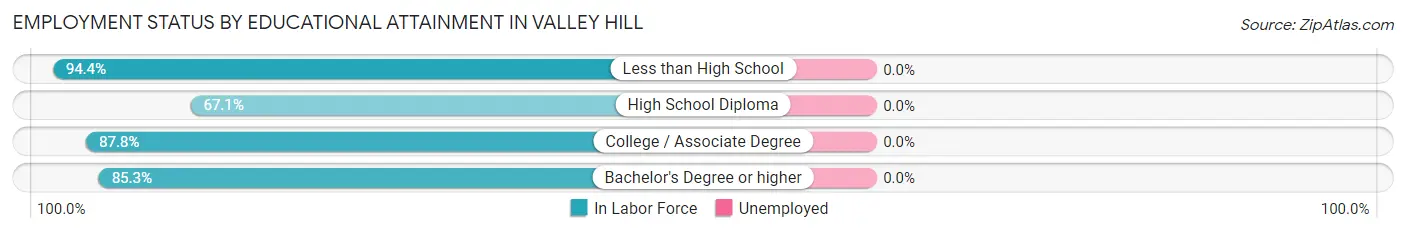
| Educational Attainment | In Labor Force | Unemployed |
| Less than High School | 34 (94.4%) | 0 (0.0%) |
| High School Diploma | 324 (67.1%) | 0 (0.0%) |
| College / Associate Degree | 361 (87.8%) | 0 (0.0%) |
| Bachelor's Degree or higher | 313 (85.3%) | 0 (0.0%) |
| Total | 1,032 (79.6%) | 0 (0.0%) |
Employment Occupations by Sex in Valley Hill
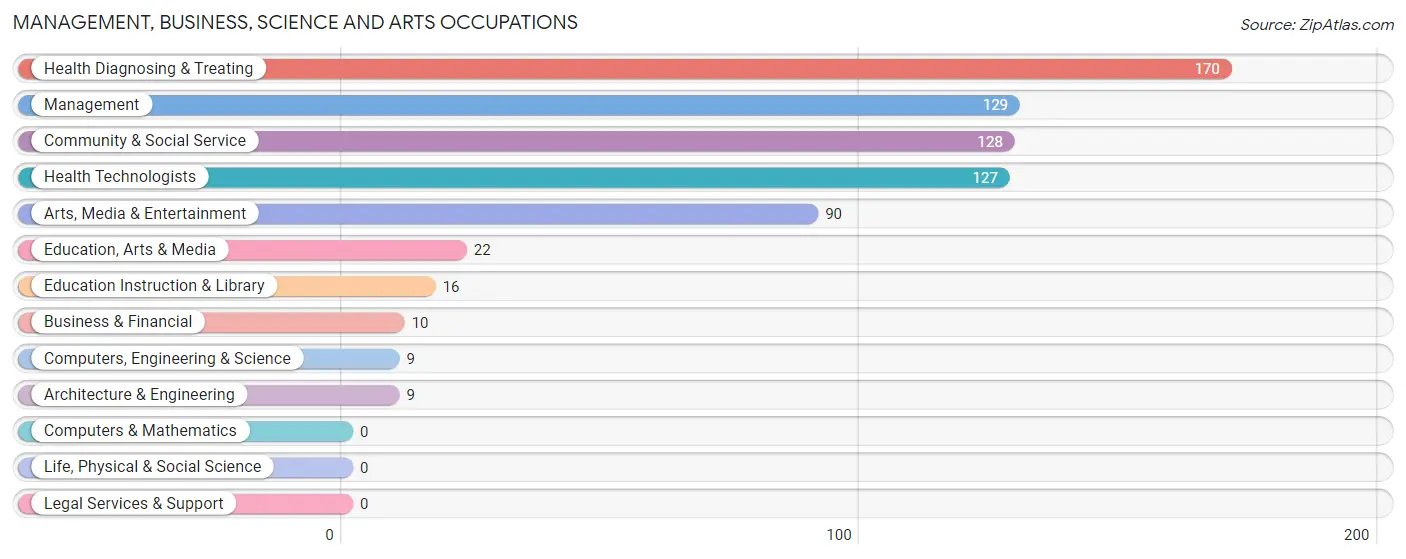
Management, Business, Science and Arts Occupations
The most common Management, Business, Science and Arts occupations in Valley Hill are Health Diagnosing & Treating (170 | 13.9%), Management (129 | 10.5%), Community & Social Service (128 | 10.4%), Health Technologists (127 | 10.4%), and Arts, Media & Entertainment (90 | 7.3%).
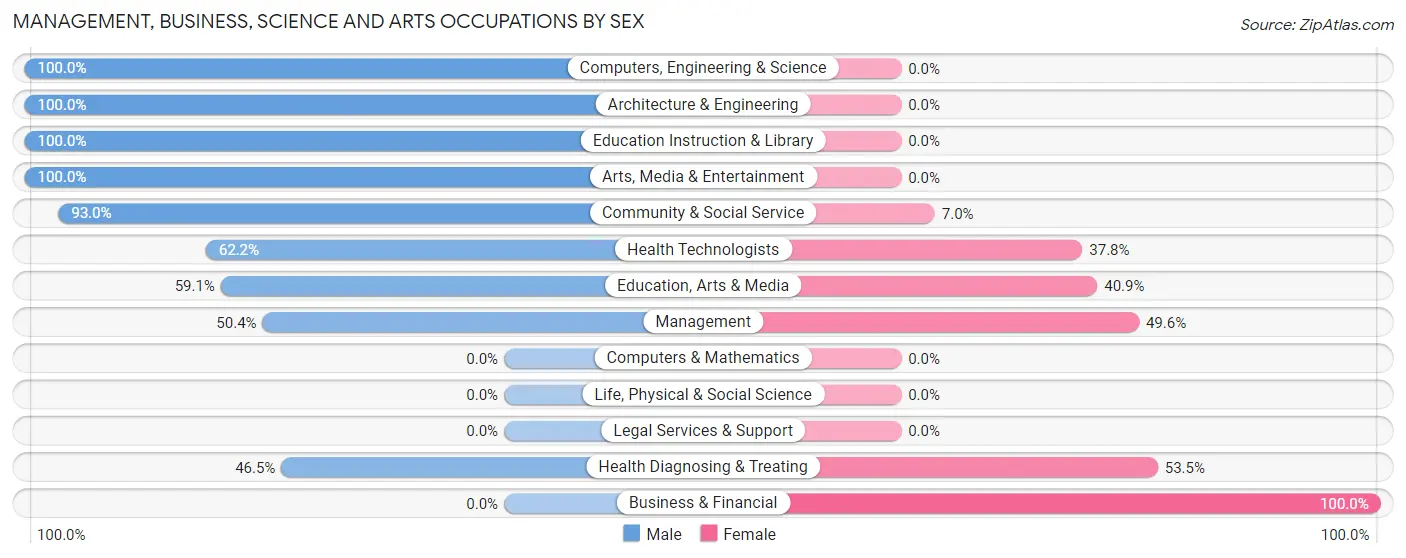
Management, Business, Science and Arts Occupations by Sex
Within the Management, Business, Science and Arts occupations in Valley Hill, the most male-oriented occupations are Computers, Engineering & Science (100.0%), Architecture & Engineering (100.0%), and Education Instruction & Library (100.0%), while the most female-oriented occupations are Business & Financial (100.0%), Health Diagnosing & Treating (53.5%), and Management (49.6%).
| Occupation | Male | Female |
| Management | 65 (50.4%) | 64 (49.6%) |
| Business & Financial | 0 (0.0%) | 10 (100.0%) |
| Computers, Engineering & Science | 9 (100.0%) | 0 (0.0%) |
| Computers & Mathematics | 0 (0.0%) | 0 (0.0%) |
| Architecture & Engineering | 9 (100.0%) | 0 (0.0%) |
| Life, Physical & Social Science | 0 (0.0%) | 0 (0.0%) |
| Community & Social Service | 119 (93.0%) | 9 (7.0%) |
| Education, Arts & Media | 13 (59.1%) | 9 (40.9%) |
| Legal Services & Support | 0 (0.0%) | 0 (0.0%) |
| Education Instruction & Library | 16 (100.0%) | 0 (0.0%) |
| Arts, Media & Entertainment | 90 (100.0%) | 0 (0.0%) |
| Health Diagnosing & Treating | 79 (46.5%) | 91 (53.5%) |
| Health Technologists | 79 (62.2%) | 48 (37.8%) |
| Total (Category) | 272 (61.0%) | 174 (39.0%) |
| Total (Overall) | 639 (52.2%) | 586 (47.8%) |
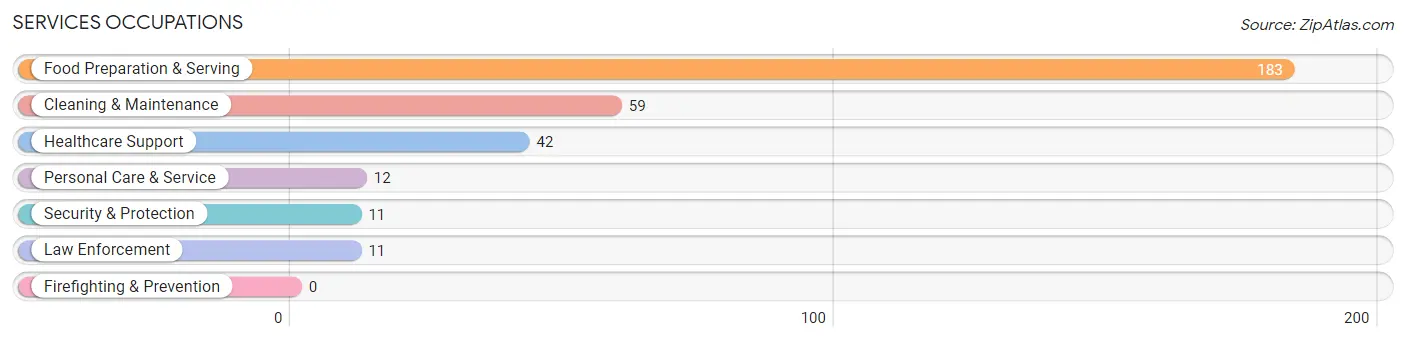
Services Occupations
The most common Services occupations in Valley Hill are Food Preparation & Serving (183 | 14.9%), Cleaning & Maintenance (59 | 4.8%), Healthcare Support (42 | 3.4%), Personal Care & Service (12 | 1.0%), and Security & Protection (11 | 0.9%).
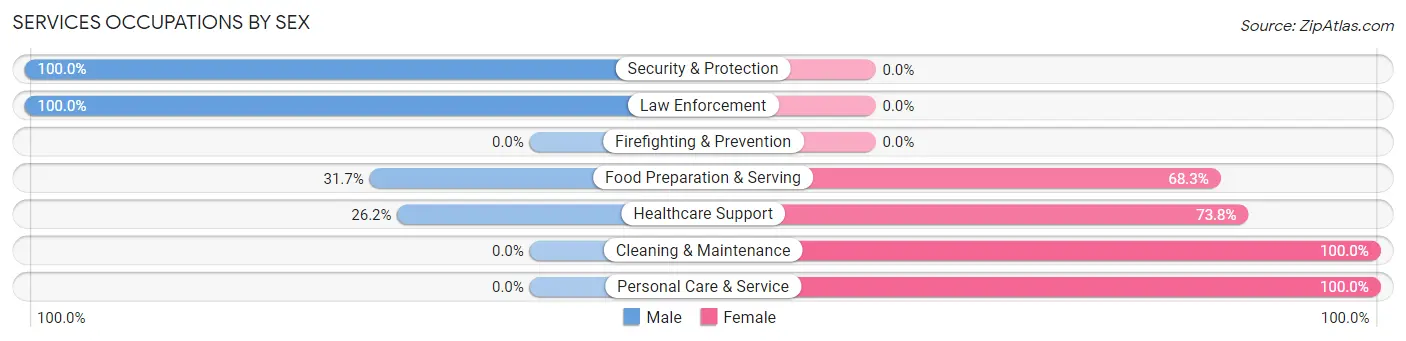
Services Occupations by Sex
Within the Services occupations in Valley Hill, the most male-oriented occupations are Security & Protection (100.0%), Law Enforcement (100.0%), and Food Preparation & Serving (31.7%), while the most female-oriented occupations are Cleaning & Maintenance (100.0%), Personal Care & Service (100.0%), and Healthcare Support (73.8%).
| Occupation | Male | Female |
| Healthcare Support | 11 (26.2%) | 31 (73.8%) |
| Security & Protection | 11 (100.0%) | 0 (0.0%) |
| Firefighting & Prevention | 0 (0.0%) | 0 (0.0%) |
| Law Enforcement | 11 (100.0%) | 0 (0.0%) |
| Food Preparation & Serving | 58 (31.7%) | 125 (68.3%) |
| Cleaning & Maintenance | 0 (0.0%) | 59 (100.0%) |
| Personal Care & Service | 0 (0.0%) | 12 (100.0%) |
| Total (Category) | 80 (26.1%) | 227 (73.9%) |
| Total (Overall) | 639 (52.2%) | 586 (47.8%) |
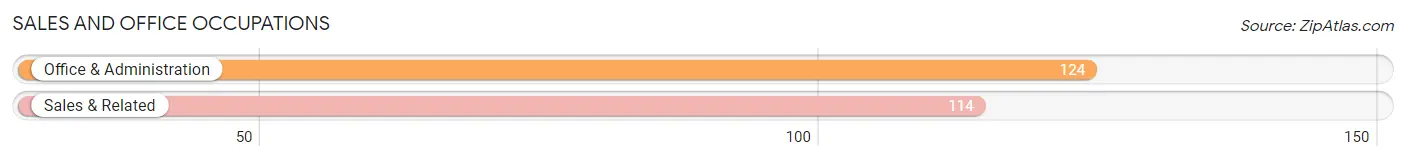
Sales and Office Occupations
The most common Sales and Office occupations in Valley Hill are Office & Administration (124 | 10.1%), and Sales & Related (114 | 9.3%).
Sales and Office Occupations by Sex
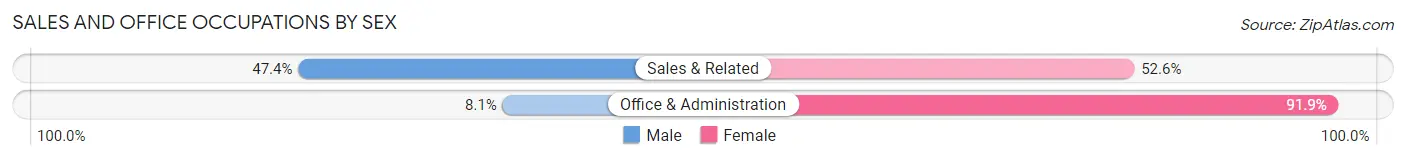
| Occupation | Male | Female |
| Sales & Related | 54 (47.4%) | 60 (52.6%) |
| Office & Administration | 10 (8.1%) | 114 (91.9%) |
| Total (Category) | 64 (26.9%) | 174 (73.1%) |
| Total (Overall) | 639 (52.2%) | 586 (47.8%) |
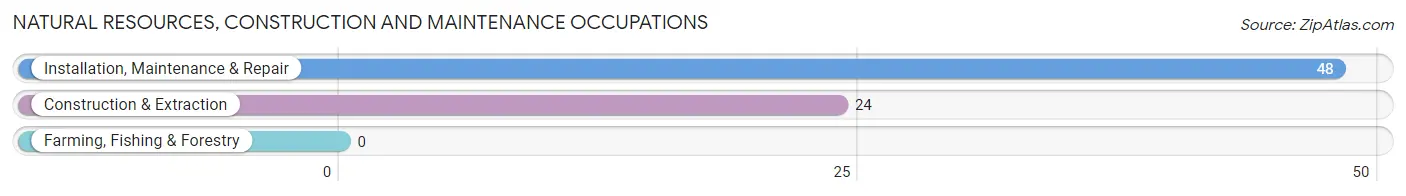
Natural Resources, Construction and Maintenance Occupations
The most common Natural Resources, Construction and Maintenance occupations in Valley Hill are Installation, Maintenance & Repair (48 | 3.9%), and Construction & Extraction (24 | 2.0%).
Natural Resources, Construction and Maintenance Occupations by Sex
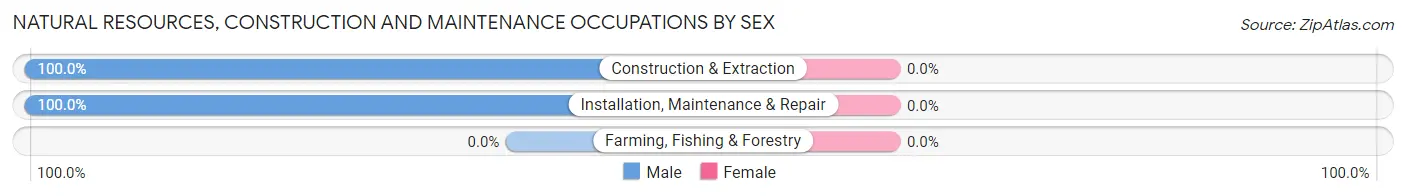
| Occupation | Male | Female |
| Farming, Fishing & Forestry | 0 (0.0%) | 0 (0.0%) |
| Construction & Extraction | 24 (100.0%) | 0 (0.0%) |
| Installation, Maintenance & Repair | 48 (100.0%) | 0 (0.0%) |
| Total (Category) | 72 (100.0%) | 0 (0.0%) |
| Total (Overall) | 639 (52.2%) | 586 (47.8%) |
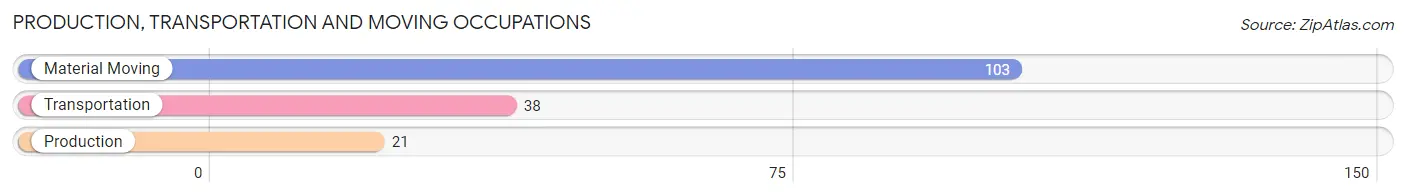
Production, Transportation and Moving Occupations
The most common Production, Transportation and Moving occupations in Valley Hill are Material Moving (103 | 8.4%), Transportation (38 | 3.1%), and Production (21 | 1.7%).
Production, Transportation and Moving Occupations by Sex
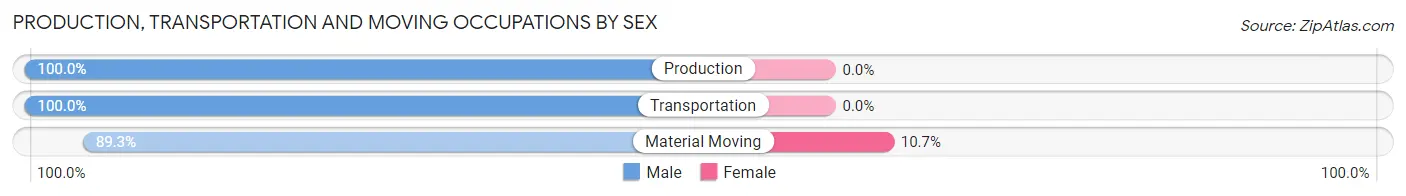
| Occupation | Male | Female |
| Production | 21 (100.0%) | 0 (0.0%) |
| Transportation | 38 (100.0%) | 0 (0.0%) |
| Material Moving | 92 (89.3%) | 11 (10.7%) |
| Total (Category) | 151 (93.2%) | 11 (6.8%) |
| Total (Overall) | 639 (52.2%) | 586 (47.8%) |
Employment Industries by Sex in Valley Hill
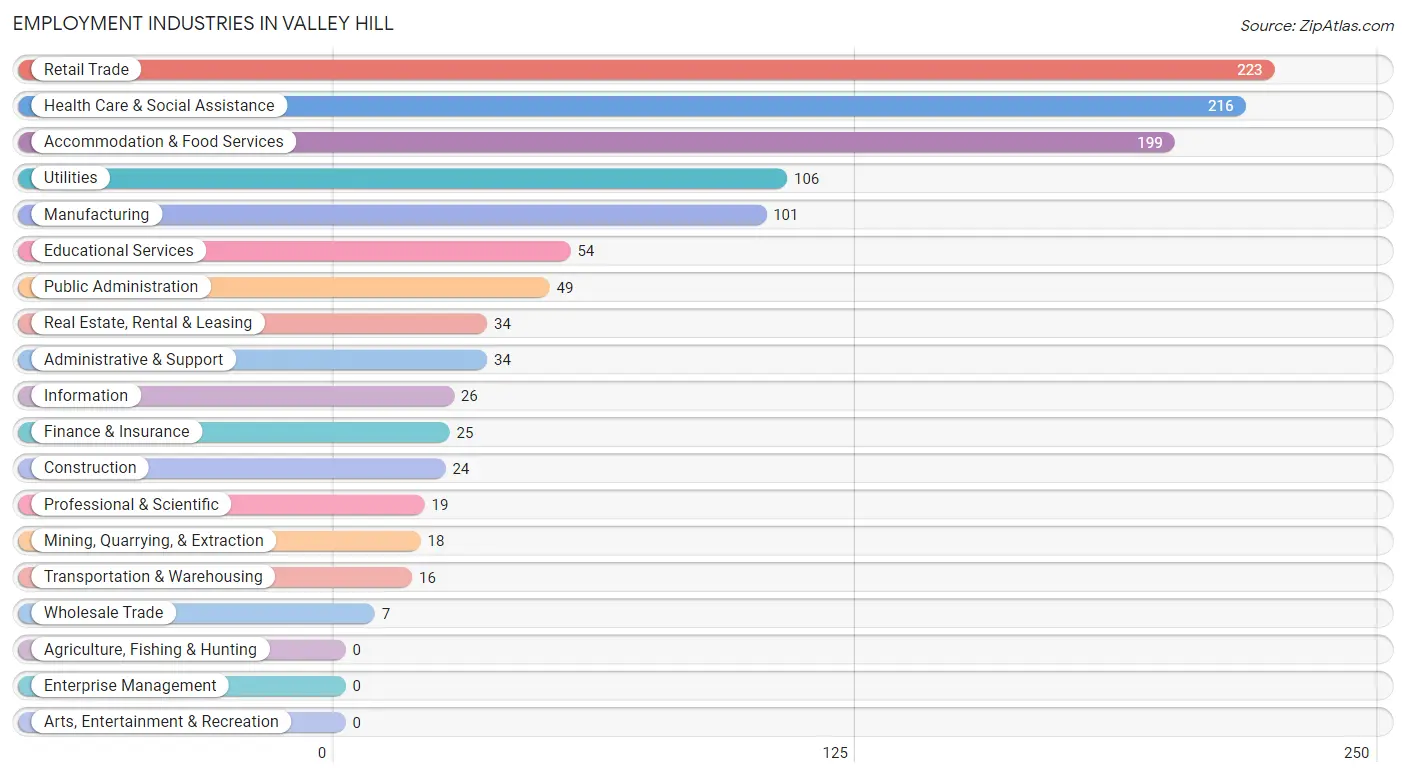
Employment Industries in Valley Hill
The major employment industries in Valley Hill include Retail Trade (223 | 18.2%), Health Care & Social Assistance (216 | 17.6%), Accommodation & Food Services (199 | 16.2%), Utilities (106 | 8.6%), and Manufacturing (101 | 8.2%).
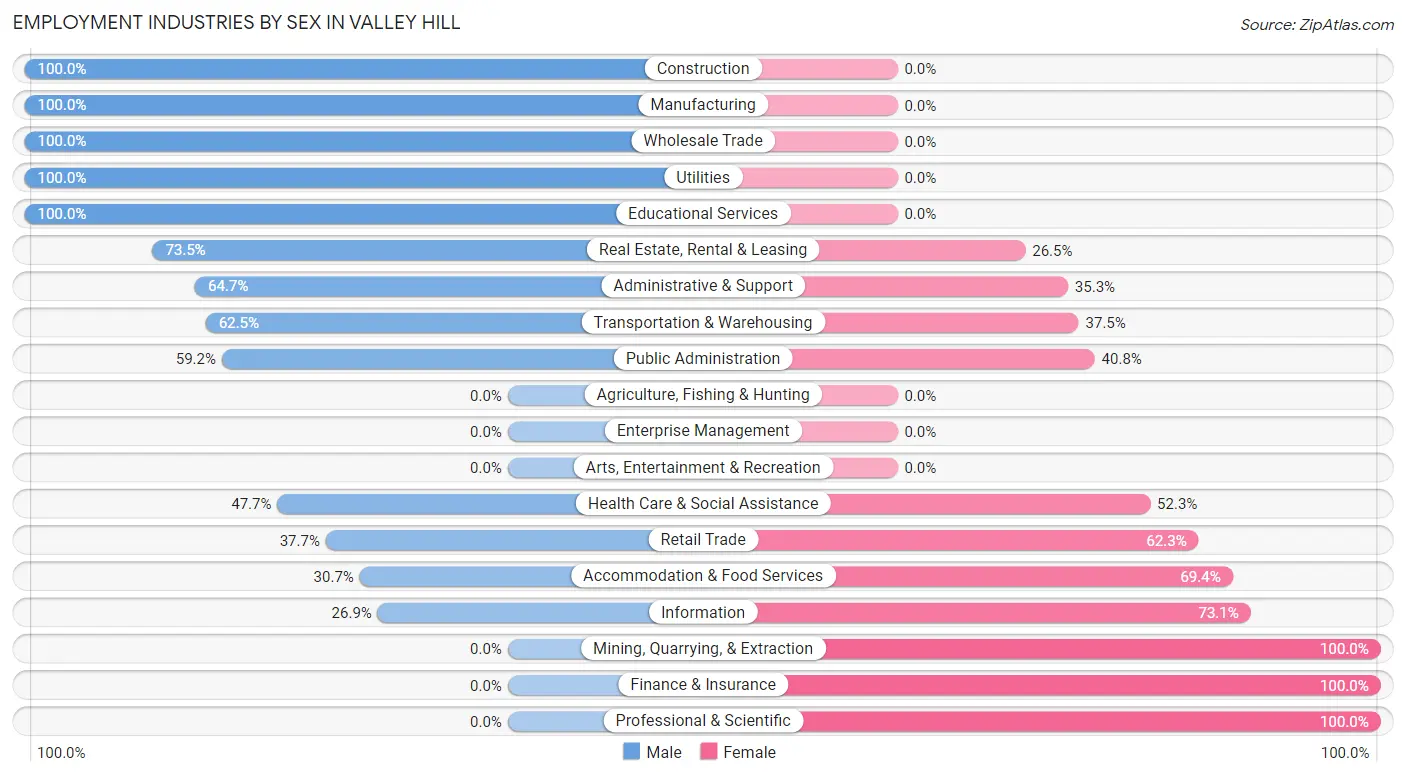
Employment Industries by Sex in Valley Hill
The Valley Hill industries that see more men than women are Construction (100.0%), Manufacturing (100.0%), and Wholesale Trade (100.0%), whereas the industries that tend to have a higher number of women are Mining, Quarrying, & Extraction (100.0%), Finance & Insurance (100.0%), and Professional & Scientific (100.0%).
| Industry | Male | Female |
| Agriculture, Fishing & Hunting | 0 (0.0%) | 0 (0.0%) |
| Mining, Quarrying, & Extraction | 0 (0.0%) | 18 (100.0%) |
| Construction | 24 (100.0%) | 0 (0.0%) |
| Manufacturing | 101 (100.0%) | 0 (0.0%) |
| Wholesale Trade | 7 (100.0%) | 0 (0.0%) |
| Retail Trade | 84 (37.7%) | 139 (62.3%) |
| Transportation & Warehousing | 10 (62.5%) | 6 (37.5%) |
| Utilities | 106 (100.0%) | 0 (0.0%) |
| Information | 7 (26.9%) | 19 (73.1%) |
| Finance & Insurance | 0 (0.0%) | 25 (100.0%) |
| Real Estate, Rental & Leasing | 25 (73.5%) | 9 (26.5%) |
| Professional & Scientific | 0 (0.0%) | 19 (100.0%) |
| Enterprise Management | 0 (0.0%) | 0 (0.0%) |
| Administrative & Support | 22 (64.7%) | 12 (35.3%) |
| Educational Services | 54 (100.0%) | 0 (0.0%) |
| Health Care & Social Assistance | 103 (47.7%) | 113 (52.3%) |
| Arts, Entertainment & Recreation | 0 (0.0%) | 0 (0.0%) |
| Accommodation & Food Services | 61 (30.6%) | 138 (69.4%) |
| Public Administration | 29 (59.2%) | 20 (40.8%) |
| Total | 639 (52.2%) | 586 (47.8%) |
Education in Valley Hill
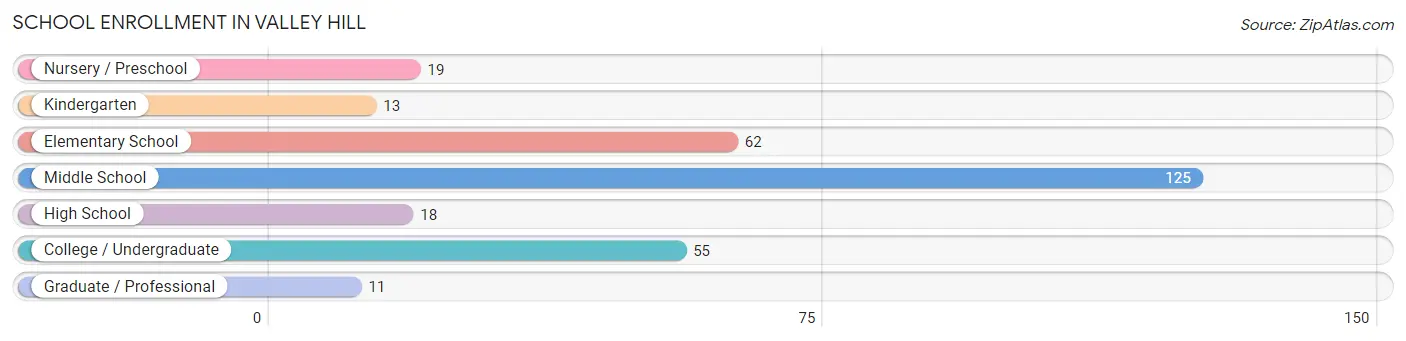
School Enrollment in Valley Hill
The most common levels of schooling among the 303 students in Valley Hill are middle school (125 | 41.2%), elementary school (62 | 20.5%), and college / undergraduate (55 | 18.1%).
| School Level | # Students | % Students |
| Nursery / Preschool | 19 | 6.3% |
| Kindergarten | 13 | 4.3% |
| Elementary School | 62 | 20.5% |
| Middle School | 125 | 41.2% |
| High School | 18 | 5.9% |
| College / Undergraduate | 55 | 18.1% |
| Graduate / Professional | 11 | 3.6% |
| Total | 303 | 100.0% |
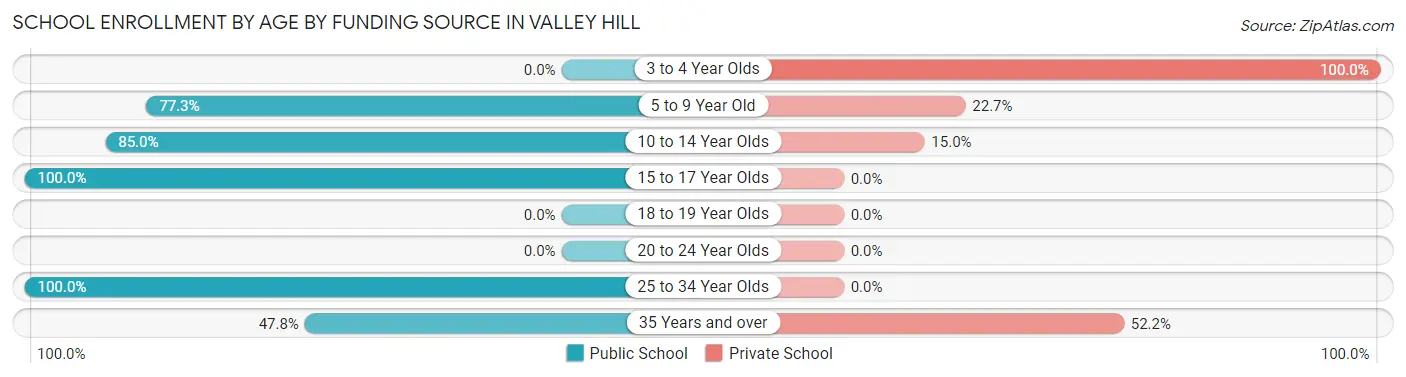
School Enrollment by Age by Funding Source in Valley Hill
Out of a total of 303 students who are enrolled in schools in Valley Hill, 68 (22.4%) attend a private institution, while the remaining 235 (77.6%) are enrolled in public schools. The age group of 3 to 4 year olds has the highest likelihood of being enrolled in private schools, with 19 (100.0% in the age bracket) enrolled. Conversely, the age group of 15 to 17 year olds has the lowest likelihood of being enrolled in a private school, with 10 (100.0% in the age bracket) attending a public institution.
| Age Bracket | Public School | Private School |
| 3 to 4 Year Olds | 0 (0.0%) | 19 (100.0%) |
| 5 to 9 Year Old | 58 (77.3%) | 17 (22.7%) |
| 10 to 14 Year Olds | 113 (85.0%) | 20 (15.0%) |
| 15 to 17 Year Olds | 10 (100.0%) | 0 (0.0%) |
| 18 to 19 Year Olds | 0 (0.0%) | 0 (0.0%) |
| 20 to 24 Year Olds | 0 (0.0%) | 0 (0.0%) |
| 25 to 34 Year Olds | 43 (100.0%) | 0 (0.0%) |
| 35 Years and over | 11 (47.8%) | 12 (52.2%) |
| Total | 235 (77.6%) | 68 (22.4%) |
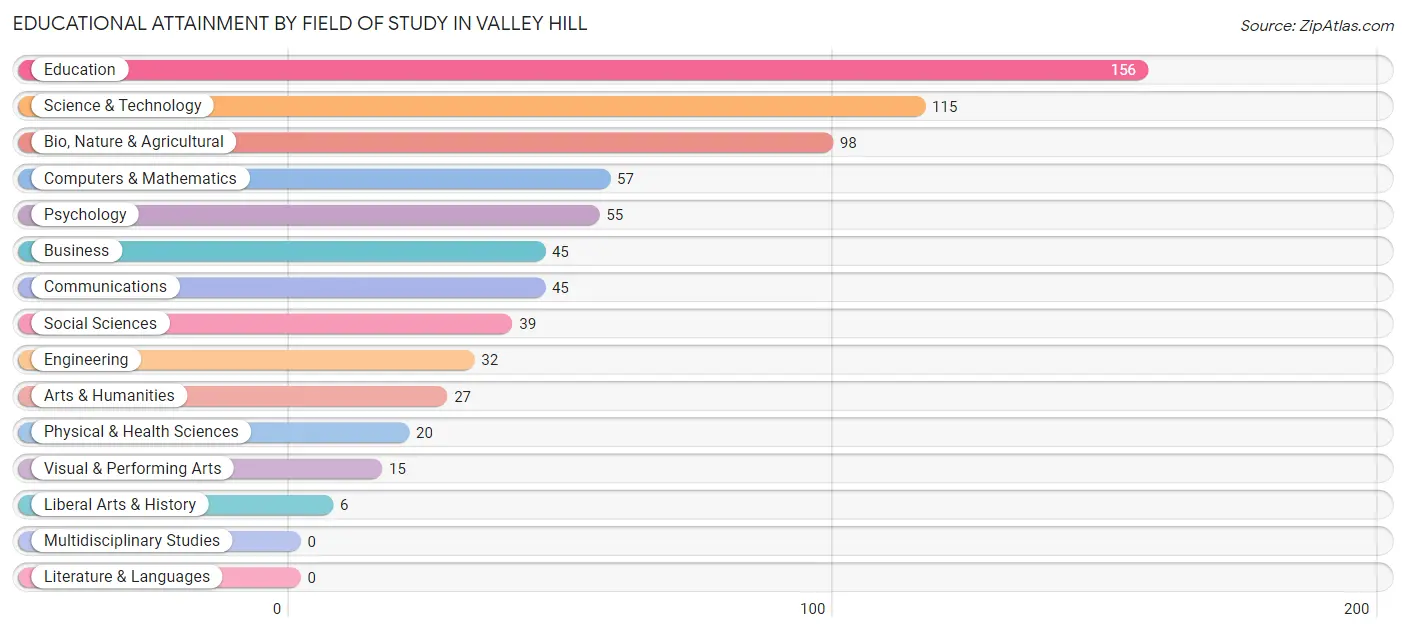
Educational Attainment by Field of Study in Valley Hill
Education (156 | 22.0%), science & technology (115 | 16.2%), bio, nature & agricultural (98 | 13.8%), computers & mathematics (57 | 8.0%), and psychology (55 | 7.7%) are the most common fields of study among 710 individuals in Valley Hill who have obtained a bachelor's degree or higher.
| Field of Study | # Graduates | % Graduates |
| Computers & Mathematics | 57 | 8.0% |
| Bio, Nature & Agricultural | 98 | 13.8% |
| Physical & Health Sciences | 20 | 2.8% |
| Psychology | 55 | 7.7% |
| Social Sciences | 39 | 5.5% |
| Engineering | 32 | 4.5% |
| Multidisciplinary Studies | 0 | 0.0% |
| Science & Technology | 115 | 16.2% |
| Business | 45 | 6.3% |
| Education | 156 | 22.0% |
| Literature & Languages | 0 | 0.0% |
| Liberal Arts & History | 6 | 0.9% |
| Visual & Performing Arts | 15 | 2.1% |
| Communications | 45 | 6.3% |
| Arts & Humanities | 27 | 3.8% |
| Total | 710 | 100.0% |
Transportation & Commute in Valley Hill
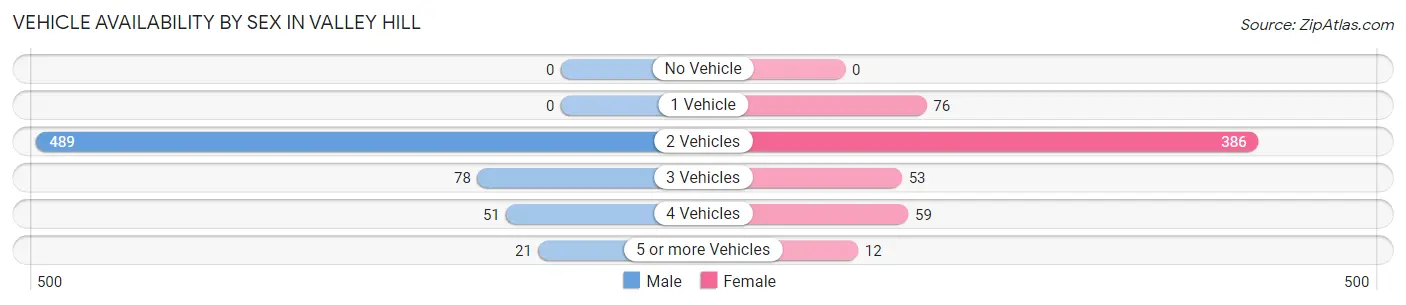
Vehicle Availability by Sex in Valley Hill
The most prevalent vehicle ownership categories in Valley Hill are males with 2 vehicles (489, accounting for 76.5%) and females with 2 vehicles (386, making up 83.5%).
| Vehicles Available | Male | Female |
| No Vehicle | 0 (0.0%) | 0 (0.0%) |
| 1 Vehicle | 0 (0.0%) | 76 (13.0%) |
| 2 Vehicles | 489 (76.5%) | 386 (65.9%) |
| 3 Vehicles | 78 (12.2%) | 53 (9.0%) |
| 4 Vehicles | 51 (8.0%) | 59 (10.1%) |
| 5 or more Vehicles | 21 (3.3%) | 12 (2.1%) |
| Total | 639 (100.0%) | 586 (100.0%) |
Commute Time in Valley Hill
The most frequently occuring commute durations in Valley Hill are 15 to 19 minutes (303 commuters, 28.9%), 30 to 34 minutes (153 commuters, 14.6%), and 20 to 24 minutes (133 commuters, 12.7%).
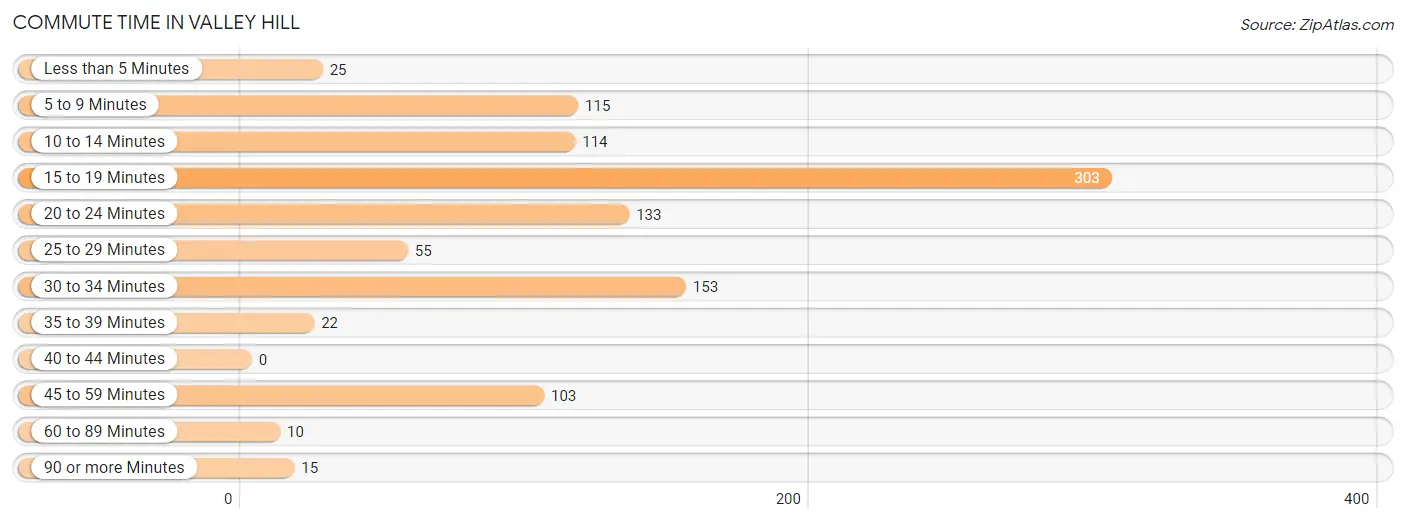
| Commute Time | # Commuters | % Commuters |
| Less than 5 Minutes | 25 | 2.4% |
| 5 to 9 Minutes | 115 | 11.0% |
| 10 to 14 Minutes | 114 | 10.9% |
| 15 to 19 Minutes | 303 | 28.9% |
| 20 to 24 Minutes | 133 | 12.7% |
| 25 to 29 Minutes | 55 | 5.2% |
| 30 to 34 Minutes | 153 | 14.6% |
| 35 to 39 Minutes | 22 | 2.1% |
| 40 to 44 Minutes | 0 | 0.0% |
| 45 to 59 Minutes | 103 | 9.8% |
| 60 to 89 Minutes | 10 | 0.9% |
| 90 or more Minutes | 15 | 1.4% |
Commute Time by Sex in Valley Hill
The most common commute times in Valley Hill are 20 to 24 minutes (107 commuters, 21.4%) for males and 15 to 19 minutes (240 commuters, 43.7%) for females.
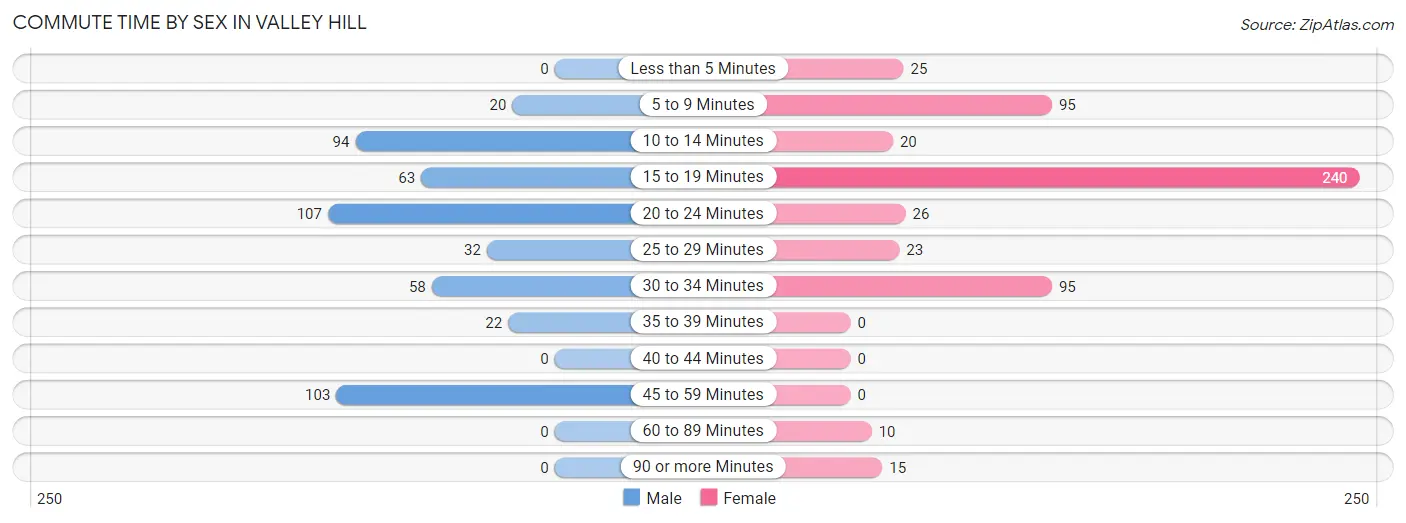
| Commute Time | Male | Female |
| Less than 5 Minutes | 0 (0.0%) | 25 (4.5%) |
| 5 to 9 Minutes | 20 (4.0%) | 95 (17.3%) |
| 10 to 14 Minutes | 94 (18.8%) | 20 (3.6%) |
| 15 to 19 Minutes | 63 (12.6%) | 240 (43.7%) |
| 20 to 24 Minutes | 107 (21.4%) | 26 (4.7%) |
| 25 to 29 Minutes | 32 (6.4%) | 23 (4.2%) |
| 30 to 34 Minutes | 58 (11.6%) | 95 (17.3%) |
| 35 to 39 Minutes | 22 (4.4%) | 0 (0.0%) |
| 40 to 44 Minutes | 0 (0.0%) | 0 (0.0%) |
| 45 to 59 Minutes | 103 (20.6%) | 0 (0.0%) |
| 60 to 89 Minutes | 0 (0.0%) | 10 (1.8%) |
| 90 or more Minutes | 0 (0.0%) | 15 (2.7%) |
Time of Departure to Work by Sex in Valley Hill
The most frequent times of departure to work in Valley Hill are 6:00 AM to 6:29 AM (127, 25.5%) for males and 9:00 AM to 9:59 AM (189, 34.4%) for females.
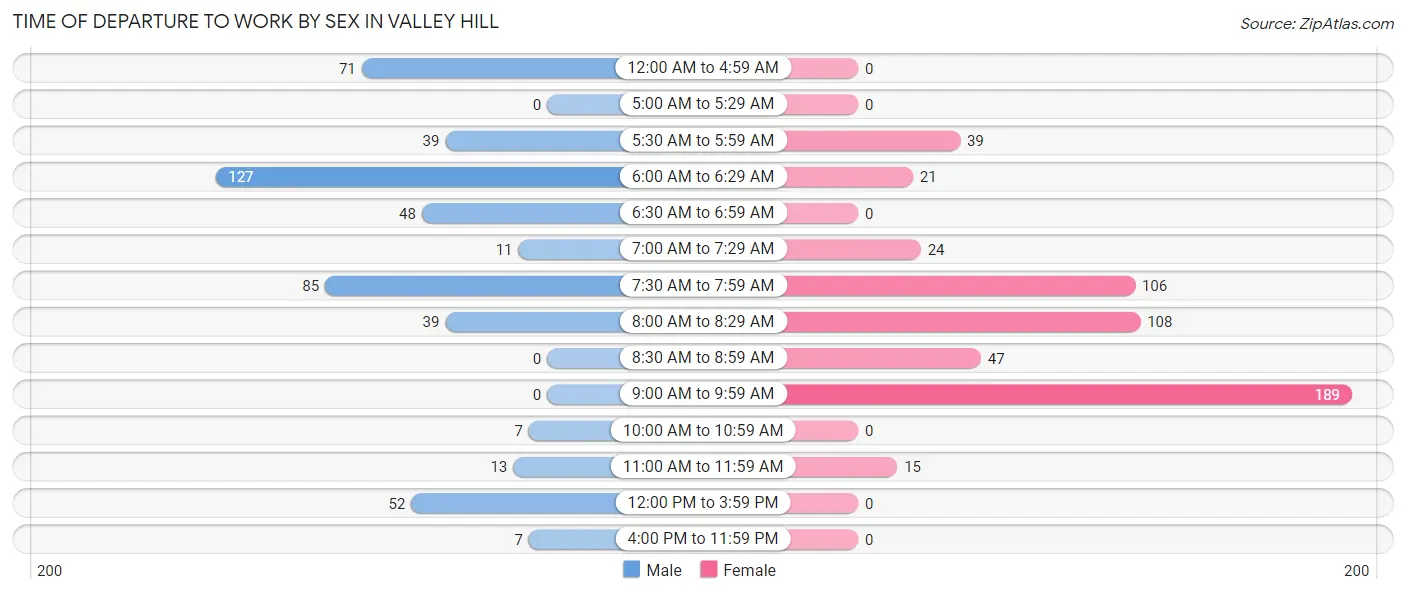
| Time of Departure | Male | Female |
| 12:00 AM to 4:59 AM | 71 (14.2%) | 0 (0.0%) |
| 5:00 AM to 5:29 AM | 0 (0.0%) | 0 (0.0%) |
| 5:30 AM to 5:59 AM | 39 (7.8%) | 39 (7.1%) |
| 6:00 AM to 6:29 AM | 127 (25.5%) | 21 (3.8%) |
| 6:30 AM to 6:59 AM | 48 (9.6%) | 0 (0.0%) |
| 7:00 AM to 7:29 AM | 11 (2.2%) | 24 (4.4%) |
| 7:30 AM to 7:59 AM | 85 (17.0%) | 106 (19.3%) |
| 8:00 AM to 8:29 AM | 39 (7.8%) | 108 (19.7%) |
| 8:30 AM to 8:59 AM | 0 (0.0%) | 47 (8.6%) |
| 9:00 AM to 9:59 AM | 0 (0.0%) | 189 (34.4%) |
| 10:00 AM to 10:59 AM | 7 (1.4%) | 0 (0.0%) |
| 11:00 AM to 11:59 AM | 13 (2.6%) | 15 (2.7%) |
| 12:00 PM to 3:59 PM | 52 (10.4%) | 0 (0.0%) |
| 4:00 PM to 11:59 PM | 7 (1.4%) | 0 (0.0%) |
| Total | 499 (100.0%) | 549 (100.0%) |
Housing Occupancy in Valley Hill
Occupancy by Ownership in Valley Hill
Of the total 1,011 dwellings in Valley Hill, owner-occupied units account for 777 (76.8%), while renter-occupied units make up 234 (23.2%).
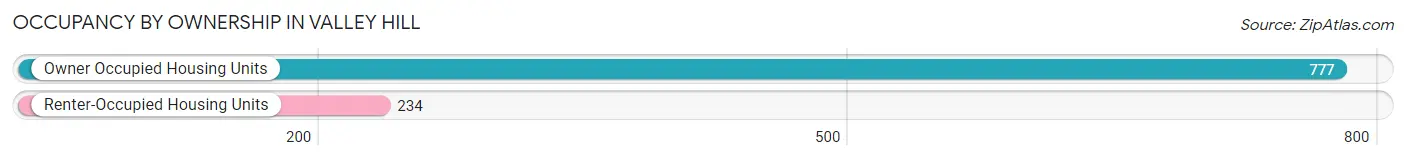
| Occupancy | # Housing Units | % Housing Units |
| Owner Occupied Housing Units | 777 | 76.8% |
| Renter-Occupied Housing Units | 234 | 23.2% |
| Total Occupied Housing Units | 1,011 | 100.0% |
Occupancy by Household Size in Valley Hill
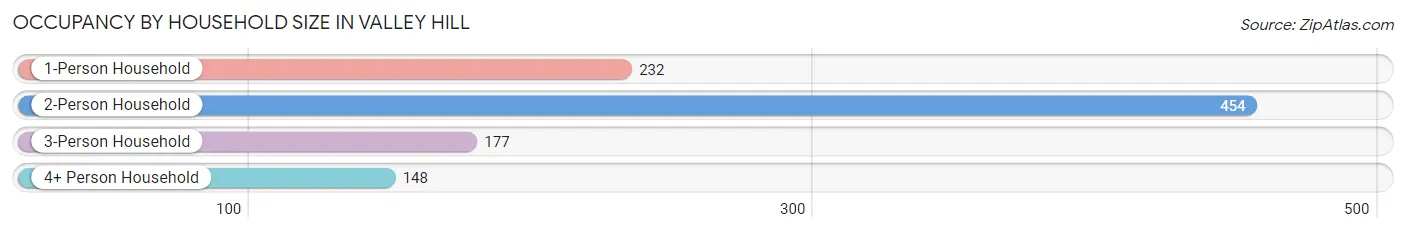
| Household Size | # Housing Units | % Housing Units |
| 1-Person Household | 232 | 23.0% |
| 2-Person Household | 454 | 44.9% |
| 3-Person Household | 177 | 17.5% |
| 4+ Person Household | 148 | 14.6% |
| Total Housing Units | 1,011 | 100.0% |
Occupancy by Ownership by Household Size in Valley Hill
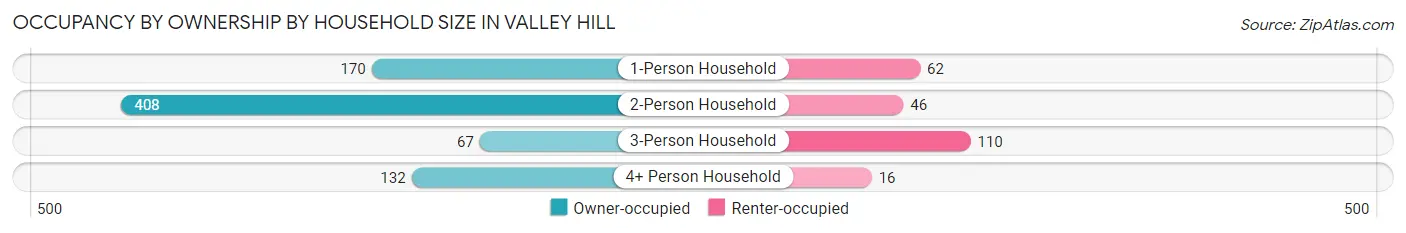
| Household Size | Owner-occupied | Renter-occupied |
| 1-Person Household | 170 (73.3%) | 62 (26.7%) |
| 2-Person Household | 408 (89.9%) | 46 (10.1%) |
| 3-Person Household | 67 (37.9%) | 110 (62.2%) |
| 4+ Person Household | 132 (89.2%) | 16 (10.8%) |
| Total Housing Units | 777 (76.8%) | 234 (23.2%) |
Occupancy by Educational Attainment in Valley Hill
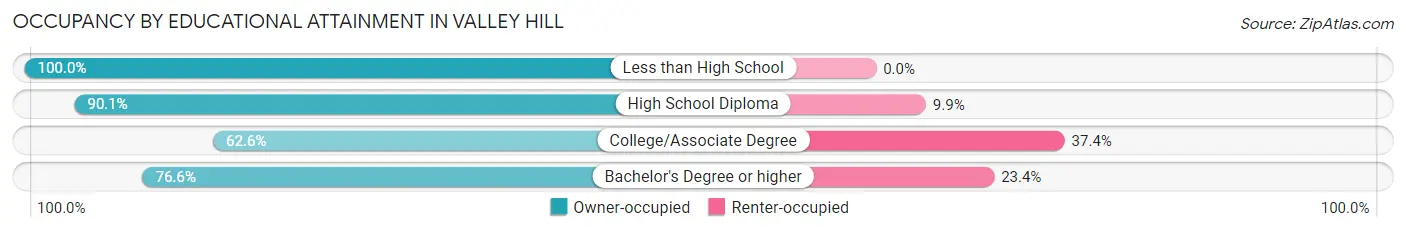
| Household Size | Owner-occupied | Renter-occupied |
| Less than High School | 24 (100.0%) | 0 (0.0%) |
| High School Diploma | 256 (90.1%) | 28 (9.9%) |
| College/Associate Degree | 186 (62.6%) | 111 (37.4%) |
| Bachelor's Degree or higher | 311 (76.6%) | 95 (23.4%) |
Occupancy by Age of Householder in Valley Hill
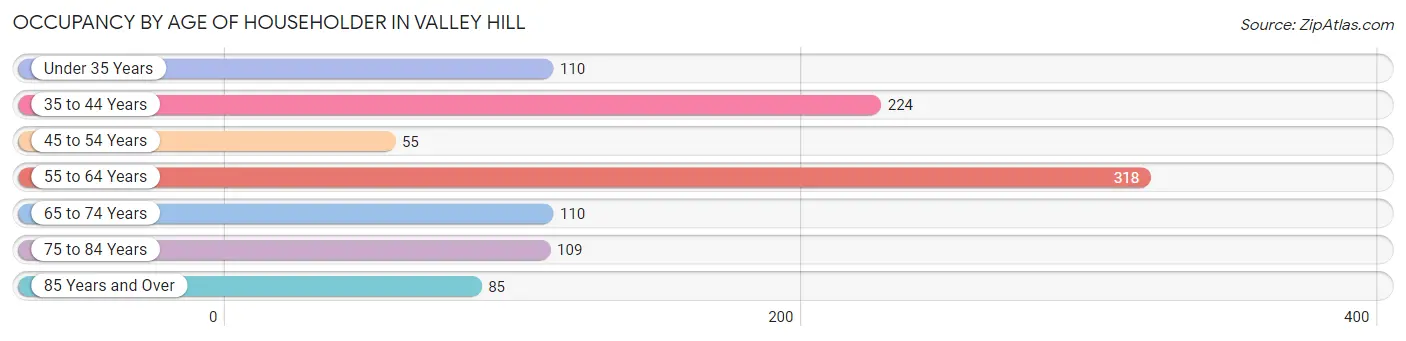
| Age Bracket | # Households | % Households |
| Under 35 Years | 110 | 10.9% |
| 35 to 44 Years | 224 | 22.2% |
| 45 to 54 Years | 55 | 5.4% |
| 55 to 64 Years | 318 | 31.5% |
| 65 to 74 Years | 110 | 10.9% |
| 75 to 84 Years | 109 | 10.8% |
| 85 Years and Over | 85 | 8.4% |
| Total | 1,011 | 100.0% |
Housing Finances in Valley Hill
Median Income by Occupancy in Valley Hill
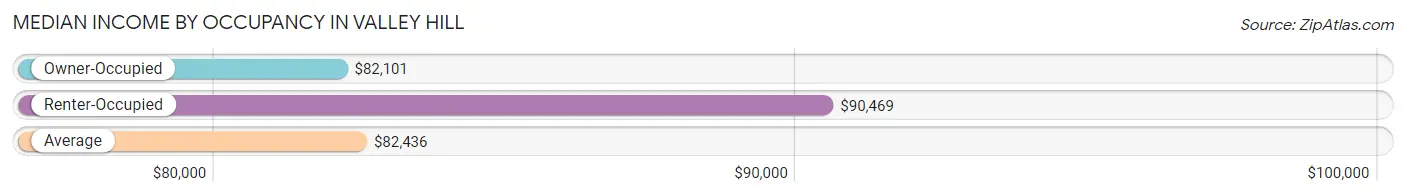
| Occupancy Type | # Households | Median Income |
| Owner-Occupied | 777 (76.8%) | $82,101 |
| Renter-Occupied | 234 (23.2%) | $90,469 |
| Average | 1,011 (100.0%) | $82,436 |
Occupancy by Householder Income Bracket in Valley Hill
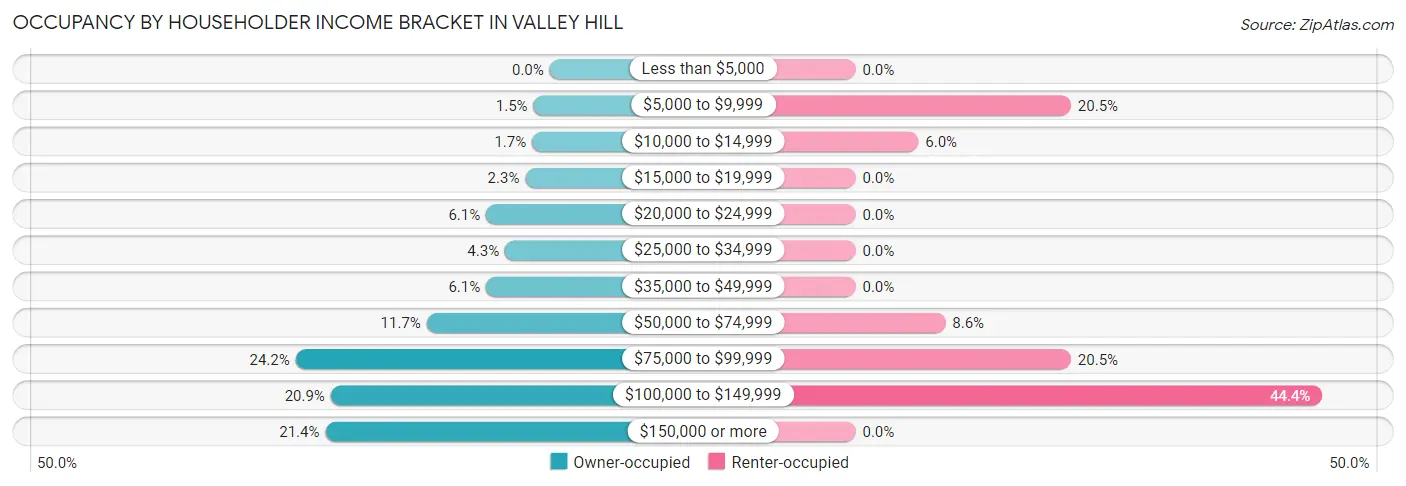
| Income Bracket | Owner-occupied | Renter-occupied |
| Less than $5,000 | 0 (0.0%) | 0 (0.0%) |
| $5,000 to $9,999 | 12 (1.5%) | 48 (20.5%) |
| $10,000 to $14,999 | 13 (1.7%) | 14 (6.0%) |
| $15,000 to $19,999 | 18 (2.3%) | 0 (0.0%) |
| $20,000 to $24,999 | 47 (6.0%) | 0 (0.0%) |
| $25,000 to $34,999 | 33 (4.3%) | 0 (0.0%) |
| $35,000 to $49,999 | 47 (6.0%) | 0 (0.0%) |
| $50,000 to $74,999 | 91 (11.7%) | 20 (8.6%) |
| $75,000 to $99,999 | 188 (24.2%) | 48 (20.5%) |
| $100,000 to $149,999 | 162 (20.8%) | 104 (44.4%) |
| $150,000 or more | 166 (21.4%) | 0 (0.0%) |
| Total | 777 (100.0%) | 234 (100.0%) |
Monthly Housing Cost Tiers in Valley Hill
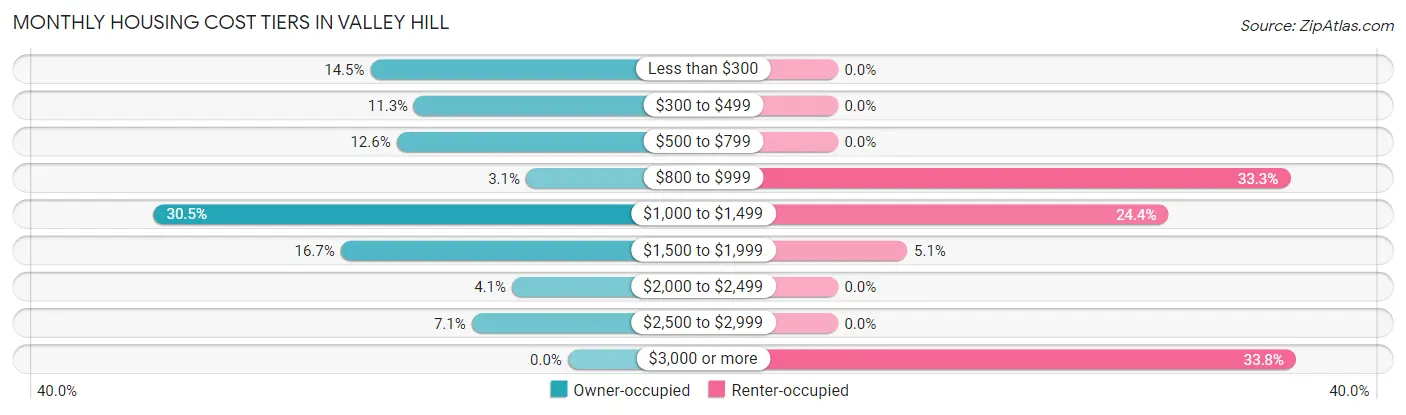
| Monthly Cost | Owner-occupied | Renter-occupied |
| Less than $300 | 113 (14.5%) | 0 (0.0%) |
| $300 to $499 | 88 (11.3%) | 0 (0.0%) |
| $500 to $799 | 98 (12.6%) | 0 (0.0%) |
| $800 to $999 | 24 (3.1%) | 78 (33.3%) |
| $1,000 to $1,499 | 237 (30.5%) | 57 (24.4%) |
| $1,500 to $1,999 | 130 (16.7%) | 12 (5.1%) |
| $2,000 to $2,499 | 32 (4.1%) | 0 (0.0%) |
| $2,500 to $2,999 | 55 (7.1%) | 0 (0.0%) |
| $3,000 or more | 0 (0.0%) | 79 (33.8%) |
| Total | 777 (100.0%) | 234 (100.0%) |
Physical Housing Characteristics in Valley Hill
Housing Structures in Valley Hill
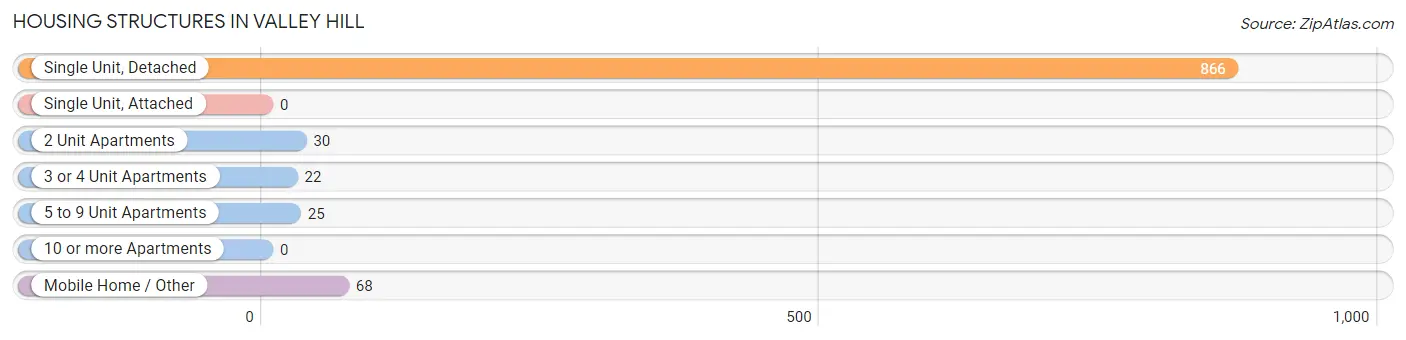
| Structure Type | # Housing Units | % Housing Units |
| Single Unit, Detached | 866 | 85.7% |
| Single Unit, Attached | 0 | 0.0% |
| 2 Unit Apartments | 30 | 3.0% |
| 3 or 4 Unit Apartments | 22 | 2.2% |
| 5 to 9 Unit Apartments | 25 | 2.5% |
| 10 or more Apartments | 0 | 0.0% |
| Mobile Home / Other | 68 | 6.7% |
| Total | 1,011 | 100.0% |
Housing Structures by Occupancy in Valley Hill
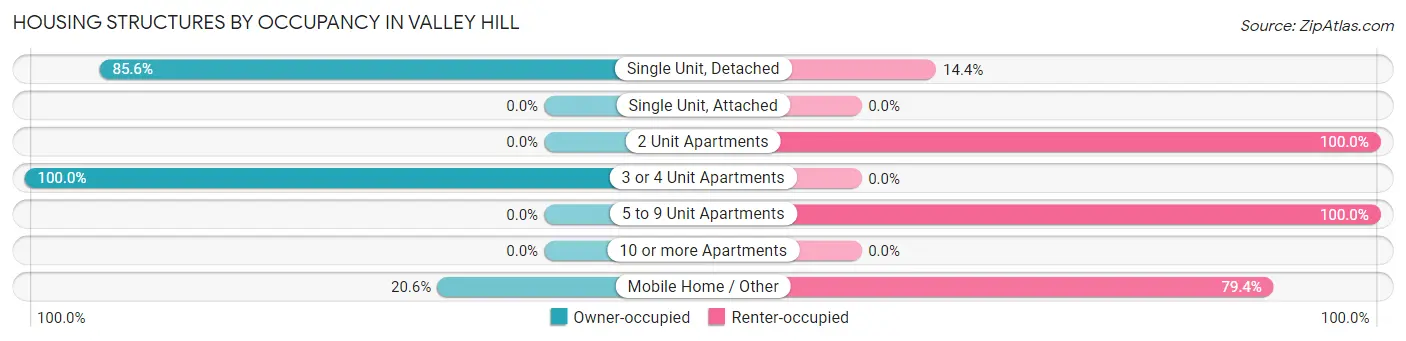
| Structure Type | Owner-occupied | Renter-occupied |
| Single Unit, Detached | 741 (85.6%) | 125 (14.4%) |
| Single Unit, Attached | 0 (0.0%) | 0 (0.0%) |
| 2 Unit Apartments | 0 (0.0%) | 30 (100.0%) |
| 3 or 4 Unit Apartments | 22 (100.0%) | 0 (0.0%) |
| 5 to 9 Unit Apartments | 0 (0.0%) | 25 (100.0%) |
| 10 or more Apartments | 0 (0.0%) | 0 (0.0%) |
| Mobile Home / Other | 14 (20.6%) | 54 (79.4%) |
| Total | 777 (76.8%) | 234 (23.2%) |
Housing Structures by Number of Rooms in Valley Hill
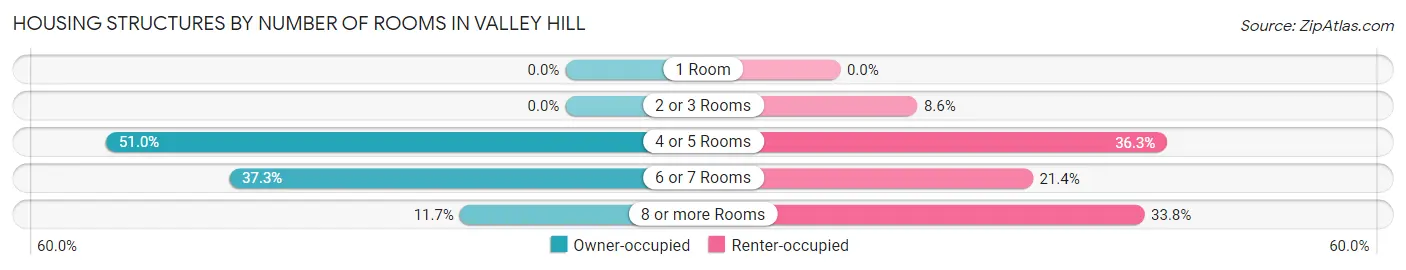
| Number of Rooms | Owner-occupied | Renter-occupied |
| 1 Room | 0 (0.0%) | 0 (0.0%) |
| 2 or 3 Rooms | 0 (0.0%) | 20 (8.6%) |
| 4 or 5 Rooms | 396 (51.0%) | 85 (36.3%) |
| 6 or 7 Rooms | 290 (37.3%) | 50 (21.4%) |
| 8 or more Rooms | 91 (11.7%) | 79 (33.8%) |
| Total | 777 (100.0%) | 234 (100.0%) |
Housing Structure by Heating Type in Valley Hill
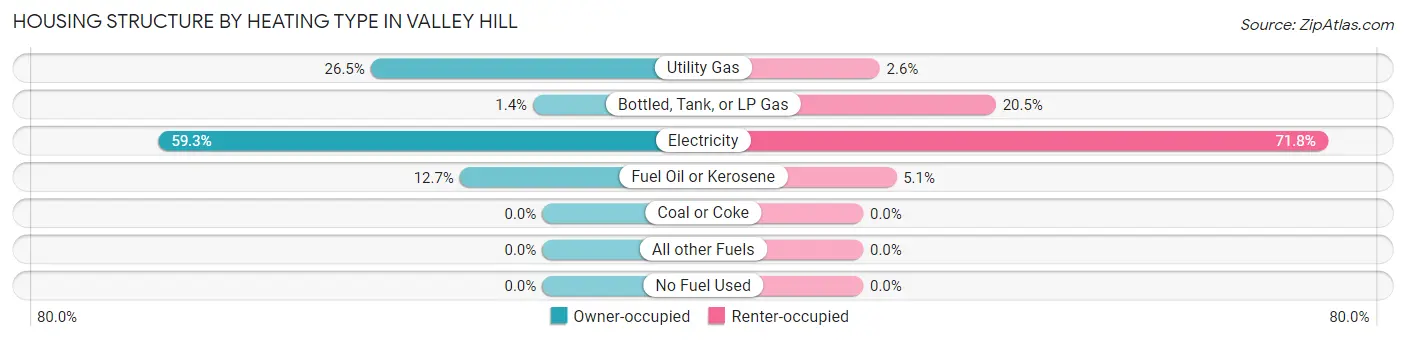
| Heating Type | Owner-occupied | Renter-occupied |
| Utility Gas | 206 (26.5%) | 6 (2.6%) |
| Bottled, Tank, or LP Gas | 11 (1.4%) | 48 (20.5%) |
| Electricity | 461 (59.3%) | 168 (71.8%) |
| Fuel Oil or Kerosene | 99 (12.7%) | 12 (5.1%) |
| Coal or Coke | 0 (0.0%) | 0 (0.0%) |
| All other Fuels | 0 (0.0%) | 0 (0.0%) |
| No Fuel Used | 0 (0.0%) | 0 (0.0%) |
| Total | 777 (100.0%) | 234 (100.0%) |
Household Vehicle Usage in Valley Hill
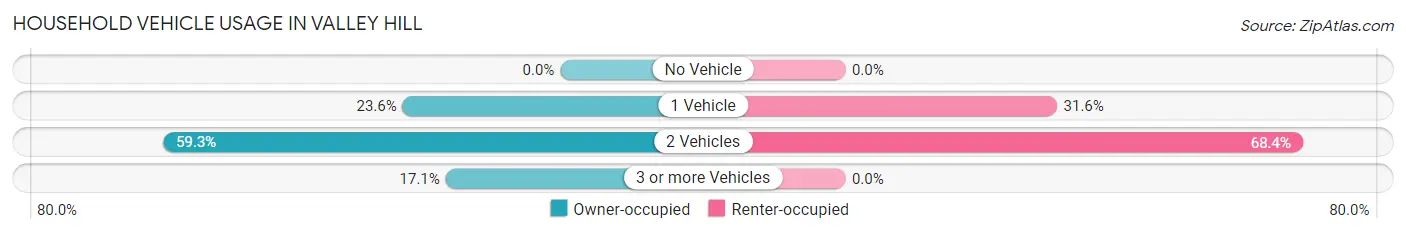
| Vehicles per Household | Owner-occupied | Renter-occupied |
| No Vehicle | 0 (0.0%) | 0 (0.0%) |
| 1 Vehicle | 183 (23.5%) | 74 (31.6%) |
| 2 Vehicles | 461 (59.3%) | 160 (68.4%) |
| 3 or more Vehicles | 133 (17.1%) | 0 (0.0%) |
| Total | 777 (100.0%) | 234 (100.0%) |
Real Estate & Mortgages in Valley Hill
Real Estate and Mortgage Overview in Valley Hill
| Characteristic | Without Mortgage | With Mortgage |
| Housing Units | 230 | 547 |
| Median Property Value | $311,800 | $276,200 |
| Median Household Income | $69,000 | $151 |
| Monthly Housing Costs | $352 | $0 |
| Real Estate Taxes | $1,202 | $0 |
Property Value by Mortgage Status in Valley Hill
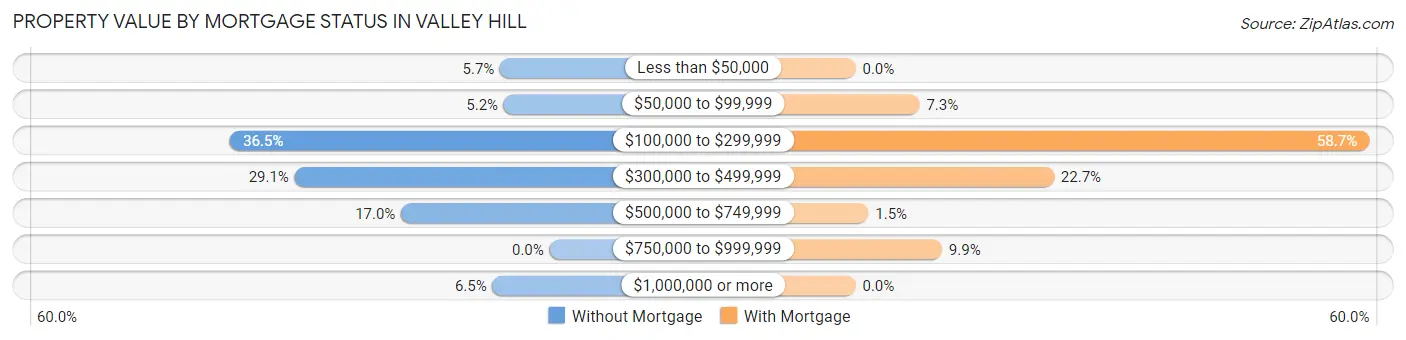
| Property Value | Without Mortgage | With Mortgage |
| Less than $50,000 | 13 (5.7%) | 0 (0.0%) |
| $50,000 to $99,999 | 12 (5.2%) | 40 (7.3%) |
| $100,000 to $299,999 | 84 (36.5%) | 321 (58.7%) |
| $300,000 to $499,999 | 67 (29.1%) | 124 (22.7%) |
| $500,000 to $749,999 | 39 (17.0%) | 8 (1.5%) |
| $750,000 to $999,999 | 0 (0.0%) | 54 (9.9%) |
| $1,000,000 or more | 15 (6.5%) | 0 (0.0%) |
| Total | 230 (100.0%) | 547 (100.0%) |
Household Income by Mortgage Status in Valley Hill
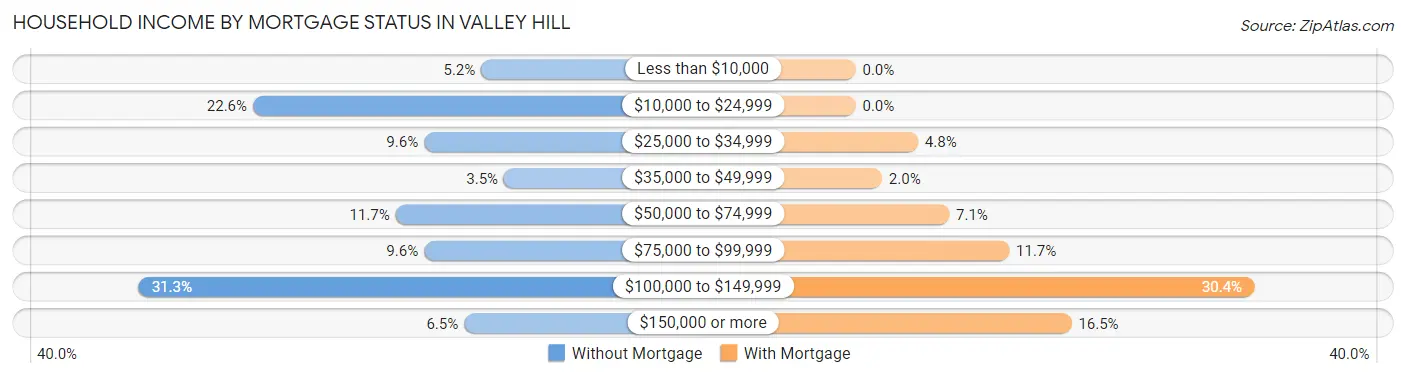
| Household Income | Without Mortgage | With Mortgage |
| Less than $10,000 | 12 (5.2%) | 0 (0.0%) |
| $10,000 to $24,999 | 52 (22.6%) | 0 (0.0%) |
| $25,000 to $34,999 | 22 (9.6%) | 26 (4.8%) |
| $35,000 to $49,999 | 8 (3.5%) | 11 (2.0%) |
| $50,000 to $74,999 | 27 (11.7%) | 39 (7.1%) |
| $75,000 to $99,999 | 22 (9.6%) | 64 (11.7%) |
| $100,000 to $149,999 | 72 (31.3%) | 166 (30.3%) |
| $150,000 or more | 15 (6.5%) | 90 (16.5%) |
| Total | 230 (100.0%) | 547 (100.0%) |
Property Value to Household Income Ratio in Valley Hill
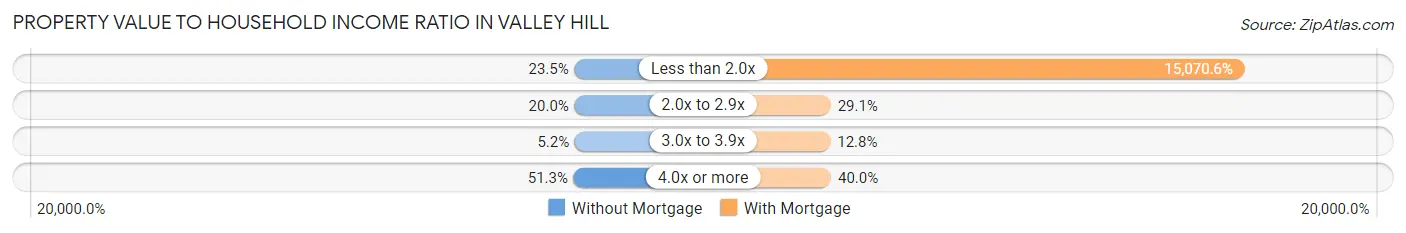
| Value-to-Income Ratio | Without Mortgage | With Mortgage |
| Less than 2.0x | 54 (23.5%) | 82,436 (15,070.6%) |
| 2.0x to 2.9x | 46 (20.0%) | 159 (29.1%) |
| 3.0x to 3.9x | 12 (5.2%) | 70 (12.8%) |
| 4.0x or more | 118 (51.3%) | 219 (40.0%) |
| Total | 230 (100.0%) | 547 (100.0%) |
Real Estate Taxes by Mortgage Status in Valley Hill
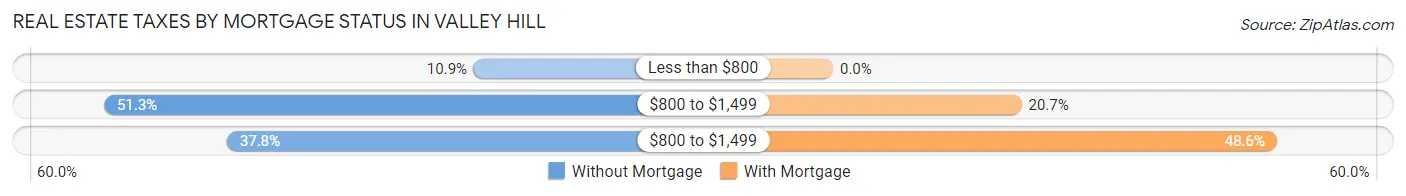
| Property Taxes | Without Mortgage | With Mortgage |
| Less than $800 | 25 (10.9%) | 0 (0.0%) |
| $800 to $1,499 | 118 (51.3%) | 113 (20.7%) |
| $800 to $1,499 | 87 (37.8%) | 266 (48.6%) |
| Total | 230 (100.0%) | 547 (100.0%) |
Health & Disability in Valley Hill
Health Insurance Coverage by Age in Valley Hill
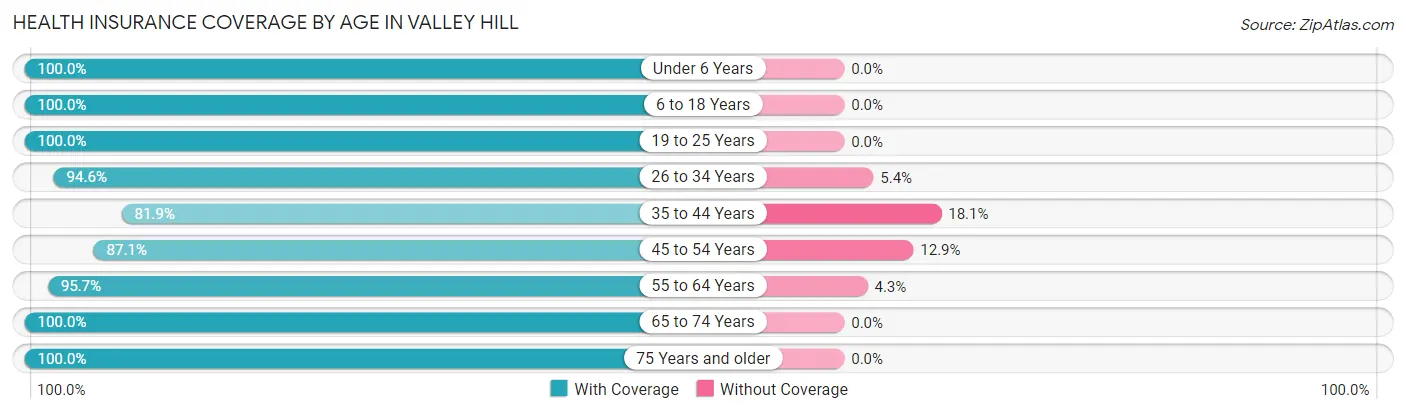
| Age Bracket | With Coverage | Without Coverage |
| Under 6 Years | 252 (100.0%) | 0 (0.0%) |
| 6 to 18 Years | 205 (100.0%) | 0 (0.0%) |
| 19 to 25 Years | 114 (100.0%) | 0 (0.0%) |
| 26 to 34 Years | 227 (94.6%) | 13 (5.4%) |
| 35 to 44 Years | 240 (81.9%) | 53 (18.1%) |
| 45 to 54 Years | 203 (87.1%) | 30 (12.9%) |
| 55 to 64 Years | 508 (95.7%) | 23 (4.3%) |
| 65 to 74 Years | 236 (100.0%) | 0 (0.0%) |
| 75 Years and older | 281 (100.0%) | 0 (0.0%) |
| Total | 2,266 (95.0%) | 119 (5.0%) |
Health Insurance Coverage by Citizenship Status in Valley Hill
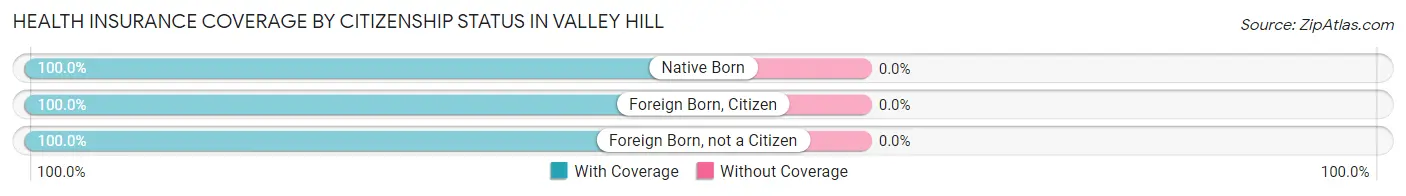
| Citizenship Status | With Coverage | Without Coverage |
| Native Born | 252 (100.0%) | 0 (0.0%) |
| Foreign Born, Citizen | 205 (100.0%) | 0 (0.0%) |
| Foreign Born, not a Citizen | 114 (100.0%) | 0 (0.0%) |
Health Insurance Coverage by Household Income in Valley Hill
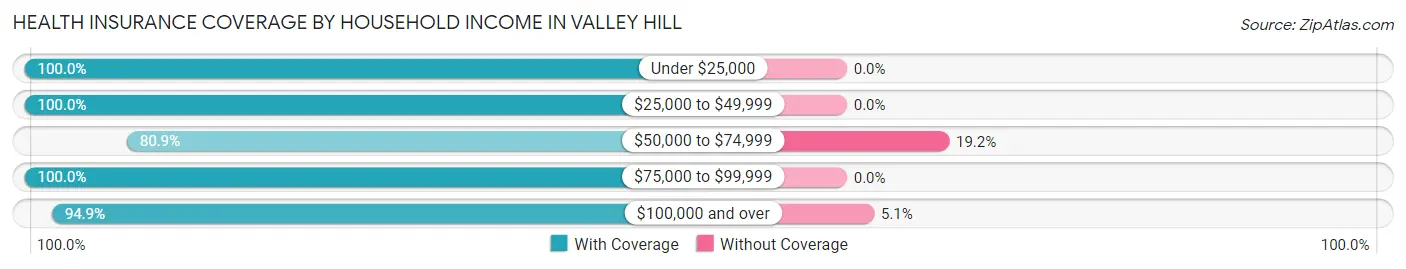
| Household Income | With Coverage | Without Coverage |
| Under $25,000 | 184 (100.0%) | 0 (0.0%) |
| $25,000 to $49,999 | 160 (100.0%) | 0 (0.0%) |
| $50,000 to $74,999 | 266 (80.8%) | 63 (19.2%) |
| $75,000 to $99,999 | 606 (100.0%) | 0 (0.0%) |
| $100,000 and over | 1,041 (94.9%) | 56 (5.1%) |
Public vs Private Health Insurance Coverage by Age in Valley Hill
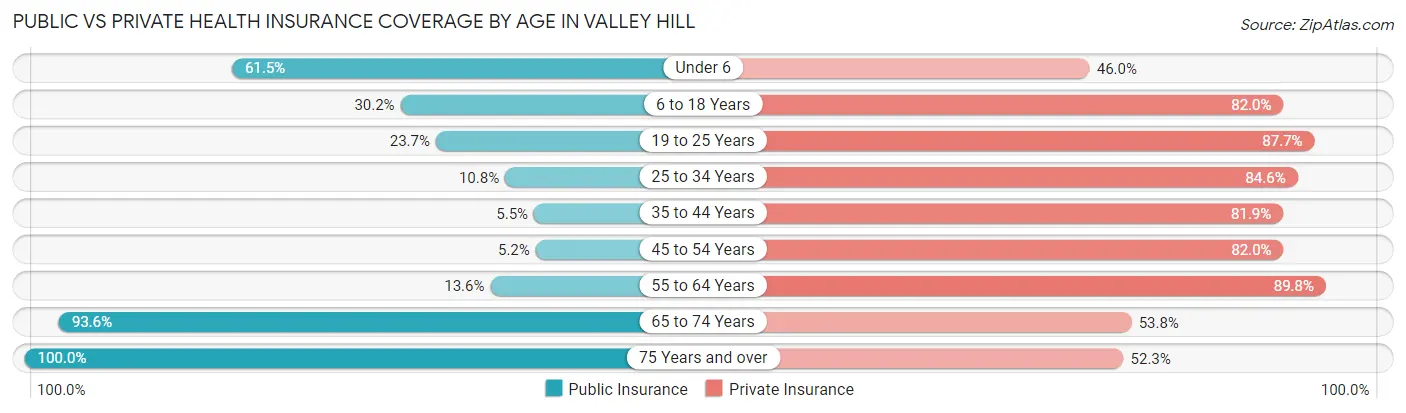
| Age Bracket | Public Insurance | Private Insurance |
| Under 6 | 155 (61.5%) | 116 (46.0%) |
| 6 to 18 Years | 62 (30.2%) | 168 (82.0%) |
| 19 to 25 Years | 27 (23.7%) | 100 (87.7%) |
| 25 to 34 Years | 26 (10.8%) | 203 (84.6%) |
| 35 to 44 Years | 16 (5.5%) | 240 (81.9%) |
| 45 to 54 Years | 12 (5.1%) | 191 (82.0%) |
| 55 to 64 Years | 72 (13.6%) | 477 (89.8%) |
| 65 to 74 Years | 221 (93.6%) | 127 (53.8%) |
| 75 Years and over | 281 (100.0%) | 147 (52.3%) |
| Total | 872 (36.6%) | 1,769 (74.2%) |
Disability Status by Sex by Age in Valley Hill
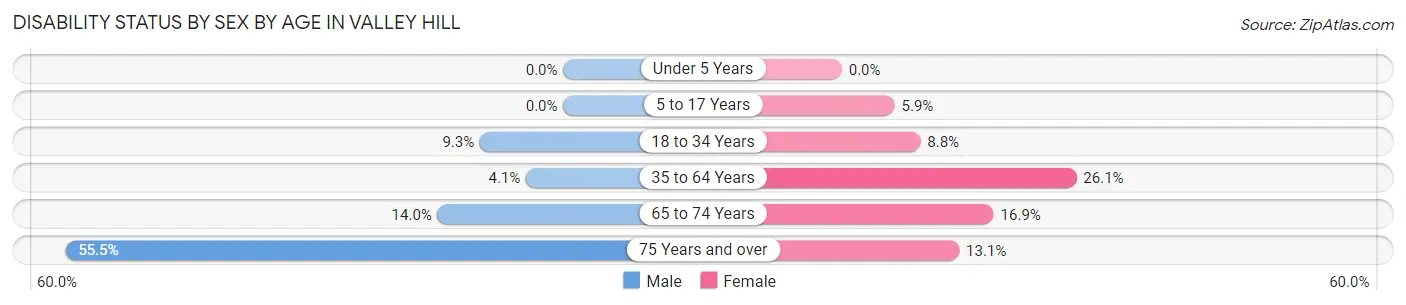
| Age Bracket | Male | Female |
| Under 5 Years | 0 (0.0%) | 0 (0.0%) |
| 5 to 17 Years | 0 (0.0%) | 8 (5.9%) |
| 18 to 34 Years | 18 (9.3%) | 14 (8.7%) |
| 35 to 64 Years | 20 (4.1%) | 150 (26.1%) |
| 65 to 74 Years | 14 (14.0%) | 23 (16.9%) |
| 75 Years and over | 71 (55.5%) | 20 (13.1%) |
Disability Class by Sex by Age in Valley Hill
Disability Class: Hearing Difficulty
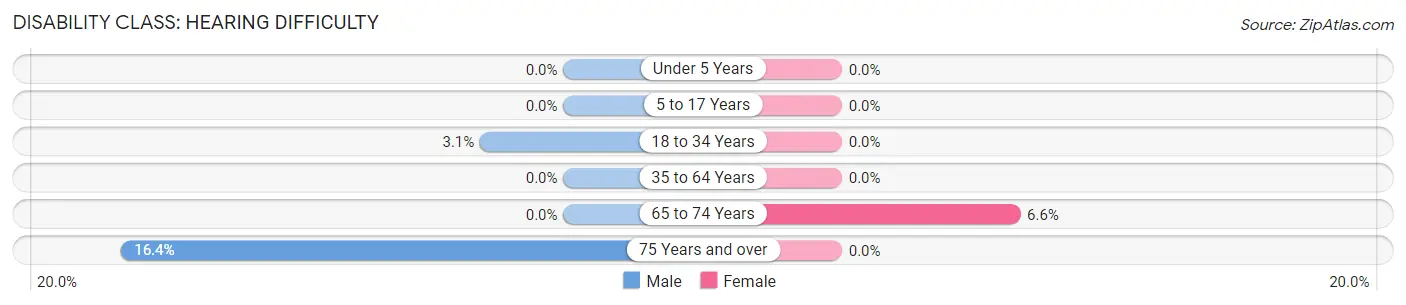
| Age Bracket | Male | Female |
| Under 5 Years | 0 (0.0%) | 0 (0.0%) |
| 5 to 17 Years | 0 (0.0%) | 0 (0.0%) |
| 18 to 34 Years | 6 (3.1%) | 0 (0.0%) |
| 35 to 64 Years | 0 (0.0%) | 0 (0.0%) |
| 65 to 74 Years | 0 (0.0%) | 9 (6.6%) |
| 75 Years and over | 21 (16.4%) | 0 (0.0%) |
Disability Class: Vision Difficulty
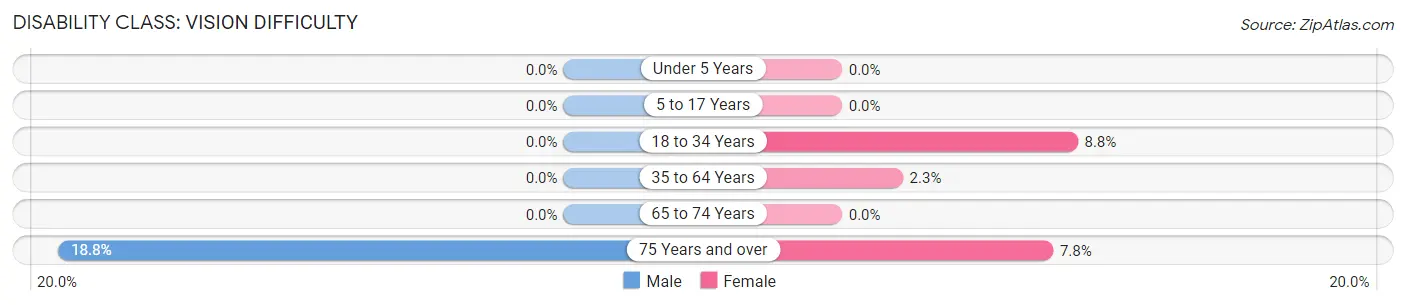
| Age Bracket | Male | Female |
| Under 5 Years | 0 (0.0%) | 0 (0.0%) |
| 5 to 17 Years | 0 (0.0%) | 0 (0.0%) |
| 18 to 34 Years | 0 (0.0%) | 14 (8.7%) |
| 35 to 64 Years | 0 (0.0%) | 13 (2.3%) |
| 65 to 74 Years | 0 (0.0%) | 0 (0.0%) |
| 75 Years and over | 24 (18.8%) | 12 (7.8%) |
Disability Class: Cognitive Difficulty
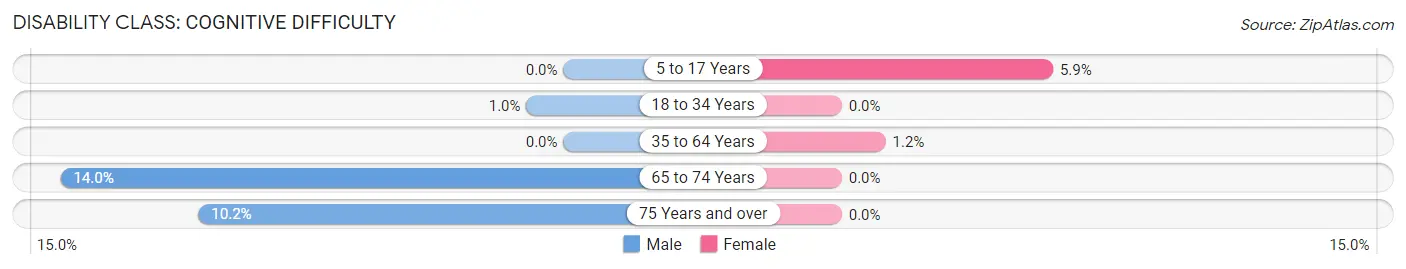
| Age Bracket | Male | Female |
| 5 to 17 Years | 0 (0.0%) | 8 (5.9%) |
| 18 to 34 Years | 2 (1.0%) | 0 (0.0%) |
| 35 to 64 Years | 0 (0.0%) | 7 (1.2%) |
| 65 to 74 Years | 14 (14.0%) | 0 (0.0%) |
| 75 Years and over | 13 (10.2%) | 0 (0.0%) |
Disability Class: Ambulatory Difficulty
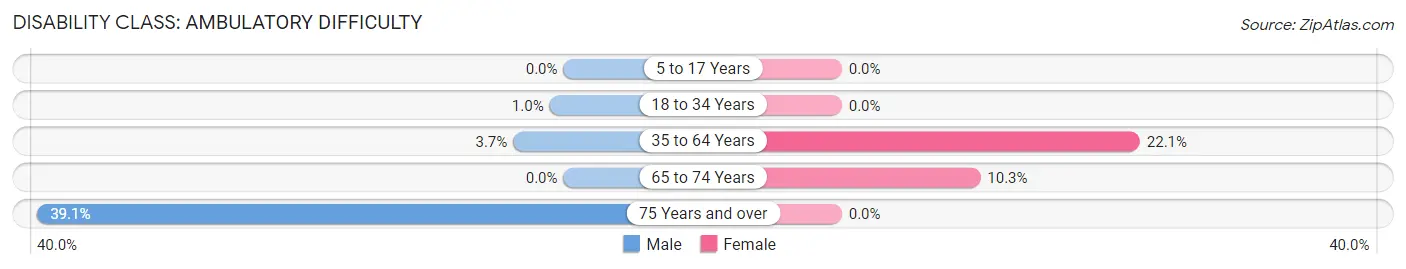
| Age Bracket | Male | Female |
| 5 to 17 Years | 0 (0.0%) | 0 (0.0%) |
| 18 to 34 Years | 2 (1.0%) | 0 (0.0%) |
| 35 to 64 Years | 18 (3.7%) | 127 (22.1%) |
| 65 to 74 Years | 0 (0.0%) | 14 (10.3%) |
| 75 Years and over | 50 (39.1%) | 0 (0.0%) |
Disability Class: Self-Care Difficulty
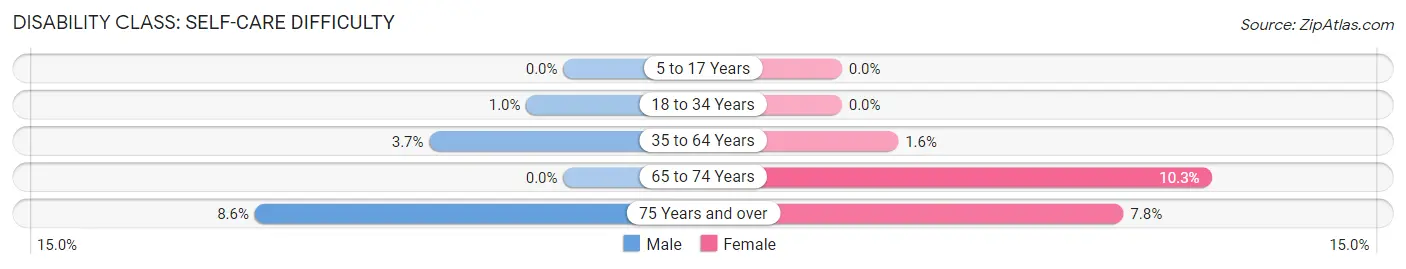
| Age Bracket | Male | Female |
| 5 to 17 Years | 0 (0.0%) | 0 (0.0%) |
| 18 to 34 Years | 2 (1.0%) | 0 (0.0%) |
| 35 to 64 Years | 18 (3.7%) | 9 (1.6%) |
| 65 to 74 Years | 0 (0.0%) | 14 (10.3%) |
| 75 Years and over | 11 (8.6%) | 12 (7.8%) |
Technology Access in Valley Hill
Computing Device Access in Valley Hill
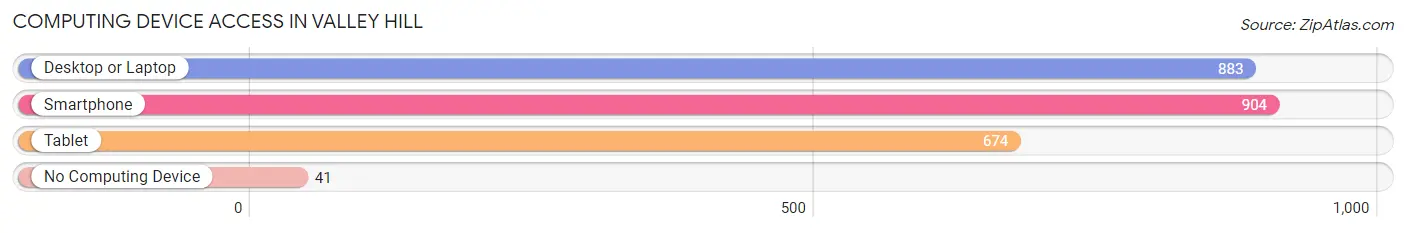
| Device Type | # Households | % Households |
| Desktop or Laptop | 883 | 87.3% |
| Smartphone | 904 | 89.4% |
| Tablet | 674 | 66.7% |
| No Computing Device | 41 | 4.1% |
| Total | 1,011 | 100.0% |
Internet Access in Valley Hill
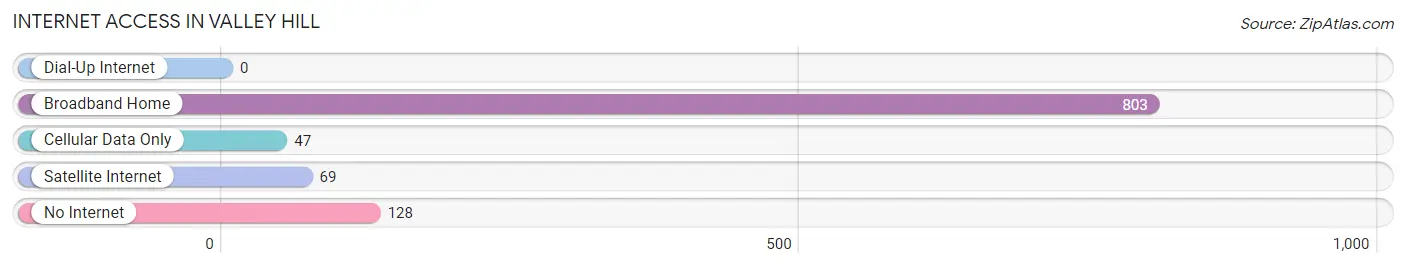
| Internet Type | # Households | % Households |
| Dial-Up Internet | 0 | 0.0% |
| Broadband Home | 803 | 79.4% |
| Cellular Data Only | 47 | 4.6% |
| Satellite Internet | 69 | 6.8% |
| No Internet | 128 | 12.7% |
| Total | 1,011 | 100.0% |
Valley Hill Summary
Valley Hill is a small unincorporated community located in Henderson County, North Carolina. It is situated in the Blue Ridge Mountains, approximately 20 miles south of Asheville. The community is home to a population of approximately 1,000 people, and is known for its rural charm and scenic beauty.
History
Valley Hill was first settled in the late 1700s by a group of settlers from Virginia. The community was originally known as “Valley Hill” due to its location in a valley between two hills. The first post office was established in 1883, and the community was officially incorporated in 1891.
In the early 1900s, Valley Hill was a thriving agricultural community, with many of its residents working in the local tobacco and cotton industries. The community also had a number of small businesses, including a general store, a blacksmith shop, and a grist mill.
In the 1950s, the community began to decline as many of its residents moved away in search of better economic opportunities. By the 1970s, the population had dropped to just over 500 people.
Geography
Valley Hill is located in the Blue Ridge Mountains of western North Carolina. The community is situated in a valley between two hills, and is surrounded by the Pisgah National Forest. The area is known for its scenic beauty, with rolling hills, lush forests, and numerous creeks and streams.
The climate in Valley Hill is mild, with temperatures ranging from the mid-30s in the winter to the mid-80s in the summer. The area receives an average of 45 inches of rain per year, and is known for its mild winters and warm summers.
Economy
The economy of Valley Hill is largely based on tourism and agriculture. The area is home to several small farms, which produce a variety of crops, including corn, soybeans, and tobacco. The community also has a number of small businesses, including restaurants, antique stores, and gift shops.
In recent years, the community has seen an increase in tourism, as visitors come to enjoy the area’s scenic beauty and outdoor activities. The community is home to several popular attractions, including the Valley Hill Country Club, the Valley Hill Golf Course, and the Valley Hill State Park.
Demographics
As of the 2010 census, the population of Valley Hill was 1,000 people. The racial makeup of the community was 97.2% White, 0.7% African American, 0.3% Native American, 0.2% Asian, and 1.6% from other races. The median household income was $37,500, and the median age was 44.
Valley Hill is a small, rural community with a strong sense of community and a commitment to preserving its rural charm. The area is known for its scenic beauty and outdoor activities, and is a popular destination for visitors looking to escape the hustle and bustle of city life.
Common Questions
What is Per Capita Income in Valley Hill?
Per Capita income in Valley Hill is $41,681.
What is the Median Family Income in Valley Hill?
Median Family Income in Valley Hill is $95,855.
What is the Median Household income in Valley Hill?
Median Household Income in Valley Hill is $82,436.
What is Income or Wage Gap in Valley Hill?
Income or Wage Gap in Valley Hill is 54.3%.
Women in Valley Hill earn 45.7 cents for every dollar earned by a man.
What is Inequality or Gini Index in Valley Hill?
Inequality or Gini Index in Valley Hill is 0.39.
What is the Total Population of Valley Hill?
Total Population of Valley Hill is 2,417.
What is the Total Male Population of Valley Hill?
Total Male Population of Valley Hill is 1,109.
What is the Total Female Population of Valley Hill?
Total Female Population of Valley Hill is 1,308.
What is the Ratio of Males per 100 Females in Valley Hill?
There are 84.79 Males per 100 Females in Valley Hill.
What is the Ratio of Females per 100 Males in Valley Hill?
There are 117.94 Females per 100 Males in Valley Hill.
What is the Median Population Age in Valley Hill?
Median Population Age in Valley Hill is 47.7 Years.
What is the Average Family Size in Valley Hill
Average Family Size in Valley Hill is 2.7 People.
What is the Average Household Size in Valley Hill
Average Household Size in Valley Hill is 2.4 People.
How Large is the Labor Force in Valley Hill?
There are 1,225 People in the Labor Forcein in Valley Hill.
What is the Percentage of People in the Labor Force in Valley Hill?
62.2% of People are in the Labor Force in Valley Hill.