Bryson City, NC Map & Demographics
Bryson City Map
Bryson City Overview
$24,001
PER CAPITA INCOME
$83,750
AVG FAMILY INCOME
$41,542
AVG HOUSEHOLD INCOME
25.2%
WAGE / INCOME GAP [ % ]
74.8¢/ $1
WAGE / INCOME GAP [ $ ]
0.43
INEQUALITY / GINI INDEX
1,638
TOTAL POPULATION
731
MALE POPULATION
907
FEMALE POPULATION
80.60
MALES / 100 FEMALES
124.08
FEMALES / 100 MALES
39.9
MEDIAN AGE
3.0
AVG FAMILY SIZE
2.3
AVG HOUSEHOLD SIZE
718
LABOR FORCE [ PEOPLE ]
55.5%
PERCENT IN LABOR FORCE
1.0%
UNEMPLOYMENT RATE
Bryson City Zip Codes
Bryson City Area Codes
Income in Bryson City
Income Overview in Bryson City
Per Capita Income in Bryson City is $24,001, while median incomes of families and households are $83,750 and $41,542 respectively.
| Characteristic | Number | Measure |
| Per Capita Income | 1,638 | $24,001 |
| Median Family Income | 376 | $83,750 |
| Mean Family Income | 376 | $83,327 |
| Median Household Income | 643 | $41,542 |
| Mean Household Income | 643 | $59,888 |
| Income Deficit | 376 | $0 |
| Wage / Income Gap (%) | 1,638 | 25.22% |
| Wage / Income Gap ($) | 1,638 | 74.78¢ per $1 |
| Gini / Inequality Index | 1,638 | 0.43 |
Earnings by Sex in Bryson City
Average Earnings in Bryson City are $28,021, $29,613 for men and $22,146 for women, a difference of 25.2%.
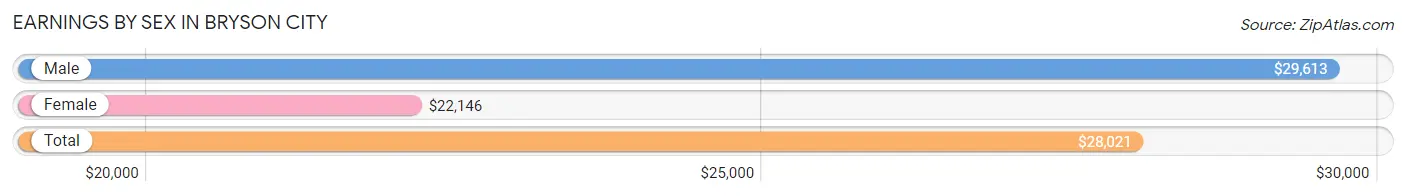
| Sex | Number | Average Earnings |
| Male | 351 (46.1%) | $29,613 |
| Female | 411 (53.9%) | $22,146 |
| Total | 762 (100.0%) | $28,021 |
Earnings by Sex by Income Bracket in Bryson City
The most common earnings brackets in Bryson City are $25,000 to $29,999 for men (42 | 12.0%) and $20,000 to $22,499 for women (60 | 14.6%).
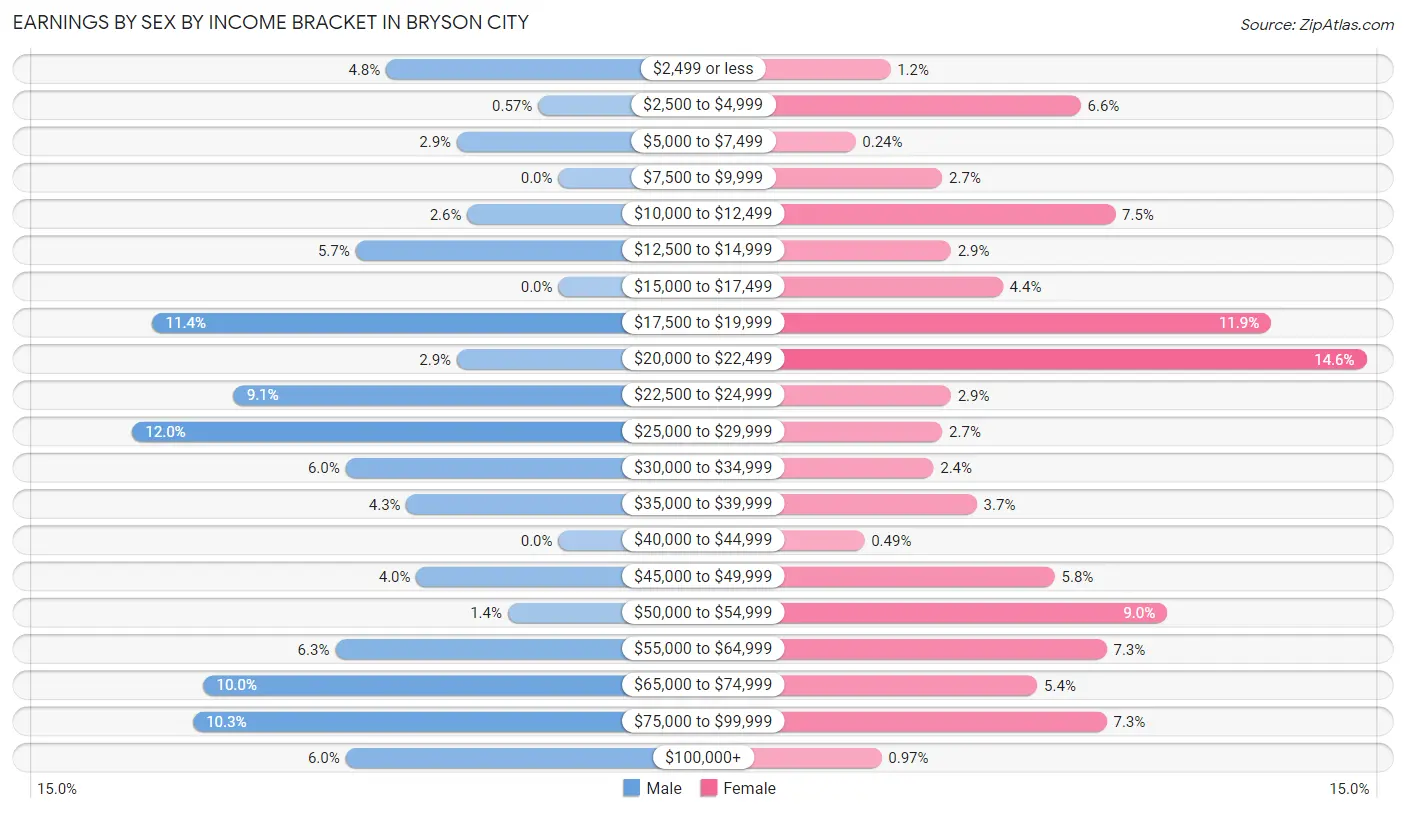
| Income | Male | Female |
| $2,499 or less | 17 (4.8%) | 5 (1.2%) |
| $2,500 to $4,999 | 2 (0.6%) | 27 (6.6%) |
| $5,000 to $7,499 | 10 (2.9%) | 1 (0.2%) |
| $7,500 to $9,999 | 0 (0.0%) | 11 (2.7%) |
| $10,000 to $12,499 | 9 (2.6%) | 31 (7.5%) |
| $12,500 to $14,999 | 20 (5.7%) | 12 (2.9%) |
| $15,000 to $17,499 | 0 (0.0%) | 18 (4.4%) |
| $17,500 to $19,999 | 40 (11.4%) | 49 (11.9%) |
| $20,000 to $22,499 | 10 (2.9%) | 60 (14.6%) |
| $22,500 to $24,999 | 32 (9.1%) | 12 (2.9%) |
| $25,000 to $29,999 | 42 (12.0%) | 11 (2.7%) |
| $30,000 to $34,999 | 21 (6.0%) | 10 (2.4%) |
| $35,000 to $39,999 | 15 (4.3%) | 15 (3.6%) |
| $40,000 to $44,999 | 0 (0.0%) | 2 (0.5%) |
| $45,000 to $49,999 | 14 (4.0%) | 24 (5.8%) |
| $50,000 to $54,999 | 5 (1.4%) | 37 (9.0%) |
| $55,000 to $64,999 | 22 (6.3%) | 30 (7.3%) |
| $65,000 to $74,999 | 35 (10.0%) | 22 (5.3%) |
| $75,000 to $99,999 | 36 (10.3%) | 30 (7.3%) |
| $100,000+ | 21 (6.0%) | 4 (1.0%) |
| Total | 351 (100.0%) | 411 (100.0%) |
Earnings by Sex by Educational Attainment in Bryson City
Average earnings in Bryson City are $32,500 for men and $33,250 for women, a difference of 2.3%. Men with an educational attainment of bachelor's degree enjoy the highest average annual earnings of $75,417, while those with college or associate's degree education earn the least with $28,750. Women with an educational attainment of bachelor's degree earn the most with the average annual earnings of $50,733, while those with college or associate's degree education have the smallest earnings of $21,714.
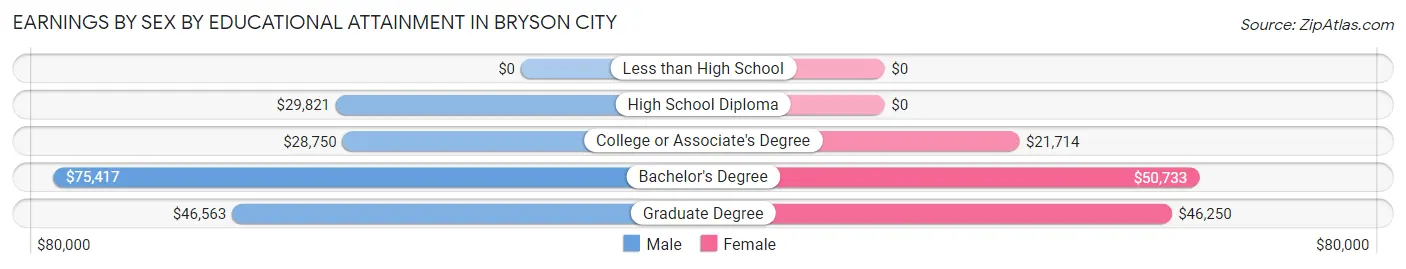
| Educational Attainment | Male Income | Female Income |
| Less than High School | - | - |
| High School Diploma | $29,821 | $0 |
| College or Associate's Degree | $28,750 | $21,714 |
| Bachelor's Degree | $75,417 | $50,733 |
| Graduate Degree | $46,563 | $46,250 |
| Total | $32,500 | $33,250 |
Family Income in Bryson City
Family Income Brackets in Bryson City
According to the Bryson City family income data, there are 114 families falling into the $75,000 to $99,999 income range, which is the most common income bracket and makes up 30.3% of all families.
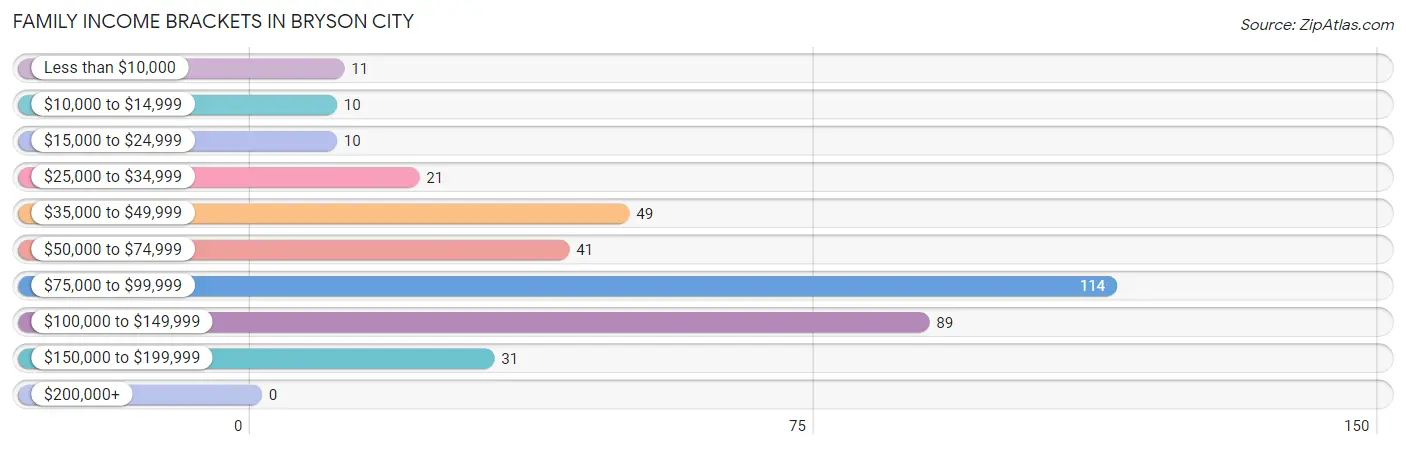
| Income Bracket | # Families | % Families |
| Less than $10,000 | 11 | 2.9% |
| $10,000 to $14,999 | 10 | 2.7% |
| $15,000 to $24,999 | 10 | 2.7% |
| $25,000 to $34,999 | 21 | 5.6% |
| $35,000 to $49,999 | 49 | 13.0% |
| $50,000 to $74,999 | 41 | 10.9% |
| $75,000 to $99,999 | 114 | 30.3% |
| $100,000 to $149,999 | 89 | 23.7% |
| $150,000 to $199,999 | 31 | 8.2% |
| $200,000+ | 0 | 0.0% |
Family Income by Famaliy Size in Bryson City
6-person families (31 | 8.2%) account for the highest median family income in Bryson City with $105,655 per family, while 2-person families (199 | 52.9%) have the highest median income of $46,454 per family member.
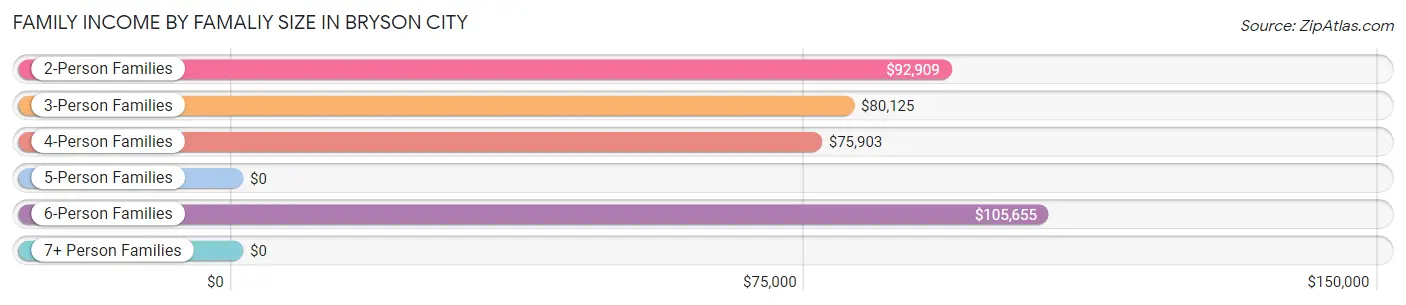
| Income Bracket | # Families | Median Income |
| 2-Person Families | 199 (52.9%) | $92,909 |
| 3-Person Families | 91 (24.2%) | $80,125 |
| 4-Person Families | 55 (14.6%) | $75,903 |
| 5-Person Families | 0 (0.0%) | $0 |
| 6-Person Families | 31 (8.2%) | $105,655 |
| 7+ Person Families | 0 (0.0%) | $0 |
| Total | 376 (100.0%) | $83,750 |
Family Income by Number of Earners in Bryson City
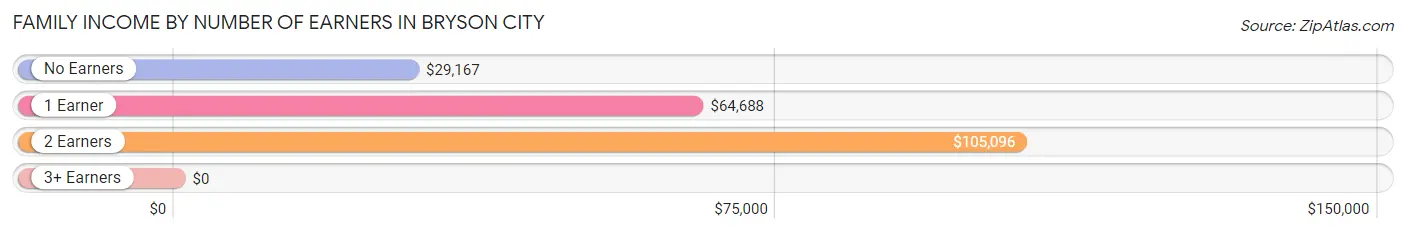
| Number of Earners | # Families | Median Income |
| No Earners | 54 (14.4%) | $29,167 |
| 1 Earner | 90 (23.9%) | $64,688 |
| 2 Earners | 219 (58.2%) | $105,096 |
| 3+ Earners | 13 (3.5%) | $0 |
| Total | 376 (100.0%) | $83,750 |
Household Income in Bryson City
Household Income Brackets in Bryson City
With 133 households falling in the category, the $75,000 to $99,999 income range is the most frequent in Bryson City, accounting for 20.7% of all households. In contrast, only 3 households (0.5%) fall into the $200,000+ income bracket, making it the least populous group.
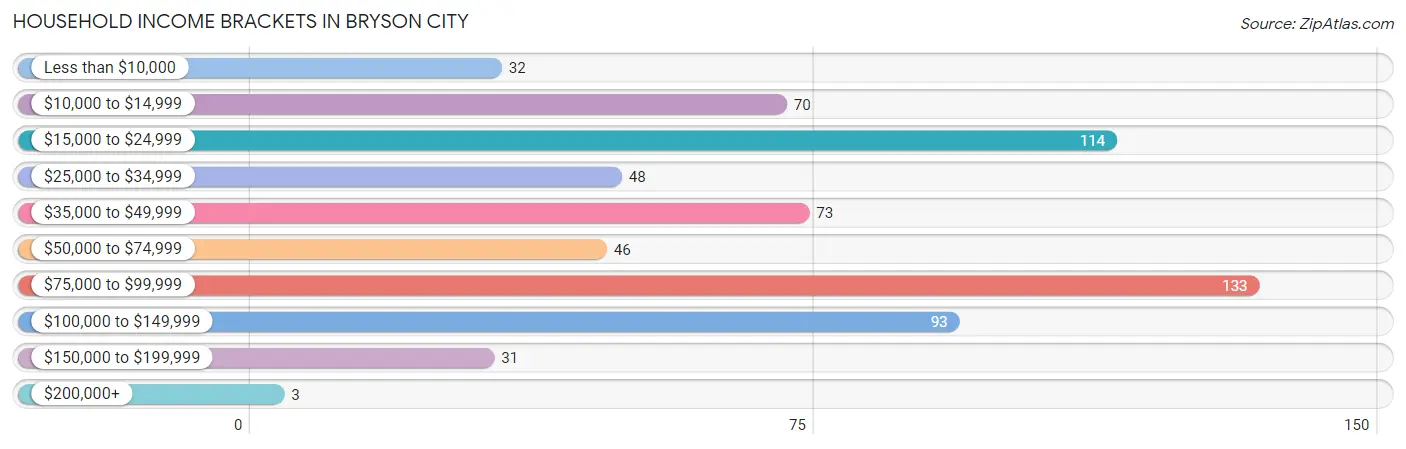
| Income Bracket | # Households | % Households |
| Less than $10,000 | 32 | 5.0% |
| $10,000 to $14,999 | 70 | 10.9% |
| $15,000 to $24,999 | 114 | 17.7% |
| $25,000 to $34,999 | 48 | 7.5% |
| $35,000 to $49,999 | 73 | 11.4% |
| $50,000 to $74,999 | 46 | 7.2% |
| $75,000 to $99,999 | 133 | 20.7% |
| $100,000 to $149,999 | 93 | 14.5% |
| $150,000 to $199,999 | 31 | 4.8% |
| $200,000+ | 3 | 0.5% |
Household Income by Householder Age in Bryson City
The median household income in Bryson City is $41,542, with the highest median household income of $77,450 found in the 25 to 44 years age bracket for the primary householder. A total of 208 households (32.4%) fall into this category. Meanwhile, the 65+ years age bracket for the primary householder has the lowest median household income of $27,935, with 242 households (37.6%) in this group.
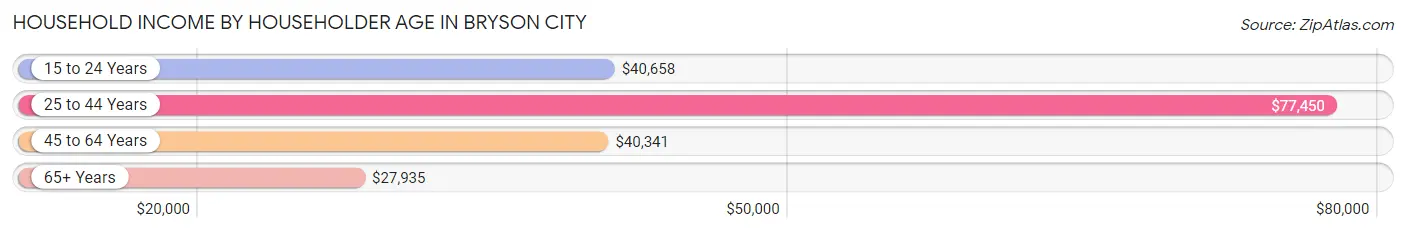
| Income Bracket | # Households | Median Income |
| 15 to 24 Years | 36 (5.6%) | $40,658 |
| 25 to 44 Years | 208 (32.4%) | $77,450 |
| 45 to 64 Years | 157 (24.4%) | $40,341 |
| 65+ Years | 242 (37.6%) | $27,935 |
| Total | 643 (100.0%) | $41,542 |
Poverty in Bryson City
Income Below Poverty by Sex and Age in Bryson City
With 16.6% poverty level for males and 15.6% for females among the residents of Bryson City, 16 and 17 year old males and 12 to 14 year old females are the most vulnerable to poverty, with 2 males (100.0%) and 21 females (46.7%) in their respective age groups living below the poverty level.
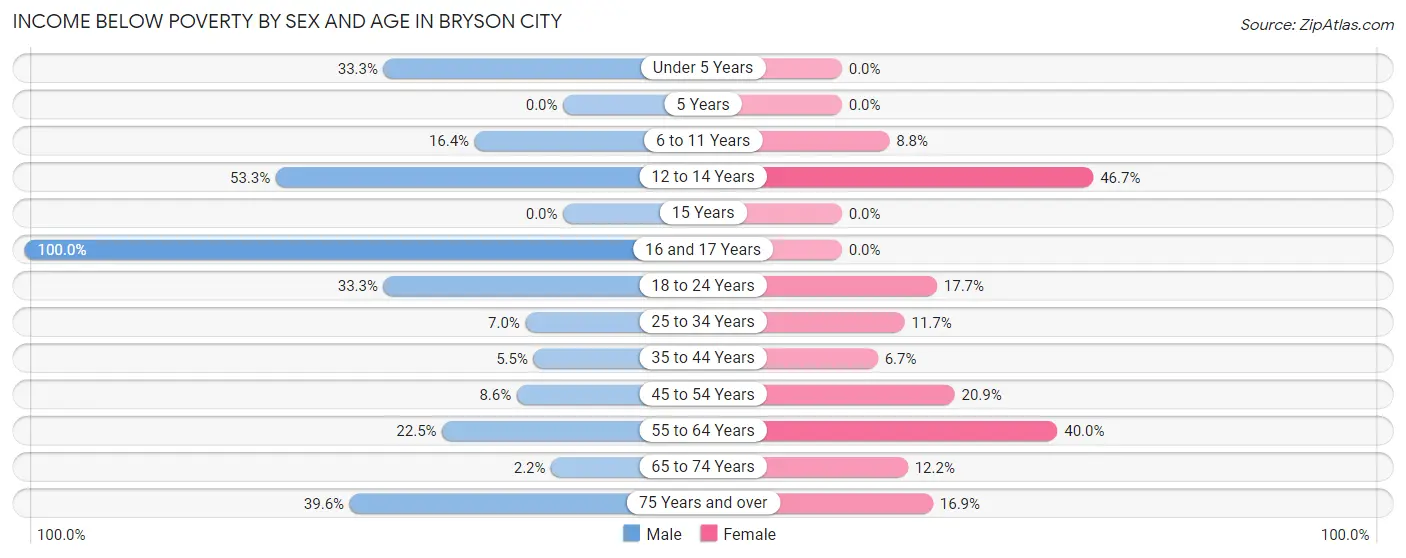
| Age Bracket | Male | Female |
| Under 5 Years | 13 (33.3%) | 0 (0.0%) |
| 5 Years | 0 (0.0%) | 0 (0.0%) |
| 6 to 11 Years | 21 (16.4%) | 6 (8.8%) |
| 12 to 14 Years | 8 (53.3%) | 21 (46.7%) |
| 15 Years | 0 (0.0%) | 0 (0.0%) |
| 16 and 17 Years | 2 (100.0%) | 0 (0.0%) |
| 18 to 24 Years | 14 (33.3%) | 12 (17.6%) |
| 25 to 34 Years | 7 (7.0%) | 12 (11.7%) |
| 35 to 44 Years | 5 (5.5%) | 8 (6.7%) |
| 45 to 54 Years | 8 (8.6%) | 18 (20.9%) |
| 55 to 64 Years | 11 (22.5%) | 22 (40.0%) |
| 65 to 74 Years | 1 (2.2%) | 18 (12.2%) |
| 75 Years and over | 21 (39.6%) | 12 (16.9%) |
| Total | 111 (16.6%) | 129 (15.6%) |
Income Above Poverty by Sex and Age in Bryson City
According to the poverty statistics in Bryson City, males aged 15 years and females aged under 5 years are the age groups that are most secure financially, with 100.0% of males and 100.0% of females in these age groups living above the poverty line.
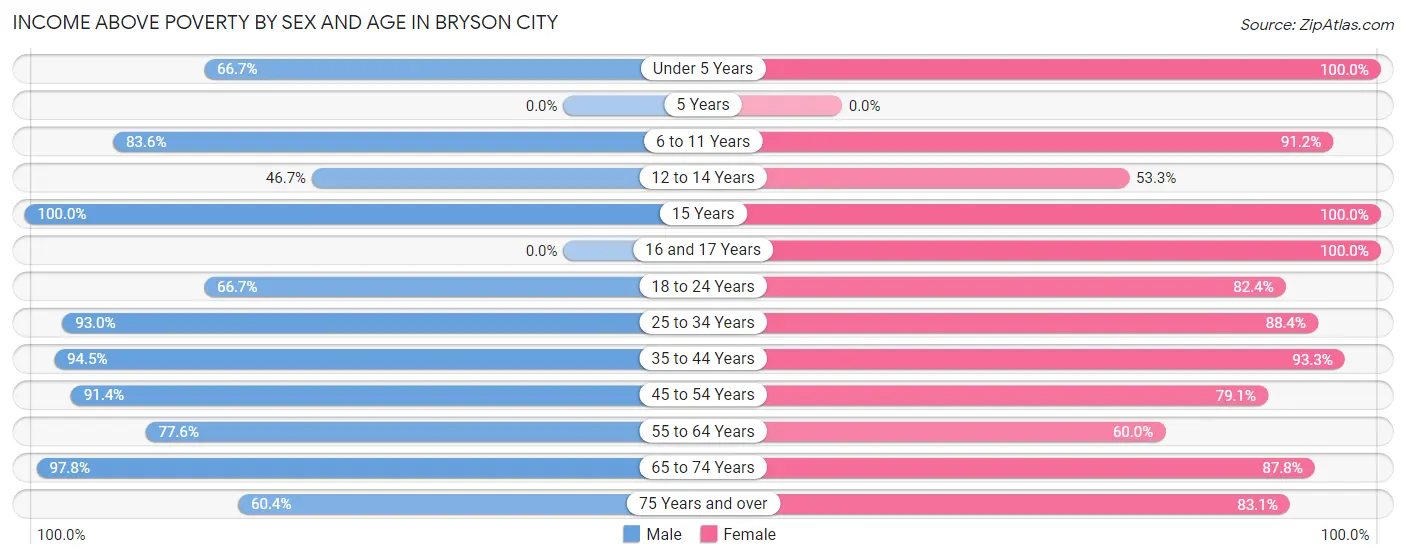
| Age Bracket | Male | Female |
| Under 5 Years | 26 (66.7%) | 28 (100.0%) |
| 5 Years | 0 (0.0%) | 0 (0.0%) |
| 6 to 11 Years | 107 (83.6%) | 62 (91.2%) |
| 12 to 14 Years | 7 (46.7%) | 24 (53.3%) |
| 15 Years | 12 (100.0%) | 7 (100.0%) |
| 16 and 17 Years | 0 (0.0%) | 29 (100.0%) |
| 18 to 24 Years | 28 (66.7%) | 56 (82.4%) |
| 25 to 34 Years | 93 (93.0%) | 91 (88.3%) |
| 35 to 44 Years | 86 (94.5%) | 112 (93.3%) |
| 45 to 54 Years | 85 (91.4%) | 68 (79.1%) |
| 55 to 64 Years | 38 (77.5%) | 33 (60.0%) |
| 65 to 74 Years | 44 (97.8%) | 129 (87.8%) |
| 75 Years and over | 32 (60.4%) | 59 (83.1%) |
| Total | 558 (83.4%) | 698 (84.4%) |
Income Below Poverty Among Married-Couple Families in Bryson City
The poverty statistics for married-couple families in Bryson City show that 3.0% or 8 of the total 262 families live below the poverty line. Families with 3 or 4 children have the highest poverty rate of 16.1%, comprising of 5 families. On the other hand, families with no children have the lowest poverty rate of 0.6%, which includes 1 families.
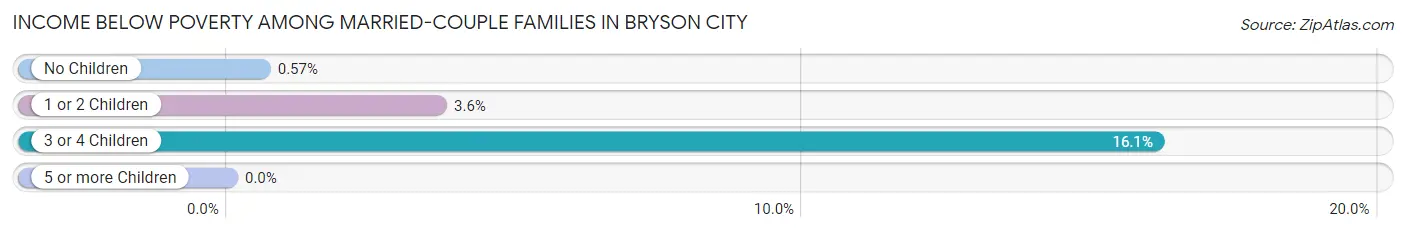
| Children | Above Poverty | Below Poverty |
| No Children | 175 (99.4%) | 1 (0.6%) |
| 1 or 2 Children | 53 (96.4%) | 2 (3.6%) |
| 3 or 4 Children | 26 (83.9%) | 5 (16.1%) |
| 5 or more Children | 0 (0.0%) | 0 (0.0%) |
| Total | 254 (97.0%) | 8 (3.0%) |
Income Below Poverty Among Single-Parent Households in Bryson City
According to the poverty data in Bryson City, 32.0% or 8 single-father households and 11.2% or 10 single-mother households are living below the poverty line. Among single-father households, those with 1 or 2 children have the highest poverty rate, with 8 households (36.4%) experiencing poverty. Likewise, among single-mother households, those with 1 or 2 children have the highest poverty rate, with 8 households (11.3%) falling below the poverty line.
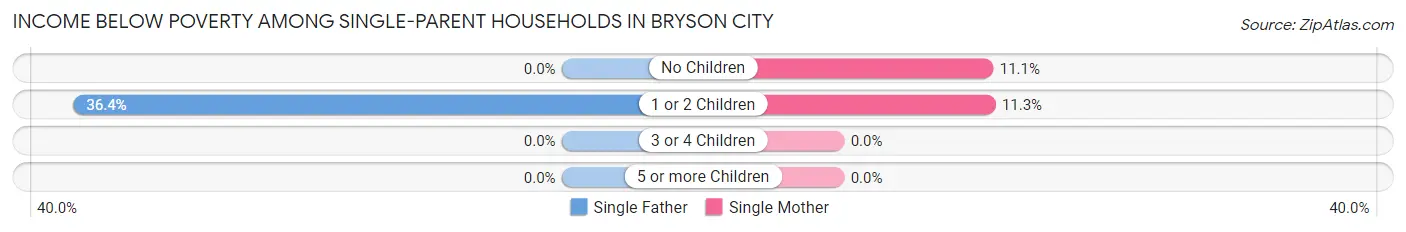
| Children | Single Father | Single Mother |
| No Children | 0 (0.0%) | 2 (11.1%) |
| 1 or 2 Children | 8 (36.4%) | 8 (11.3%) |
| 3 or 4 Children | 0 (0.0%) | 0 (0.0%) |
| 5 or more Children | 0 (0.0%) | 0 (0.0%) |
| Total | 8 (32.0%) | 10 (11.2%) |
Income Below Poverty Among Married-Couple vs Single-Parent Households in Bryson City
The poverty data for Bryson City shows that 8 of the married-couple family households (3.0%) and 18 of the single-parent households (15.8%) are living below the poverty level. Within the married-couple family households, those with 3 or 4 children have the highest poverty rate, with 5 households (16.1%) falling below the poverty line. Among the single-parent households, those with 1 or 2 children have the highest poverty rate, with 16 household (17.2%) living below poverty.
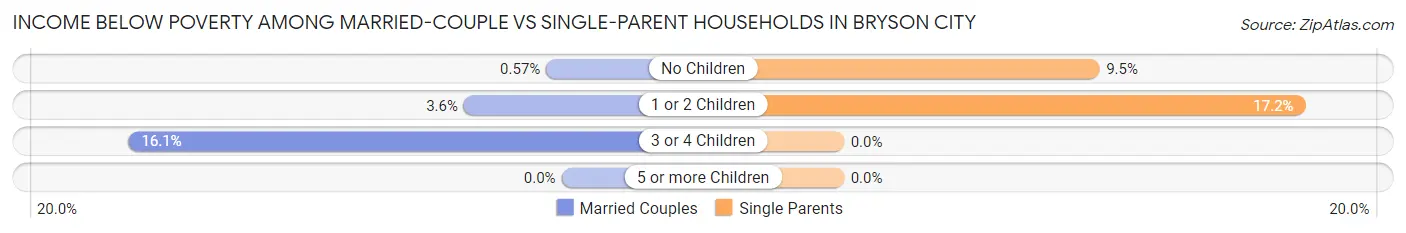
| Children | Married-Couple Families | Single-Parent Households |
| No Children | 1 (0.6%) | 2 (9.5%) |
| 1 or 2 Children | 2 (3.6%) | 16 (17.2%) |
| 3 or 4 Children | 5 (16.1%) | 0 (0.0%) |
| 5 or more Children | 0 (0.0%) | 0 (0.0%) |
| Total | 8 (3.0%) | 18 (15.8%) |
Race in Bryson City
The most populous races in Bryson City are White / Caucasian (1,354 | 82.7%), Hispanic or Latino (295 | 18.0%), and Native / Alaskan (127 | 7.7%).
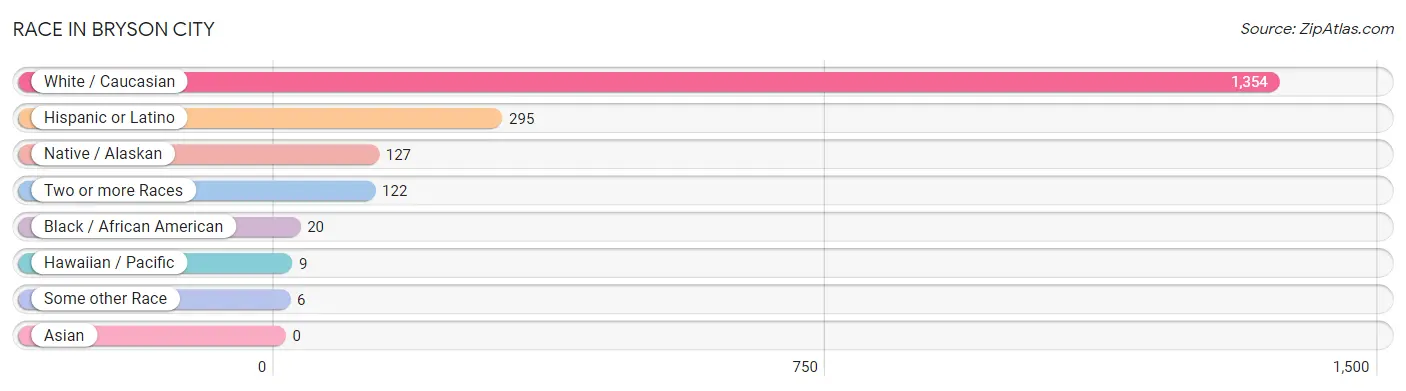
| Race | # Population | % Population |
| Asian | 0 | 0.0% |
| Black / African American | 20 | 1.2% |
| Hawaiian / Pacific | 9 | 0.5% |
| Hispanic or Latino | 295 | 18.0% |
| Native / Alaskan | 127 | 7.7% |
| White / Caucasian | 1,354 | 82.7% |
| Two or more Races | 122 | 7.4% |
| Some other Race | 6 | 0.4% |
| Total | 1,638 | 100.0% |
Ancestry in Bryson City
The most populous ancestries reported in Bryson City are American (333 | 20.3%), Cherokee (180 | 11.0%), English (170 | 10.4%), Mexican (159 | 9.7%), and Irish (152 | 9.3%), together accounting for 60.7% of all Bryson City residents.
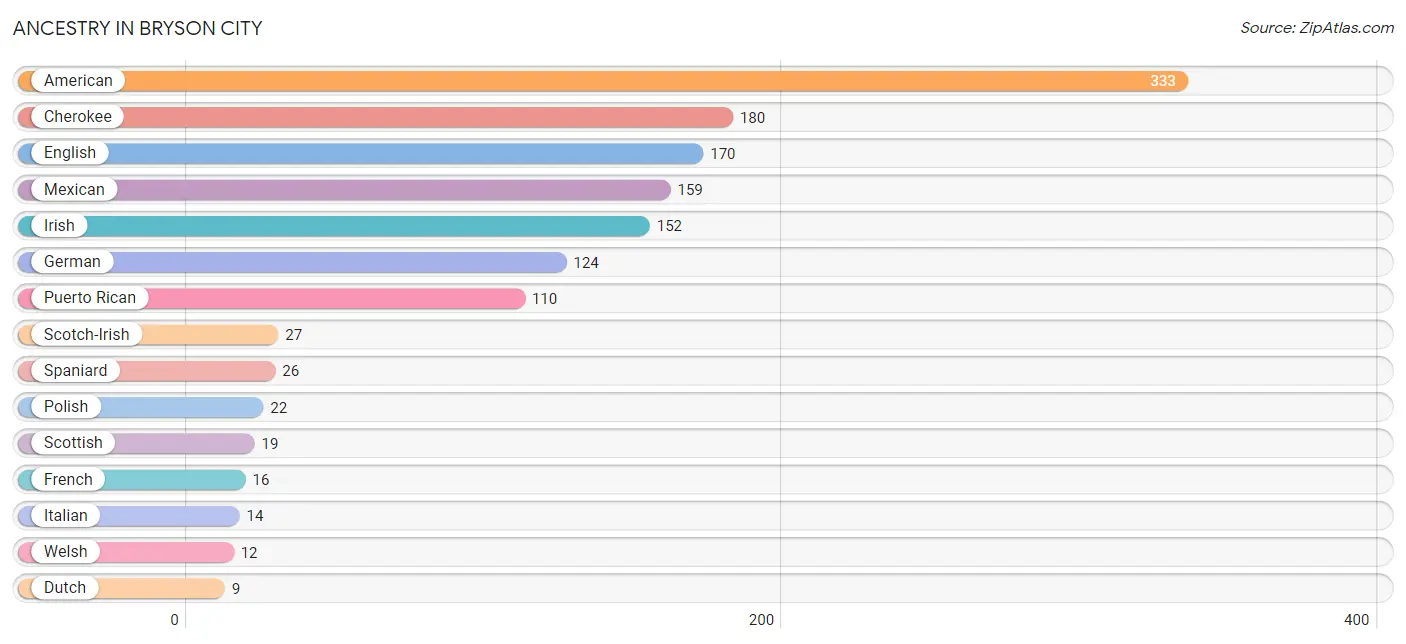
| Ancestry | # Population | % Population |
| African | 6 | 0.4% |
| American | 333 | 20.3% |
| British | 4 | 0.2% |
| Cherokee | 180 | 11.0% |
| Czech | 3 | 0.2% |
| Dutch | 9 | 0.5% |
| English | 170 | 10.4% |
| Estonian | 3 | 0.2% |
| European | 6 | 0.4% |
| French | 16 | 1.0% |
| German | 124 | 7.6% |
| Greek | 9 | 0.5% |
| Guamanian / Chamorro | 9 | 0.5% |
| Irish | 152 | 9.3% |
| Italian | 14 | 0.9% |
| Lithuanian | 4 | 0.2% |
| Lumbee | 5 | 0.3% |
| Mexican | 159 | 9.7% |
| Polish | 22 | 1.3% |
| Puerto Rican | 110 | 6.7% |
| Scotch-Irish | 27 | 1.7% |
| Scottish | 19 | 1.2% |
| South African | 3 | 0.2% |
| Spaniard | 26 | 1.6% |
| Subsaharan African | 9 | 0.5% |
| Swedish | 7 | 0.4% |
| Welsh | 12 | 0.7% | View All 27 Rows |
Immigrants in Bryson City
The most numerous immigrant groups reported in Bryson City came from Central America (150 | 9.2%), Latin America (150 | 9.2%), Mexico (150 | 9.2%), Africa (3 | 0.2%), and South Africa (3 | 0.2%), together accounting for 27.8% of all Bryson City residents.
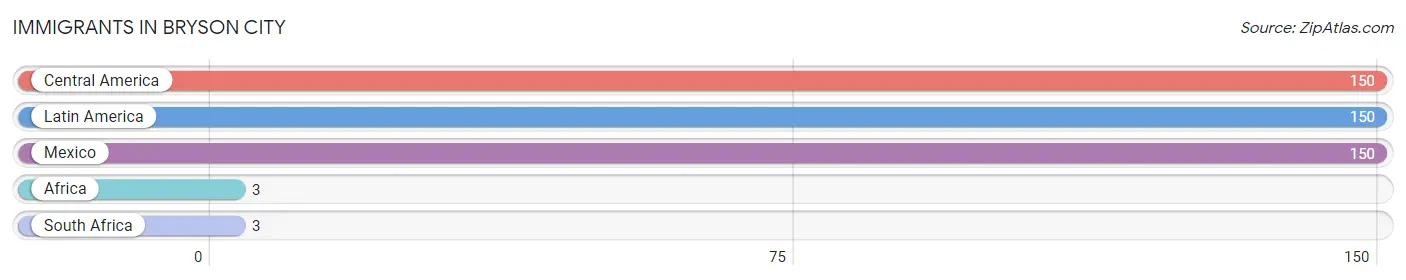
| Immigration Origin | # Population | % Population |
| Africa | 3 | 0.2% |
| Central America | 150 | 9.2% |
| Latin America | 150 | 9.2% |
| Mexico | 150 | 9.2% |
| South Africa | 3 | 0.2% | View All 5 Rows |
Sex and Age in Bryson City
Sex and Age in Bryson City
The most populous age groups in Bryson City are 5 to 9 Years (107 | 14.6%) for men and 85 Years and over (107 | 11.8%) for women.
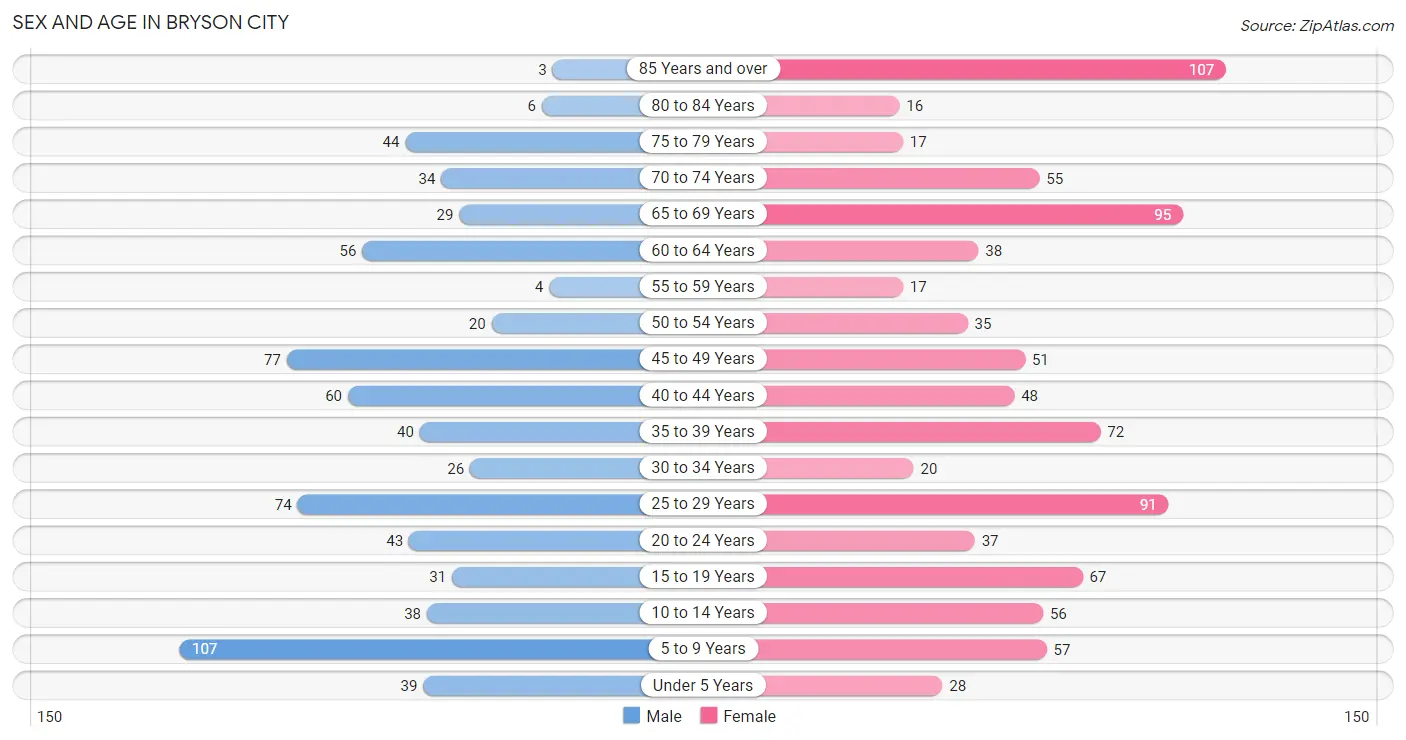
| Age Bracket | Male | Female |
| Under 5 Years | 39 (5.3%) | 28 (3.1%) |
| 5 to 9 Years | 107 (14.6%) | 57 (6.3%) |
| 10 to 14 Years | 38 (5.2%) | 56 (6.2%) |
| 15 to 19 Years | 31 (4.2%) | 67 (7.4%) |
| 20 to 24 Years | 43 (5.9%) | 37 (4.1%) |
| 25 to 29 Years | 74 (10.1%) | 91 (10.0%) |
| 30 to 34 Years | 26 (3.6%) | 20 (2.2%) |
| 35 to 39 Years | 40 (5.5%) | 72 (7.9%) |
| 40 to 44 Years | 60 (8.2%) | 48 (5.3%) |
| 45 to 49 Years | 77 (10.5%) | 51 (5.6%) |
| 50 to 54 Years | 20 (2.7%) | 35 (3.9%) |
| 55 to 59 Years | 4 (0.5%) | 17 (1.9%) |
| 60 to 64 Years | 56 (7.7%) | 38 (4.2%) |
| 65 to 69 Years | 29 (4.0%) | 95 (10.5%) |
| 70 to 74 Years | 34 (4.6%) | 55 (6.1%) |
| 75 to 79 Years | 44 (6.0%) | 17 (1.9%) |
| 80 to 84 Years | 6 (0.8%) | 16 (1.8%) |
| 85 Years and over | 3 (0.4%) | 107 (11.8%) |
| Total | 731 (100.0%) | 907 (100.0%) |
Families and Households in Bryson City
Median Family Size in Bryson City
The median family size in Bryson City is 3.04 persons per family, with single male/father families (25 | 6.7%) accounting for the largest median family size of 3.72 persons per family. On the other hand, single female/mother families (89 | 23.7%) represent the smallest median family size with 2.61 persons per family.
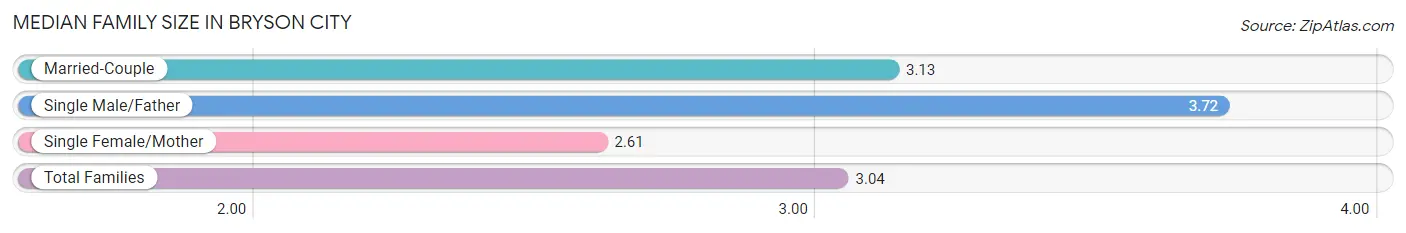
| Family Type | # Families | Family Size |
| Married-Couple | 262 (69.7%) | 3.13 |
| Single Male/Father | 25 (6.7%) | 3.72 |
| Single Female/Mother | 89 (23.7%) | 2.61 |
| Total Families | 376 (100.0%) | 3.04 |
Median Household Size in Bryson City
The median household size in Bryson City is 2.28 persons per household, with single male/father households (25 | 3.9%) accounting for the largest median household size of 4.36 persons per household. non-family households (267 | 41.5%) represent the smallest median household size with 1.10 persons per household.
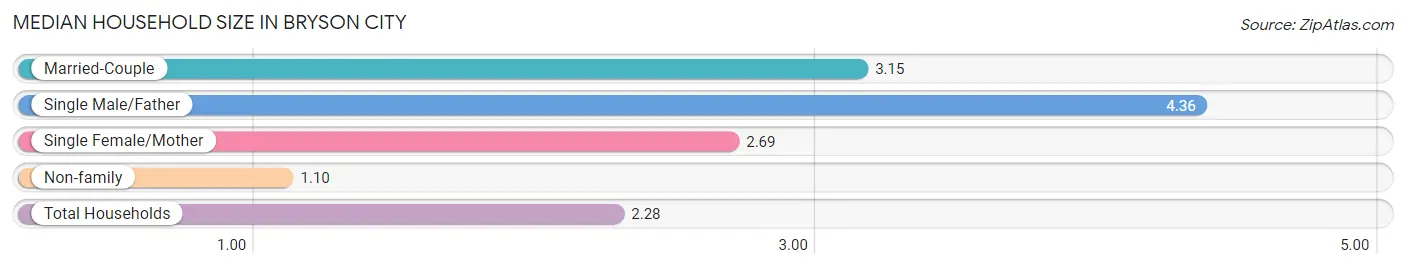
| Household Type | # Households | Household Size |
| Married-Couple | 262 (40.7%) | 3.15 |
| Single Male/Father | 25 (3.9%) | 4.36 |
| Single Female/Mother | 89 (13.8%) | 2.69 |
| Non-family | 267 (41.5%) | 1.10 |
| Total Households | 643 (100.0%) | 2.28 |
Household Size by Marriage Status in Bryson City
Out of a total of 643 households in Bryson City, 376 (58.5%) are family households, while 267 (41.5%) are nonfamily households. The most numerous type of family households are 2-person households, comprising 193, and the most common type of nonfamily households are 1-person households, comprising 249.
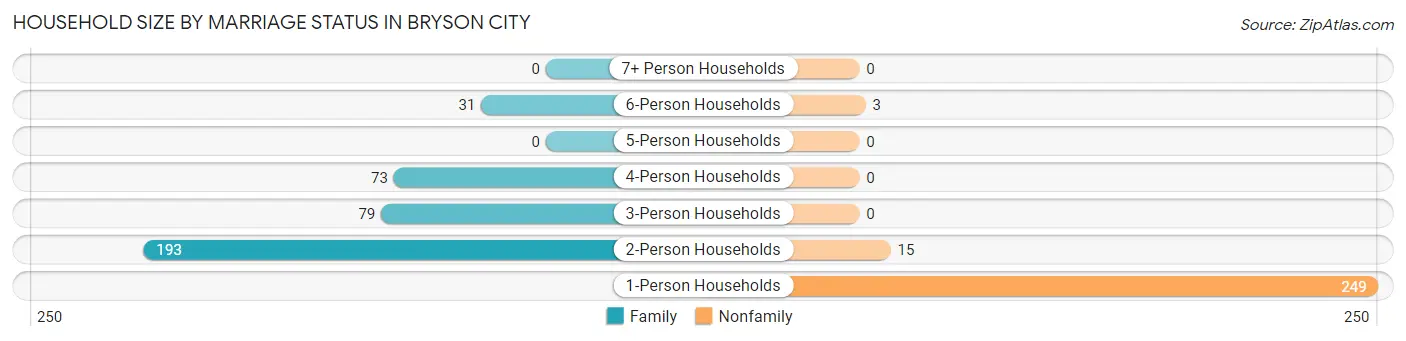
| Household Size | Family Households | Nonfamily Households |
| 1-Person Households | - | 249 (38.7%) |
| 2-Person Households | 193 (30.0%) | 15 (2.3%) |
| 3-Person Households | 79 (12.3%) | 0 (0.0%) |
| 4-Person Households | 73 (11.4%) | 0 (0.0%) |
| 5-Person Households | 0 (0.0%) | 0 (0.0%) |
| 6-Person Households | 31 (4.8%) | 3 (0.5%) |
| 7+ Person Households | 0 (0.0%) | 0 (0.0%) |
| Total | 376 (58.5%) | 267 (41.5%) |
Female Fertility in Bryson City
Fertility by Age in Bryson City
Average fertility rate in Bryson City is 55.0 births per 1,000 women. Women in the age bracket of 35 to 50 years have the highest fertility rate with 88.0 births per 1,000 women. Women in the age bracket of 35 to 50 years acount for 72.7% of all women with births.
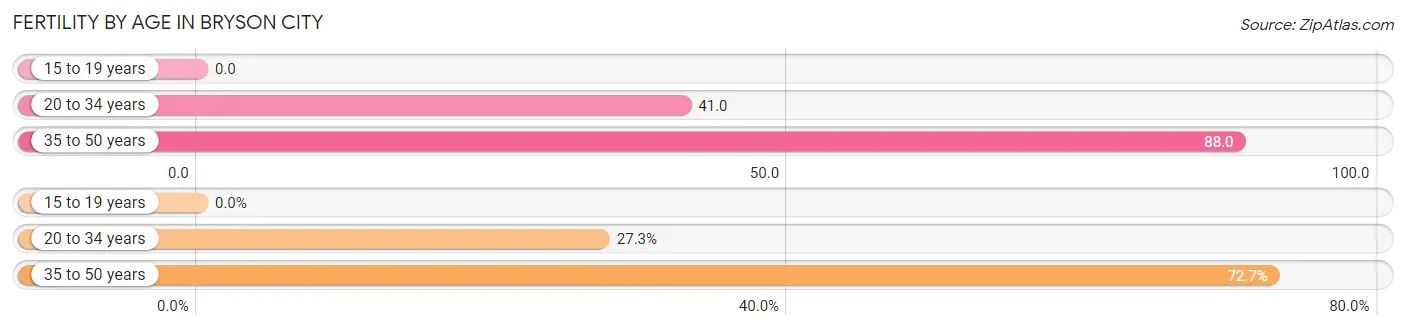
| Age Bracket | Women with Births | Births / 1,000 Women |
| 15 to 19 years | 0 (0.0%) | 0.0 |
| 20 to 34 years | 6 (27.3%) | 41.0 |
| 35 to 50 years | 16 (72.7%) | 88.0 |
| Total | 22 (100.0%) | 55.0 |
Fertility by Age by Marriage Status in Bryson City
27.3% of women with births (22) in Bryson City are married. The highest percentage of unmarried women with births falls into 35 to 50 years age bracket with 100.0% of them unmarried at the time of birth, while the lowest percentage of unmarried women with births belong to 20 to 34 years age bracket with 0.0% of them unmarried.
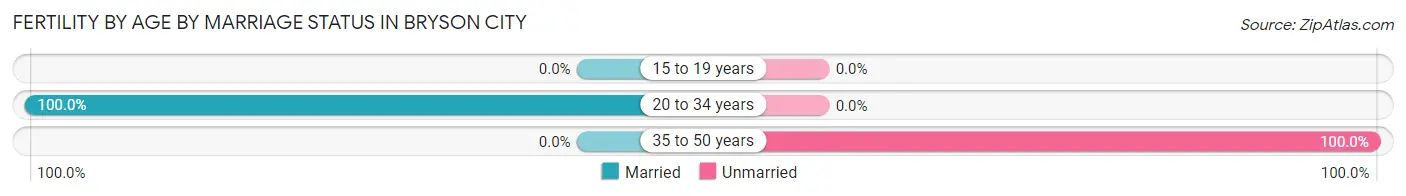
| Age Bracket | Married | Unmarried |
| 15 to 19 years | 0 (0.0%) | 0 (0.0%) |
| 20 to 34 years | 6 (100.0%) | 0 (0.0%) |
| 35 to 50 years | 0 (0.0%) | 16 (100.0%) |
| Total | 6 (27.3%) | 16 (72.7%) |
Fertility by Education in Bryson City
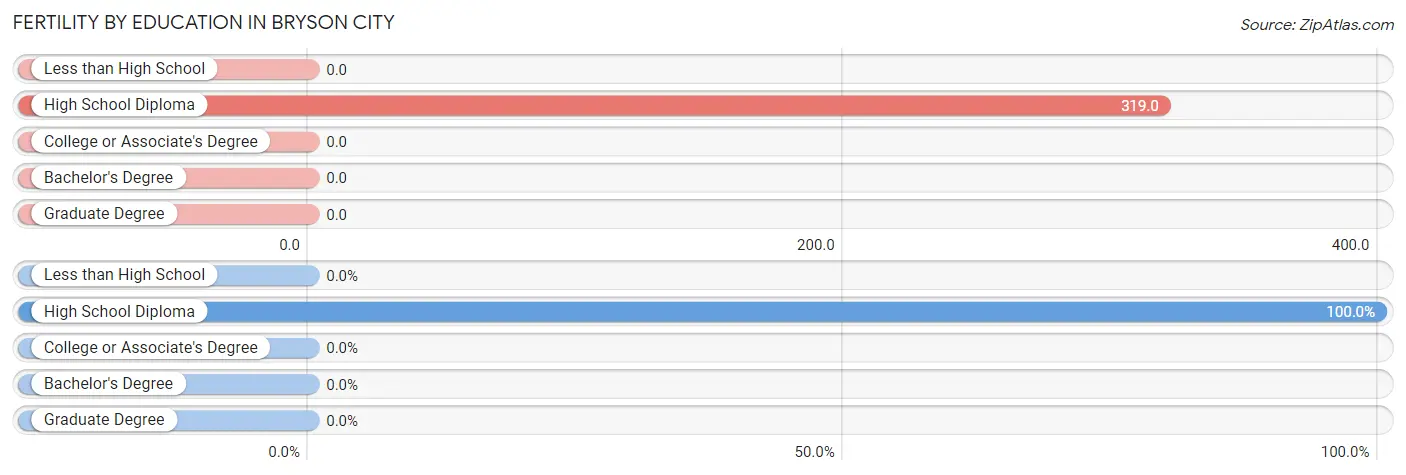
| Educational Attainment | Women with Births | Births / 1,000 Women |
| Less than High School | 0 (0.0%) | 0.0 |
| High School Diploma | 22 (100.0%) | 319.0 |
| College or Associate's Degree | 0 (0.0%) | 0.0 |
| Bachelor's Degree | 0 (0.0%) | 0.0 |
| Graduate Degree | 0 (0.0%) | 0.0 |
| Total | 22 (100.0%) | 55.0 |
Fertility by Education by Marriage Status in Bryson City
72.7% of women with births in Bryson City are unmarried. Women with the educational attainment of high school diploma are most likely to be married with 27.3% of them married at childbirth, while women with the educational attainment of high school diploma are least likely to be married with 72.7% of them unmarried at childbirth.
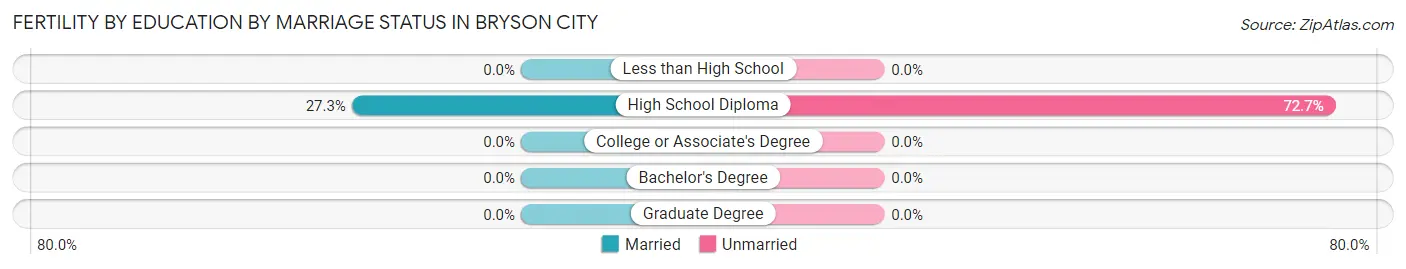
| Educational Attainment | Married | Unmarried |
| Less than High School | 0 (0.0%) | 0 (0.0%) |
| High School Diploma | 6 (27.3%) | 16 (72.7%) |
| College or Associate's Degree | 0 (0.0%) | 0 (0.0%) |
| Bachelor's Degree | 0 (0.0%) | 0 (0.0%) |
| Graduate Degree | 0 (0.0%) | 0 (0.0%) |
| Total | 6 (27.3%) | 16 (72.7%) |
Employment Characteristics in Bryson City
Employment by Class of Employer in Bryson City
Among the 710 employed individuals in Bryson City, private company employees (433 | 61.0%), self-employed (not incorporated) (71 | 10.0%), and not-for-profit organizations (57 | 8.0%) make up the most common classes of employment.
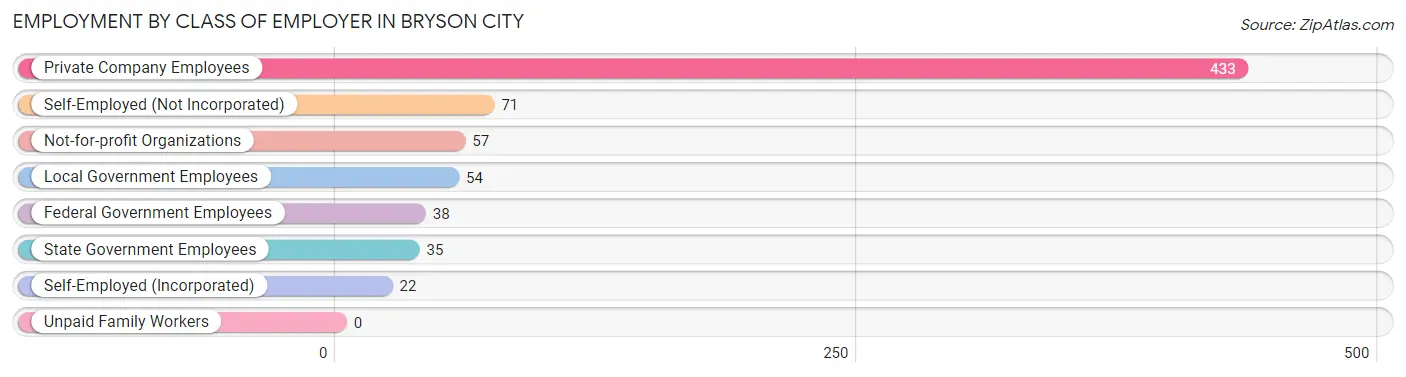
| Employer Class | # Employees | % Employees |
| Private Company Employees | 433 | 61.0% |
| Self-Employed (Incorporated) | 22 | 3.1% |
| Self-Employed (Not Incorporated) | 71 | 10.0% |
| Not-for-profit Organizations | 57 | 8.0% |
| Local Government Employees | 54 | 7.6% |
| State Government Employees | 35 | 4.9% |
| Federal Government Employees | 38 | 5.3% |
| Unpaid Family Workers | 0 | 0.0% |
| Total | 710 | 100.0% |
Employment Status by Age in Bryson City
According to the labor force statistics for Bryson City, out of the total population over 16 years of age (1,294), 55.5% or 718 individuals are in the labor force, with 1.0% or 7 of them unemployed. The age group with the highest labor force participation rate is 55 to 59 years, with 100.0% or 21 individuals in the labor force. Within the labor force, the 55 to 59 years age range has the highest percentage of unemployed individuals, with 9.5% or 2 of them being unemployed.
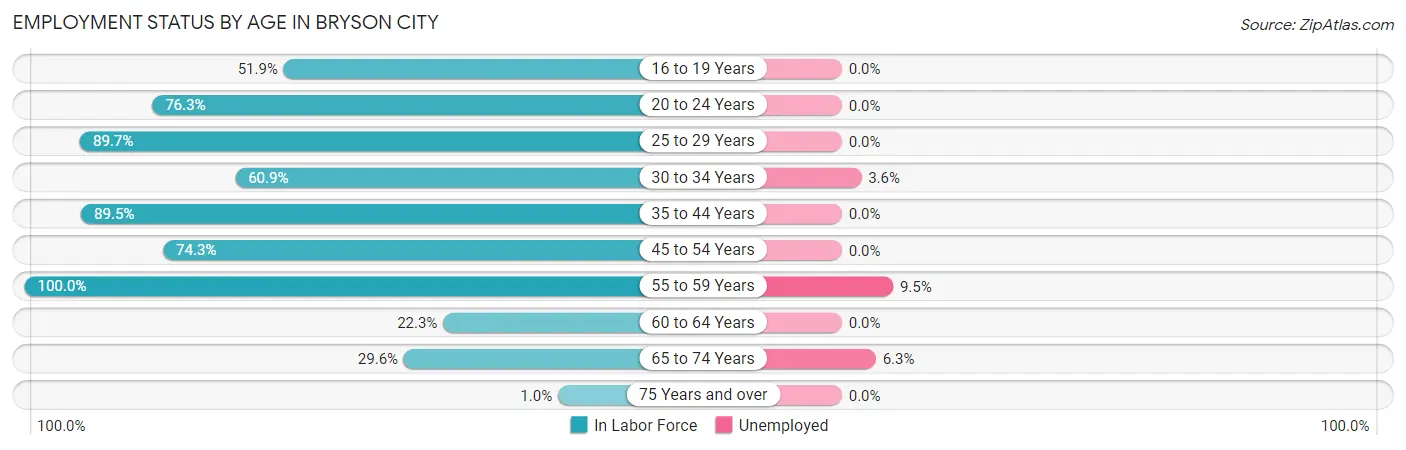
| Age Bracket | In Labor Force | Unemployed |
| 16 to 19 Years | 41 (51.9%) | 0 (0.0%) |
| 20 to 24 Years | 61 (76.3%) | 0 (0.0%) |
| 25 to 29 Years | 148 (89.7%) | 0 (0.0%) |
| 30 to 34 Years | 28 (60.9%) | 1 (3.6%) |
| 35 to 44 Years | 197 (89.5%) | 0 (0.0%) |
| 45 to 54 Years | 136 (74.3%) | 0 (0.0%) |
| 55 to 59 Years | 21 (100.0%) | 2 (9.5%) |
| 60 to 64 Years | 21 (22.3%) | 0 (0.0%) |
| 65 to 74 Years | 63 (29.6%) | 4 (6.3%) |
| 75 Years and over | 2 (1.0%) | 0 (0.0%) |
| Total | 718 (55.5%) | 7 (1.0%) |
Employment Status by Educational Attainment in Bryson City
According to labor force statistics for Bryson City, 75.6% of individuals (551) out of the total population between 25 and 64 years of age (729) are in the labor force, with 0.5% or 3 of them being unemployed. The group with the highest labor force participation rate are those with the educational attainment of bachelor's degree or higher, with 95.1% or 215 individuals in the labor force. Within the labor force, individuals with bachelor's degree or higher education have the highest percentage of unemployment, with 0.9% or 2 of them being unemployed.
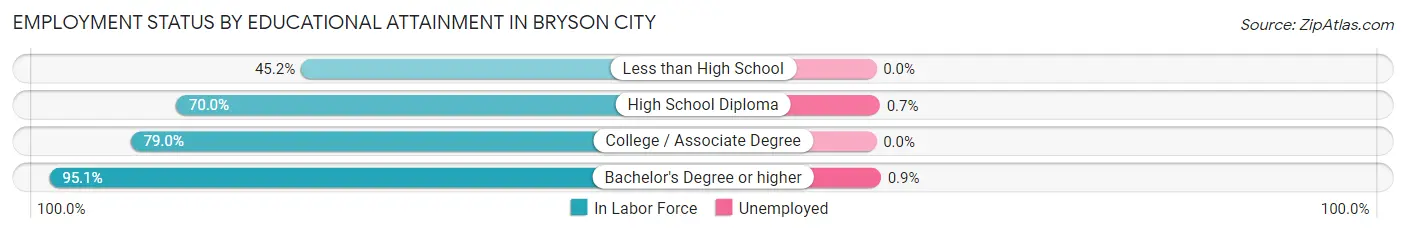
| Educational Attainment | In Labor Force | Unemployed |
| Less than High School | 57 (45.2%) | 0 (0.0%) |
| High School Diploma | 147 (70.0%) | 1 (0.7%) |
| College / Associate Degree | 132 (79.0%) | 0 (0.0%) |
| Bachelor's Degree or higher | 215 (95.1%) | 2 (0.9%) |
| Total | 551 (75.6%) | 4 (0.5%) |
Employment Occupations by Sex in Bryson City
Management, Business, Science and Arts Occupations
The most common Management, Business, Science and Arts occupations in Bryson City are Community & Social Service (94 | 13.2%), Health Diagnosing & Treating (82 | 11.5%), Health Technologists (74 | 10.4%), Education Instruction & Library (70 | 9.9%), and Management (37 | 5.2%).
Management, Business, Science and Arts Occupations by Sex
Within the Management, Business, Science and Arts occupations in Bryson City, the most male-oriented occupations are Architecture & Engineering (100.0%), Legal Services & Support (100.0%), and Management (86.5%), while the most female-oriented occupations are Life, Physical & Social Science (100.0%), Arts, Media & Entertainment (100.0%), and Health Diagnosing & Treating (100.0%).
| Occupation | Male | Female |
| Management | 32 (86.5%) | 5 (13.5%) |
| Business & Financial | 5 (35.7%) | 9 (64.3%) |
| Computers, Engineering & Science | 2 (50.0%) | 2 (50.0%) |
| Computers & Mathematics | 0 (0.0%) | 0 (0.0%) |
| Architecture & Engineering | 2 (100.0%) | 0 (0.0%) |
| Life, Physical & Social Science | 0 (0.0%) | 2 (100.0%) |
| Community & Social Service | 18 (19.2%) | 76 (80.8%) |
| Education, Arts & Media | 7 (53.8%) | 6 (46.2%) |
| Legal Services & Support | 8 (100.0%) | 0 (0.0%) |
| Education Instruction & Library | 3 (4.3%) | 67 (95.7%) |
| Arts, Media & Entertainment | 0 (0.0%) | 3 (100.0%) |
| Health Diagnosing & Treating | 0 (0.0%) | 82 (100.0%) |
| Health Technologists | 0 (0.0%) | 74 (100.0%) |
| Total (Category) | 57 (24.7%) | 174 (75.3%) |
| Total (Overall) | 312 (43.9%) | 399 (56.1%) |
Services Occupations
The most common Services occupations in Bryson City are Food Preparation & Serving (91 | 12.8%), Security & Protection (64 | 9.0%), Personal Care & Service (54 | 7.6%), Law Enforcement (44 | 6.2%), and Healthcare Support (30 | 4.2%).
Services Occupations by Sex
Within the Services occupations in Bryson City, the most male-oriented occupations are Security & Protection (100.0%), Firefighting & Prevention (100.0%), and Law Enforcement (100.0%), while the most female-oriented occupations are Healthcare Support (100.0%), Food Preparation & Serving (70.3%), and Personal Care & Service (22.2%).
| Occupation | Male | Female |
| Healthcare Support | 0 (0.0%) | 30 (100.0%) |
| Security & Protection | 64 (100.0%) | 0 (0.0%) |
| Firefighting & Prevention | 20 (100.0%) | 0 (0.0%) |
| Law Enforcement | 44 (100.0%) | 0 (0.0%) |
| Food Preparation & Serving | 27 (29.7%) | 64 (70.3%) |
| Cleaning & Maintenance | 23 (100.0%) | 0 (0.0%) |
| Personal Care & Service | 42 (77.8%) | 12 (22.2%) |
| Total (Category) | 156 (59.5%) | 106 (40.5%) |
| Total (Overall) | 312 (43.9%) | 399 (56.1%) |
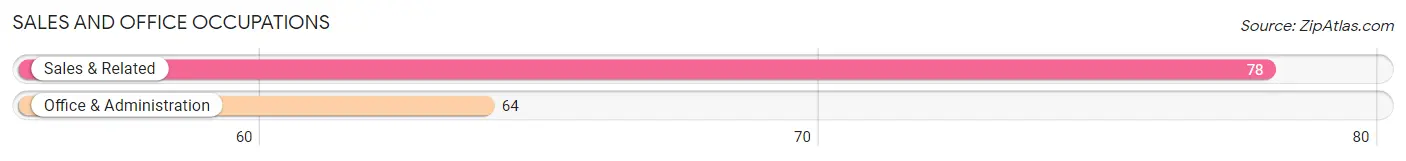
Sales and Office Occupations
The most common Sales and Office occupations in Bryson City are Sales & Related (78 | 11.0%), and Office & Administration (64 | 9.0%).
Sales and Office Occupations by Sex
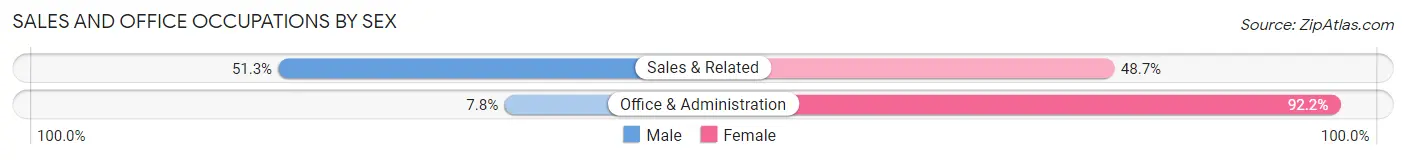
| Occupation | Male | Female |
| Sales & Related | 40 (51.3%) | 38 (48.7%) |
| Office & Administration | 5 (7.8%) | 59 (92.2%) |
| Total (Category) | 45 (31.7%) | 97 (68.3%) |
| Total (Overall) | 312 (43.9%) | 399 (56.1%) |
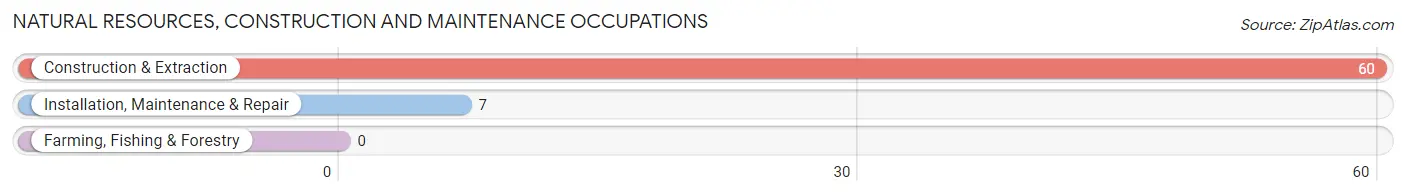
Natural Resources, Construction and Maintenance Occupations
The most common Natural Resources, Construction and Maintenance occupations in Bryson City are Construction & Extraction (60 | 8.4%), and Installation, Maintenance & Repair (7 | 1.0%).
Natural Resources, Construction and Maintenance Occupations by Sex
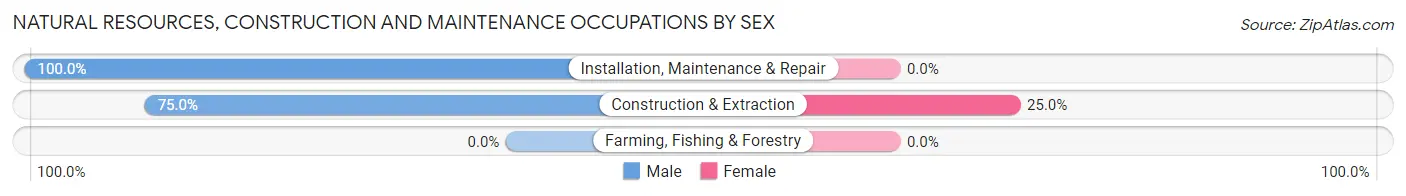
| Occupation | Male | Female |
| Farming, Fishing & Forestry | 0 (0.0%) | 0 (0.0%) |
| Construction & Extraction | 45 (75.0%) | 15 (25.0%) |
| Installation, Maintenance & Repair | 7 (100.0%) | 0 (0.0%) |
| Total (Category) | 52 (77.6%) | 15 (22.4%) |
| Total (Overall) | 312 (43.9%) | 399 (56.1%) |
Production, Transportation and Moving Occupations
The most common Production, Transportation and Moving occupations in Bryson City are , and Production (9 | 1.3%).
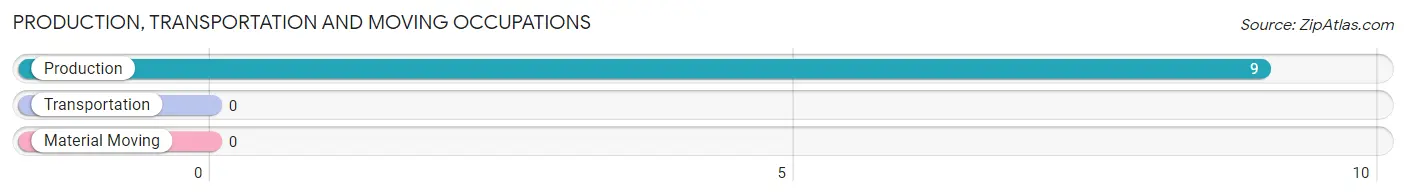
Production, Transportation and Moving Occupations by Sex
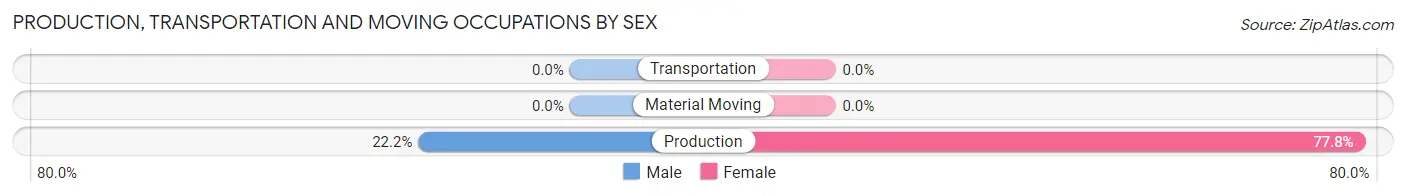
| Occupation | Male | Female |
| Production | 2 (22.2%) | 7 (77.8%) |
| Transportation | 0 (0.0%) | 0 (0.0%) |
| Material Moving | 0 (0.0%) | 0 (0.0%) |
| Total (Category) | 2 (22.2%) | 7 (77.8%) |
| Total (Overall) | 312 (43.9%) | 399 (56.1%) |
Employment Industries by Sex in Bryson City
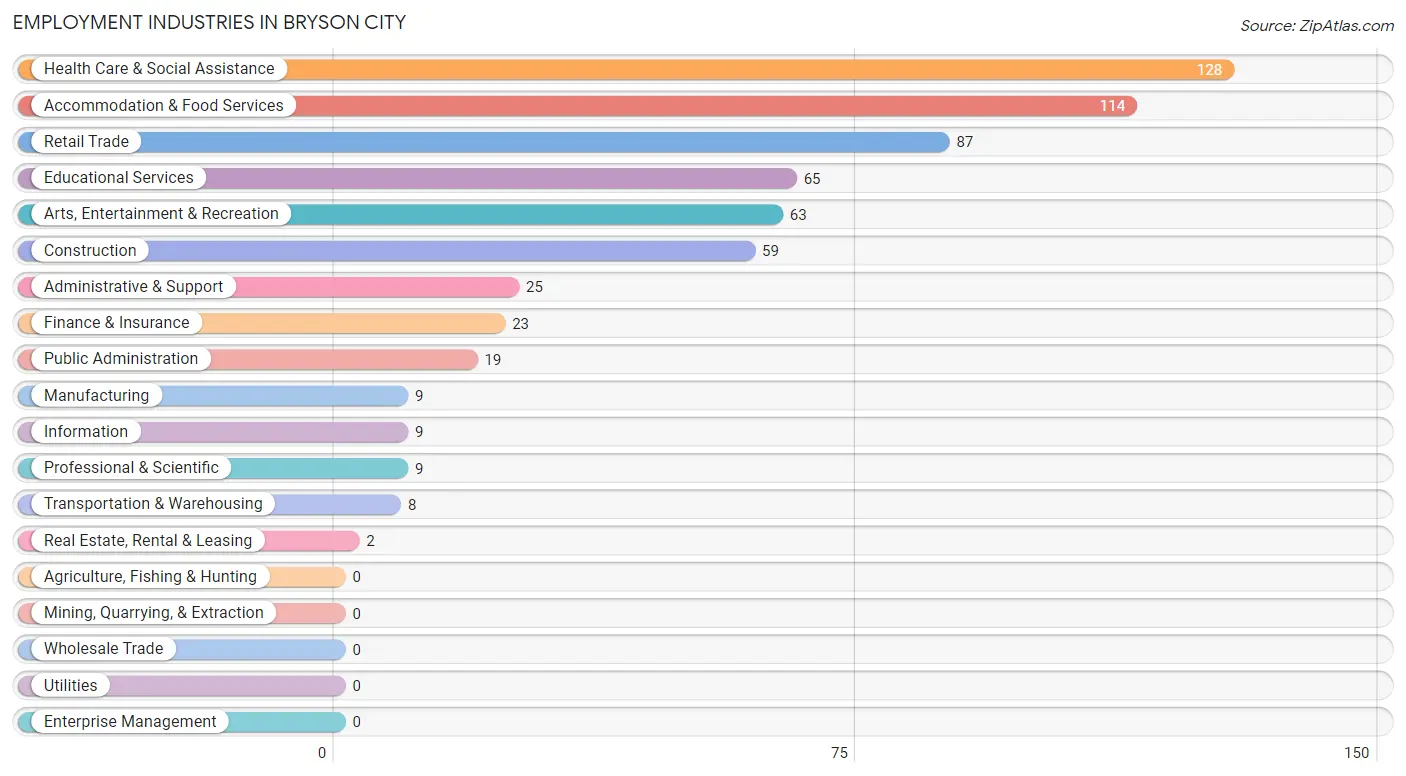
Employment Industries in Bryson City
The major employment industries in Bryson City include Health Care & Social Assistance (128 | 18.0%), Accommodation & Food Services (114 | 16.0%), Retail Trade (87 | 12.2%), Educational Services (65 | 9.1%), and Arts, Entertainment & Recreation (63 | 8.9%).
Employment Industries by Sex in Bryson City
The Bryson City industries that see more men than women are Public Administration (89.5%), Professional & Scientific (88.9%), and Information (77.8%), whereas the industries that tend to have a higher number of women are Transportation & Warehousing (100.0%), Real Estate, Rental & Leasing (100.0%), and Health Care & Social Assistance (100.0%).
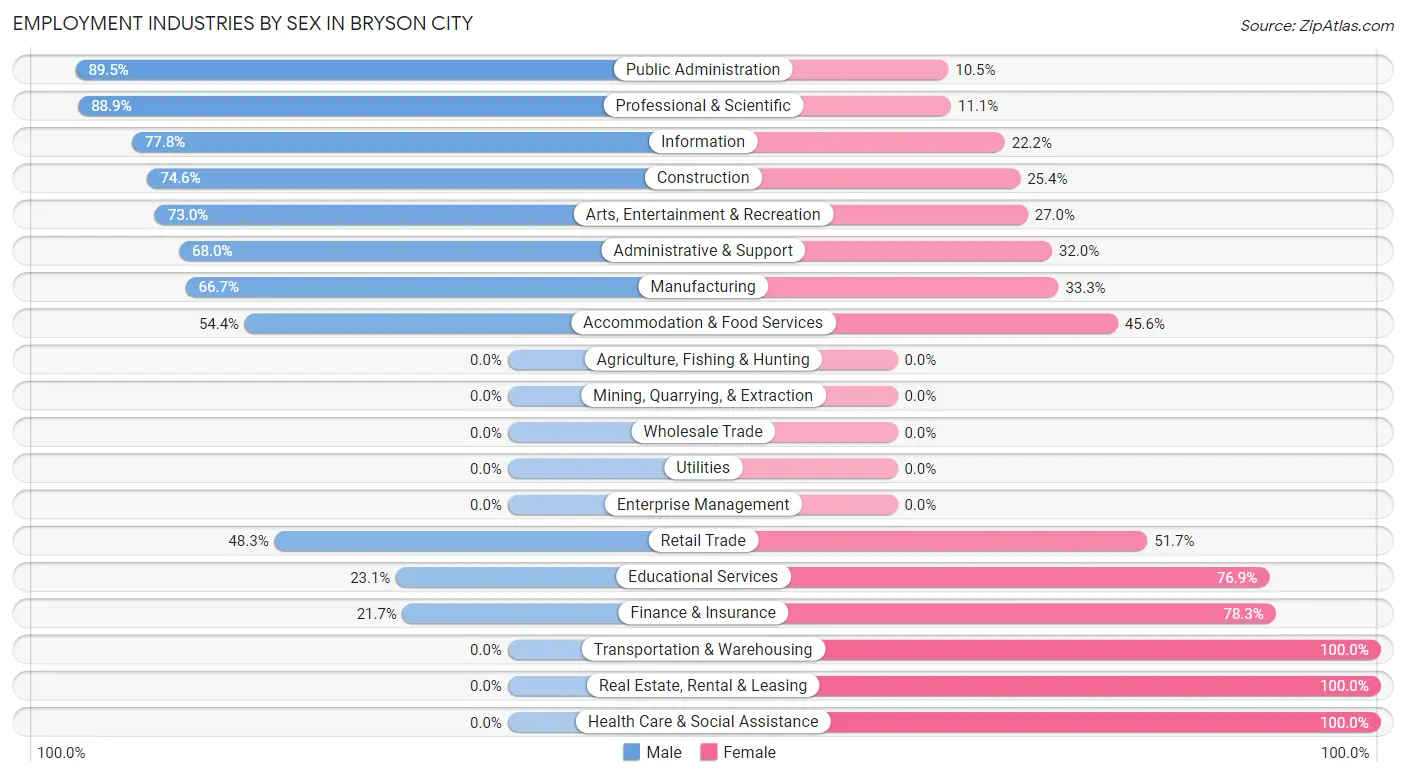
| Industry | Male | Female |
| Agriculture, Fishing & Hunting | 0 (0.0%) | 0 (0.0%) |
| Mining, Quarrying, & Extraction | 0 (0.0%) | 0 (0.0%) |
| Construction | 44 (74.6%) | 15 (25.4%) |
| Manufacturing | 6 (66.7%) | 3 (33.3%) |
| Wholesale Trade | 0 (0.0%) | 0 (0.0%) |
| Retail Trade | 42 (48.3%) | 45 (51.7%) |
| Transportation & Warehousing | 0 (0.0%) | 8 (100.0%) |
| Utilities | 0 (0.0%) | 0 (0.0%) |
| Information | 7 (77.8%) | 2 (22.2%) |
| Finance & Insurance | 5 (21.7%) | 18 (78.3%) |
| Real Estate, Rental & Leasing | 0 (0.0%) | 2 (100.0%) |
| Professional & Scientific | 8 (88.9%) | 1 (11.1%) |
| Enterprise Management | 0 (0.0%) | 0 (0.0%) |
| Administrative & Support | 17 (68.0%) | 8 (32.0%) |
| Educational Services | 15 (23.1%) | 50 (76.9%) |
| Health Care & Social Assistance | 0 (0.0%) | 128 (100.0%) |
| Arts, Entertainment & Recreation | 46 (73.0%) | 17 (27.0%) |
| Accommodation & Food Services | 62 (54.4%) | 52 (45.6%) |
| Public Administration | 17 (89.5%) | 2 (10.5%) |
| Total | 312 (43.9%) | 399 (56.1%) |
Education in Bryson City
School Enrollment in Bryson City
The most common levels of schooling among the 428 students in Bryson City are elementary school (154 | 36.0%), college / undergraduate (95 | 22.2%), and middle school (91 | 21.3%).
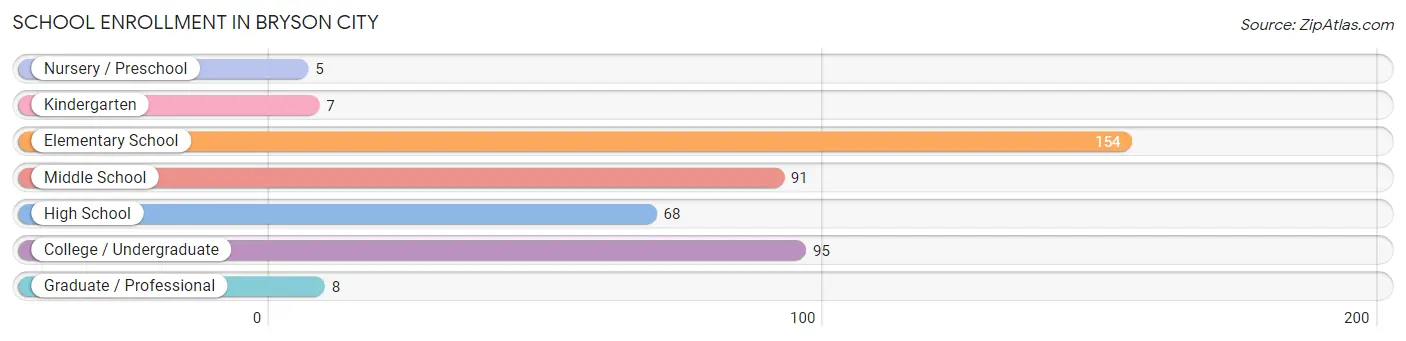
| School Level | # Students | % Students |
| Nursery / Preschool | 5 | 1.2% |
| Kindergarten | 7 | 1.6% |
| Elementary School | 154 | 36.0% |
| Middle School | 91 | 21.3% |
| High School | 68 | 15.9% |
| College / Undergraduate | 95 | 22.2% |
| Graduate / Professional | 8 | 1.9% |
| Total | 428 | 100.0% |
School Enrollment by Age by Funding Source in Bryson City
Out of a total of 428 students who are enrolled in schools in Bryson City, 8 (1.9%) attend a private institution, while the remaining 420 (98.1%) are enrolled in public schools. The age group of 25 to 34 year olds has the highest likelihood of being enrolled in private schools, with 8 (15.4% in the age bracket) enrolled. Conversely, the age group of 3 to 4 year olds has the lowest likelihood of being enrolled in a private school, with 5 (100.0% in the age bracket) attending a public institution.
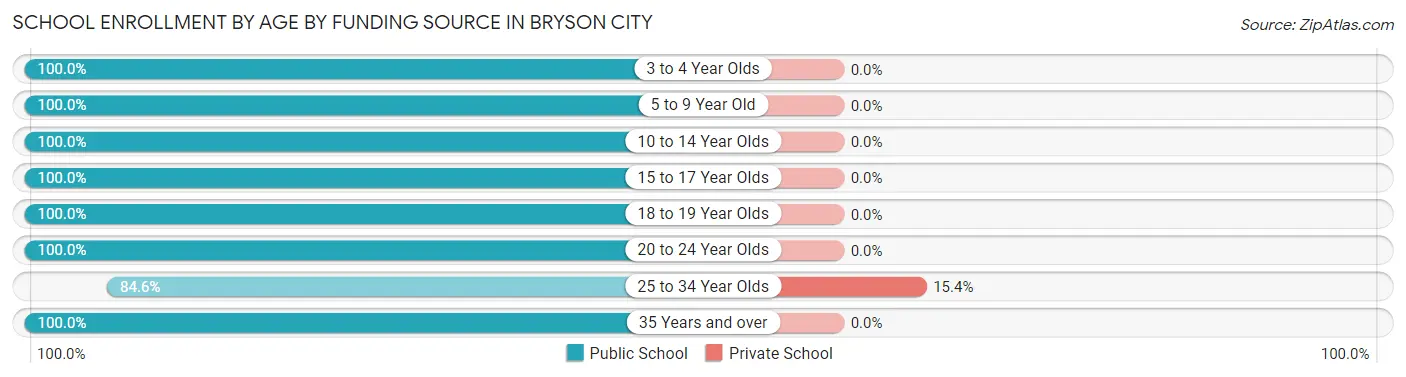
| Age Bracket | Public School | Private School |
| 3 to 4 Year Olds | 5 (100.0%) | 0 (0.0%) |
| 5 to 9 Year Old | 161 (100.0%) | 0 (0.0%) |
| 10 to 14 Year Olds | 91 (100.0%) | 0 (0.0%) |
| 15 to 17 Year Olds | 50 (100.0%) | 0 (0.0%) |
| 18 to 19 Year Olds | 29 (100.0%) | 0 (0.0%) |
| 20 to 24 Year Olds | 29 (100.0%) | 0 (0.0%) |
| 25 to 34 Year Olds | 44 (84.6%) | 8 (15.4%) |
| 35 Years and over | 11 (100.0%) | 0 (0.0%) |
| Total | 420 (98.1%) | 8 (1.9%) |
Educational Attainment by Field of Study in Bryson City
Bio, nature & agricultural (56 | 18.3%), education (52 | 17.0%), social sciences (38 | 12.4%), liberal arts & history (35 | 11.4%), and business (26 | 8.5%) are the most common fields of study among 306 individuals in Bryson City who have obtained a bachelor's degree or higher.
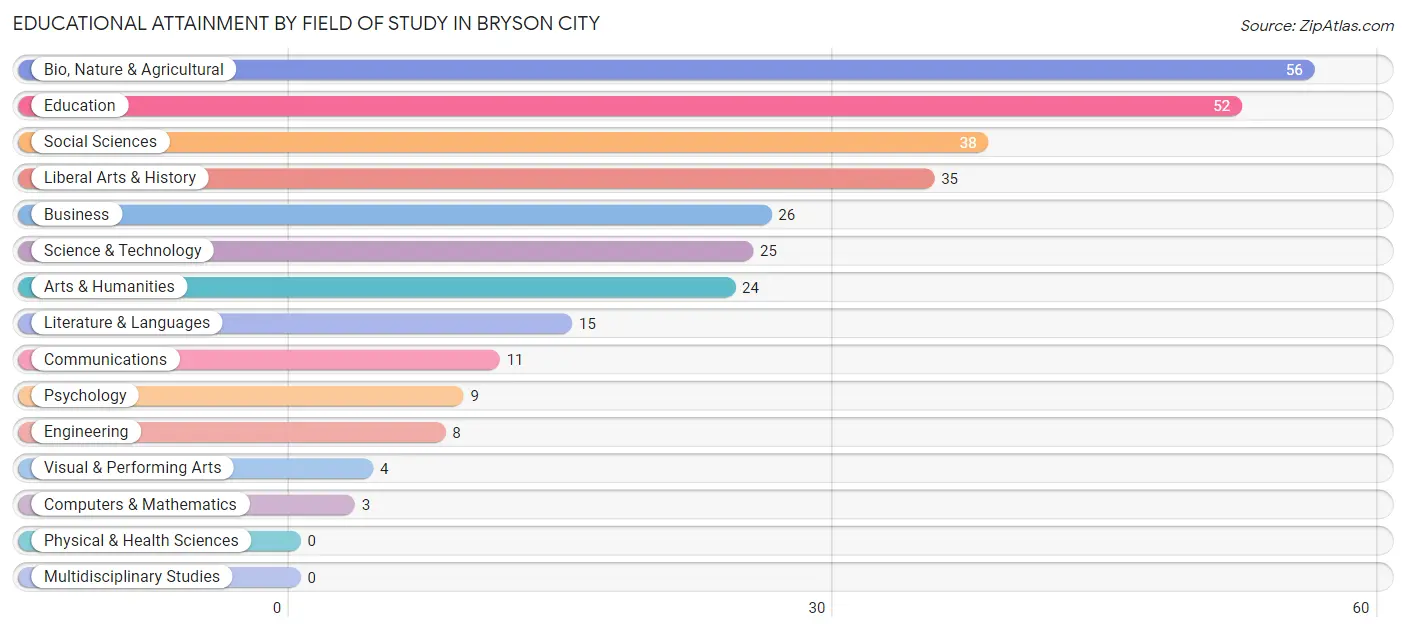
| Field of Study | # Graduates | % Graduates |
| Computers & Mathematics | 3 | 1.0% |
| Bio, Nature & Agricultural | 56 | 18.3% |
| Physical & Health Sciences | 0 | 0.0% |
| Psychology | 9 | 2.9% |
| Social Sciences | 38 | 12.4% |
| Engineering | 8 | 2.6% |
| Multidisciplinary Studies | 0 | 0.0% |
| Science & Technology | 25 | 8.2% |
| Business | 26 | 8.5% |
| Education | 52 | 17.0% |
| Literature & Languages | 15 | 4.9% |
| Liberal Arts & History | 35 | 11.4% |
| Visual & Performing Arts | 4 | 1.3% |
| Communications | 11 | 3.6% |
| Arts & Humanities | 24 | 7.8% |
| Total | 306 | 100.0% |
Transportation & Commute in Bryson City
Vehicle Availability by Sex in Bryson City
The most prevalent vehicle ownership categories in Bryson City are males with 2 vehicles (135, accounting for 45.8%) and females with 2 vehicles (216, making up 33.9%).
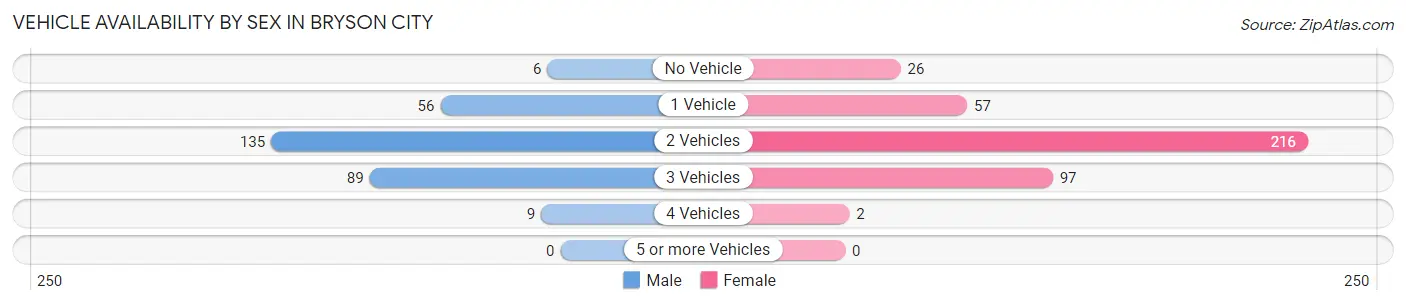
| Vehicles Available | Male | Female |
| No Vehicle | 6 (2.0%) | 26 (6.5%) |
| 1 Vehicle | 56 (19.0%) | 57 (14.3%) |
| 2 Vehicles | 135 (45.8%) | 216 (54.3%) |
| 3 Vehicles | 89 (30.2%) | 97 (24.4%) |
| 4 Vehicles | 9 (3.0%) | 2 (0.5%) |
| 5 or more Vehicles | 0 (0.0%) | 0 (0.0%) |
| Total | 295 (100.0%) | 398 (100.0%) |
Commute Time in Bryson City
The most frequently occuring commute durations in Bryson City are 5 to 9 minutes (161 commuters, 22.9%), 10 to 14 minutes (155 commuters, 22.1%), and 15 to 19 minutes (114 commuters, 16.2%).
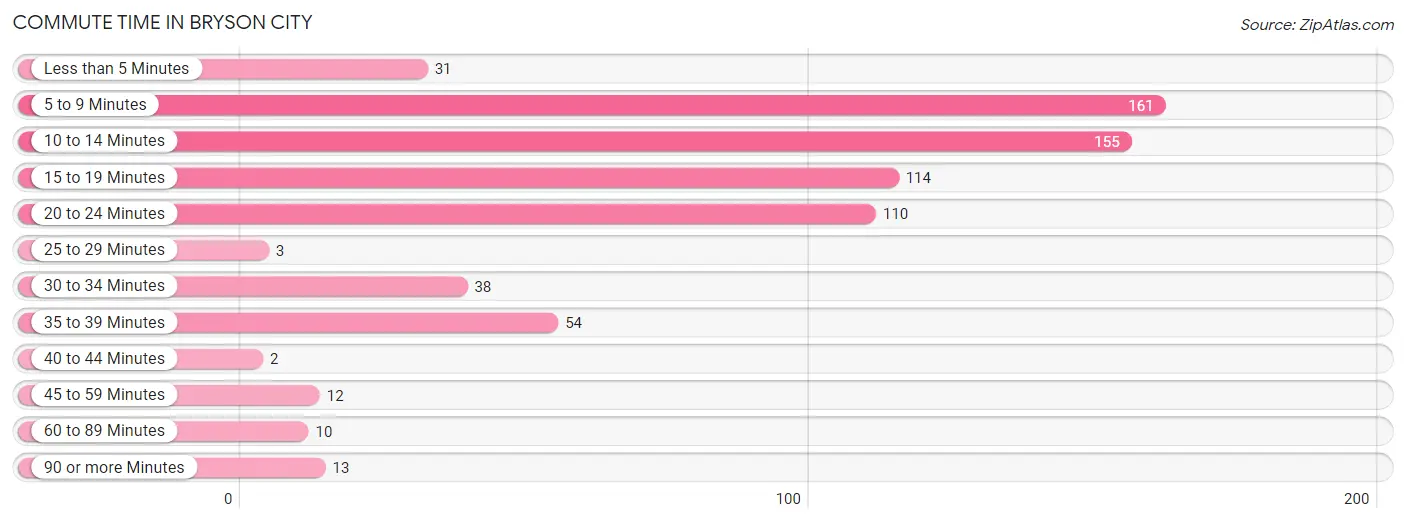
| Commute Time | # Commuters | % Commuters |
| Less than 5 Minutes | 31 | 4.4% |
| 5 to 9 Minutes | 161 | 22.9% |
| 10 to 14 Minutes | 155 | 22.1% |
| 15 to 19 Minutes | 114 | 16.2% |
| 20 to 24 Minutes | 110 | 15.7% |
| 25 to 29 Minutes | 3 | 0.4% |
| 30 to 34 Minutes | 38 | 5.4% |
| 35 to 39 Minutes | 54 | 7.7% |
| 40 to 44 Minutes | 2 | 0.3% |
| 45 to 59 Minutes | 12 | 1.7% |
| 60 to 89 Minutes | 10 | 1.4% |
| 90 or more Minutes | 13 | 1.8% |
Commute Time by Sex in Bryson City
The most common commute times in Bryson City are 10 to 14 minutes (66 commuters, 21.3%) for males and 5 to 9 minutes (108 commuters, 27.5%) for females.
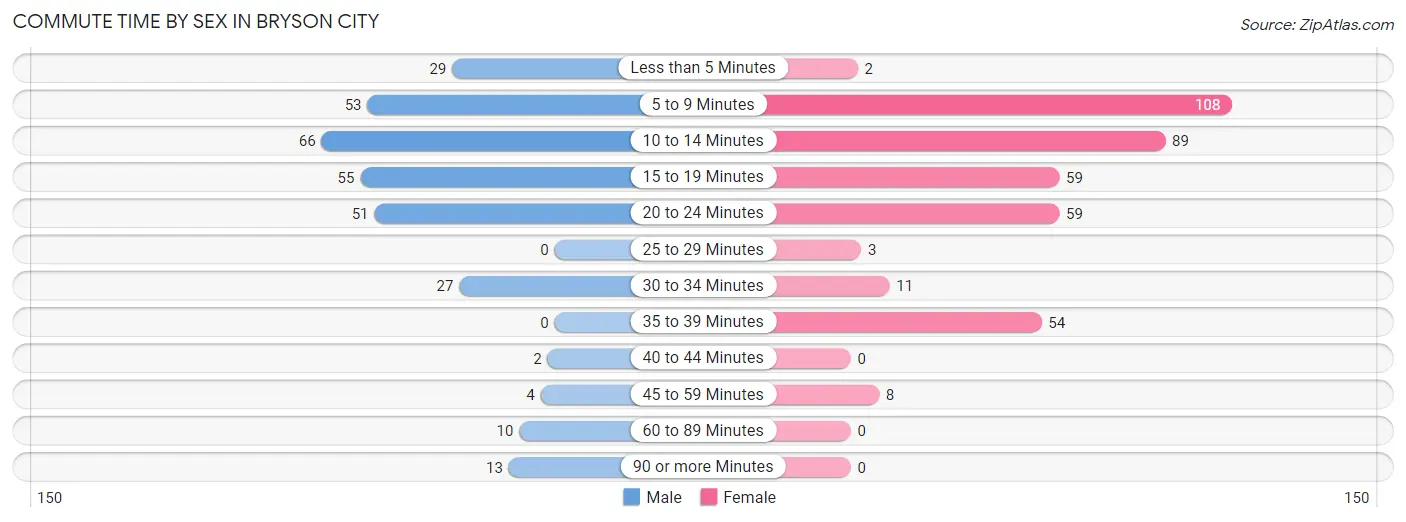
| Commute Time | Male | Female |
| Less than 5 Minutes | 29 (9.3%) | 2 (0.5%) |
| 5 to 9 Minutes | 53 (17.1%) | 108 (27.5%) |
| 10 to 14 Minutes | 66 (21.3%) | 89 (22.7%) |
| 15 to 19 Minutes | 55 (17.7%) | 59 (15.0%) |
| 20 to 24 Minutes | 51 (16.5%) | 59 (15.0%) |
| 25 to 29 Minutes | 0 (0.0%) | 3 (0.8%) |
| 30 to 34 Minutes | 27 (8.7%) | 11 (2.8%) |
| 35 to 39 Minutes | 0 (0.0%) | 54 (13.7%) |
| 40 to 44 Minutes | 2 (0.6%) | 0 (0.0%) |
| 45 to 59 Minutes | 4 (1.3%) | 8 (2.0%) |
| 60 to 89 Minutes | 10 (3.2%) | 0 (0.0%) |
| 90 or more Minutes | 13 (4.2%) | 0 (0.0%) |
Time of Departure to Work by Sex in Bryson City
The most frequent times of departure to work in Bryson City are 8:00 AM to 8:29 AM (76, 24.5%) for males and 7:00 AM to 7:29 AM (114, 29.0%) for females.
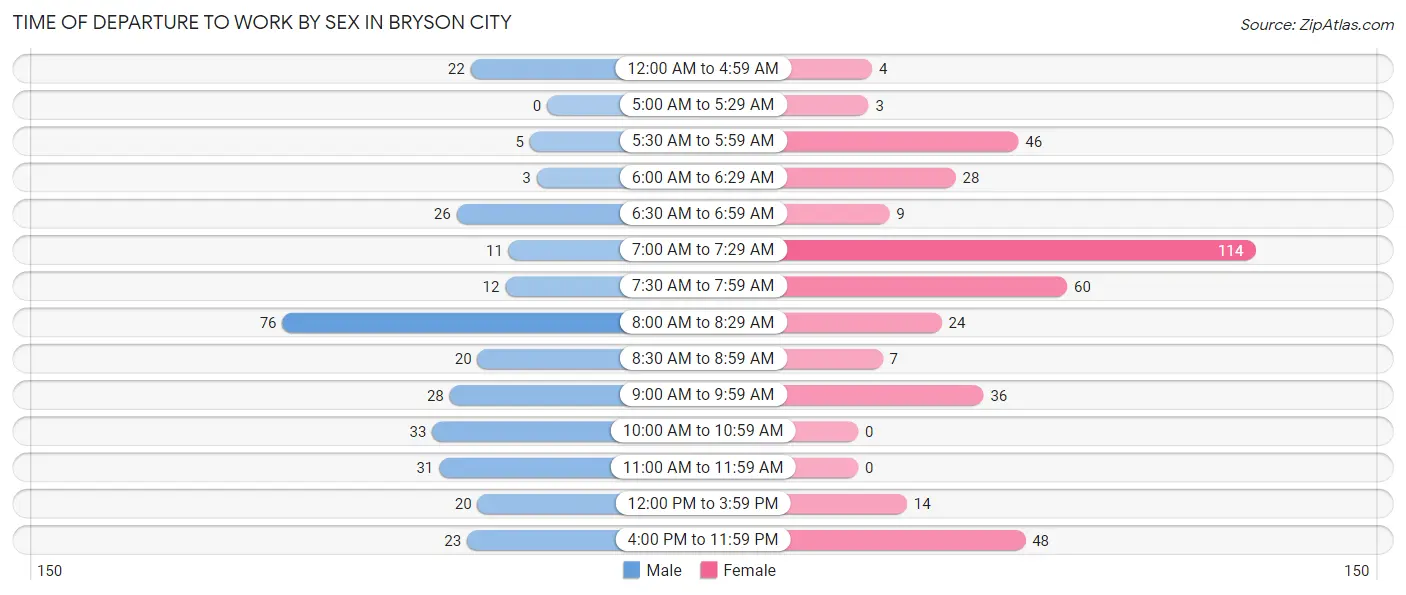
| Time of Departure | Male | Female |
| 12:00 AM to 4:59 AM | 22 (7.1%) | 4 (1.0%) |
| 5:00 AM to 5:29 AM | 0 (0.0%) | 3 (0.8%) |
| 5:30 AM to 5:59 AM | 5 (1.6%) | 46 (11.7%) |
| 6:00 AM to 6:29 AM | 3 (1.0%) | 28 (7.1%) |
| 6:30 AM to 6:59 AM | 26 (8.4%) | 9 (2.3%) |
| 7:00 AM to 7:29 AM | 11 (3.5%) | 114 (29.0%) |
| 7:30 AM to 7:59 AM | 12 (3.9%) | 60 (15.3%) |
| 8:00 AM to 8:29 AM | 76 (24.5%) | 24 (6.1%) |
| 8:30 AM to 8:59 AM | 20 (6.5%) | 7 (1.8%) |
| 9:00 AM to 9:59 AM | 28 (9.0%) | 36 (9.2%) |
| 10:00 AM to 10:59 AM | 33 (10.6%) | 0 (0.0%) |
| 11:00 AM to 11:59 AM | 31 (10.0%) | 0 (0.0%) |
| 12:00 PM to 3:59 PM | 20 (6.5%) | 14 (3.6%) |
| 4:00 PM to 11:59 PM | 23 (7.4%) | 48 (12.2%) |
| Total | 310 (100.0%) | 393 (100.0%) |
Housing Occupancy in Bryson City
Occupancy by Ownership in Bryson City
Of the total 643 dwellings in Bryson City, owner-occupied units account for 335 (52.1%), while renter-occupied units make up 308 (47.9%).
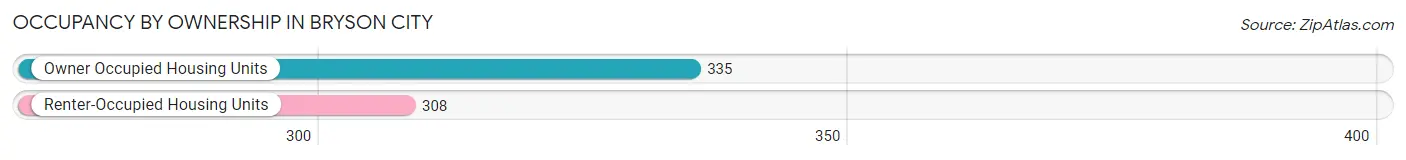
| Occupancy | # Housing Units | % Housing Units |
| Owner Occupied Housing Units | 335 | 52.1% |
| Renter-Occupied Housing Units | 308 | 47.9% |
| Total Occupied Housing Units | 643 | 100.0% |
Occupancy by Household Size in Bryson City
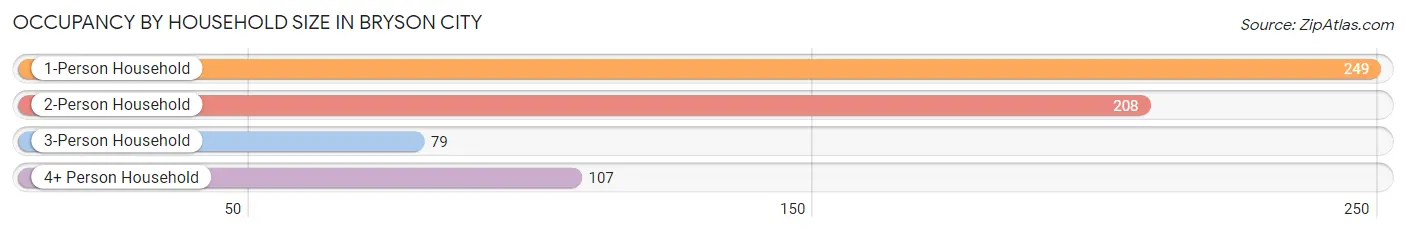
| Household Size | # Housing Units | % Housing Units |
| 1-Person Household | 249 | 38.7% |
| 2-Person Household | 208 | 32.4% |
| 3-Person Household | 79 | 12.3% |
| 4+ Person Household | 107 | 16.6% |
| Total Housing Units | 643 | 100.0% |
Occupancy by Ownership by Household Size in Bryson City
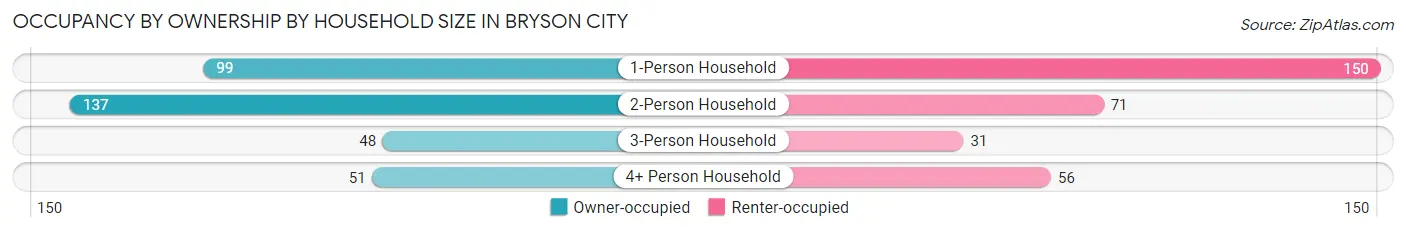
| Household Size | Owner-occupied | Renter-occupied |
| 1-Person Household | 99 (39.8%) | 150 (60.2%) |
| 2-Person Household | 137 (65.9%) | 71 (34.1%) |
| 3-Person Household | 48 (60.8%) | 31 (39.2%) |
| 4+ Person Household | 51 (47.7%) | 56 (52.3%) |
| Total Housing Units | 335 (52.1%) | 308 (47.9%) |
Occupancy by Educational Attainment in Bryson City
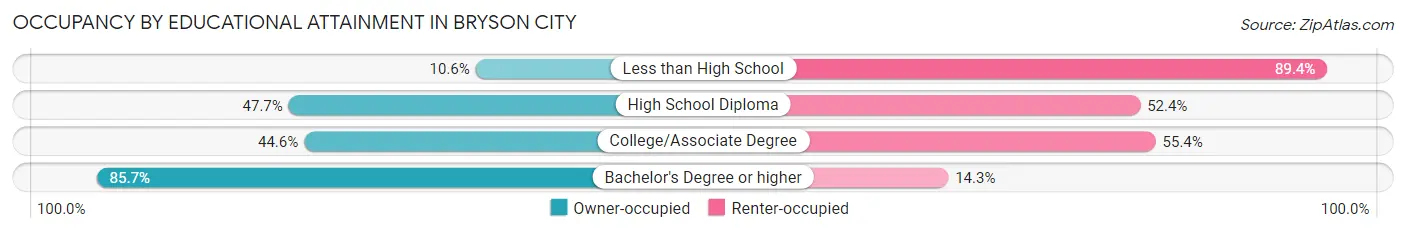
| Household Size | Owner-occupied | Renter-occupied |
| Less than High School | 9 (10.6%) | 76 (89.4%) |
| High School Diploma | 81 (47.6%) | 89 (52.3%) |
| College/Associate Degree | 95 (44.6%) | 118 (55.4%) |
| Bachelor's Degree or higher | 150 (85.7%) | 25 (14.3%) |
Occupancy by Age of Householder in Bryson City
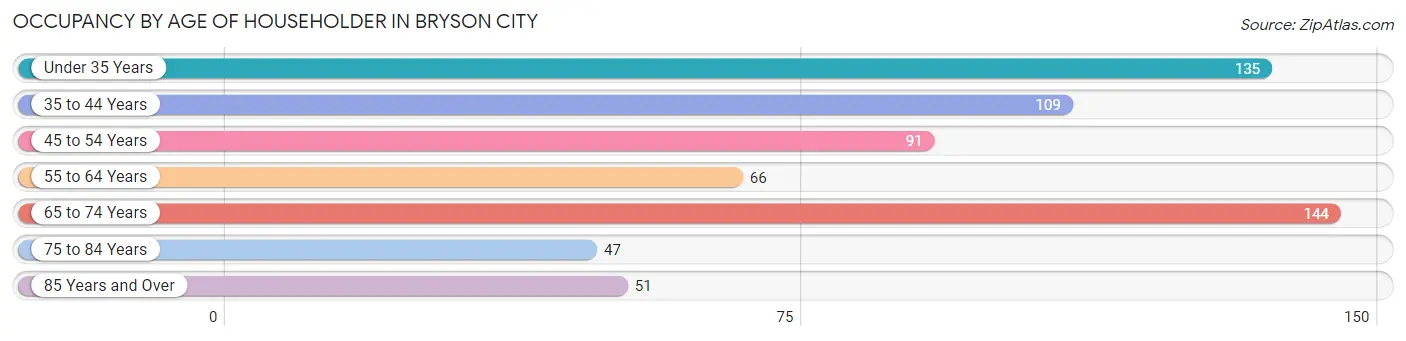
| Age Bracket | # Households | % Households |
| Under 35 Years | 135 | 21.0% |
| 35 to 44 Years | 109 | 17.0% |
| 45 to 54 Years | 91 | 14.1% |
| 55 to 64 Years | 66 | 10.3% |
| 65 to 74 Years | 144 | 22.4% |
| 75 to 84 Years | 47 | 7.3% |
| 85 Years and Over | 51 | 7.9% |
| Total | 643 | 100.0% |
Housing Finances in Bryson City
Median Income by Occupancy in Bryson City
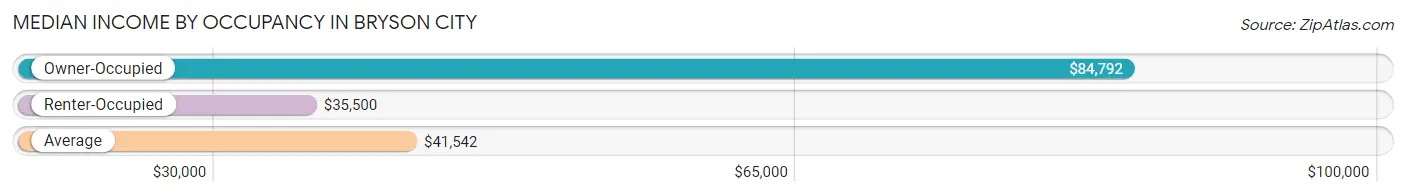
| Occupancy Type | # Households | Median Income |
| Owner-Occupied | 335 (52.1%) | $84,792 |
| Renter-Occupied | 308 (47.9%) | $35,500 |
| Average | 643 (100.0%) | $41,542 |
Occupancy by Householder Income Bracket in Bryson City
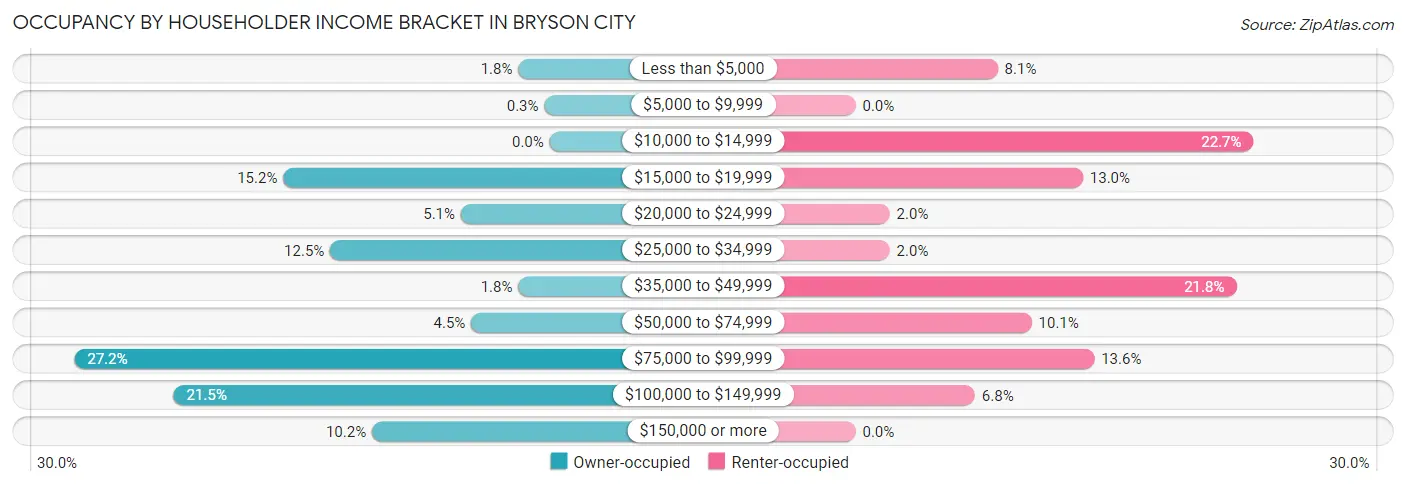
| Income Bracket | Owner-occupied | Renter-occupied |
| Less than $5,000 | 6 (1.8%) | 25 (8.1%) |
| $5,000 to $9,999 | 1 (0.3%) | 0 (0.0%) |
| $10,000 to $14,999 | 0 (0.0%) | 70 (22.7%) |
| $15,000 to $19,999 | 51 (15.2%) | 40 (13.0%) |
| $20,000 to $24,999 | 17 (5.1%) | 6 (1.9%) |
| $25,000 to $34,999 | 42 (12.5%) | 6 (1.9%) |
| $35,000 to $49,999 | 6 (1.8%) | 67 (21.7%) |
| $50,000 to $74,999 | 15 (4.5%) | 31 (10.1%) |
| $75,000 to $99,999 | 91 (27.2%) | 42 (13.6%) |
| $100,000 to $149,999 | 72 (21.5%) | 21 (6.8%) |
| $150,000 or more | 34 (10.2%) | 0 (0.0%) |
| Total | 335 (100.0%) | 308 (100.0%) |
Monthly Housing Cost Tiers in Bryson City
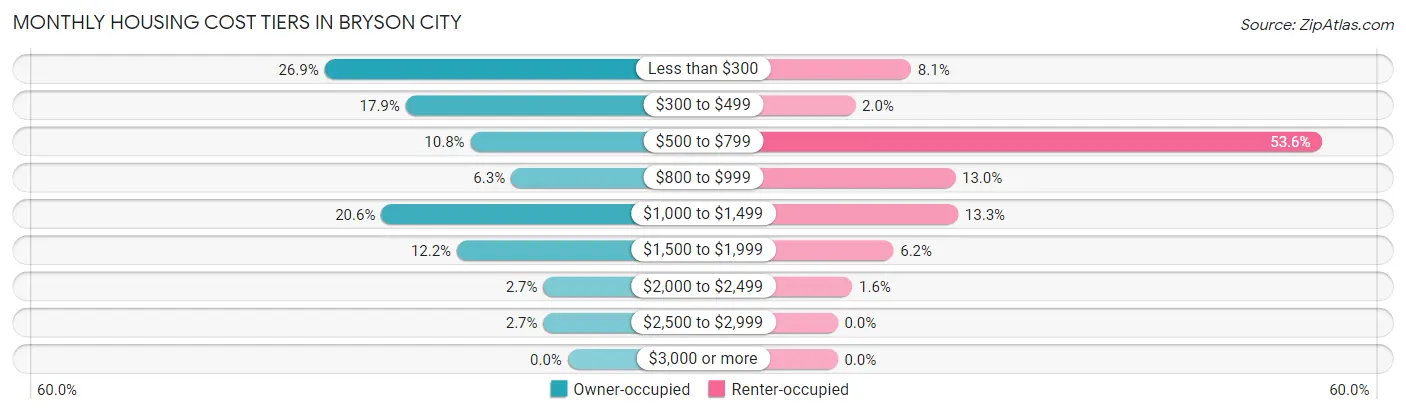
| Monthly Cost | Owner-occupied | Renter-occupied |
| Less than $300 | 90 (26.9%) | 25 (8.1%) |
| $300 to $499 | 60 (17.9%) | 6 (1.9%) |
| $500 to $799 | 36 (10.7%) | 165 (53.6%) |
| $800 to $999 | 21 (6.3%) | 40 (13.0%) |
| $1,000 to $1,499 | 69 (20.6%) | 41 (13.3%) |
| $1,500 to $1,999 | 41 (12.2%) | 19 (6.2%) |
| $2,000 to $2,499 | 9 (2.7%) | 5 (1.6%) |
| $2,500 to $2,999 | 9 (2.7%) | 0 (0.0%) |
| $3,000 or more | 0 (0.0%) | 0 (0.0%) |
| Total | 335 (100.0%) | 308 (100.0%) |
Physical Housing Characteristics in Bryson City
Housing Structures in Bryson City
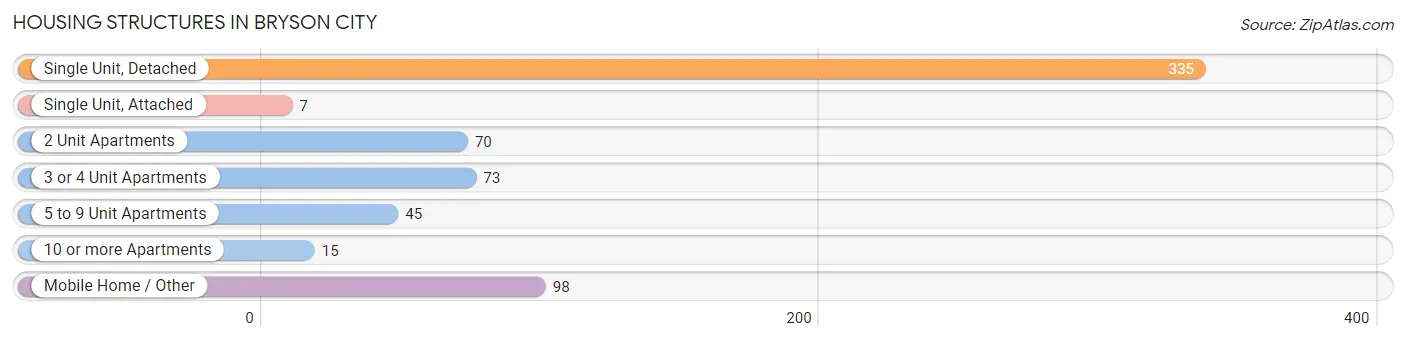
| Structure Type | # Housing Units | % Housing Units |
| Single Unit, Detached | 335 | 52.1% |
| Single Unit, Attached | 7 | 1.1% |
| 2 Unit Apartments | 70 | 10.9% |
| 3 or 4 Unit Apartments | 73 | 11.4% |
| 5 to 9 Unit Apartments | 45 | 7.0% |
| 10 or more Apartments | 15 | 2.3% |
| Mobile Home / Other | 98 | 15.2% |
| Total | 643 | 100.0% |
Housing Structures by Occupancy in Bryson City
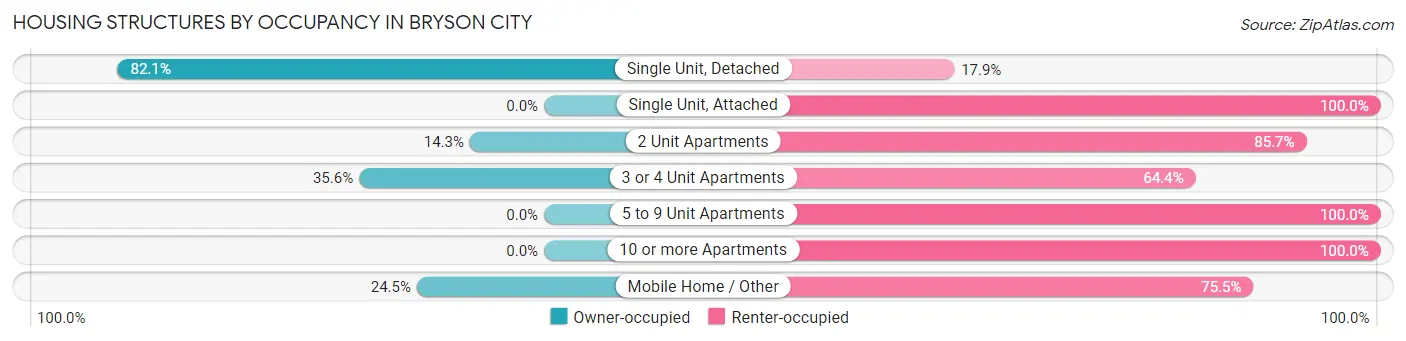
| Structure Type | Owner-occupied | Renter-occupied |
| Single Unit, Detached | 275 (82.1%) | 60 (17.9%) |
| Single Unit, Attached | 0 (0.0%) | 7 (100.0%) |
| 2 Unit Apartments | 10 (14.3%) | 60 (85.7%) |
| 3 or 4 Unit Apartments | 26 (35.6%) | 47 (64.4%) |
| 5 to 9 Unit Apartments | 0 (0.0%) | 45 (100.0%) |
| 10 or more Apartments | 0 (0.0%) | 15 (100.0%) |
| Mobile Home / Other | 24 (24.5%) | 74 (75.5%) |
| Total | 335 (52.1%) | 308 (47.9%) |
Housing Structures by Number of Rooms in Bryson City
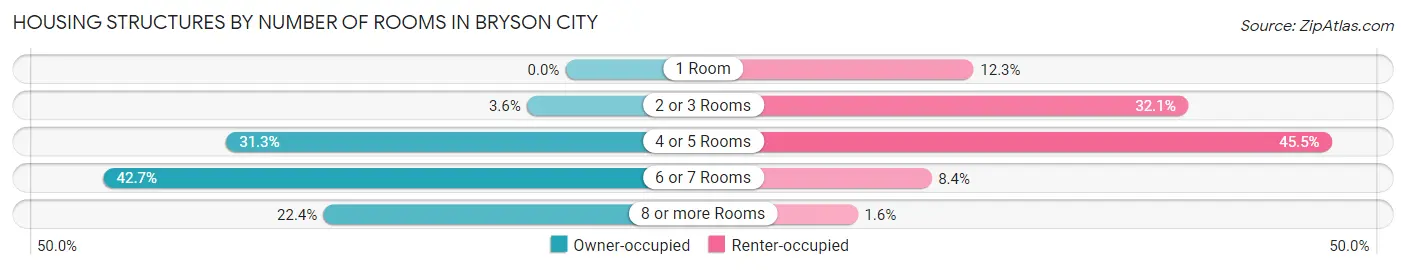
| Number of Rooms | Owner-occupied | Renter-occupied |
| 1 Room | 0 (0.0%) | 38 (12.3%) |
| 2 or 3 Rooms | 12 (3.6%) | 99 (32.1%) |
| 4 or 5 Rooms | 105 (31.3%) | 140 (45.5%) |
| 6 or 7 Rooms | 143 (42.7%) | 26 (8.4%) |
| 8 or more Rooms | 75 (22.4%) | 5 (1.6%) |
| Total | 335 (100.0%) | 308 (100.0%) |
Housing Structure by Heating Type in Bryson City
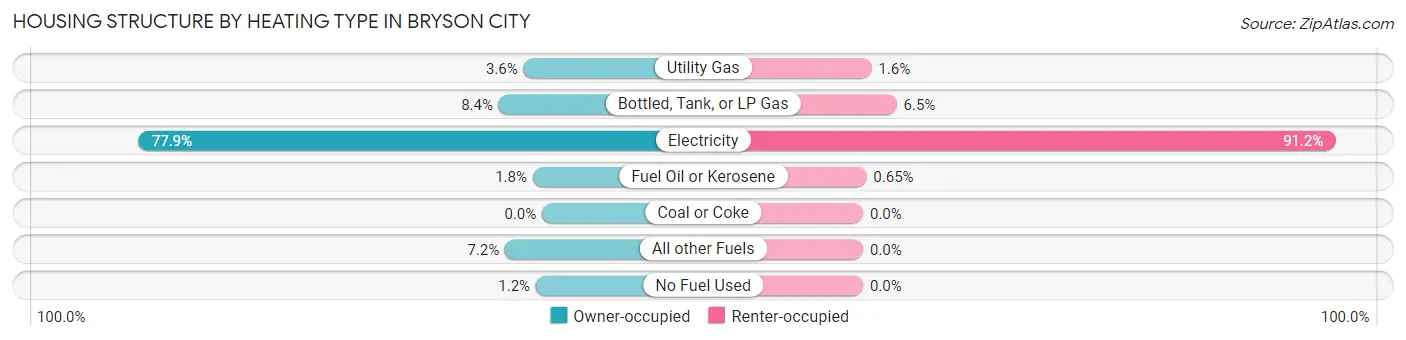
| Heating Type | Owner-occupied | Renter-occupied |
| Utility Gas | 12 (3.6%) | 5 (1.6%) |
| Bottled, Tank, or LP Gas | 28 (8.4%) | 20 (6.5%) |
| Electricity | 261 (77.9%) | 281 (91.2%) |
| Fuel Oil or Kerosene | 6 (1.8%) | 2 (0.6%) |
| Coal or Coke | 0 (0.0%) | 0 (0.0%) |
| All other Fuels | 24 (7.2%) | 0 (0.0%) |
| No Fuel Used | 4 (1.2%) | 0 (0.0%) |
| Total | 335 (100.0%) | 308 (100.0%) |
Household Vehicle Usage in Bryson City
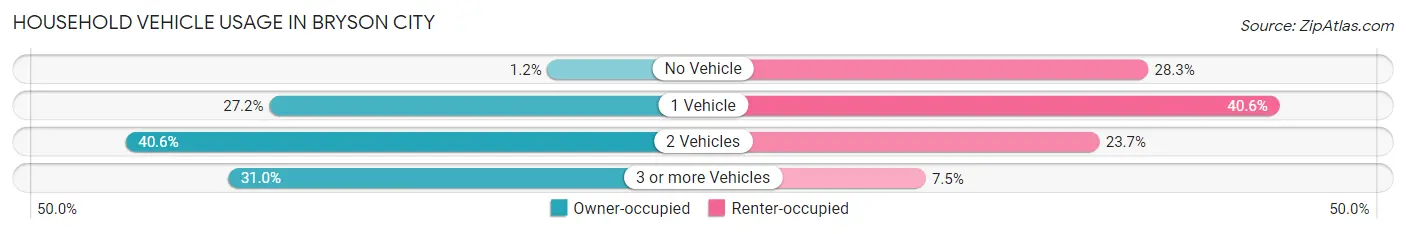
| Vehicles per Household | Owner-occupied | Renter-occupied |
| No Vehicle | 4 (1.2%) | 87 (28.2%) |
| 1 Vehicle | 91 (27.2%) | 125 (40.6%) |
| 2 Vehicles | 136 (40.6%) | 73 (23.7%) |
| 3 or more Vehicles | 104 (31.0%) | 23 (7.5%) |
| Total | 335 (100.0%) | 308 (100.0%) |
Real Estate & Mortgages in Bryson City
Real Estate and Mortgage Overview in Bryson City
| Characteristic | Without Mortgage | With Mortgage |
| Housing Units | 179 | 156 |
| Median Property Value | $262,900 | $217,100 |
| Median Household Income | - | - |
| Monthly Housing Costs | $300 | $0 |
| Real Estate Taxes | $1,100 | $18 |
Property Value by Mortgage Status in Bryson City
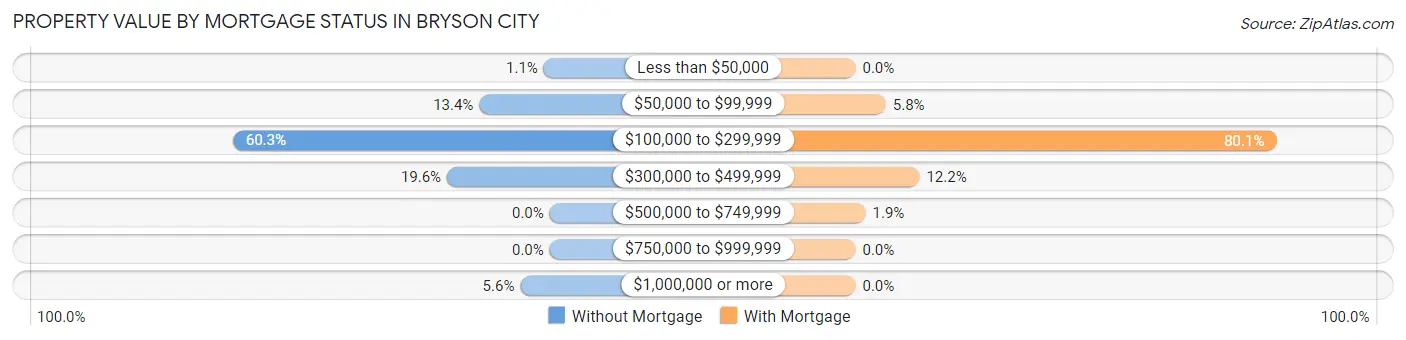
| Property Value | Without Mortgage | With Mortgage |
| Less than $50,000 | 2 (1.1%) | 0 (0.0%) |
| $50,000 to $99,999 | 24 (13.4%) | 9 (5.8%) |
| $100,000 to $299,999 | 108 (60.3%) | 125 (80.1%) |
| $300,000 to $499,999 | 35 (19.6%) | 19 (12.2%) |
| $500,000 to $749,999 | 0 (0.0%) | 3 (1.9%) |
| $750,000 to $999,999 | 0 (0.0%) | 0 (0.0%) |
| $1,000,000 or more | 10 (5.6%) | 0 (0.0%) |
| Total | 179 (100.0%) | 156 (100.0%) |
Household Income by Mortgage Status in Bryson City
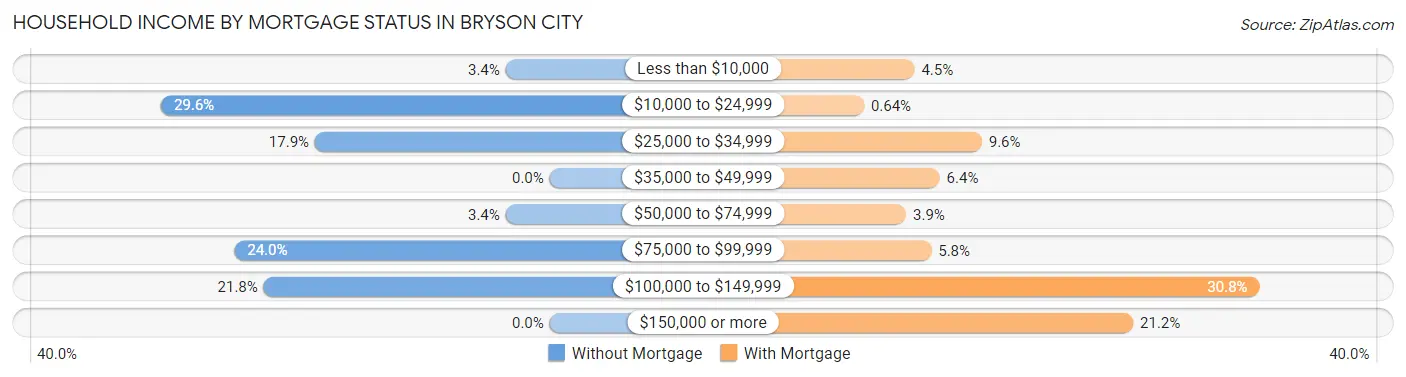
| Household Income | Without Mortgage | With Mortgage |
| Less than $10,000 | 6 (3.4%) | 7 (4.5%) |
| $10,000 to $24,999 | 53 (29.6%) | 1 (0.6%) |
| $25,000 to $34,999 | 32 (17.9%) | 15 (9.6%) |
| $35,000 to $49,999 | 0 (0.0%) | 10 (6.4%) |
| $50,000 to $74,999 | 6 (3.4%) | 6 (3.8%) |
| $75,000 to $99,999 | 43 (24.0%) | 9 (5.8%) |
| $100,000 to $149,999 | 39 (21.8%) | 48 (30.8%) |
| $150,000 or more | 0 (0.0%) | 33 (21.1%) |
| Total | 179 (100.0%) | 156 (100.0%) |
Property Value to Household Income Ratio in Bryson City
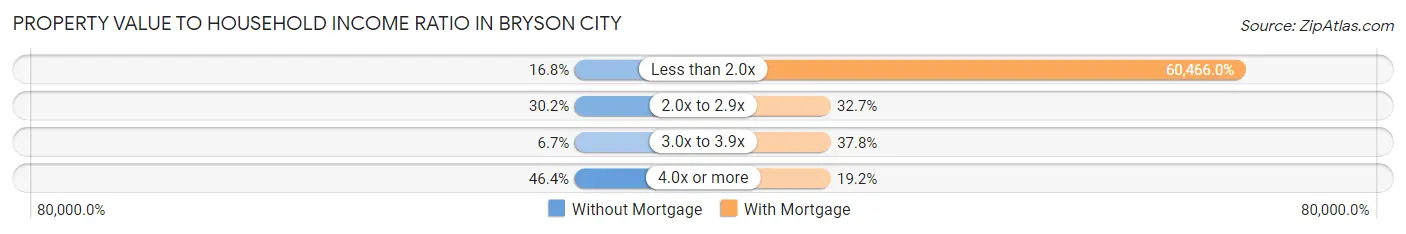
| Value-to-Income Ratio | Without Mortgage | With Mortgage |
| Less than 2.0x | 30 (16.8%) | 94,327 (60,466.0%) |
| 2.0x to 2.9x | 54 (30.2%) | 51 (32.7%) |
| 3.0x to 3.9x | 12 (6.7%) | 59 (37.8%) |
| 4.0x or more | 83 (46.4%) | 30 (19.2%) |
| Total | 179 (100.0%) | 156 (100.0%) |
Real Estate Taxes by Mortgage Status in Bryson City
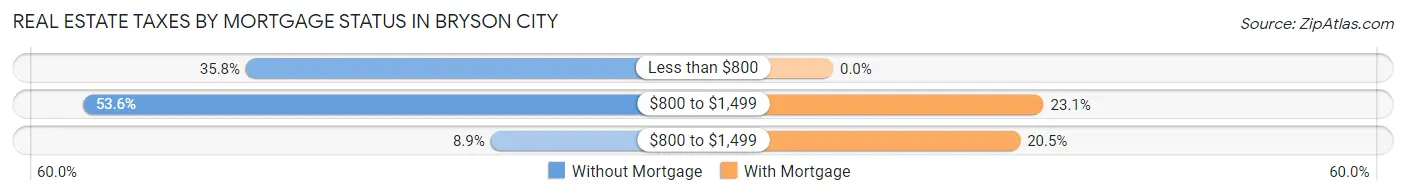
| Property Taxes | Without Mortgage | With Mortgage |
| Less than $800 | 64 (35.7%) | 0 (0.0%) |
| $800 to $1,499 | 96 (53.6%) | 36 (23.1%) |
| $800 to $1,499 | 16 (8.9%) | 32 (20.5%) |
| Total | 179 (100.0%) | 156 (100.0%) |
Health & Disability in Bryson City
Health Insurance Coverage by Age in Bryson City
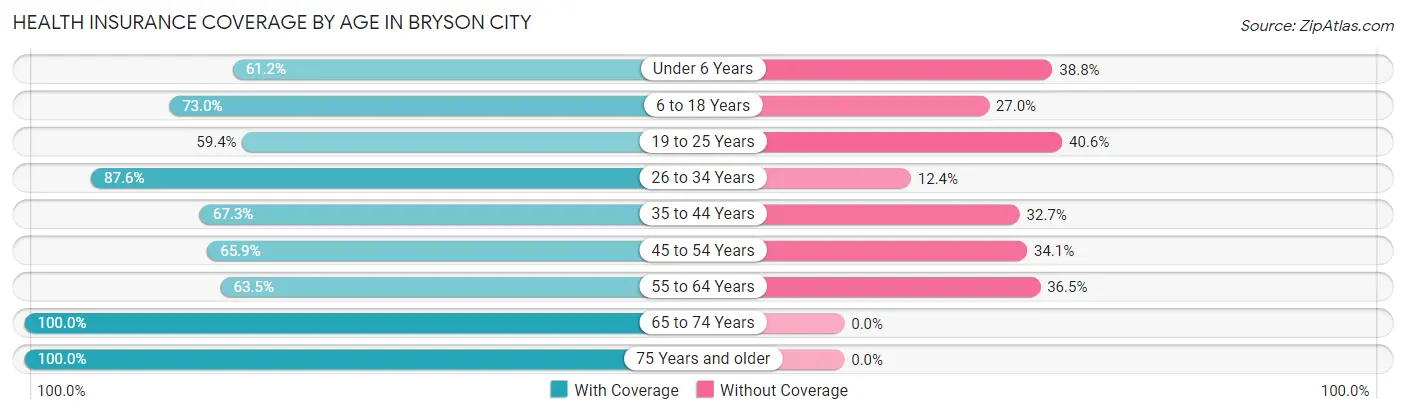
| Age Bracket | With Coverage | Without Coverage |
| Under 6 Years | 41 (61.2%) | 26 (38.8%) |
| 6 to 18 Years | 260 (73.0%) | 96 (27.0%) |
| 19 to 25 Years | 76 (59.4%) | 52 (40.6%) |
| 26 to 34 Years | 120 (87.6%) | 17 (12.4%) |
| 35 to 44 Years | 142 (67.3%) | 69 (32.7%) |
| 45 to 54 Years | 118 (65.9%) | 61 (34.1%) |
| 55 to 64 Years | 66 (63.5%) | 38 (36.5%) |
| 65 to 74 Years | 192 (100.0%) | 0 (0.0%) |
| 75 Years and older | 124 (100.0%) | 0 (0.0%) |
| Total | 1,139 (76.0%) | 359 (24.0%) |
Health Insurance Coverage by Citizenship Status in Bryson City
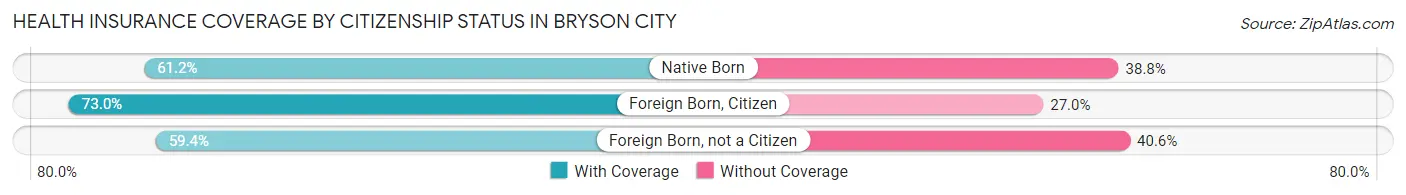
| Citizenship Status | With Coverage | Without Coverage |
| Native Born | 41 (61.2%) | 26 (38.8%) |
| Foreign Born, Citizen | 260 (73.0%) | 96 (27.0%) |
| Foreign Born, not a Citizen | 76 (59.4%) | 52 (40.6%) |
Health Insurance Coverage by Household Income in Bryson City
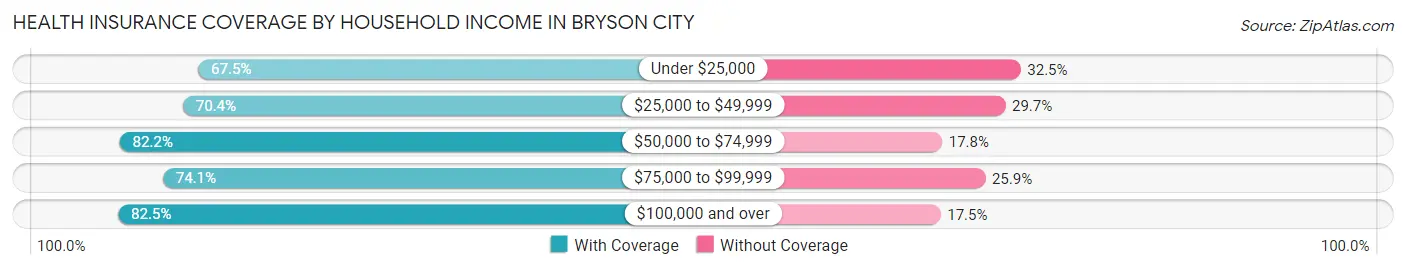
| Household Income | With Coverage | Without Coverage |
| Under $25,000 | 222 (67.5%) | 107 (32.5%) |
| $25,000 to $49,999 | 140 (70.4%) | 59 (29.6%) |
| $50,000 to $74,999 | 157 (82.2%) | 34 (17.8%) |
| $75,000 to $99,999 | 249 (74.1%) | 87 (25.9%) |
| $100,000 and over | 339 (82.5%) | 72 (17.5%) |
Public vs Private Health Insurance Coverage by Age in Bryson City
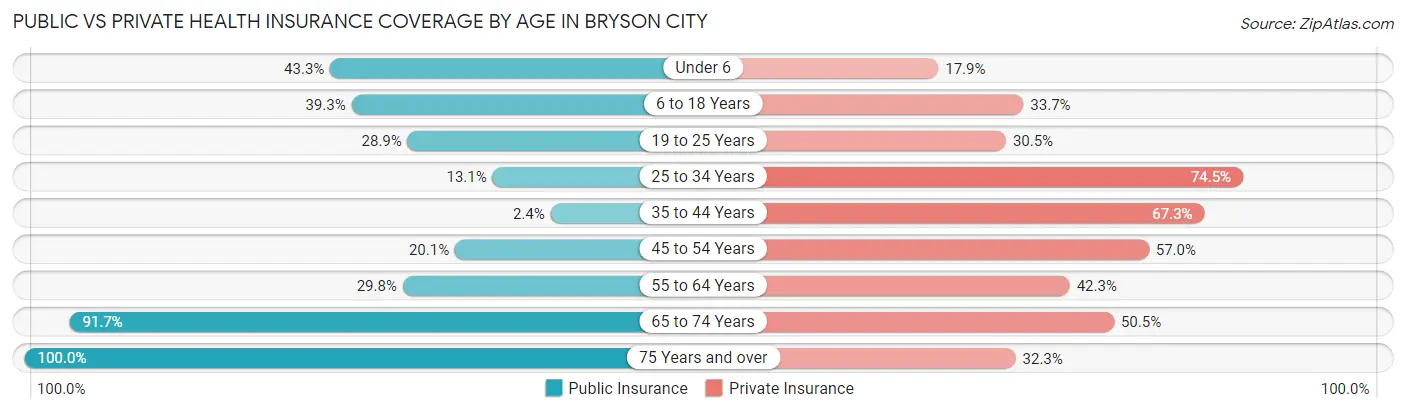
| Age Bracket | Public Insurance | Private Insurance |
| Under 6 | 29 (43.3%) | 12 (17.9%) |
| 6 to 18 Years | 140 (39.3%) | 120 (33.7%) |
| 19 to 25 Years | 37 (28.9%) | 39 (30.5%) |
| 25 to 34 Years | 18 (13.1%) | 102 (74.5%) |
| 35 to 44 Years | 5 (2.4%) | 142 (67.3%) |
| 45 to 54 Years | 36 (20.1%) | 102 (57.0%) |
| 55 to 64 Years | 31 (29.8%) | 44 (42.3%) |
| 65 to 74 Years | 176 (91.7%) | 97 (50.5%) |
| 75 Years and over | 124 (100.0%) | 40 (32.3%) |
| Total | 596 (39.8%) | 698 (46.6%) |
Disability Status by Sex by Age in Bryson City
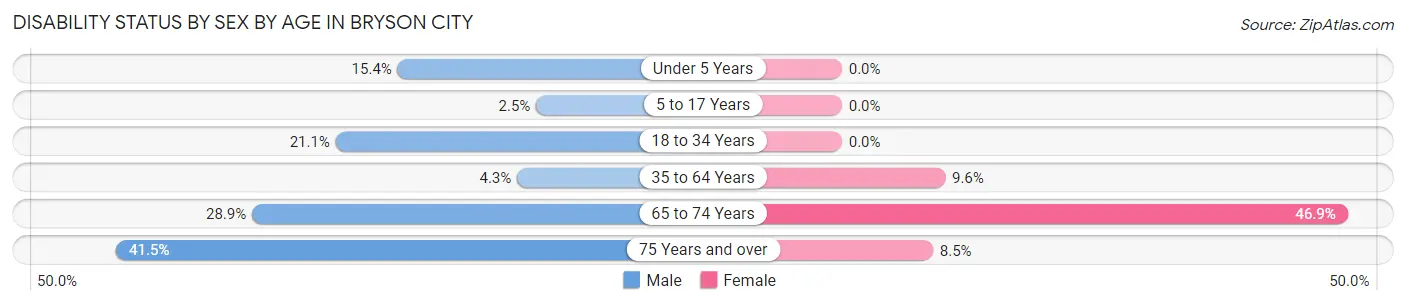
| Age Bracket | Male | Female |
| Under 5 Years | 6 (15.4%) | 0 (0.0%) |
| 5 to 17 Years | 4 (2.5%) | 0 (0.0%) |
| 18 to 34 Years | 30 (21.1%) | 0 (0.0%) |
| 35 to 64 Years | 10 (4.3%) | 25 (9.6%) |
| 65 to 74 Years | 13 (28.9%) | 69 (46.9%) |
| 75 Years and over | 22 (41.5%) | 6 (8.5%) |
Disability Class by Sex by Age in Bryson City
Disability Class: Hearing Difficulty
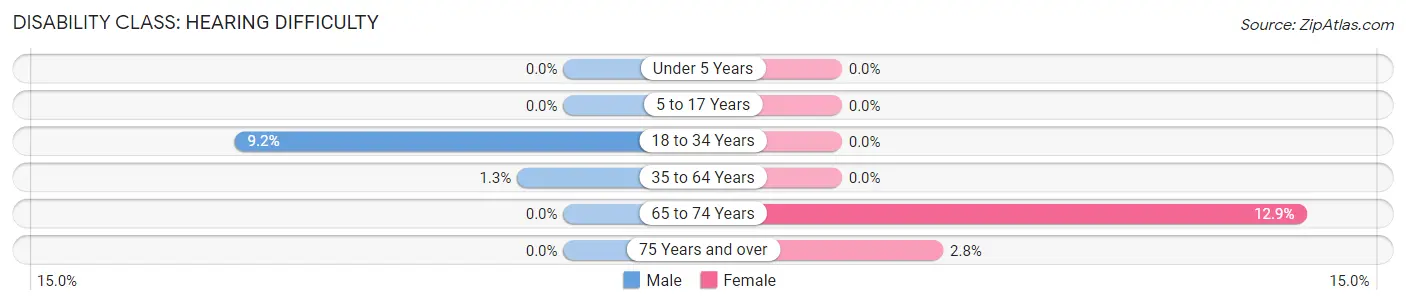
| Age Bracket | Male | Female |
| Under 5 Years | 0 (0.0%) | 0 (0.0%) |
| 5 to 17 Years | 0 (0.0%) | 0 (0.0%) |
| 18 to 34 Years | 13 (9.1%) | 0 (0.0%) |
| 35 to 64 Years | 3 (1.3%) | 0 (0.0%) |
| 65 to 74 Years | 0 (0.0%) | 19 (12.9%) |
| 75 Years and over | 0 (0.0%) | 2 (2.8%) |
Disability Class: Vision Difficulty
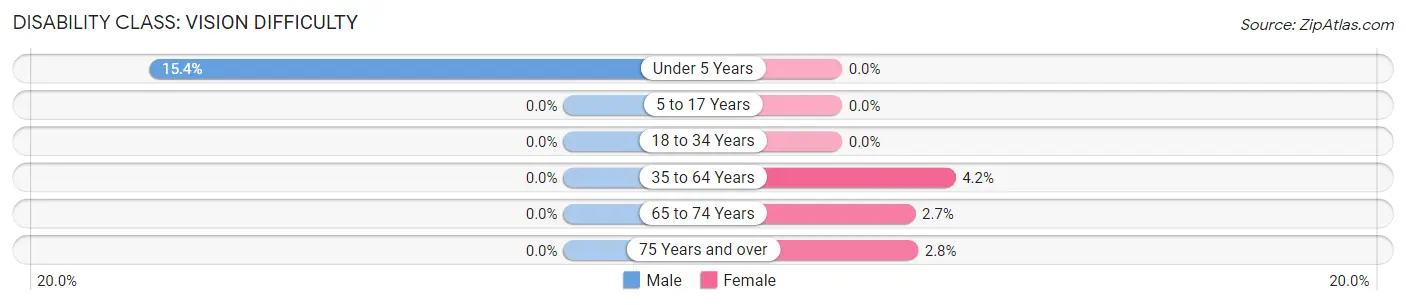
| Age Bracket | Male | Female |
| Under 5 Years | 6 (15.4%) | 0 (0.0%) |
| 5 to 17 Years | 0 (0.0%) | 0 (0.0%) |
| 18 to 34 Years | 0 (0.0%) | 0 (0.0%) |
| 35 to 64 Years | 0 (0.0%) | 11 (4.2%) |
| 65 to 74 Years | 0 (0.0%) | 4 (2.7%) |
| 75 Years and over | 0 (0.0%) | 2 (2.8%) |
Disability Class: Cognitive Difficulty
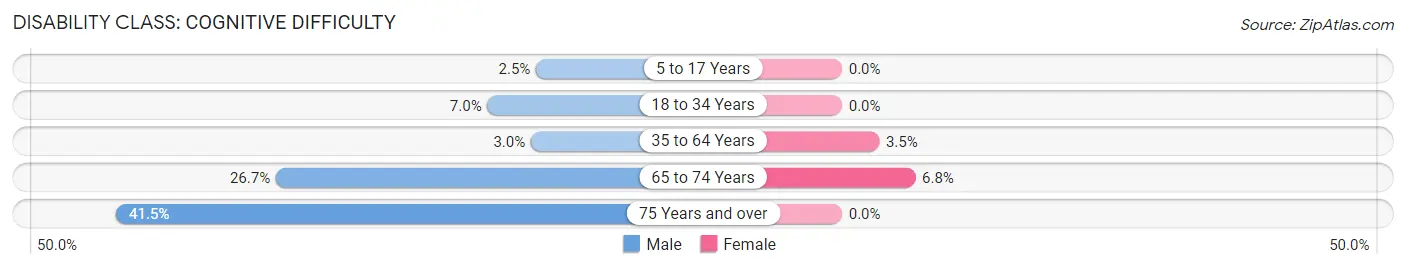
| Age Bracket | Male | Female |
| 5 to 17 Years | 4 (2.5%) | 0 (0.0%) |
| 18 to 34 Years | 10 (7.0%) | 0 (0.0%) |
| 35 to 64 Years | 7 (3.0%) | 9 (3.5%) |
| 65 to 74 Years | 12 (26.7%) | 10 (6.8%) |
| 75 Years and over | 22 (41.5%) | 0 (0.0%) |
Disability Class: Ambulatory Difficulty
| Age Bracket | Male | Female |
| 5 to 17 Years | 0 (0.0%) | 0 (0.0%) |
| 18 to 34 Years | 0 (0.0%) | 0 (0.0%) |
| 35 to 64 Years | 0 (0.0%) | 21 (8.1%) |
| 65 to 74 Years | 1 (2.2%) | 46 (31.3%) |
| 75 Years and over | 4 (7.5%) | 4 (5.6%) |
Disability Class: Self-Care Difficulty
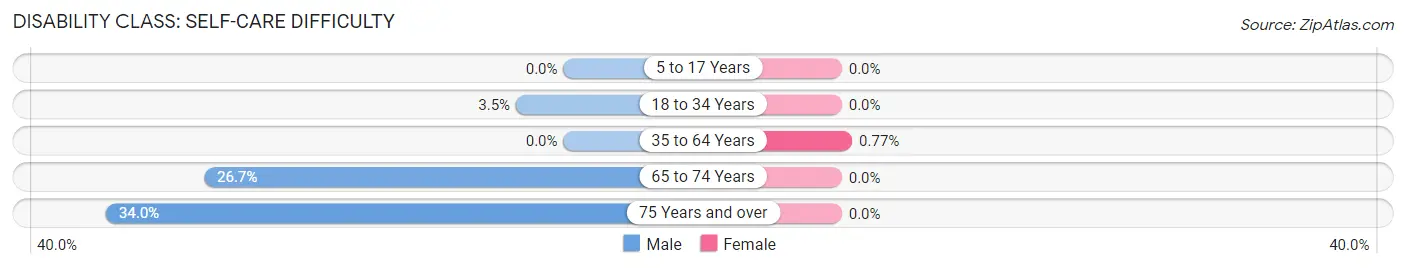
| Age Bracket | Male | Female |
| 5 to 17 Years | 0 (0.0%) | 0 (0.0%) |
| 18 to 34 Years | 5 (3.5%) | 0 (0.0%) |
| 35 to 64 Years | 0 (0.0%) | 2 (0.8%) |
| 65 to 74 Years | 12 (26.7%) | 0 (0.0%) |
| 75 Years and over | 18 (34.0%) | 0 (0.0%) |
Technology Access in Bryson City
Computing Device Access in Bryson City
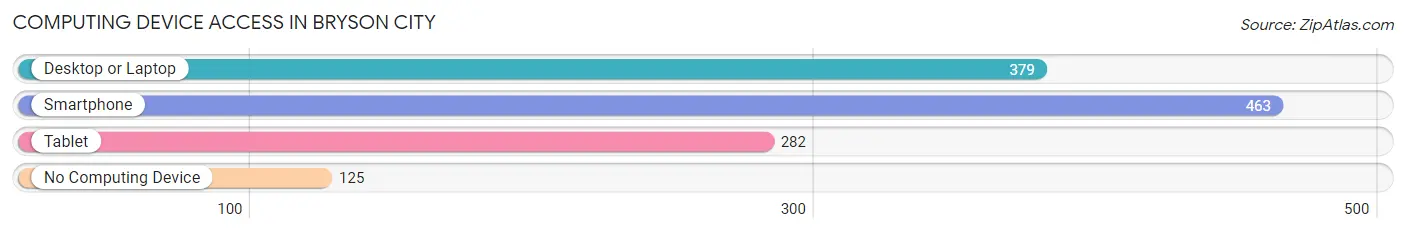
| Device Type | # Households | % Households |
| Desktop or Laptop | 379 | 58.9% |
| Smartphone | 463 | 72.0% |
| Tablet | 282 | 43.9% |
| No Computing Device | 125 | 19.4% |
| Total | 643 | 100.0% |
Internet Access in Bryson City
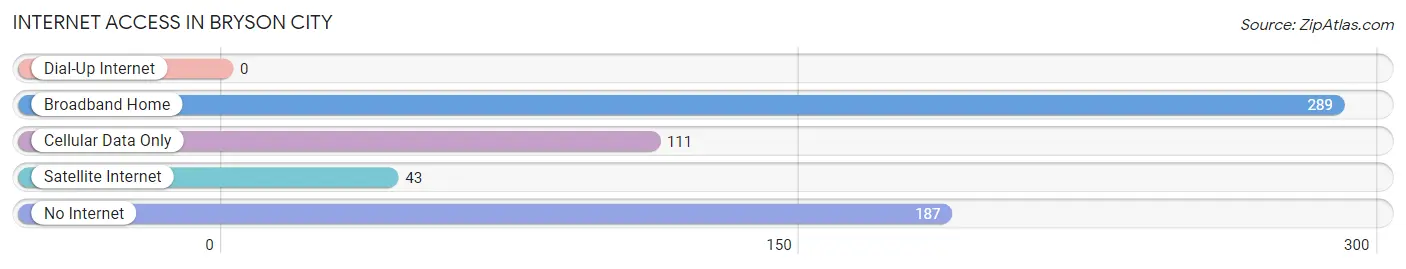
| Internet Type | # Households | % Households |
| Dial-Up Internet | 0 | 0.0% |
| Broadband Home | 289 | 45.0% |
| Cellular Data Only | 111 | 17.3% |
| Satellite Internet | 43 | 6.7% |
| No Internet | 187 | 29.1% |
| Total | 643 | 100.0% |
Bryson City Summary
Bryson City is a small town located in the western part of North Carolina, in the Great Smoky Mountains. It is the county seat of Swain County and is situated along the Tuckasegee River. The town has a population of 1,424 as of the 2010 census.
History
Bryson City was founded in 1872 by Colonel Thaddeus Bryson, a former Confederate soldier. He named the town after himself and it quickly became a popular destination for tourists and settlers. The town was incorporated in 1889 and was the first town in Swain County.
The town was a major stop on the Murphy Branch of the Western North Carolina Railroad, which ran from Asheville to Murphy. The railroad brought in tourists and settlers, and the town grew rapidly. The railroad also helped to bring in timber and other resources from the surrounding mountains.
The town was also a major stop on the Great Smoky Mountains Railroad, which ran from Bryson City to Dillsboro. This railroad was used to transport timber and other resources from the mountains to the coast.
Geography
Bryson City is located in the western part of North Carolina, in the Great Smoky Mountains. It is situated along the Tuckasegee River, which flows through the town. The town is surrounded by the Nantahala National Forest and the Great Smoky Mountains National Park.
The town has a total area of 2.2 square miles, all of which is land. The town is located at an elevation of 1,890 feet above sea level.
Economy
The economy of Bryson City is largely based on tourism. The town is a popular destination for outdoor activities such as fishing, hiking, camping, and whitewater rafting. The town is also home to several attractions, including the Great Smoky Mountains Railroad, the Nantahala Outdoor Center, and the Great Smoky Mountains National Park.
The town is also home to several businesses, including restaurants, shops, and lodging. The town is also home to several manufacturing companies, including a furniture factory and a paper mill.
Demographics
As of the 2010 census, the population of Bryson City was 1,424. The racial makeup of the town was 95.3% White, 0.7% African American, 0.7% Native American, 0.3% Asian, 0.1% Pacific Islander, and 2.0% from other races. The median household income was $30,938 and the median family income was $37,813.
Conclusion
Bryson City is a small town located in the western part of North Carolina, in the Great Smoky Mountains. It is the county seat of Swain County and is situated along the Tuckasegee River. The town has a population of 1,424 as of the 2010 census. The town was founded in 1872 by Colonel Thaddeus Bryson and was incorporated in 1889. The economy of Bryson City is largely based on tourism, with outdoor activities, attractions, and businesses being the main sources of income. The racial makeup of the town is 95.3% White, 0.7% African American, 0.7% Native American, 0.3% Asian, 0.1% Pacific Islander, and 2.0% from other races. The median household income was $30,938 and the median family income was $37,813. Bryson City is a popular destination for tourists and settlers alike, and is a great place to visit and explore.
Common Questions
What is Per Capita Income in Bryson City?
Per Capita income in Bryson City is $24,001.
What is the Median Family Income in Bryson City?
Median Family Income in Bryson City is $83,750.
What is the Median Household income in Bryson City?
Median Household Income in Bryson City is $41,542.
What is Income or Wage Gap in Bryson City?
Income or Wage Gap in Bryson City is 25.2%.
Women in Bryson City earn 74.8 cents for every dollar earned by a man.
What is Inequality or Gini Index in Bryson City?
Inequality or Gini Index in Bryson City is 0.43.
What is the Total Population of Bryson City?
Total Population of Bryson City is 1,638.
What is the Total Male Population of Bryson City?
Total Male Population of Bryson City is 731.
What is the Total Female Population of Bryson City?
Total Female Population of Bryson City is 907.
What is the Ratio of Males per 100 Females in Bryson City?
There are 80.60 Males per 100 Females in Bryson City.
What is the Ratio of Females per 100 Males in Bryson City?
There are 124.08 Females per 100 Males in Bryson City.
What is the Median Population Age in Bryson City?
Median Population Age in Bryson City is 39.9 Years.
What is the Average Family Size in Bryson City
Average Family Size in Bryson City is 3.0 People.
What is the Average Household Size in Bryson City
Average Household Size in Bryson City is 2.3 People.
How Large is the Labor Force in Bryson City?
There are 718 People in the Labor Forcein in Bryson City.
What is the Percentage of People in the Labor Force in Bryson City?
55.5% of People are in the Labor Force in Bryson City.
What is the Unemployment Rate in Bryson City?
Unemployment Rate in Bryson City is 1.0%.