Zip Codes with the Highest Percentage of Population with a Degree in Communications in Louisville, KY
RELATED REPORTS & OPTIONS
Communications
Louisville
Compare Zip Codes
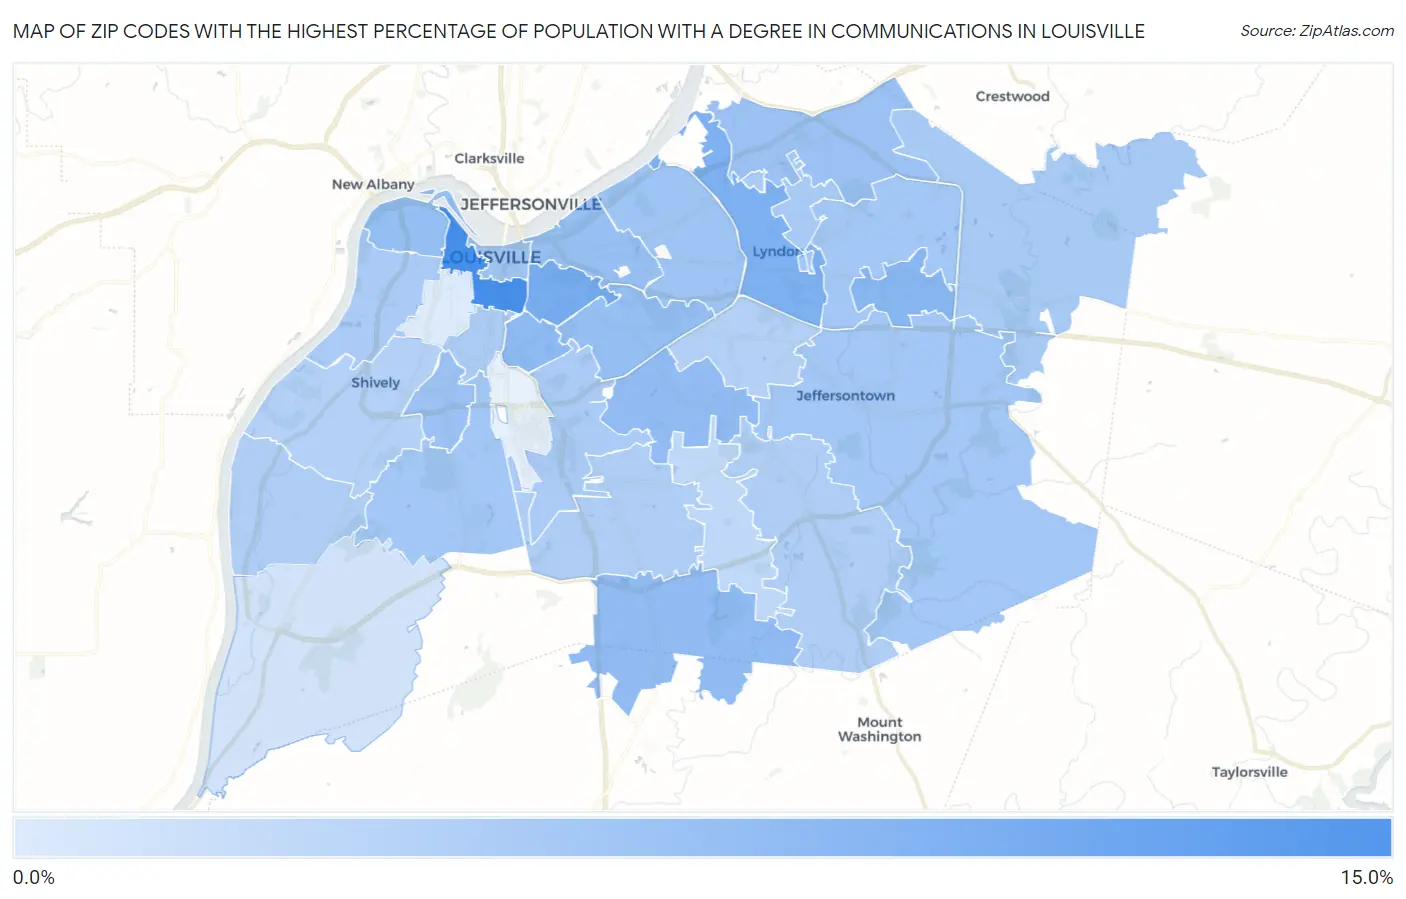
Map of Zip Codes with the Highest Percentage of Population with a Degree in Communications in Louisville
1.1%
12.4%
Zip Codes with the Highest Percentage of Population with a Degree in Communications in Louisville, KY
| Zip Code | % Graduates | vs State | vs National | |
| 1. | 40203 | 12.4% | 4.2%(+8.21)#20 | 4.1%(+8.30)#770 |
| 2. | 40204 | 8.6% | 4.2%(+4.37)#44 | 4.1%(+4.45)#1,598 |
| 3. | 40222 | 8.1% | 4.2%(+3.88)#49 | 4.1%(+3.97)#1,825 |
| 4. | 40243 | 7.4% | 4.2%(+3.19)#53 | 4.1%(+3.27)#2,258 |
| 5. | 40217 | 6.8% | 4.2%(+2.60)#62 | 4.1%(+2.68)#2,772 |
| 6. | 40229 | 6.8% | 4.2%(+2.54)#63 | 4.1%(+2.63)#2,832 |
| 7. | 40218 | 6.7% | 4.2%(+2.48)#64 | 4.1%(+2.57)#2,908 |
| 8. | 40212 | 6.4% | 4.2%(+2.19)#65 | 4.1%(+2.28)#3,224 |
| 9. | 40205 | 6.4% | 4.2%(+2.18)#66 | 4.1%(+2.27)#3,238 |
| 10. | 40206 | 6.1% | 4.2%(+1.90)#76 | 4.1%(+1.98)#3,601 |
| 11. | 40215 | 5.9% | 4.2%(+1.64)#80 | 4.1%(+1.73)#4,013 |
| 12. | 40241 | 5.8% | 4.2%(+1.61)#81 | 4.1%(+1.70)#4,061 |
| 13. | 40207 | 5.7% | 4.2%(+1.46)#86 | 4.1%(+1.55)#4,309 |
| 14. | 40202 | 5.4% | 4.2%(+1.19)#93 | 4.1%(+1.28)#4,812 |
| 15. | 40299 | 5.3% | 4.2%(+1.10)#96 | 4.1%(+1.19)#4,995 |
| 16. | 40223 | 5.3% | 4.2%(+1.05)#99 | 4.1%(+1.14)#5,086 |
| 17. | 40214 | 5.3% | 4.2%(+1.05)#100 | 4.1%(+1.14)#5,089 |
| 18. | 40245 | 5.0% | 4.2%(+0.793)#108 | 4.1%(+0.879)#5,654 |
| 19. | 40242 | 4.9% | 4.2%(+0.724)#110 | 4.1%(+0.810)#5,818 |
| 20. | 40211 | 4.9% | 4.2%(+0.670)#113 | 4.1%(+0.756)#5,941 |
| 21. | 40213 | 4.9% | 4.2%(+0.640)#115 | 4.1%(+0.727)#6,029 |
| 22. | 40208 | 4.6% | 4.2%(+0.398)#123 | 4.1%(+0.484)#6,639 |
| 23. | 40291 | 4.5% | 4.2%(+0.235)#129 | 4.1%(+0.322)#7,072 |
| 24. | 40258 | 4.4% | 4.2%(+0.211)#131 | 4.1%(+0.298)#7,159 |
| 25. | 40219 | 4.4% | 4.2%(+0.184)#132 | 4.1%(+0.271)#7,238 |
| 26. | 40220 | 4.2% | 4.2%(-0.060)#147 | 4.1%(+0.027)#8,024 |
| 27. | 40216 | 4.1% | 4.2%(-0.083)#149 | 4.1%(+0.003)#8,099 |
| 28. | 40228 | 3.3% | 4.2%(-0.961)#184 | 4.1%(-0.874)#11,220 |
| 29. | 40272 | 2.0% | 4.2%(-2.26)#244 | 4.1%(-2.18)#16,044 |
| 30. | 40210 | 1.1% | 4.2%(-3.11)#287 | 4.1%(-3.03)#18,667 |
1
Common Questions
What are the Top 10 Zip Codes with the Highest Percentage of Population with a Degree in Communications in Louisville, KY?
Top 10 Zip Codes with the Highest Percentage of Population with a Degree in Communications in Louisville, KY are:
What zip code has the Highest Percentage of Population with a Degree in Communications in Louisville, KY?
40203 has the Highest Percentage of Population with a Degree in Communications in Louisville, KY with 12.4%.
What is the Percentage of Population with a Degree in Communications in Louisville, KY?
Percentage of Population with a Degree in Communications in Louisville is 5.6%.
What is the Percentage of Population with a Degree in Communications in Kentucky?
Percentage of Population with a Degree in Communications in Kentucky is 4.2%.
What is the Percentage of Population with a Degree in Communications in the United States?
Percentage of Population with a Degree in Communications in the United States is 4.1%.