Grissom AFB, IN Map & Demographics
Grissom AFB Map
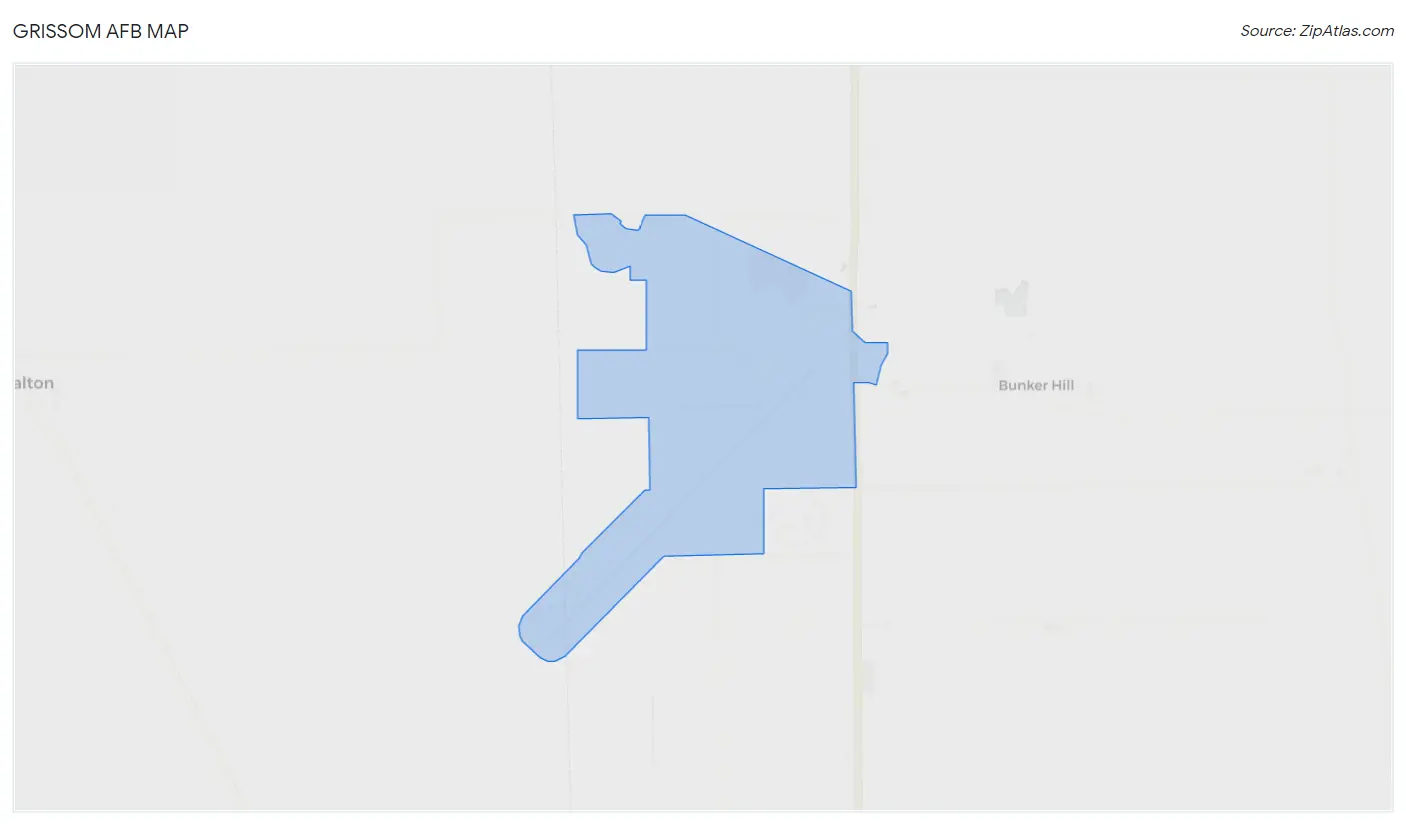
Grissom AFB Overview
$22,199
PER CAPITA INCOME
$61,250
AVG FAMILY INCOME
$53,542
AVG HOUSEHOLD INCOME
38.8%
WAGE / INCOME GAP [ % ]
61.2¢/ $1
WAGE / INCOME GAP [ $ ]
0.35
INEQUALITY / GINI INDEX
2,619
TOTAL POPULATION
1,410
MALE POPULATION
1,209
FEMALE POPULATION
116.63
MALES / 100 FEMALES
85.74
FEMALES / 100 MALES
28.5
MEDIAN AGE
3.9
AVG FAMILY SIZE
3.3
AVG HOUSEHOLD SIZE
1,240
LABOR FORCE [ PEOPLE ]
64.3%
PERCENT IN LABOR FORCE
3.6%
UNEMPLOYMENT RATE
Income in Grissom AFB
Income Overview in Grissom AFB
Per Capita Income in Grissom AFB is $22,199, while median incomes of families and households are $61,250 and $53,542 respectively.
| Characteristic | Number | Measure |
| Per Capita Income | 2,619 | $22,199 |
| Median Family Income | 514 | $61,250 |
| Mean Family Income | 514 | $63,673 |
| Median Household Income | 775 | $53,542 |
| Mean Household Income | 775 | $63,621 |
| Income Deficit | 514 | $0 |
| Wage / Income Gap (%) | 2,619 | 38.76% |
| Wage / Income Gap ($) | 2,619 | 61.24¢ per $1 |
| Gini / Inequality Index | 2,619 | 0.35 |
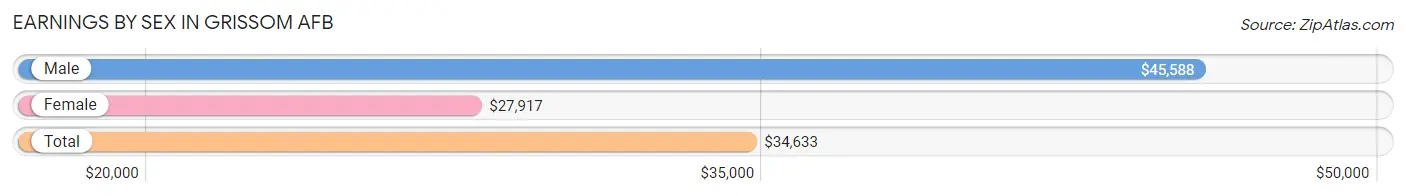
Earnings by Sex in Grissom AFB
Average Earnings in Grissom AFB are $34,633, $45,588 for men and $27,917 for women, a difference of 38.8%.
| Sex | Number | Average Earnings |
| Male | 678 (53.0%) | $45,588 |
| Female | 600 (46.9%) | $27,917 |
| Total | 1,278 (100.0%) | $34,633 |
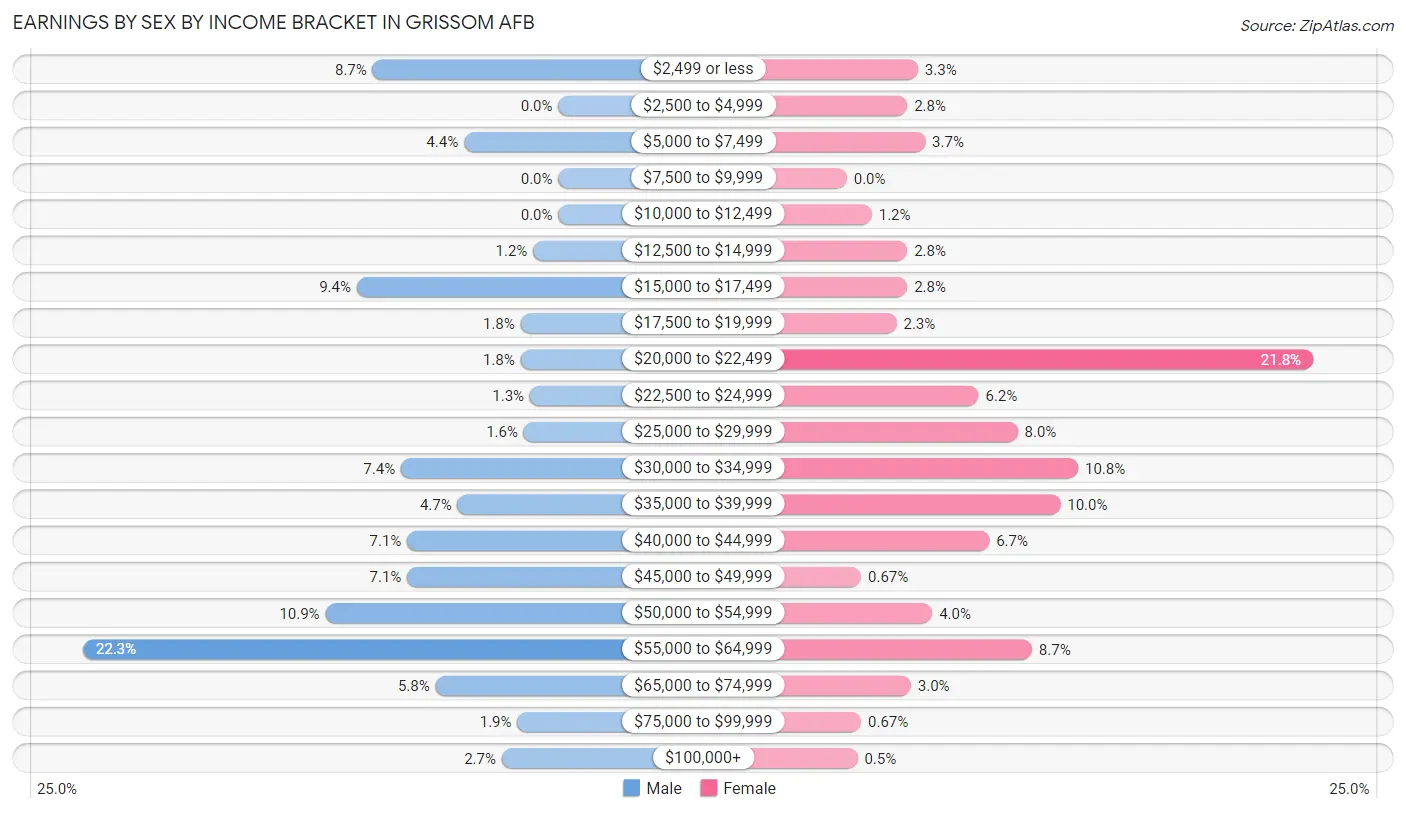
Earnings by Sex by Income Bracket in Grissom AFB
The most common earnings brackets in Grissom AFB are $55,000 to $64,999 for men (151 | 22.3%) and $20,000 to $22,499 for women (131 | 21.8%).
| Income | Male | Female |
| $2,499 or less | 59 (8.7%) | 20 (3.3%) |
| $2,500 to $4,999 | 0 (0.0%) | 17 (2.8%) |
| $5,000 to $7,499 | 30 (4.4%) | 22 (3.7%) |
| $7,500 to $9,999 | 0 (0.0%) | 0 (0.0%) |
| $10,000 to $12,499 | 0 (0.0%) | 7 (1.2%) |
| $12,500 to $14,999 | 8 (1.2%) | 17 (2.8%) |
| $15,000 to $17,499 | 64 (9.4%) | 17 (2.8%) |
| $17,500 to $19,999 | 12 (1.8%) | 14 (2.3%) |
| $20,000 to $22,499 | 12 (1.8%) | 131 (21.8%) |
| $22,500 to $24,999 | 9 (1.3%) | 37 (6.2%) |
| $25,000 to $29,999 | 11 (1.6%) | 48 (8.0%) |
| $30,000 to $34,999 | 50 (7.4%) | 65 (10.8%) |
| $35,000 to $39,999 | 32 (4.7%) | 60 (10.0%) |
| $40,000 to $44,999 | 48 (7.1%) | 40 (6.7%) |
| $45,000 to $49,999 | 48 (7.1%) | 4 (0.7%) |
| $50,000 to $54,999 | 74 (10.9%) | 24 (4.0%) |
| $55,000 to $64,999 | 151 (22.3%) | 52 (8.7%) |
| $65,000 to $74,999 | 39 (5.8%) | 18 (3.0%) |
| $75,000 to $99,999 | 13 (1.9%) | 4 (0.7%) |
| $100,000+ | 18 (2.6%) | 3 (0.5%) |
| Total | 678 (100.0%) | 600 (100.0%) |
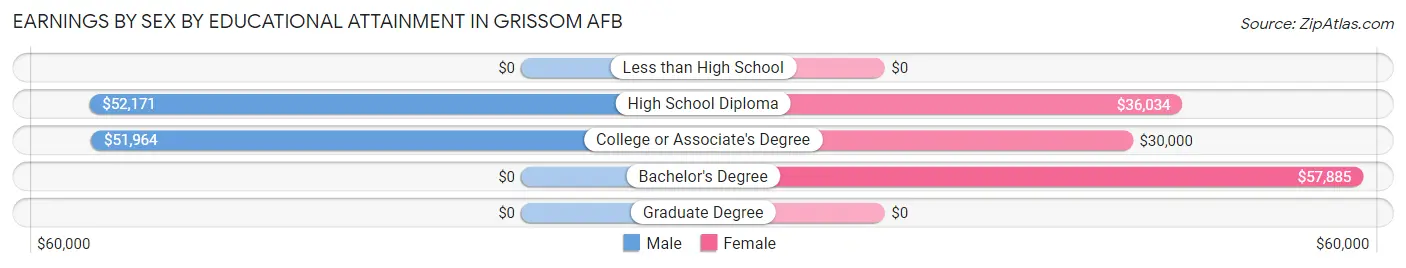
Earnings by Sex by Educational Attainment in Grissom AFB
Average earnings in Grissom AFB are $49,837 for men and $34,837 for women, a difference of 30.1%. Men with an educational attainment of high school diploma enjoy the highest average annual earnings of $52,171, while those with college or associate's degree education earn the least with $51,964. Women with an educational attainment of bachelor's degree earn the most with the average annual earnings of $57,885, while those with college or associate's degree education have the smallest earnings of $30,000.
| Educational Attainment | Male Income | Female Income |
| Less than High School | - | - |
| High School Diploma | $52,171 | $36,034 |
| College or Associate's Degree | $51,964 | $30,000 |
| Bachelor's Degree | - | - |
| Graduate Degree | - | - |
| Total | $49,837 | $34,837 |
Family Income in Grissom AFB
Family Income Brackets in Grissom AFB
According to the Grissom AFB family income data, there are 102 families falling into the $50,000 to $74,999 income range, which is the most common income bracket and makes up 19.8% of all families. Conversely, the $200,000+ income bracket is the least frequent group with only 3 families (0.6%) belonging to this category.
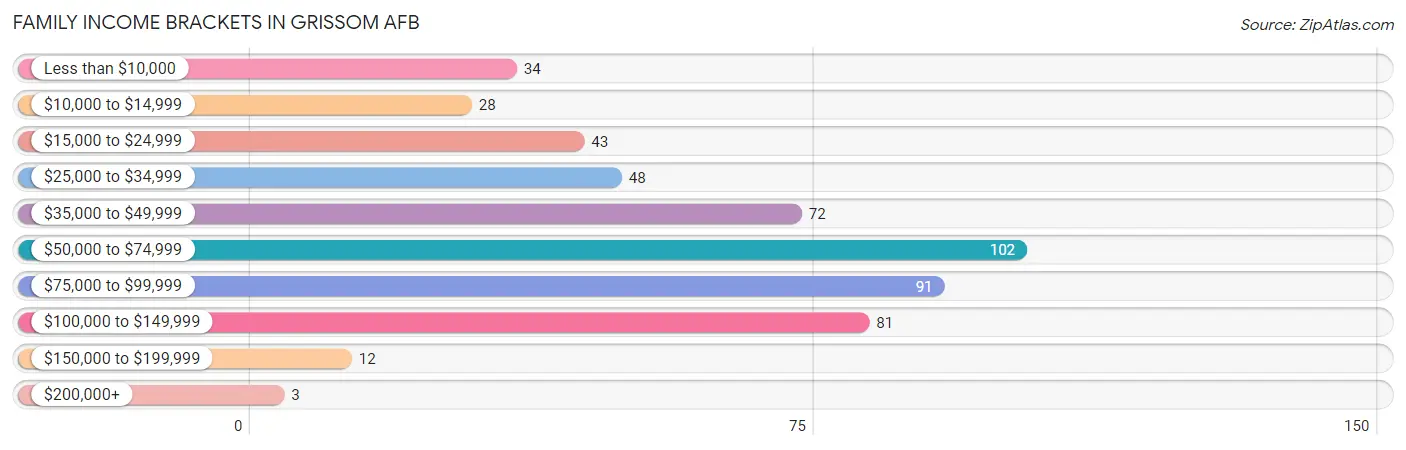
| Income Bracket | # Families | % Families |
| Less than $10,000 | 34 | 6.6% |
| $10,000 to $14,999 | 28 | 5.4% |
| $15,000 to $24,999 | 43 | 8.4% |
| $25,000 to $34,999 | 48 | 9.3% |
| $35,000 to $49,999 | 72 | 14.0% |
| $50,000 to $74,999 | 102 | 19.8% |
| $75,000 to $99,999 | 91 | 17.7% |
| $100,000 to $149,999 | 81 | 15.8% |
| $150,000 to $199,999 | 12 | 2.3% |
| $200,000+ | 3 | 0.6% |
Family Income by Famaliy Size in Grissom AFB
4-person families (98 | 19.1%) account for the highest median family income in Grissom AFB with $111,250 per family, while 4-person families (98 | 19.1%) have the highest median income of $27,812 per family member.
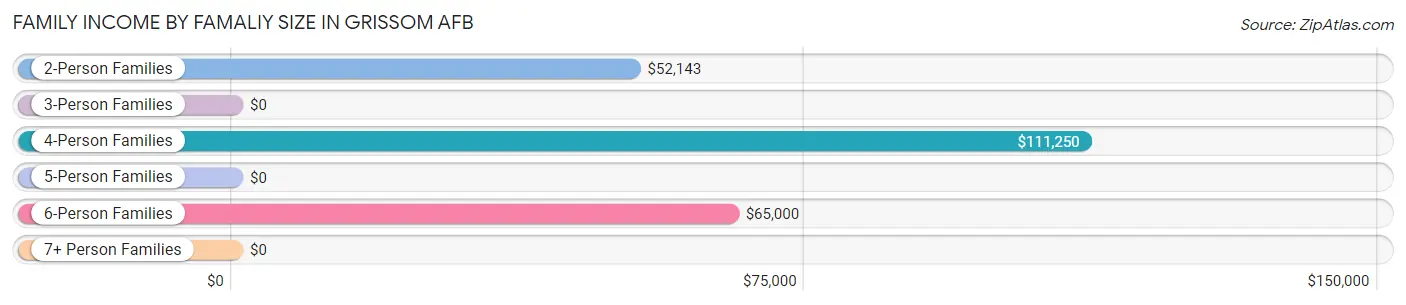
| Income Bracket | # Families | Median Income |
| 2-Person Families | 204 (39.7%) | $52,143 |
| 3-Person Families | 131 (25.5%) | $0 |
| 4-Person Families | 98 (19.1%) | $111,250 |
| 5-Person Families | 56 (10.9%) | $0 |
| 6-Person Families | 10 (1.9%) | $65,000 |
| 7+ Person Families | 15 (2.9%) | $0 |
| Total | 514 (100.0%) | $61,250 |
Family Income by Number of Earners in Grissom AFB
The median family income in Grissom AFB is $61,250, with families comprising 3+ earners (52) having the highest median family income of $107,794, while families with no earners (92) have the lowest median family income of $22,500, accounting for 10.1% and 17.9% of families, respectively.
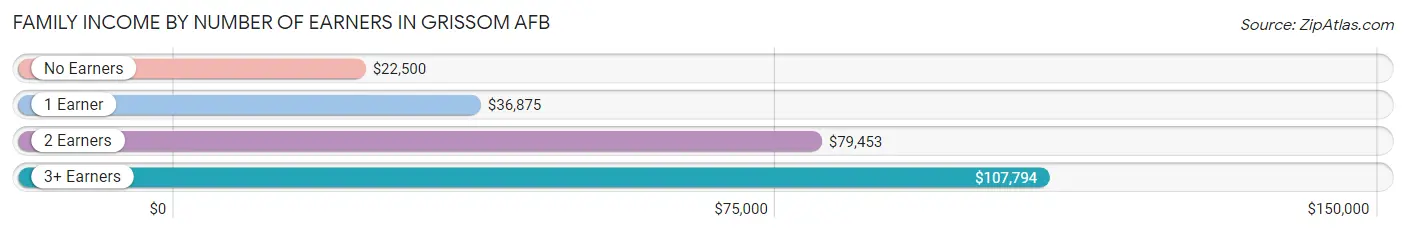
| Number of Earners | # Families | Median Income |
| No Earners | 92 (17.9%) | $22,500 |
| 1 Earner | 175 (34.1%) | $36,875 |
| 2 Earners | 195 (37.9%) | $79,453 |
| 3+ Earners | 52 (10.1%) | $107,794 |
| Total | 514 (100.0%) | $61,250 |
Household Income in Grissom AFB
Household Income Brackets in Grissom AFB
With 165 households falling in the category, the $75,000 to $99,999 income range is the most frequent in Grissom AFB, accounting for 21.3% of all households. In contrast, only 3 households (0.4%) fall into the $200,000+ income bracket, making it the least populous group.
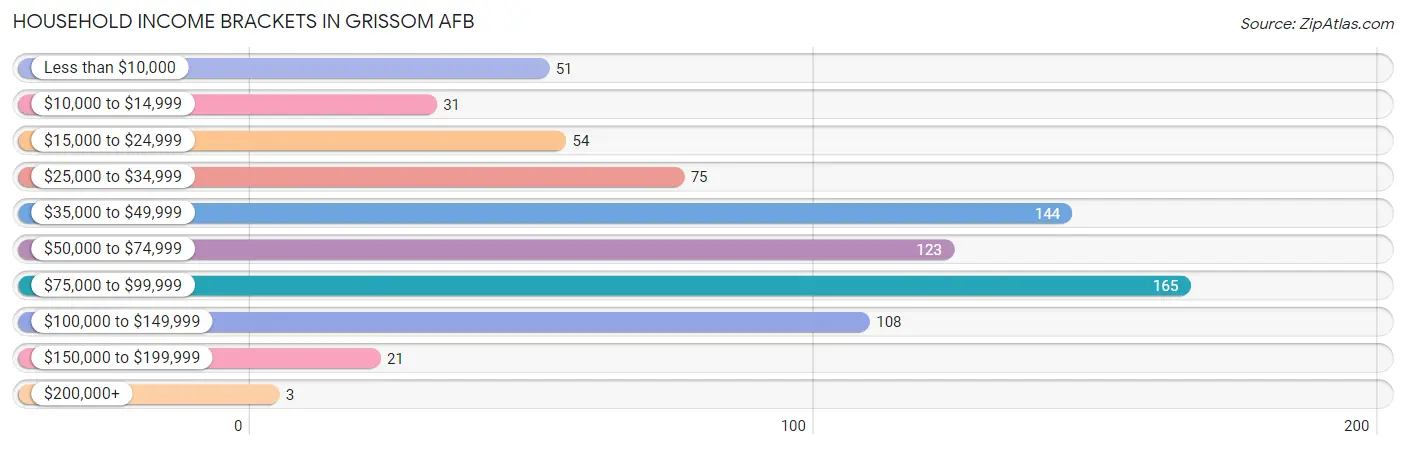
| Income Bracket | # Households | % Households |
| Less than $10,000 | 51 | 6.6% |
| $10,000 to $14,999 | 31 | 4.0% |
| $15,000 to $24,999 | 54 | 7.0% |
| $25,000 to $34,999 | 75 | 9.7% |
| $35,000 to $49,999 | 144 | 18.6% |
| $50,000 to $74,999 | 123 | 15.9% |
| $75,000 to $99,999 | 165 | 21.3% |
| $100,000 to $149,999 | 108 | 13.9% |
| $150,000 to $199,999 | 21 | 2.7% |
| $200,000+ | 3 | 0.4% |
Household Income by Householder Age in Grissom AFB
The median household income in Grissom AFB is $53,542, with the highest median household income of $88,125 found in the 15 to 24 years age bracket for the primary householder. A total of 19 households (2.5%) fall into this category. Meanwhile, the 65+ years age bracket for the primary householder has the lowest median household income of $47,000, with 152 households (19.6%) in this group.
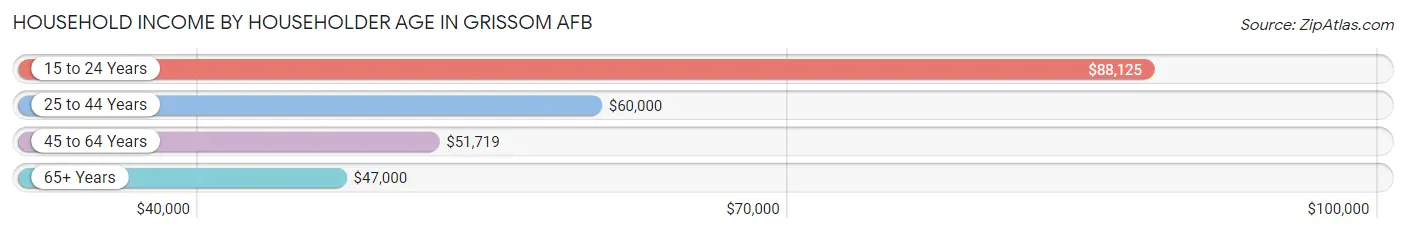
| Income Bracket | # Households | Median Income |
| 15 to 24 Years | 19 (2.5%) | $88,125 |
| 25 to 44 Years | 410 (52.9%) | $60,000 |
| 45 to 64 Years | 194 (25.0%) | $51,719 |
| 65+ Years | 152 (19.6%) | $47,000 |
| Total | 775 (100.0%) | $53,542 |
Poverty in Grissom AFB
Income Below Poverty by Sex and Age in Grissom AFB
With 22.4% poverty level for males and 21.8% for females among the residents of Grissom AFB, 15 year old males and 15 year old females are the most vulnerable to poverty, with 39 males (63.9%) and 29 females (87.9%) in their respective age groups living below the poverty level.
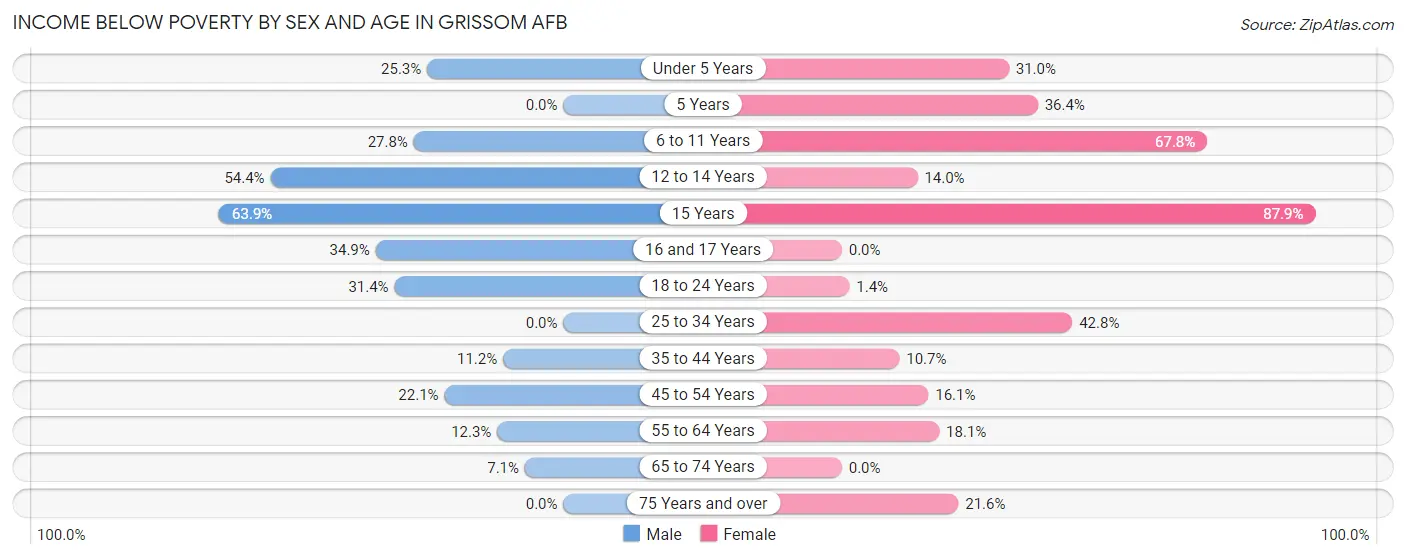
| Age Bracket | Male | Female |
| Under 5 Years | 22 (25.3%) | 22 (31.0%) |
| 5 Years | 0 (0.0%) | 12 (36.4%) |
| 6 to 11 Years | 35 (27.8%) | 40 (67.8%) |
| 12 to 14 Years | 56 (54.4%) | 8 (14.0%) |
| 15 Years | 39 (63.9%) | 29 (87.9%) |
| 16 and 17 Years | 23 (34.8%) | 0 (0.0%) |
| 18 to 24 Years | 58 (31.4%) | 3 (1.4%) |
| 25 to 34 Years | 0 (0.0%) | 74 (42.8%) |
| 35 to 44 Years | 15 (11.2%) | 19 (10.7%) |
| 45 to 54 Years | 34 (22.1%) | 13 (16.1%) |
| 55 to 64 Years | 14 (12.3%) | 15 (18.1%) |
| 65 to 74 Years | 3 (7.1%) | 0 (0.0%) |
| 75 Years and over | 0 (0.0%) | 16 (21.6%) |
| Total | 299 (22.4%) | 251 (21.8%) |
Income Above Poverty by Sex and Age in Grissom AFB
According to the poverty statistics in Grissom AFB, males aged 5 years and females aged 16 and 17 years are the age groups that are most secure financially, with 100.0% of males and 100.0% of females in these age groups living above the poverty line.
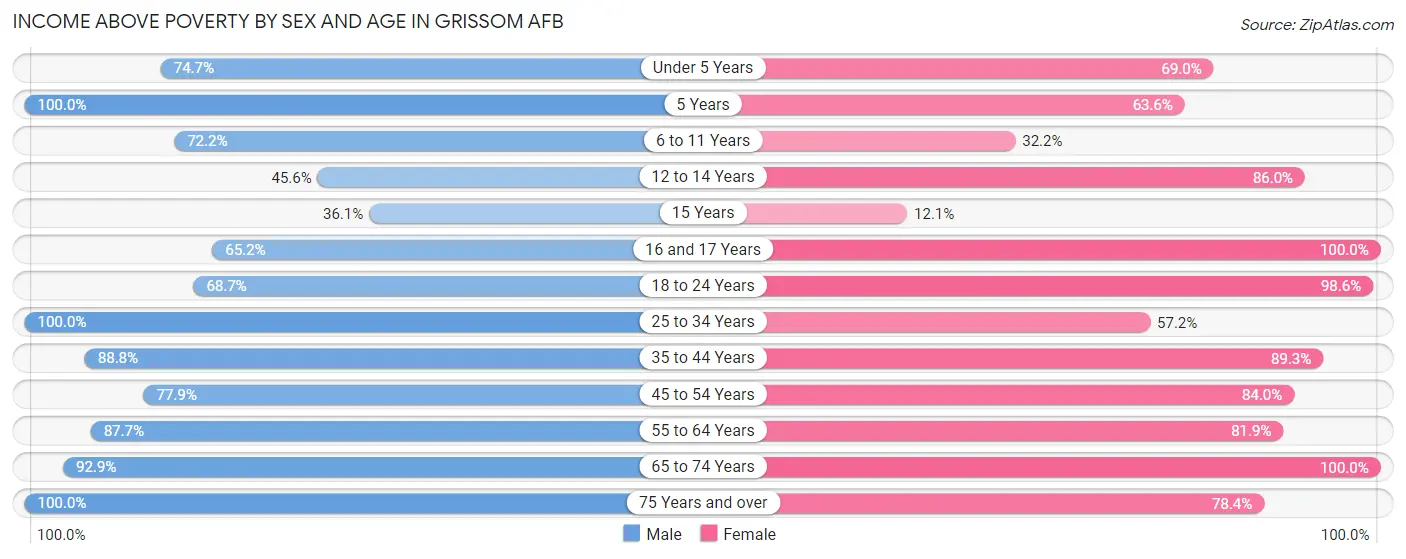
| Age Bracket | Male | Female |
| Under 5 Years | 65 (74.7%) | 49 (69.0%) |
| 5 Years | 20 (100.0%) | 21 (63.6%) |
| 6 to 11 Years | 91 (72.2%) | 19 (32.2%) |
| 12 to 14 Years | 47 (45.6%) | 49 (86.0%) |
| 15 Years | 22 (36.1%) | 4 (12.1%) |
| 16 and 17 Years | 43 (65.1%) | 14 (100.0%) |
| 18 to 24 Years | 127 (68.6%) | 210 (98.6%) |
| 25 to 34 Years | 237 (100.0%) | 99 (57.2%) |
| 35 to 44 Years | 119 (88.8%) | 159 (89.3%) |
| 45 to 54 Years | 120 (77.9%) | 68 (84.0%) |
| 55 to 64 Years | 100 (87.7%) | 68 (81.9%) |
| 65 to 74 Years | 39 (92.9%) | 83 (100.0%) |
| 75 Years and over | 7 (100.0%) | 58 (78.4%) |
| Total | 1,037 (77.6%) | 901 (78.2%) |
Income Below Poverty Among Married-Couple Families in Grissom AFB
The poverty statistics for married-couple families in Grissom AFB show that 7.8% or 18 of the total 230 families live below the poverty line. Families with no children have the highest poverty rate of 8.8%, comprising of 10 families. On the other hand, families with 3 or 4 children have the lowest poverty rate of 0.0%, which includes 0 families.
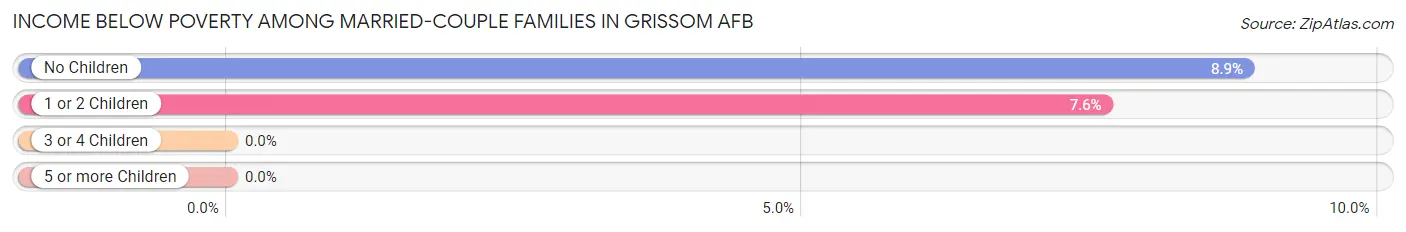
| Children | Above Poverty | Below Poverty |
| No Children | 103 (91.1%) | 10 (8.8%) |
| 1 or 2 Children | 97 (92.4%) | 8 (7.6%) |
| 3 or 4 Children | 12 (100.0%) | 0 (0.0%) |
| 5 or more Children | 0 (0.0%) | 0 (0.0%) |
| Total | 212 (92.2%) | 18 (7.8%) |
Income Below Poverty Among Single-Parent Households in Grissom AFB
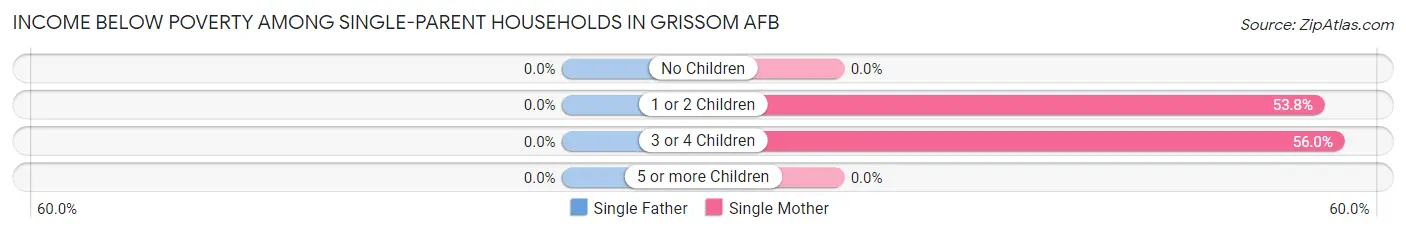
| Children | Single Father | Single Mother |
| No Children | 0 (0.0%) | 0 (0.0%) |
| 1 or 2 Children | 0 (0.0%) | 57 (53.8%) |
| 3 or 4 Children | 0 (0.0%) | 28 (56.0%) |
| 5 or more Children | 0 (0.0%) | 0 (0.0%) |
| Total | 0 (0.0%) | 85 (39.9%) |
Income Below Poverty Among Married-Couple vs Single-Parent Households in Grissom AFB
The poverty data for Grissom AFB shows that 18 of the married-couple family households (7.8%) and 85 of the single-parent households (29.9%) are living below the poverty level. Within the married-couple family households, those with no children have the highest poverty rate, with 10 households (8.8%) falling below the poverty line. Among the single-parent households, those with 3 or 4 children have the highest poverty rate, with 28 household (56.0%) living below poverty.
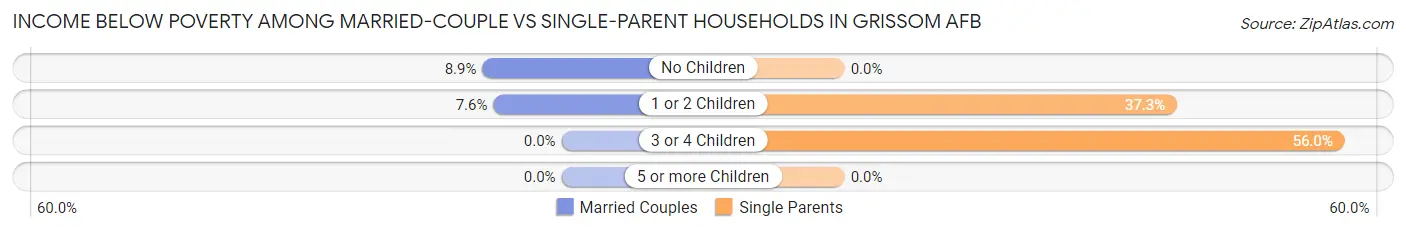
| Children | Married-Couple Families | Single-Parent Households |
| No Children | 10 (8.8%) | 0 (0.0%) |
| 1 or 2 Children | 8 (7.6%) | 57 (37.2%) |
| 3 or 4 Children | 0 (0.0%) | 28 (56.0%) |
| 5 or more Children | 0 (0.0%) | 0 (0.0%) |
| Total | 18 (7.8%) | 85 (29.9%) |
Race in Grissom AFB
The most populous races in Grissom AFB are White / Caucasian (2,205 | 84.2%), Two or more Races (256 | 9.8%), and Hispanic or Latino (175 | 6.7%).
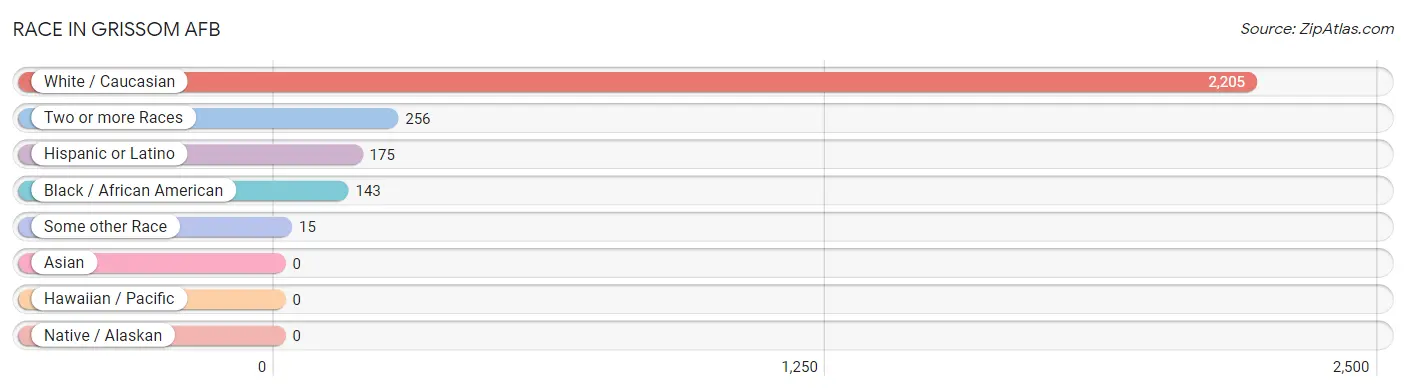
| Race | # Population | % Population |
| Asian | 0 | 0.0% |
| Black / African American | 143 | 5.5% |
| Hawaiian / Pacific | 0 | 0.0% |
| Hispanic or Latino | 175 | 6.7% |
| Native / Alaskan | 0 | 0.0% |
| White / Caucasian | 2,205 | 84.2% |
| Two or more Races | 256 | 9.8% |
| Some other Race | 15 | 0.6% |
| Total | 2,619 | 100.0% |
Ancestry in Grissom AFB
The most populous ancestries reported in Grissom AFB are Irish (358 | 13.7%), German (308 | 11.8%), English (254 | 9.7%), Mexican (173 | 6.6%), and American (124 | 4.7%), together accounting for 46.5% of all Grissom AFB residents.
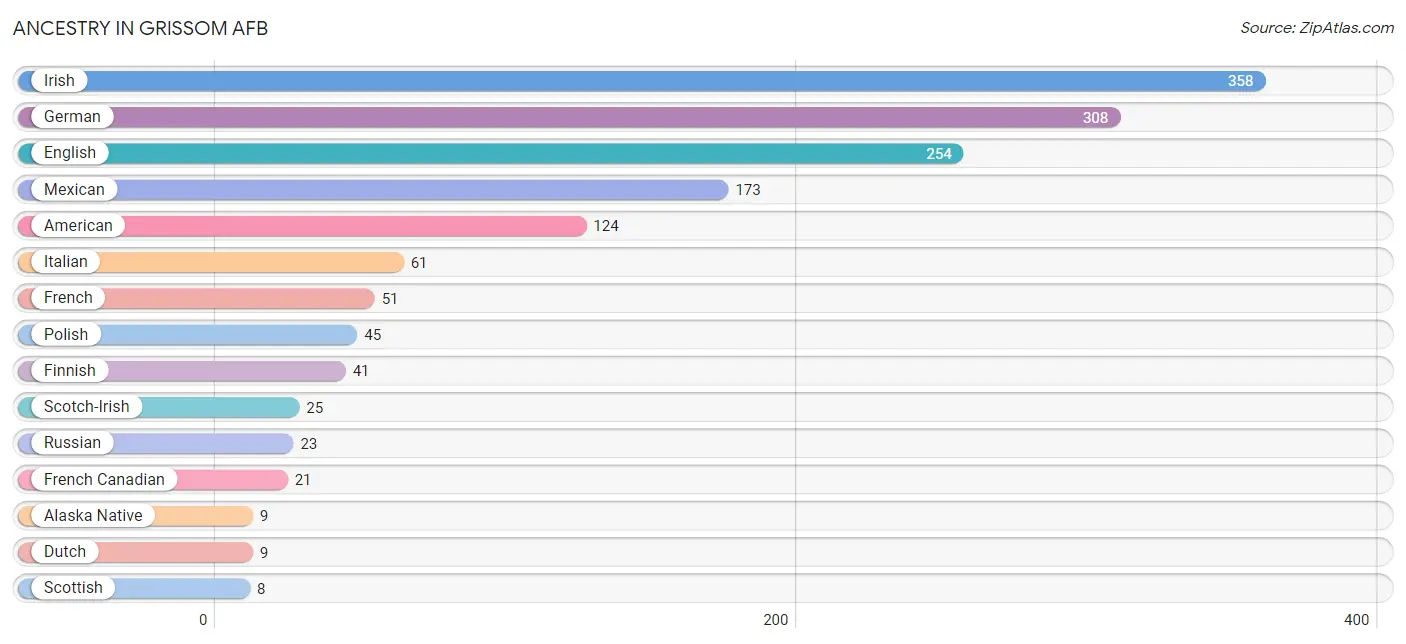
| Ancestry | # Population | % Population |
| Alaska Native | 9 | 0.3% |
| American | 124 | 4.7% |
| British | 7 | 0.3% |
| Burmese | 3 | 0.1% |
| Dominican | 2 | 0.1% |
| Dutch | 9 | 0.3% |
| English | 254 | 9.7% |
| Finnish | 41 | 1.6% |
| French | 51 | 1.9% |
| French Canadian | 21 | 0.8% |
| German | 308 | 11.8% |
| Hungarian | 4 | 0.2% |
| Irish | 358 | 13.7% |
| Italian | 61 | 2.3% |
| Jamaican | 7 | 0.3% |
| Mexican | 173 | 6.6% |
| Polish | 45 | 1.7% |
| Russian | 23 | 0.9% |
| Scotch-Irish | 25 | 0.9% |
| Scottish | 8 | 0.3% |
| Slovene | 1 | 0.0% |
| West Indian | 7 | 0.3% | View All 22 Rows |
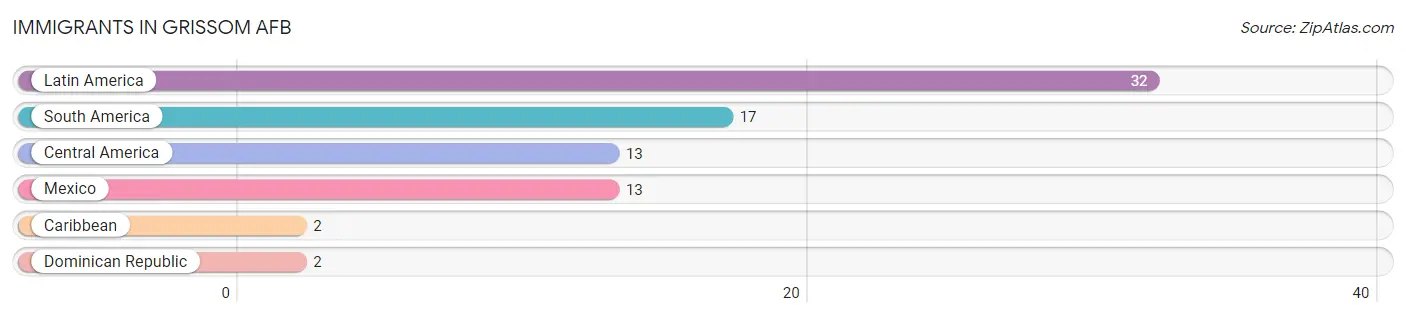
Immigrants in Grissom AFB
The most numerous immigrant groups reported in Grissom AFB came from Latin America (32 | 1.2%), South America (17 | 0.6%), Central America (13 | 0.5%), Mexico (13 | 0.5%), and Caribbean (2 | 0.1%), together accounting for 3.0% of all Grissom AFB residents.
| Immigration Origin | # Population | % Population |
| Caribbean | 2 | 0.1% |
| Central America | 13 | 0.5% |
| Dominican Republic | 2 | 0.1% |
| Latin America | 32 | 1.2% |
| Mexico | 13 | 0.5% |
| South America | 17 | 0.6% | View All 6 Rows |
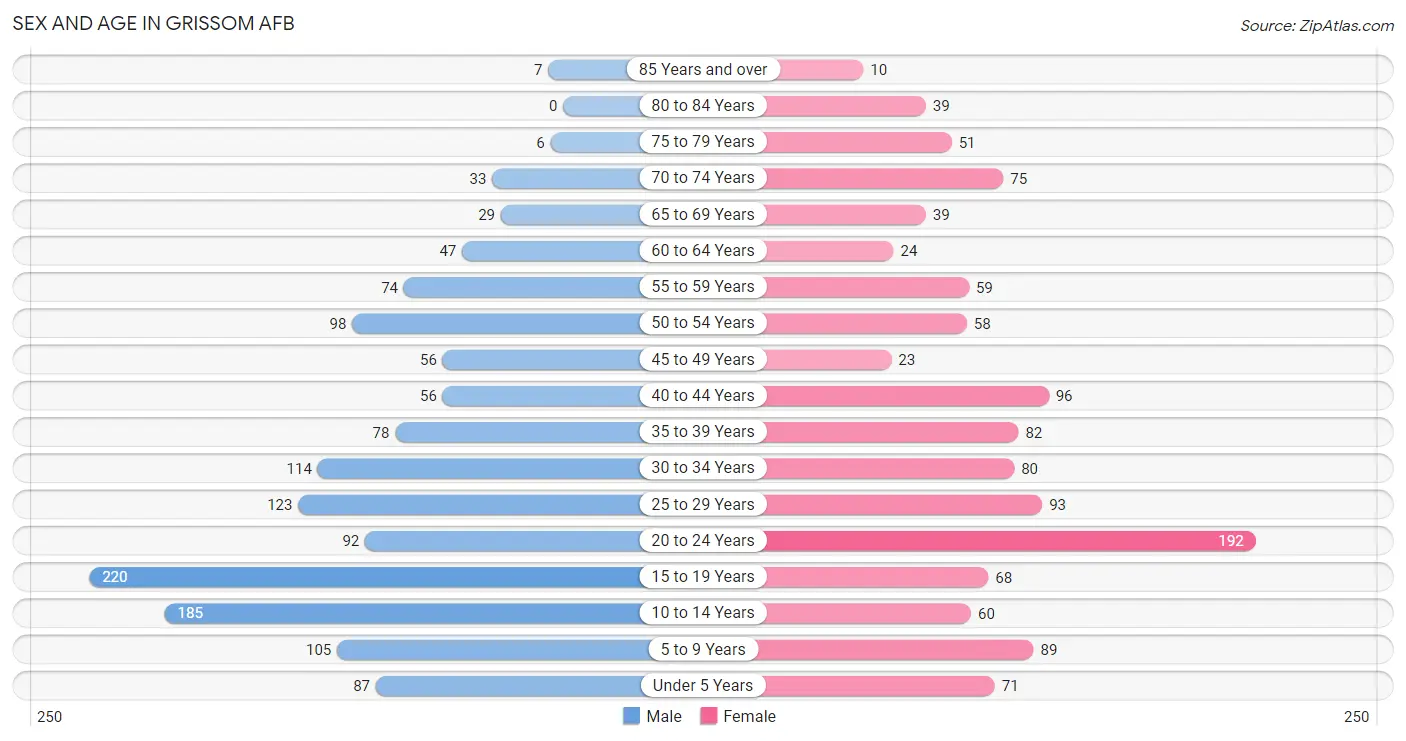
Sex and Age in Grissom AFB
Sex and Age in Grissom AFB
The most populous age groups in Grissom AFB are 15 to 19 Years (220 | 15.6%) for men and 20 to 24 Years (192 | 15.9%) for women.
| Age Bracket | Male | Female |
| Under 5 Years | 87 (6.2%) | 71 (5.9%) |
| 5 to 9 Years | 105 (7.4%) | 89 (7.4%) |
| 10 to 14 Years | 185 (13.1%) | 60 (5.0%) |
| 15 to 19 Years | 220 (15.6%) | 68 (5.6%) |
| 20 to 24 Years | 92 (6.5%) | 192 (15.9%) |
| 25 to 29 Years | 123 (8.7%) | 93 (7.7%) |
| 30 to 34 Years | 114 (8.1%) | 80 (6.6%) |
| 35 to 39 Years | 78 (5.5%) | 82 (6.8%) |
| 40 to 44 Years | 56 (4.0%) | 96 (7.9%) |
| 45 to 49 Years | 56 (4.0%) | 23 (1.9%) |
| 50 to 54 Years | 98 (7.0%) | 58 (4.8%) |
| 55 to 59 Years | 74 (5.2%) | 59 (4.9%) |
| 60 to 64 Years | 47 (3.3%) | 24 (2.0%) |
| 65 to 69 Years | 29 (2.1%) | 39 (3.2%) |
| 70 to 74 Years | 33 (2.3%) | 75 (6.2%) |
| 75 to 79 Years | 6 (0.4%) | 51 (4.2%) |
| 80 to 84 Years | 0 (0.0%) | 39 (3.2%) |
| 85 Years and over | 7 (0.5%) | 10 (0.8%) |
| Total | 1,410 (100.0%) | 1,209 (100.0%) |
Families and Households in Grissom AFB
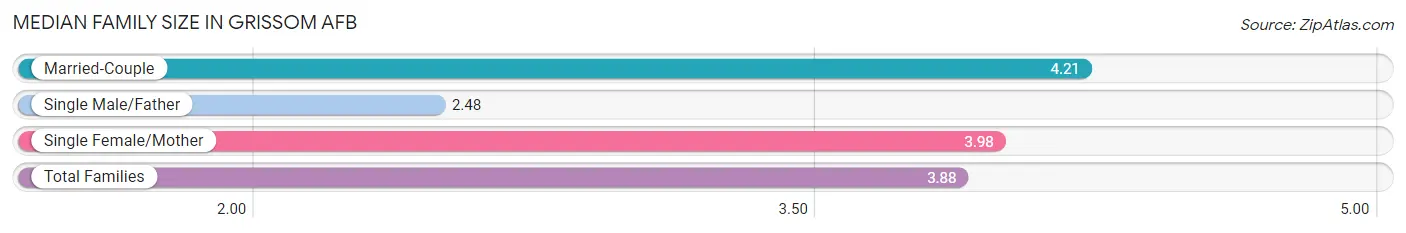
Median Family Size in Grissom AFB
The median family size in Grissom AFB is 3.88 persons per family, with married-couple families (230 | 44.8%) accounting for the largest median family size of 4.21 persons per family. On the other hand, single male/father families (71 | 13.8%) represent the smallest median family size with 2.48 persons per family.
| Family Type | # Families | Family Size |
| Married-Couple | 230 (44.8%) | 4.21 |
| Single Male/Father | 71 (13.8%) | 2.48 |
| Single Female/Mother | 213 (41.4%) | 3.98 |
| Total Families | 514 (100.0%) | 3.88 |
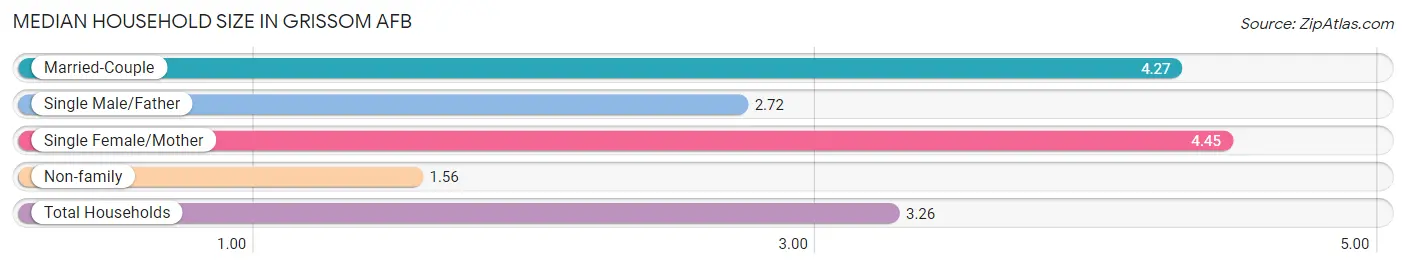
Median Household Size in Grissom AFB
The median household size in Grissom AFB is 3.26 persons per household, with single female/mother households (213 | 27.5%) accounting for the largest median household size of 4.45 persons per household. non-family households (261 | 33.7%) represent the smallest median household size with 1.56 persons per household.
| Household Type | # Households | Household Size |
| Married-Couple | 230 (29.7%) | 4.27 |
| Single Male/Father | 71 (9.2%) | 2.72 |
| Single Female/Mother | 213 (27.5%) | 4.45 |
| Non-family | 261 (33.7%) | 1.56 |
| Total Households | 775 (100.0%) | 3.26 |
Household Size by Marriage Status in Grissom AFB
Out of a total of 775 households in Grissom AFB, 514 (66.3%) are family households, while 261 (33.7%) are nonfamily households. The most numerous type of family households are 2-person households, comprising 171, and the most common type of nonfamily households are 1-person households, comprising 213.
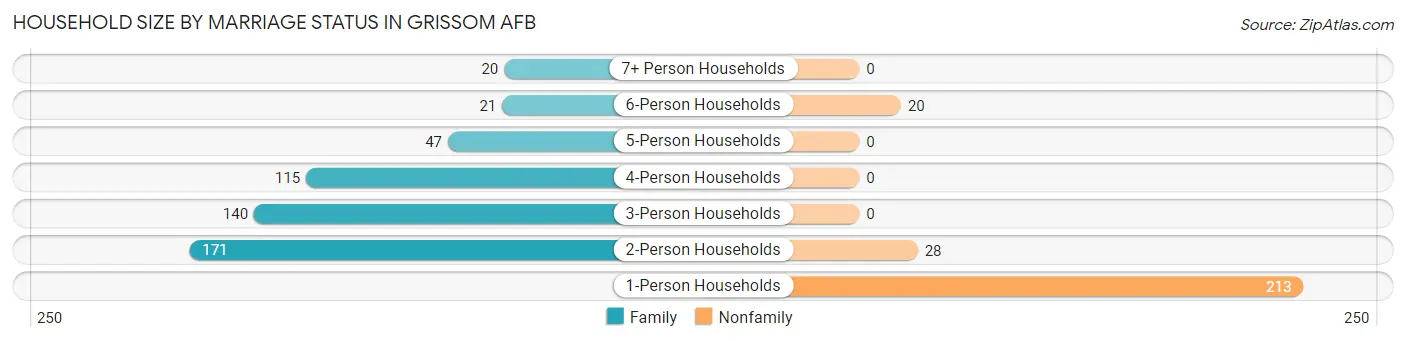
| Household Size | Family Households | Nonfamily Households |
| 1-Person Households | - | 213 (27.5%) |
| 2-Person Households | 171 (22.1%) | 28 (3.6%) |
| 3-Person Households | 140 (18.1%) | 0 (0.0%) |
| 4-Person Households | 115 (14.8%) | 0 (0.0%) |
| 5-Person Households | 47 (6.1%) | 0 (0.0%) |
| 6-Person Households | 21 (2.7%) | 20 (2.6%) |
| 7+ Person Households | 20 (2.6%) | 0 (0.0%) |
| Total | 514 (66.3%) | 261 (33.7%) |
Female Fertility in Grissom AFB
Fertility by Age in Grissom AFB
Average fertility rate in Grissom AFB is 20.0 births per 1,000 women. Women in the age bracket of 20 to 34 years have the highest fertility rate with 36.0 births per 1,000 women. Women in the age bracket of 20 to 34 years acount for 100.0% of all women with births.
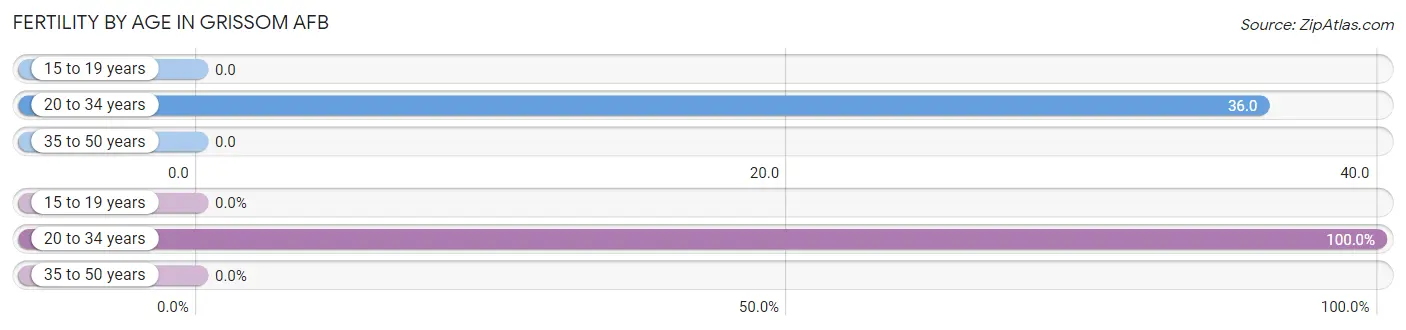
| Age Bracket | Women with Births | Births / 1,000 Women |
| 15 to 19 years | 0 (0.0%) | 0.0 |
| 20 to 34 years | 13 (100.0%) | 36.0 |
| 35 to 50 years | 0 (0.0%) | 0.0 |
| Total | 13 (100.0%) | 20.0 |
Fertility by Age by Marriage Status in Grissom AFB
53.8% of women with births (13) in Grissom AFB are married. The highest percentage of unmarried women with births falls into 20 to 34 years age bracket with 46.2% of them unmarried at the time of birth, while the lowest percentage of unmarried women with births belong to 20 to 34 years age bracket with 46.2% of them unmarried.
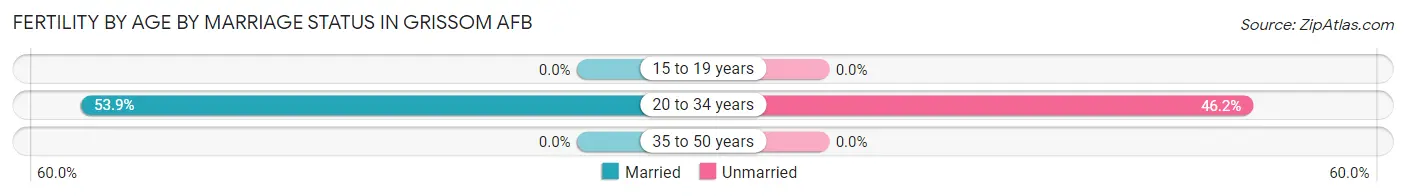
| Age Bracket | Married | Unmarried |
| 15 to 19 years | 0 (0.0%) | 0 (0.0%) |
| 20 to 34 years | 7 (53.8%) | 6 (46.2%) |
| 35 to 50 years | 0 (0.0%) | 0 (0.0%) |
| Total | 7 (53.8%) | 6 (46.2%) |
Fertility by Education in Grissom AFB
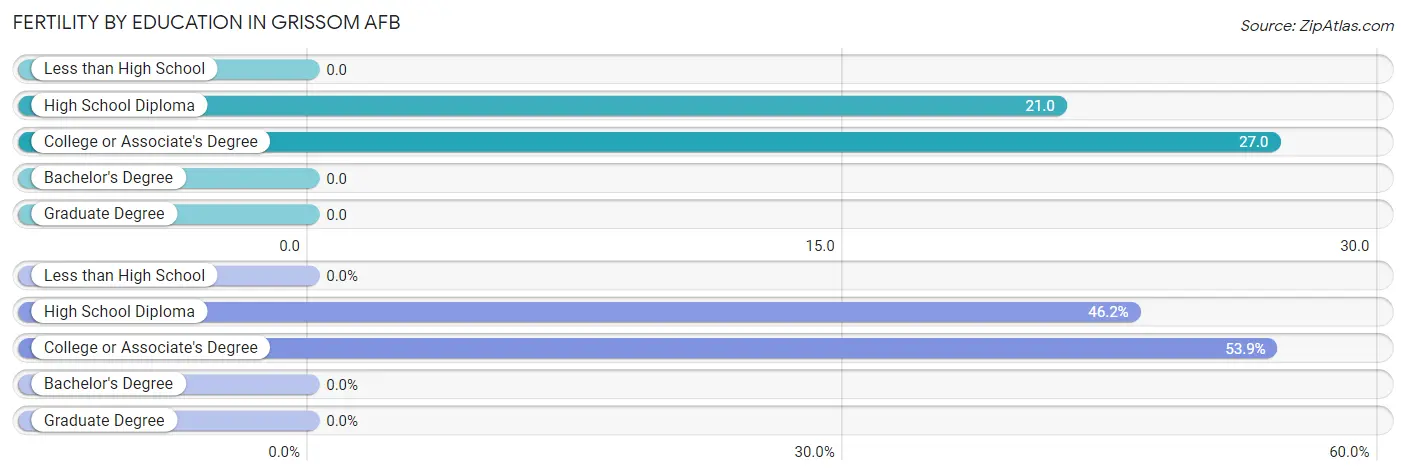
| Educational Attainment | Women with Births | Births / 1,000 Women |
| Less than High School | 0 (0.0%) | 0.0 |
| High School Diploma | 6 (46.2%) | 21.0 |
| College or Associate's Degree | 7 (53.8%) | 27.0 |
| Bachelor's Degree | 0 (0.0%) | 0.0 |
| Graduate Degree | 0 (0.0%) | 0.0 |
| Total | 13 (100.0%) | 20.0 |
Fertility by Education by Marriage Status in Grissom AFB
46.2% of women with births in Grissom AFB are unmarried. Women with the educational attainment of college or associate's degree are most likely to be married with 100.0% of them married at childbirth, while women with the educational attainment of high school diploma are least likely to be married with 100.0% of them unmarried at childbirth.
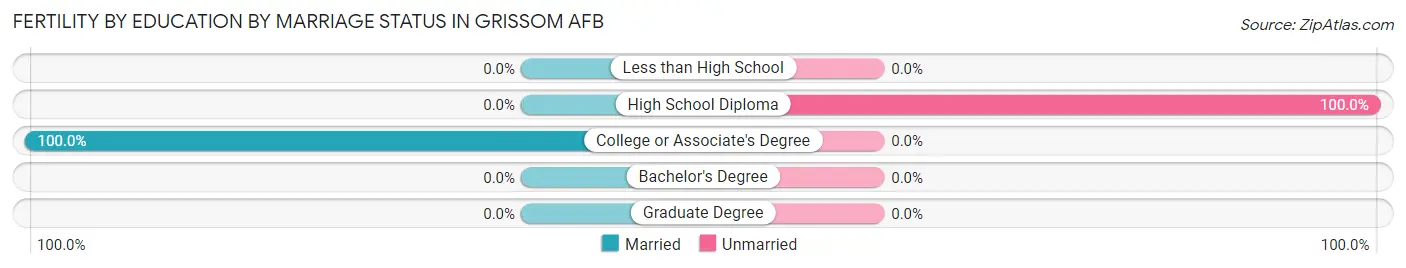
| Educational Attainment | Married | Unmarried |
| Less than High School | 0 (0.0%) | 0 (0.0%) |
| High School Diploma | 0 (0.0%) | 6 (100.0%) |
| College or Associate's Degree | 7 (100.0%) | 0 (0.0%) |
| Bachelor's Degree | 0 (0.0%) | 0 (0.0%) |
| Graduate Degree | 0 (0.0%) | 0 (0.0%) |
| Total | 7 (53.8%) | 6 (46.2%) |
Employment Characteristics in Grissom AFB
Employment by Class of Employer in Grissom AFB
Among the 1,157 employed individuals in Grissom AFB, private company employees (838 | 72.4%), not-for-profit organizations (146 | 12.6%), and state government employees (91 | 7.9%) make up the most common classes of employment.
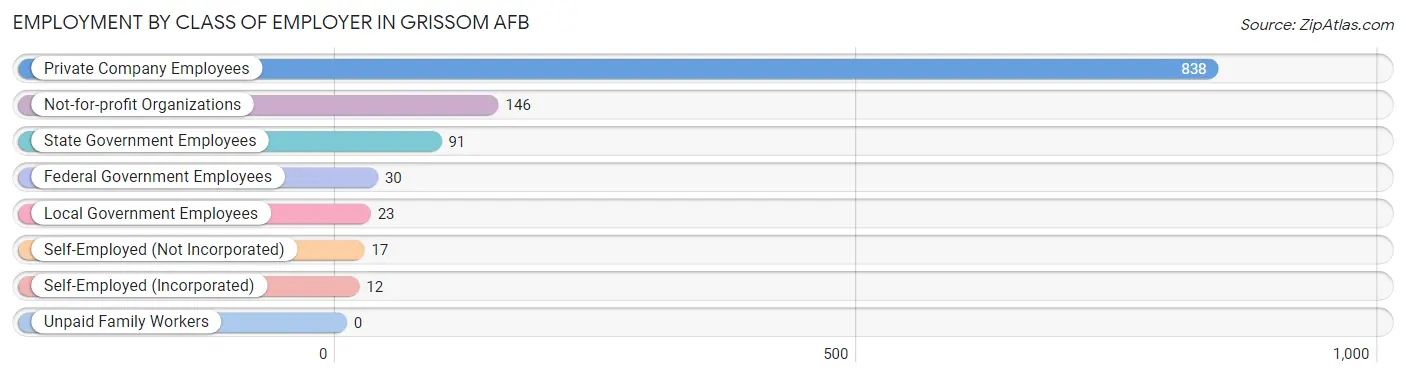
| Employer Class | # Employees | % Employees |
| Private Company Employees | 838 | 72.4% |
| Self-Employed (Incorporated) | 12 | 1.0% |
| Self-Employed (Not Incorporated) | 17 | 1.5% |
| Not-for-profit Organizations | 146 | 12.6% |
| Local Government Employees | 23 | 2.0% |
| State Government Employees | 91 | 7.9% |
| Federal Government Employees | 30 | 2.6% |
| Unpaid Family Workers | 0 | 0.0% |
| Total | 1,157 | 100.0% |
Employment Status by Age in Grissom AFB
According to the labor force statistics for Grissom AFB, out of the total population over 16 years of age (1,928), 64.3% or 1,240 individuals are in the labor force, with 3.6% or 45 of them unemployed. The age group with the highest labor force participation rate is 30 to 34 years, with 90.2% or 175 individuals in the labor force. Within the labor force, the 16 to 19 years age range has the highest percentage of unemployed individuals, with 38.9% or 28 of them being unemployed.
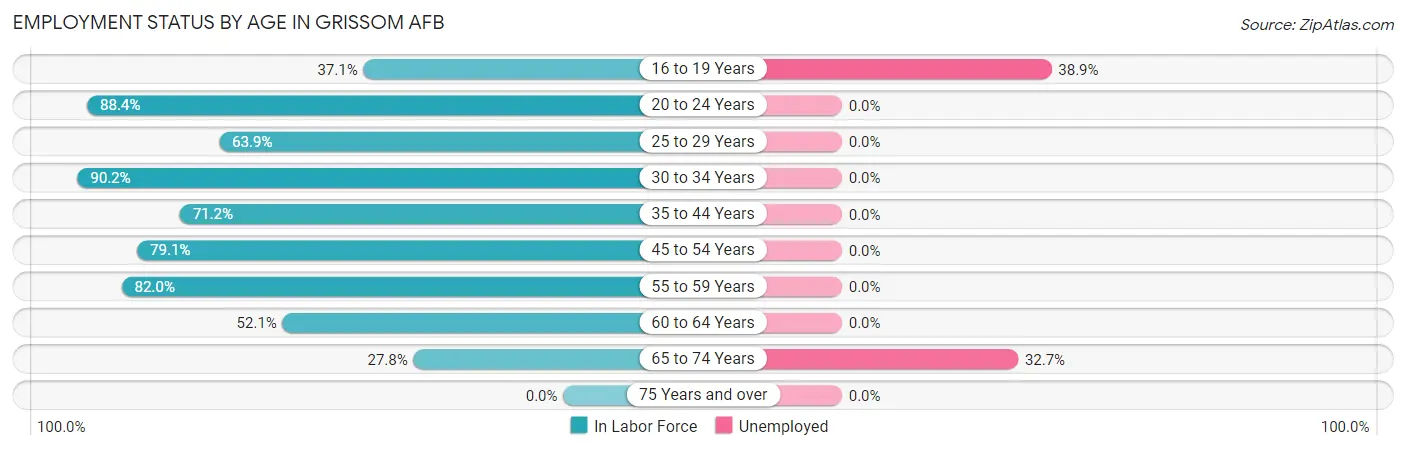
| Age Bracket | In Labor Force | Unemployed |
| 16 to 19 Years | 72 (37.1%) | 28 (38.9%) |
| 20 to 24 Years | 251 (88.4%) | 0 (0.0%) |
| 25 to 29 Years | 138 (63.9%) | 0 (0.0%) |
| 30 to 34 Years | 175 (90.2%) | 0 (0.0%) |
| 35 to 44 Years | 222 (71.2%) | 0 (0.0%) |
| 45 to 54 Years | 186 (79.1%) | 0 (0.0%) |
| 55 to 59 Years | 109 (82.0%) | 0 (0.0%) |
| 60 to 64 Years | 37 (52.1%) | 0 (0.0%) |
| 65 to 74 Years | 49 (27.8%) | 16 (32.7%) |
| 75 Years and over | 0 (0.0%) | 0 (0.0%) |
| Total | 1,240 (64.3%) | 45 (3.6%) |
Employment Status by Educational Attainment in Grissom AFB
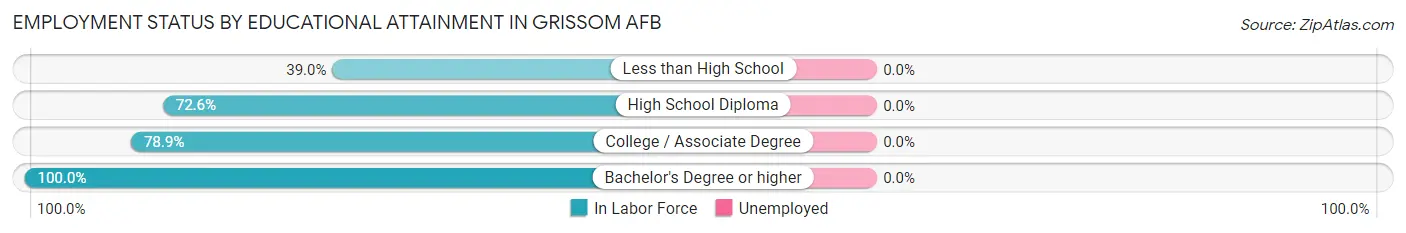
| Educational Attainment | In Labor Force | Unemployed |
| Less than High School | 30 (39.0%) | 0 (0.0%) |
| High School Diploma | 360 (72.6%) | 0 (0.0%) |
| College / Associate Degree | 414 (78.9%) | 0 (0.0%) |
| Bachelor's Degree or higher | 63 (100.0%) | 0 (0.0%) |
| Total | 867 (74.7%) | 0 (0.0%) |
Employment Occupations by Sex in Grissom AFB
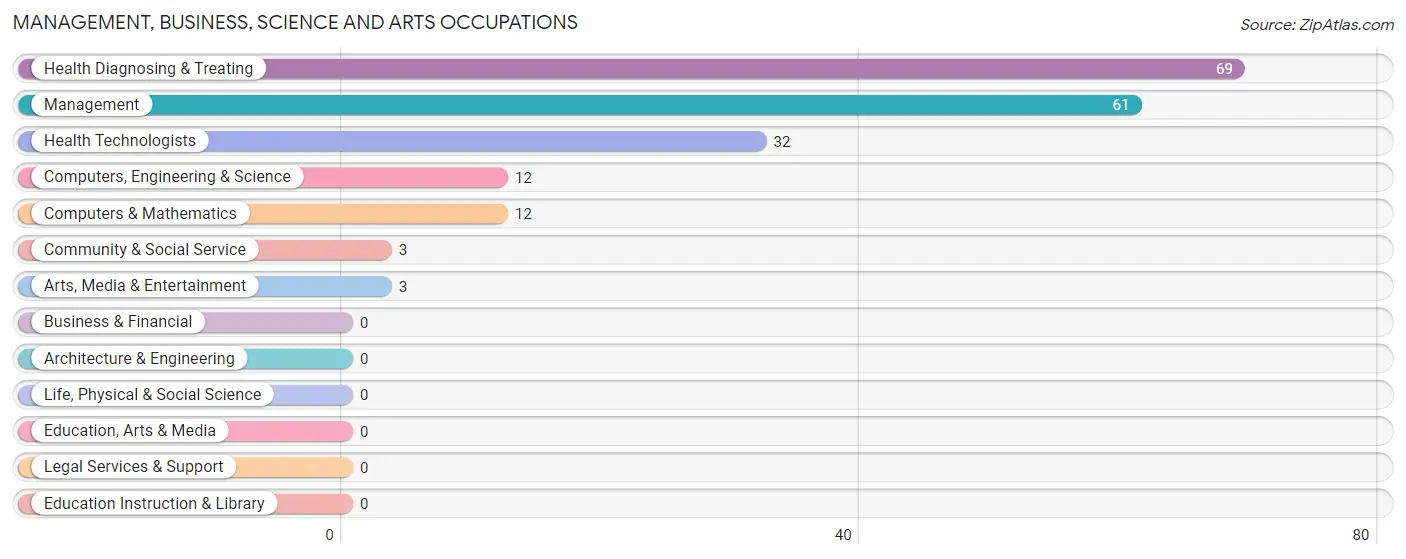
Management, Business, Science and Arts Occupations
The most common Management, Business, Science and Arts occupations in Grissom AFB are Health Diagnosing & Treating (69 | 5.8%), Management (61 | 5.1%), Health Technologists (32 | 2.7%), Computers, Engineering & Science (12 | 1.0%), and Computers & Mathematics (12 | 1.0%).
Management, Business, Science and Arts Occupations by Sex
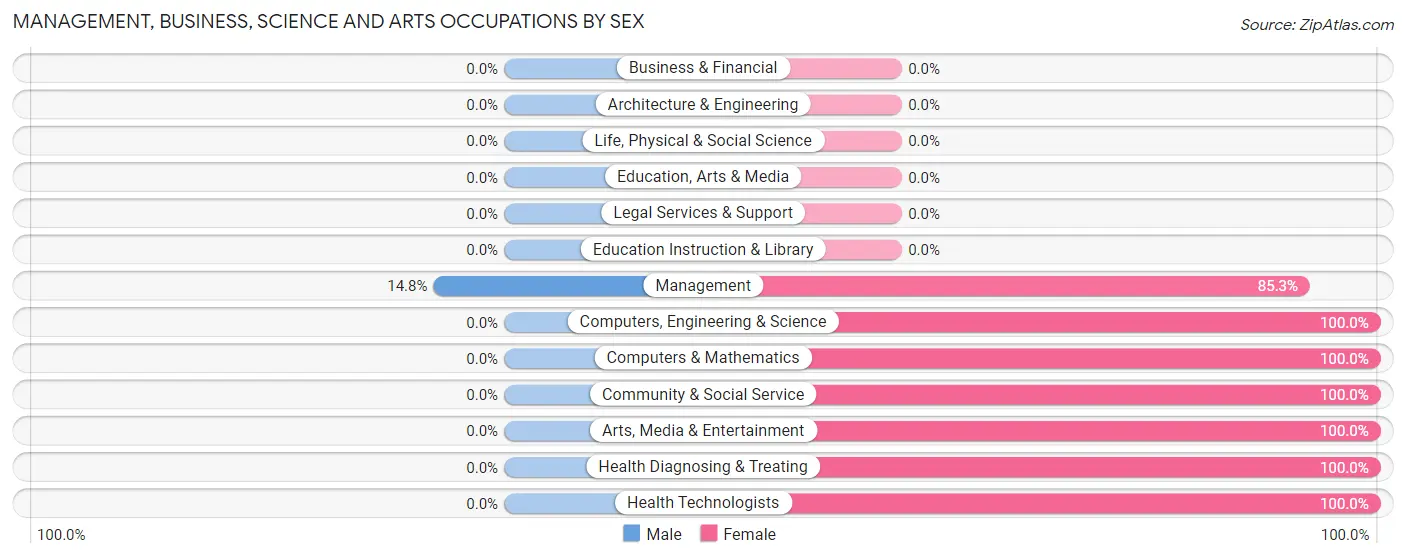
| Occupation | Male | Female |
| Management | 9 (14.7%) | 52 (85.3%) |
| Business & Financial | 0 (0.0%) | 0 (0.0%) |
| Computers, Engineering & Science | 0 (0.0%) | 12 (100.0%) |
| Computers & Mathematics | 0 (0.0%) | 12 (100.0%) |
| Architecture & Engineering | 0 (0.0%) | 0 (0.0%) |
| Life, Physical & Social Science | 0 (0.0%) | 0 (0.0%) |
| Community & Social Service | 0 (0.0%) | 3 (100.0%) |
| Education, Arts & Media | 0 (0.0%) | 0 (0.0%) |
| Legal Services & Support | 0 (0.0%) | 0 (0.0%) |
| Education Instruction & Library | 0 (0.0%) | 0 (0.0%) |
| Arts, Media & Entertainment | 0 (0.0%) | 3 (100.0%) |
| Health Diagnosing & Treating | 0 (0.0%) | 69 (100.0%) |
| Health Technologists | 0 (0.0%) | 32 (100.0%) |
| Total (Category) | 9 (6.2%) | 136 (93.8%) |
| Total (Overall) | 633 (53.1%) | 560 (46.9%) |
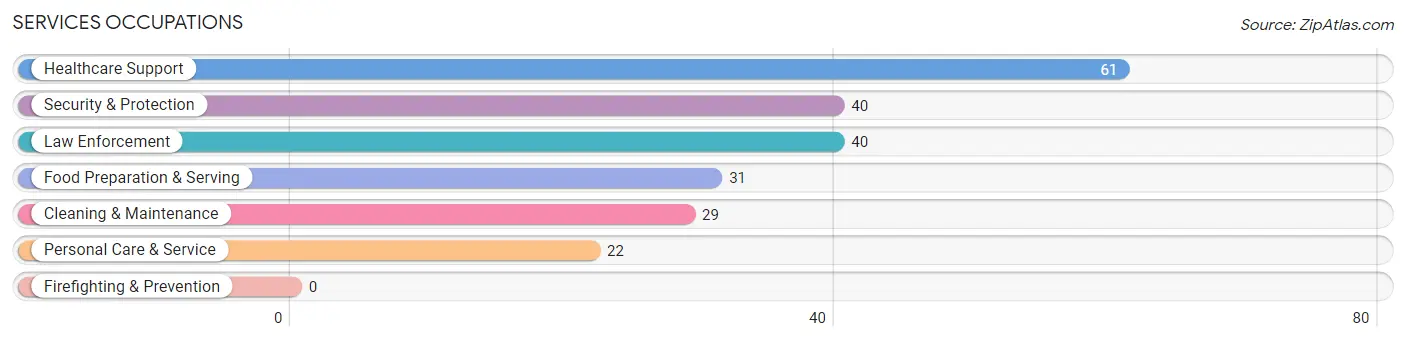
Services Occupations
The most common Services occupations in Grissom AFB are Healthcare Support (61 | 5.1%), Security & Protection (40 | 3.4%), Law Enforcement (40 | 3.4%), Food Preparation & Serving (31 | 2.6%), and Cleaning & Maintenance (29 | 2.4%).
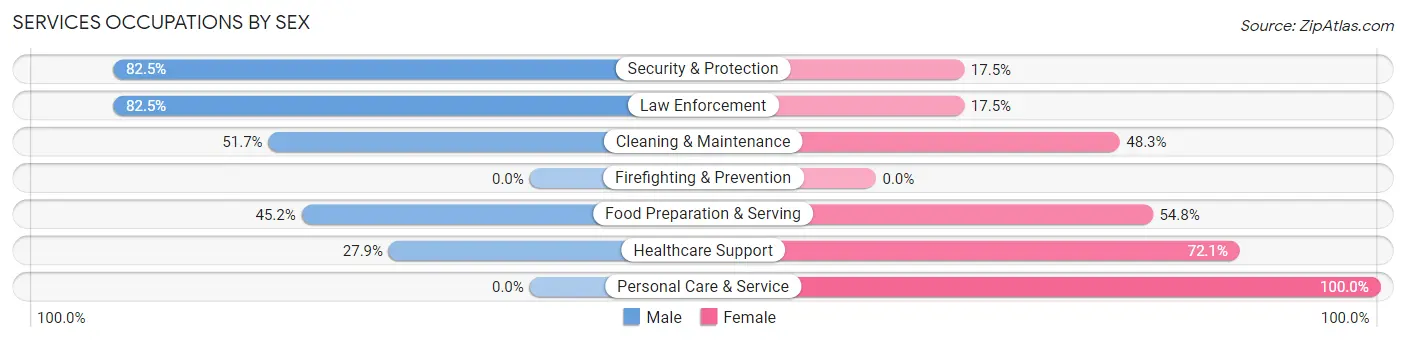
Services Occupations by Sex
Within the Services occupations in Grissom AFB, the most male-oriented occupations are Security & Protection (82.5%), Law Enforcement (82.5%), and Cleaning & Maintenance (51.7%), while the most female-oriented occupations are Personal Care & Service (100.0%), Healthcare Support (72.1%), and Food Preparation & Serving (54.8%).
| Occupation | Male | Female |
| Healthcare Support | 17 (27.9%) | 44 (72.1%) |
| Security & Protection | 33 (82.5%) | 7 (17.5%) |
| Firefighting & Prevention | 0 (0.0%) | 0 (0.0%) |
| Law Enforcement | 33 (82.5%) | 7 (17.5%) |
| Food Preparation & Serving | 14 (45.2%) | 17 (54.8%) |
| Cleaning & Maintenance | 15 (51.7%) | 14 (48.3%) |
| Personal Care & Service | 0 (0.0%) | 22 (100.0%) |
| Total (Category) | 79 (43.2%) | 104 (56.8%) |
| Total (Overall) | 633 (53.1%) | 560 (46.9%) |
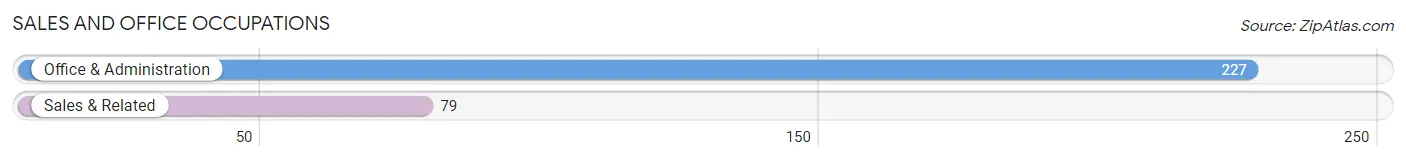
Sales and Office Occupations
The most common Sales and Office occupations in Grissom AFB are Office & Administration (227 | 19.0%), and Sales & Related (79 | 6.6%).
Sales and Office Occupations by Sex
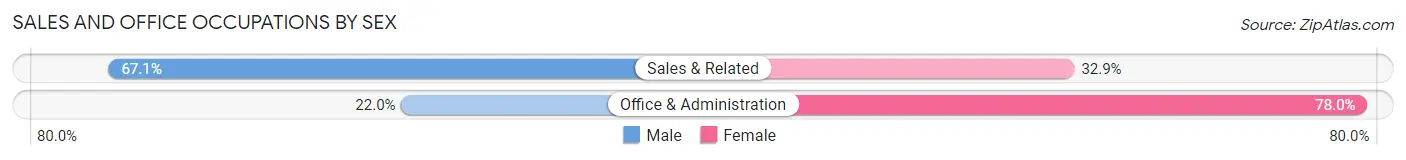
| Occupation | Male | Female |
| Sales & Related | 53 (67.1%) | 26 (32.9%) |
| Office & Administration | 50 (22.0%) | 177 (78.0%) |
| Total (Category) | 103 (33.7%) | 203 (66.3%) |
| Total (Overall) | 633 (53.1%) | 560 (46.9%) |
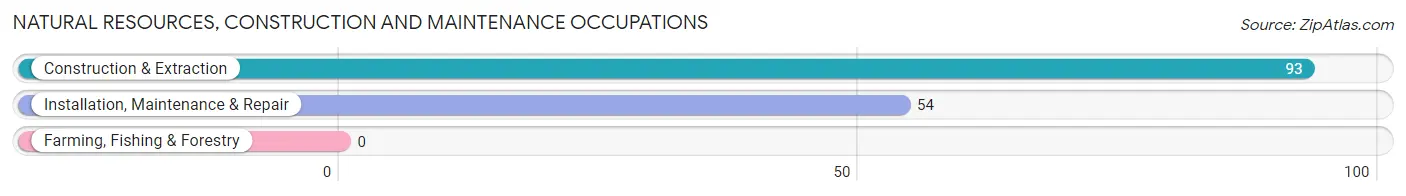
Natural Resources, Construction and Maintenance Occupations
The most common Natural Resources, Construction and Maintenance occupations in Grissom AFB are Construction & Extraction (93 | 7.8%), and Installation, Maintenance & Repair (54 | 4.5%).
Natural Resources, Construction and Maintenance Occupations by Sex
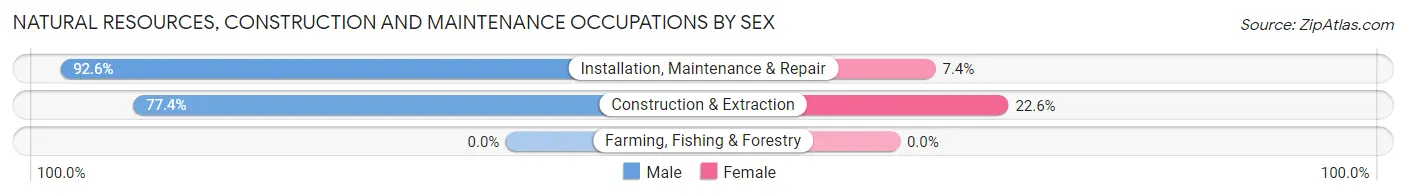
| Occupation | Male | Female |
| Farming, Fishing & Forestry | 0 (0.0%) | 0 (0.0%) |
| Construction & Extraction | 72 (77.4%) | 21 (22.6%) |
| Installation, Maintenance & Repair | 50 (92.6%) | 4 (7.4%) |
| Total (Category) | 122 (83.0%) | 25 (17.0%) |
| Total (Overall) | 633 (53.1%) | 560 (46.9%) |
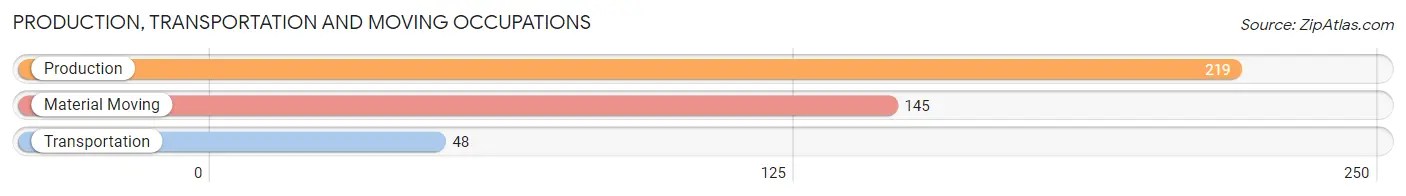
Production, Transportation and Moving Occupations
The most common Production, Transportation and Moving occupations in Grissom AFB are Production (219 | 18.4%), Material Moving (145 | 12.1%), and Transportation (48 | 4.0%).
Production, Transportation and Moving Occupations by Sex
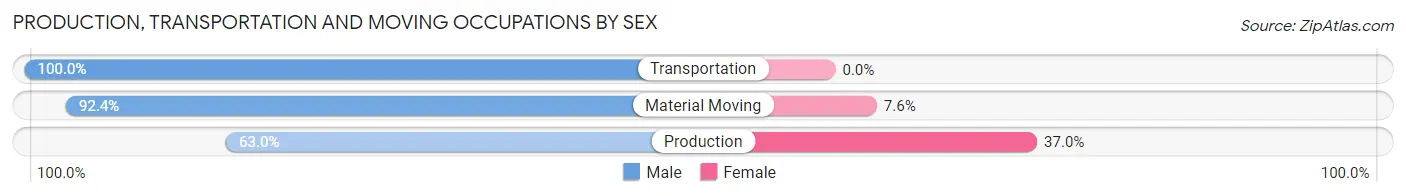
| Occupation | Male | Female |
| Production | 138 (63.0%) | 81 (37.0%) |
| Transportation | 48 (100.0%) | 0 (0.0%) |
| Material Moving | 134 (92.4%) | 11 (7.6%) |
| Total (Category) | 320 (77.7%) | 92 (22.3%) |
| Total (Overall) | 633 (53.1%) | 560 (46.9%) |
Employment Industries by Sex in Grissom AFB
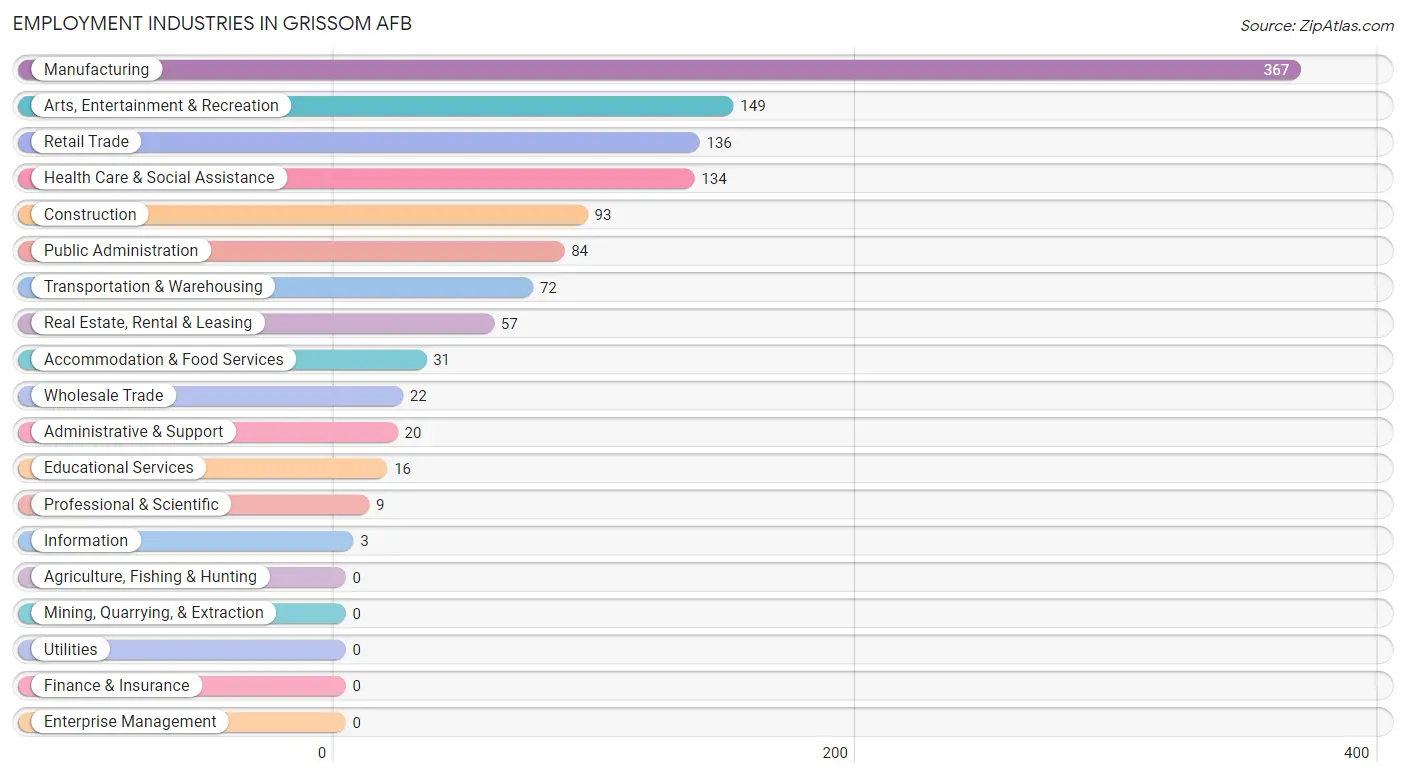
Employment Industries in Grissom AFB
The major employment industries in Grissom AFB include Manufacturing (367 | 30.8%), Arts, Entertainment & Recreation (149 | 12.5%), Retail Trade (136 | 11.4%), Health Care & Social Assistance (134 | 11.2%), and Construction (93 | 7.8%).
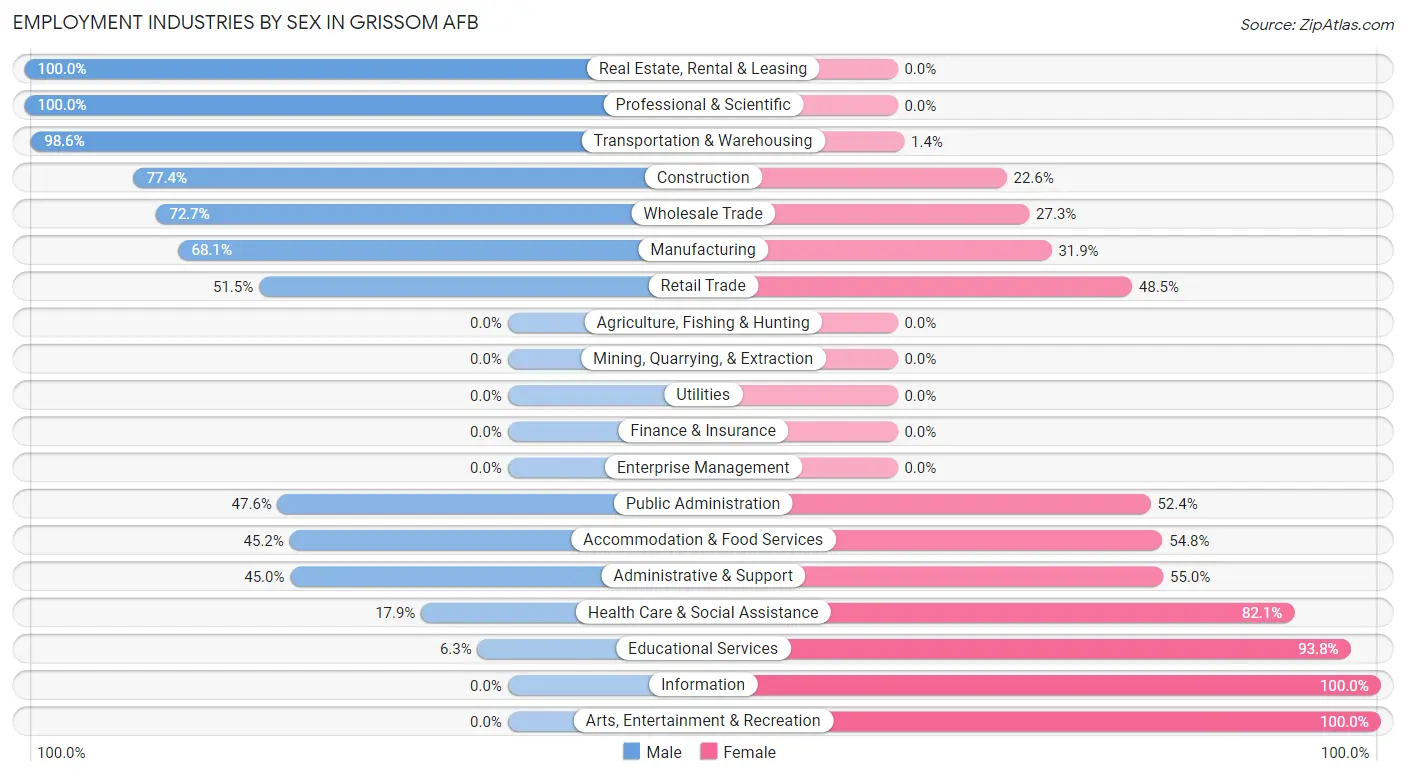
Employment Industries by Sex in Grissom AFB
The Grissom AFB industries that see more men than women are Real Estate, Rental & Leasing (100.0%), Professional & Scientific (100.0%), and Transportation & Warehousing (98.6%), whereas the industries that tend to have a higher number of women are Information (100.0%), Arts, Entertainment & Recreation (100.0%), and Educational Services (93.8%).
| Industry | Male | Female |
| Agriculture, Fishing & Hunting | 0 (0.0%) | 0 (0.0%) |
| Mining, Quarrying, & Extraction | 0 (0.0%) | 0 (0.0%) |
| Construction | 72 (77.4%) | 21 (22.6%) |
| Manufacturing | 250 (68.1%) | 117 (31.9%) |
| Wholesale Trade | 16 (72.7%) | 6 (27.3%) |
| Retail Trade | 70 (51.5%) | 66 (48.5%) |
| Transportation & Warehousing | 71 (98.6%) | 1 (1.4%) |
| Utilities | 0 (0.0%) | 0 (0.0%) |
| Information | 0 (0.0%) | 3 (100.0%) |
| Finance & Insurance | 0 (0.0%) | 0 (0.0%) |
| Real Estate, Rental & Leasing | 57 (100.0%) | 0 (0.0%) |
| Professional & Scientific | 9 (100.0%) | 0 (0.0%) |
| Enterprise Management | 0 (0.0%) | 0 (0.0%) |
| Administrative & Support | 9 (45.0%) | 11 (55.0%) |
| Educational Services | 1 (6.2%) | 15 (93.8%) |
| Health Care & Social Assistance | 24 (17.9%) | 110 (82.1%) |
| Arts, Entertainment & Recreation | 0 (0.0%) | 149 (100.0%) |
| Accommodation & Food Services | 14 (45.2%) | 17 (54.8%) |
| Public Administration | 40 (47.6%) | 44 (52.4%) |
| Total | 633 (53.1%) | 560 (46.9%) |
Education in Grissom AFB
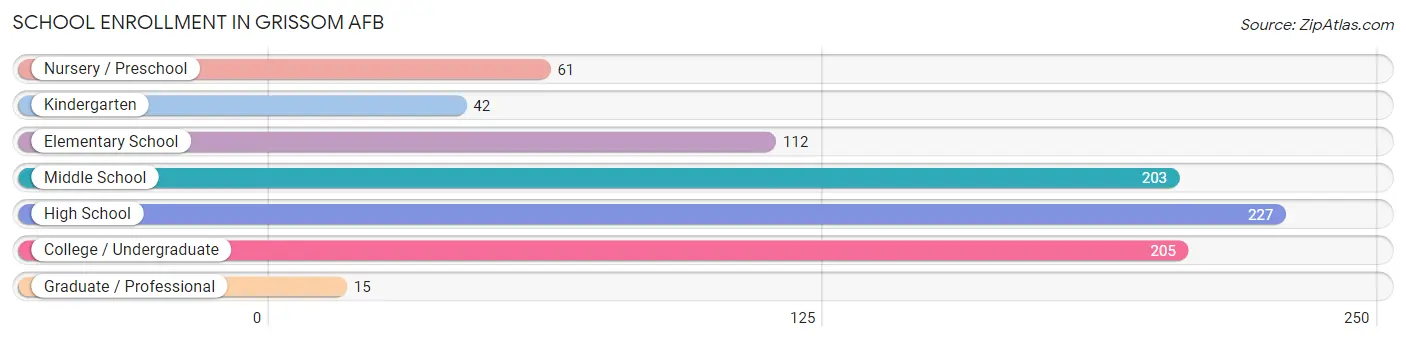
School Enrollment in Grissom AFB
The most common levels of schooling among the 865 students in Grissom AFB are high school (227 | 26.2%), college / undergraduate (205 | 23.7%), and middle school (203 | 23.5%).
| School Level | # Students | % Students |
| Nursery / Preschool | 61 | 7.0% |
| Kindergarten | 42 | 4.9% |
| Elementary School | 112 | 13.0% |
| Middle School | 203 | 23.5% |
| High School | 227 | 26.2% |
| College / Undergraduate | 205 | 23.7% |
| Graduate / Professional | 15 | 1.7% |
| Total | 865 | 100.0% |
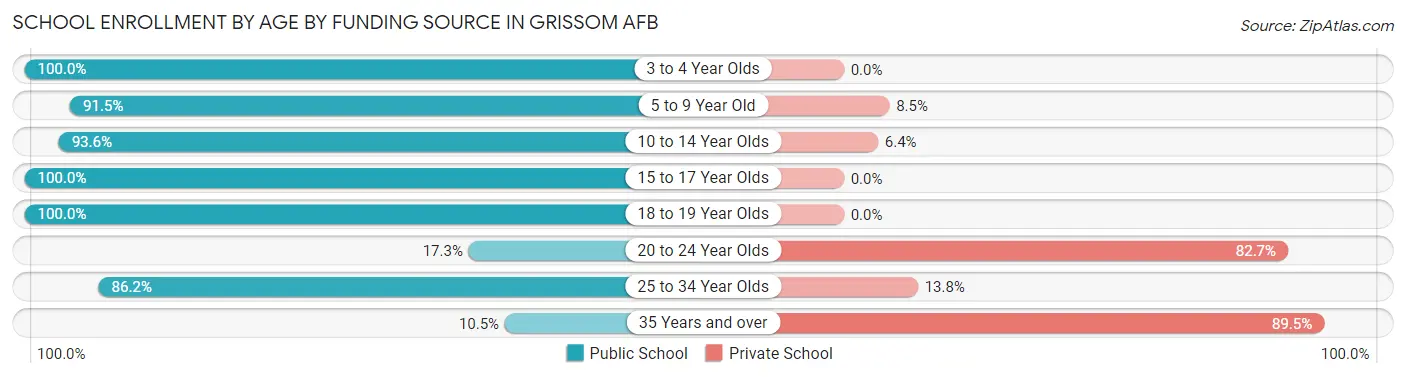
School Enrollment by Age by Funding Source in Grissom AFB
Out of a total of 865 students who are enrolled in schools in Grissom AFB, 165 (19.1%) attend a private institution, while the remaining 700 (80.9%) are enrolled in public schools. The age group of 35 years and over has the highest likelihood of being enrolled in private schools, with 17 (89.5% in the age bracket) enrolled. Conversely, the age group of 3 to 4 year olds has the lowest likelihood of being enrolled in a private school, with 35 (100.0% in the age bracket) attending a public institution.
| Age Bracket | Public School | Private School |
| 3 to 4 Year Olds | 35 (100.0%) | 0 (0.0%) |
| 5 to 9 Year Old | 151 (91.5%) | 14 (8.5%) |
| 10 to 14 Year Olds | 221 (93.6%) | 15 (6.4%) |
| 15 to 17 Year Olds | 172 (100.0%) | 0 (0.0%) |
| 18 to 19 Year Olds | 70 (100.0%) | 0 (0.0%) |
| 20 to 24 Year Olds | 24 (17.3%) | 115 (82.7%) |
| 25 to 34 Year Olds | 25 (86.2%) | 4 (13.8%) |
| 35 Years and over | 2 (10.5%) | 17 (89.5%) |
| Total | 700 (80.9%) | 165 (19.1%) |
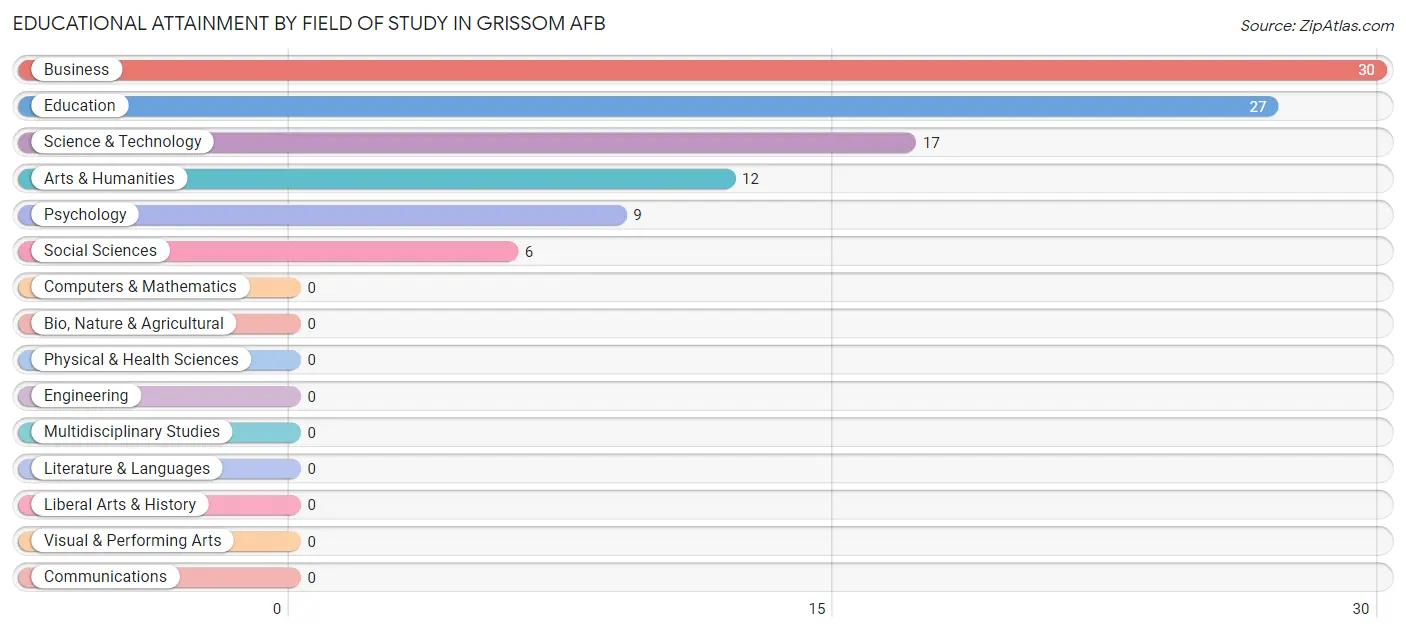
Educational Attainment by Field of Study in Grissom AFB
Business (30 | 29.7%), education (27 | 26.7%), science & technology (17 | 16.8%), arts & humanities (12 | 11.9%), and psychology (9 | 8.9%) are the most common fields of study among 101 individuals in Grissom AFB who have obtained a bachelor's degree or higher.
| Field of Study | # Graduates | % Graduates |
| Computers & Mathematics | 0 | 0.0% |
| Bio, Nature & Agricultural | 0 | 0.0% |
| Physical & Health Sciences | 0 | 0.0% |
| Psychology | 9 | 8.9% |
| Social Sciences | 6 | 5.9% |
| Engineering | 0 | 0.0% |
| Multidisciplinary Studies | 0 | 0.0% |
| Science & Technology | 17 | 16.8% |
| Business | 30 | 29.7% |
| Education | 27 | 26.7% |
| Literature & Languages | 0 | 0.0% |
| Liberal Arts & History | 0 | 0.0% |
| Visual & Performing Arts | 0 | 0.0% |
| Communications | 0 | 0.0% |
| Arts & Humanities | 12 | 11.9% |
| Total | 101 | 100.0% |
Transportation & Commute in Grissom AFB
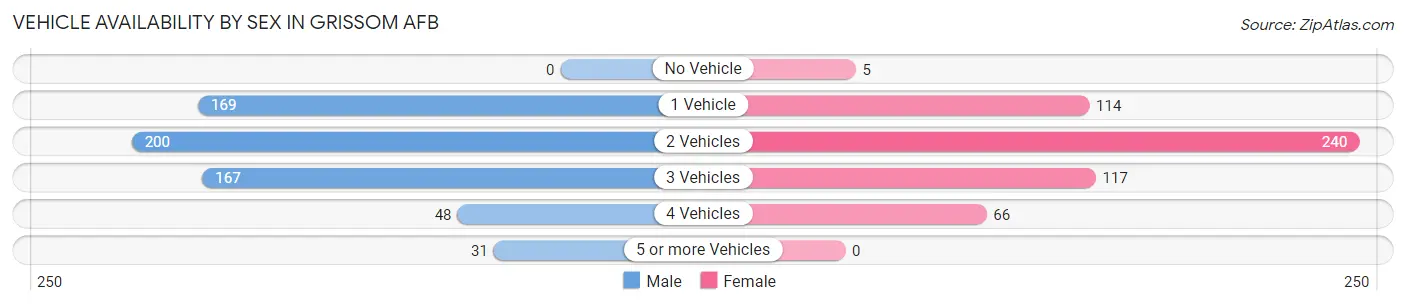
Vehicle Availability by Sex in Grissom AFB
The most prevalent vehicle ownership categories in Grissom AFB are males with 2 vehicles (200, accounting for 32.5%) and females with 2 vehicles (240, making up 36.9%).
| Vehicles Available | Male | Female |
| No Vehicle | 0 (0.0%) | 5 (0.9%) |
| 1 Vehicle | 169 (27.5%) | 114 (21.0%) |
| 2 Vehicles | 200 (32.5%) | 240 (44.3%) |
| 3 Vehicles | 167 (27.2%) | 117 (21.6%) |
| 4 Vehicles | 48 (7.8%) | 66 (12.2%) |
| 5 or more Vehicles | 31 (5.0%) | 0 (0.0%) |
| Total | 615 (100.0%) | 542 (100.0%) |
Commute Time in Grissom AFB
The most frequently occuring commute durations in Grissom AFB are 20 to 24 minutes (430 commuters, 37.2%), 5 to 9 minutes (167 commuters, 14.4%), and 15 to 19 minutes (129 commuters, 11.2%).
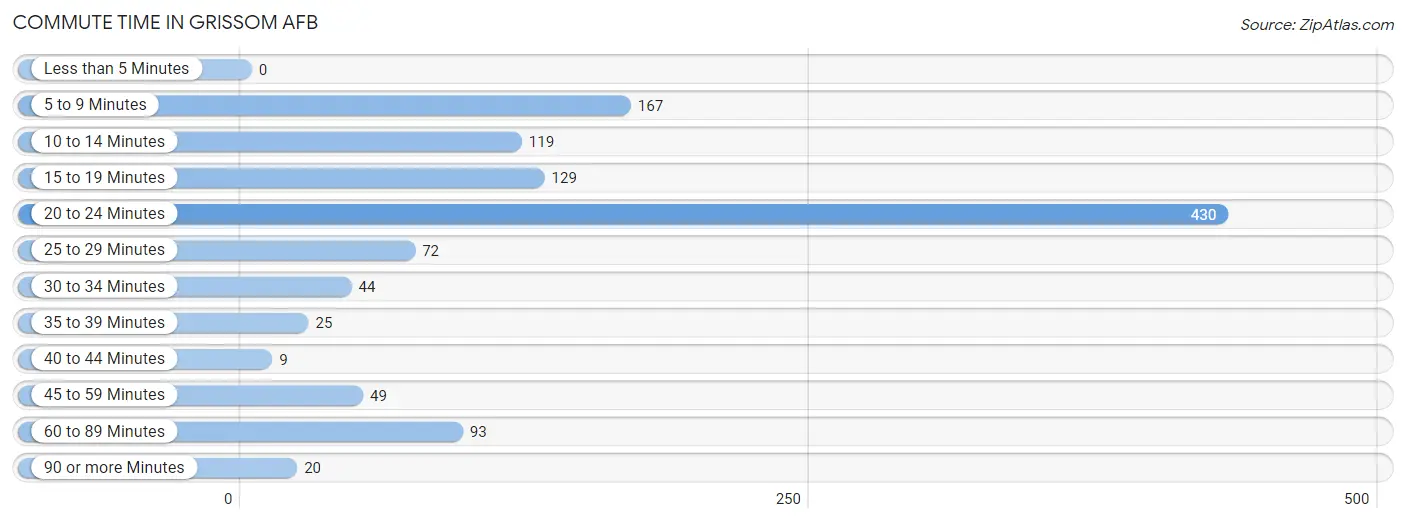
| Commute Time | # Commuters | % Commuters |
| Less than 5 Minutes | 0 | 0.0% |
| 5 to 9 Minutes | 167 | 14.4% |
| 10 to 14 Minutes | 119 | 10.3% |
| 15 to 19 Minutes | 129 | 11.2% |
| 20 to 24 Minutes | 430 | 37.2% |
| 25 to 29 Minutes | 72 | 6.2% |
| 30 to 34 Minutes | 44 | 3.8% |
| 35 to 39 Minutes | 25 | 2.2% |
| 40 to 44 Minutes | 9 | 0.8% |
| 45 to 59 Minutes | 49 | 4.2% |
| 60 to 89 Minutes | 93 | 8.0% |
| 90 or more Minutes | 20 | 1.7% |
Commute Time by Sex in Grissom AFB
The most common commute times in Grissom AFB are 20 to 24 minutes (186 commuters, 30.2%) for males and 20 to 24 minutes (244 commuters, 45.0%) for females.
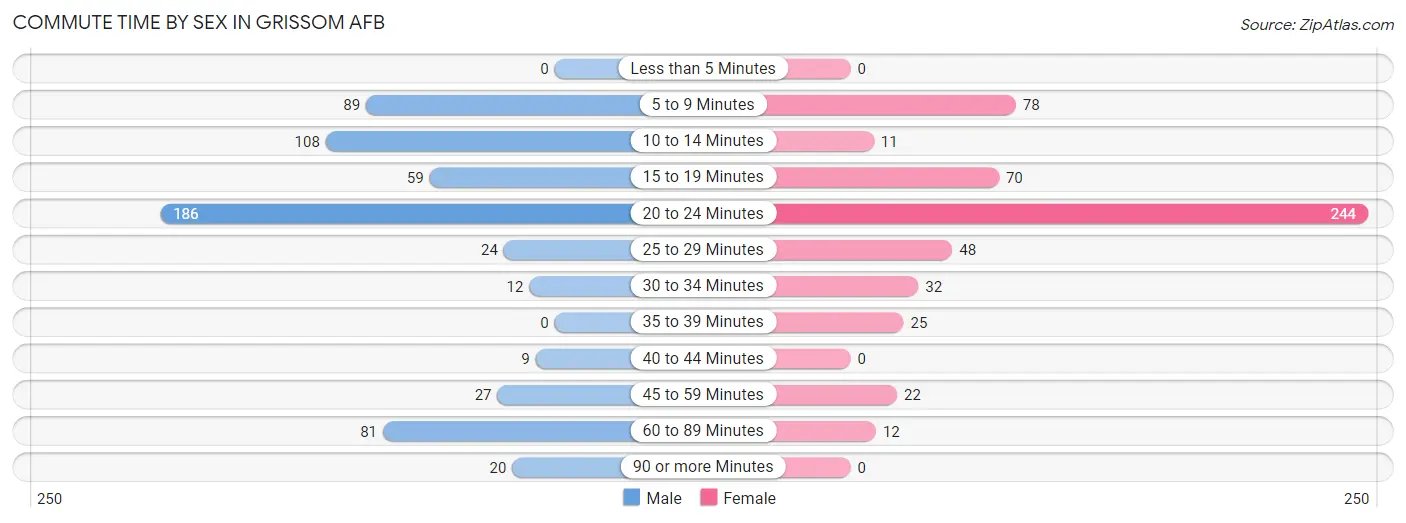
| Commute Time | Male | Female |
| Less than 5 Minutes | 0 (0.0%) | 0 (0.0%) |
| 5 to 9 Minutes | 89 (14.5%) | 78 (14.4%) |
| 10 to 14 Minutes | 108 (17.6%) | 11 (2.0%) |
| 15 to 19 Minutes | 59 (9.6%) | 70 (12.9%) |
| 20 to 24 Minutes | 186 (30.2%) | 244 (45.0%) |
| 25 to 29 Minutes | 24 (3.9%) | 48 (8.9%) |
| 30 to 34 Minutes | 12 (1.9%) | 32 (5.9%) |
| 35 to 39 Minutes | 0 (0.0%) | 25 (4.6%) |
| 40 to 44 Minutes | 9 (1.5%) | 0 (0.0%) |
| 45 to 59 Minutes | 27 (4.4%) | 22 (4.1%) |
| 60 to 89 Minutes | 81 (13.2%) | 12 (2.2%) |
| 90 or more Minutes | 20 (3.3%) | 0 (0.0%) |
Time of Departure to Work by Sex in Grissom AFB
The most frequent times of departure to work in Grissom AFB are 4:00 PM to 11:59 PM (123, 20.0%) for males and 7:30 AM to 7:59 AM (135, 24.9%) for females.
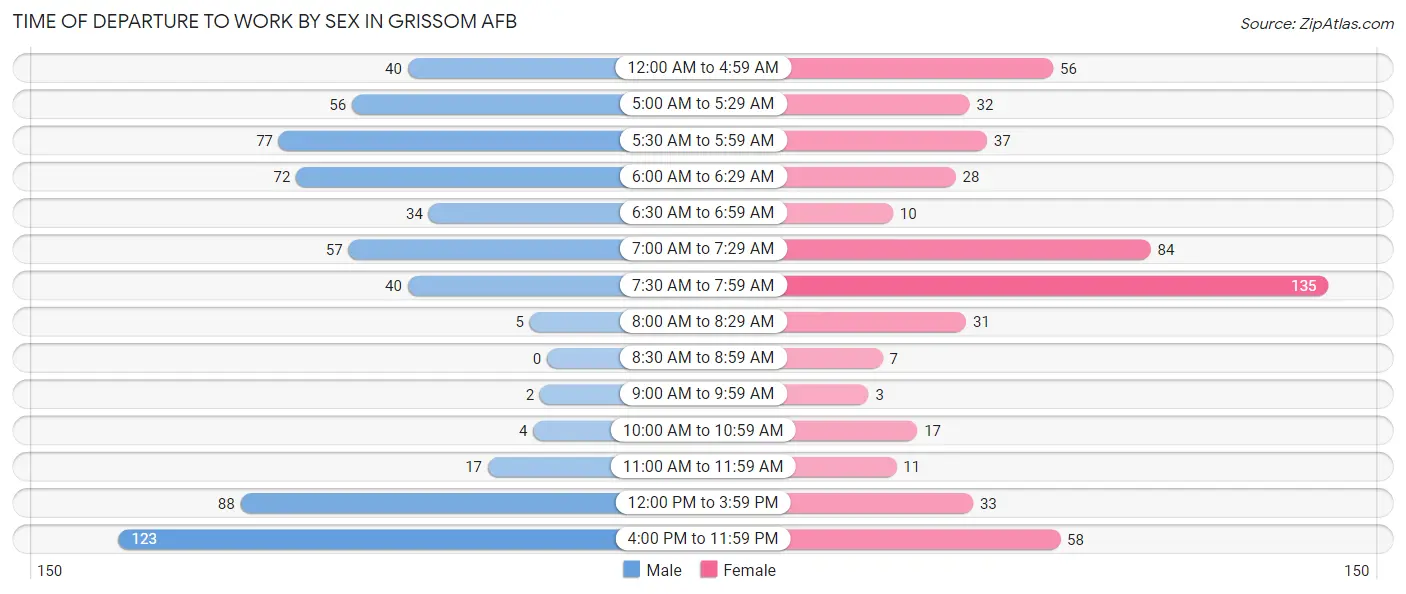
| Time of Departure | Male | Female |
| 12:00 AM to 4:59 AM | 40 (6.5%) | 56 (10.3%) |
| 5:00 AM to 5:29 AM | 56 (9.1%) | 32 (5.9%) |
| 5:30 AM to 5:59 AM | 77 (12.5%) | 37 (6.8%) |
| 6:00 AM to 6:29 AM | 72 (11.7%) | 28 (5.2%) |
| 6:30 AM to 6:59 AM | 34 (5.5%) | 10 (1.8%) |
| 7:00 AM to 7:29 AM | 57 (9.3%) | 84 (15.5%) |
| 7:30 AM to 7:59 AM | 40 (6.5%) | 135 (24.9%) |
| 8:00 AM to 8:29 AM | 5 (0.8%) | 31 (5.7%) |
| 8:30 AM to 8:59 AM | 0 (0.0%) | 7 (1.3%) |
| 9:00 AM to 9:59 AM | 2 (0.3%) | 3 (0.5%) |
| 10:00 AM to 10:59 AM | 4 (0.6%) | 17 (3.1%) |
| 11:00 AM to 11:59 AM | 17 (2.8%) | 11 (2.0%) |
| 12:00 PM to 3:59 PM | 88 (14.3%) | 33 (6.1%) |
| 4:00 PM to 11:59 PM | 123 (20.0%) | 58 (10.7%) |
| Total | 615 (100.0%) | 542 (100.0%) |
Housing Occupancy in Grissom AFB
Occupancy by Ownership in Grissom AFB
Of the total 775 dwellings in Grissom AFB, owner-occupied units account for 177 (22.8%), while renter-occupied units make up 598 (77.2%).
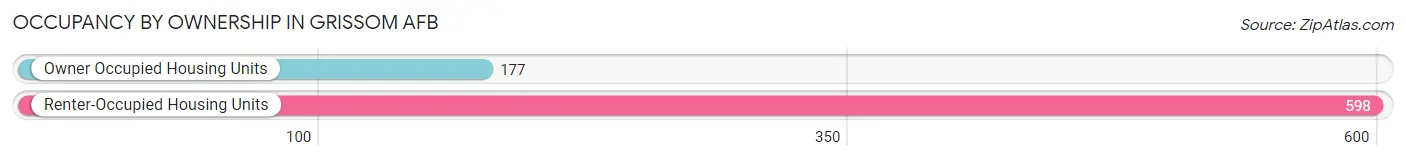
| Occupancy | # Housing Units | % Housing Units |
| Owner Occupied Housing Units | 177 | 22.8% |
| Renter-Occupied Housing Units | 598 | 77.2% |
| Total Occupied Housing Units | 775 | 100.0% |
Occupancy by Household Size in Grissom AFB
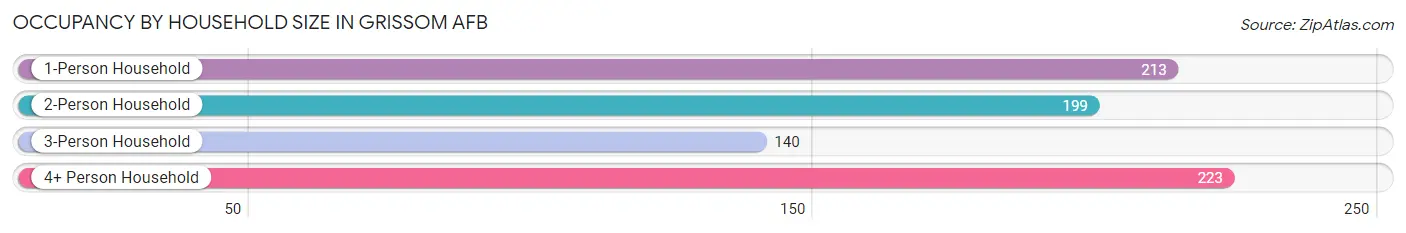
| Household Size | # Housing Units | % Housing Units |
| 1-Person Household | 213 | 27.5% |
| 2-Person Household | 199 | 25.7% |
| 3-Person Household | 140 | 18.1% |
| 4+ Person Household | 223 | 28.8% |
| Total Housing Units | 775 | 100.0% |
Occupancy by Ownership by Household Size in Grissom AFB
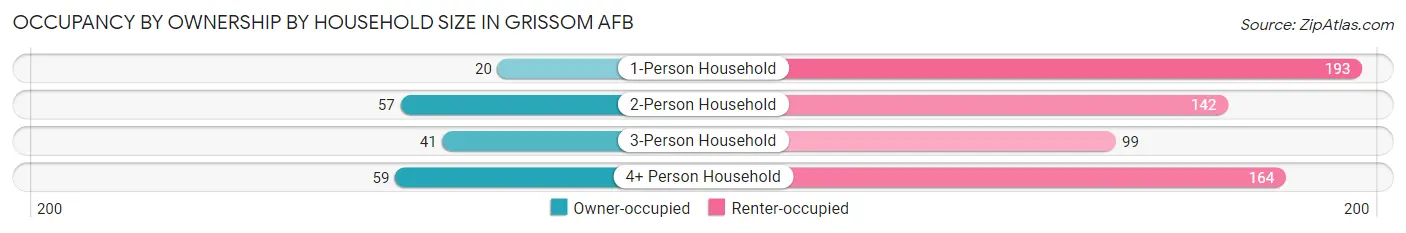
| Household Size | Owner-occupied | Renter-occupied |
| 1-Person Household | 20 (9.4%) | 193 (90.6%) |
| 2-Person Household | 57 (28.6%) | 142 (71.4%) |
| 3-Person Household | 41 (29.3%) | 99 (70.7%) |
| 4+ Person Household | 59 (26.5%) | 164 (73.5%) |
| Total Housing Units | 177 (22.8%) | 598 (77.2%) |
Occupancy by Educational Attainment in Grissom AFB
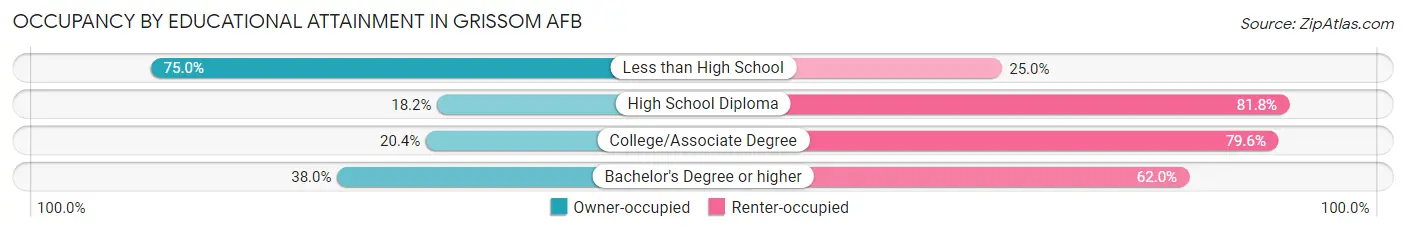
| Household Size | Owner-occupied | Renter-occupied |
| Less than High School | 24 (75.0%) | 8 (25.0%) |
| High School Diploma | 60 (18.2%) | 270 (81.8%) |
| College/Associate Degree | 74 (20.4%) | 289 (79.6%) |
| Bachelor's Degree or higher | 19 (38.0%) | 31 (62.0%) |
Occupancy by Age of Householder in Grissom AFB
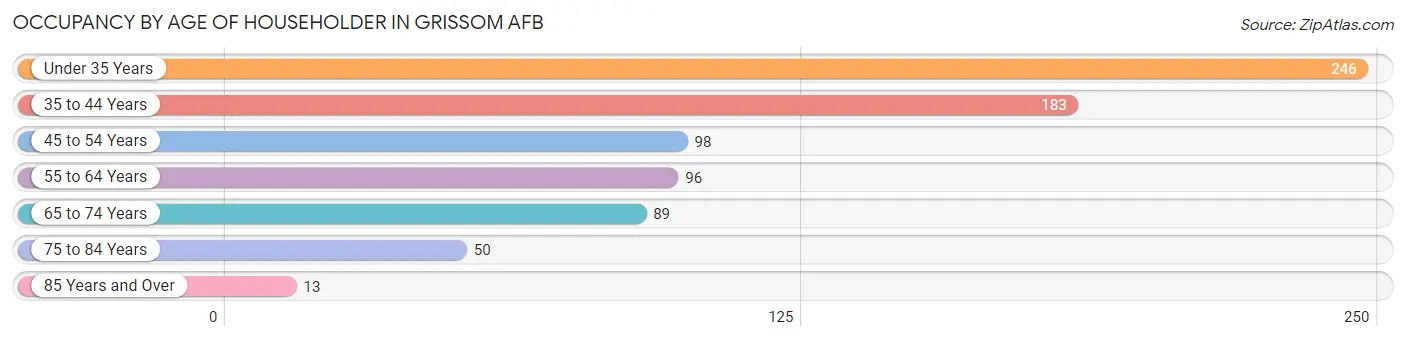
| Age Bracket | # Households | % Households |
| Under 35 Years | 246 | 31.7% |
| 35 to 44 Years | 183 | 23.6% |
| 45 to 54 Years | 98 | 12.7% |
| 55 to 64 Years | 96 | 12.4% |
| 65 to 74 Years | 89 | 11.5% |
| 75 to 84 Years | 50 | 6.5% |
| 85 Years and Over | 13 | 1.7% |
| Total | 775 | 100.0% |
Housing Finances in Grissom AFB
Median Income by Occupancy in Grissom AFB
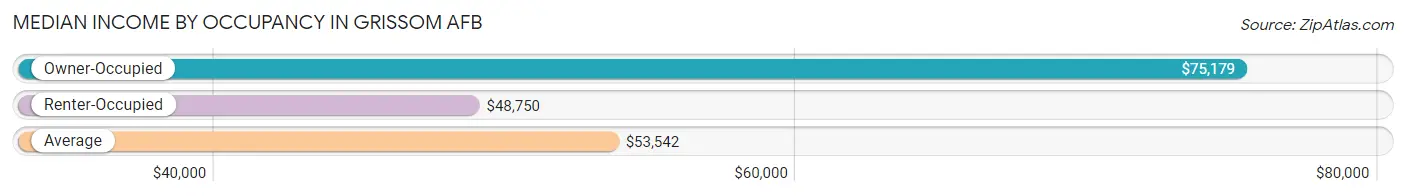
| Occupancy Type | # Households | Median Income |
| Owner-Occupied | 177 (22.8%) | $75,179 |
| Renter-Occupied | 598 (77.2%) | $48,750 |
| Average | 775 (100.0%) | $53,542 |
Occupancy by Householder Income Bracket in Grissom AFB
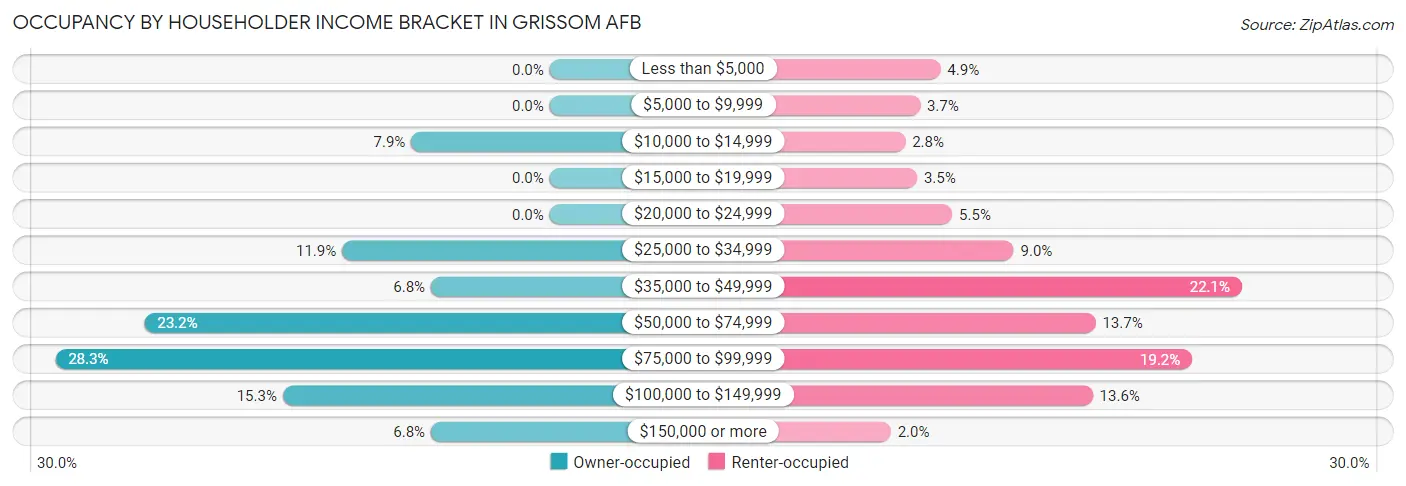
| Income Bracket | Owner-occupied | Renter-occupied |
| Less than $5,000 | 0 (0.0%) | 29 (4.9%) |
| $5,000 to $9,999 | 0 (0.0%) | 22 (3.7%) |
| $10,000 to $14,999 | 14 (7.9%) | 17 (2.8%) |
| $15,000 to $19,999 | 0 (0.0%) | 21 (3.5%) |
| $20,000 to $24,999 | 0 (0.0%) | 33 (5.5%) |
| $25,000 to $34,999 | 21 (11.9%) | 54 (9.0%) |
| $35,000 to $49,999 | 12 (6.8%) | 132 (22.1%) |
| $50,000 to $74,999 | 41 (23.2%) | 82 (13.7%) |
| $75,000 to $99,999 | 50 (28.2%) | 115 (19.2%) |
| $100,000 to $149,999 | 27 (15.2%) | 81 (13.6%) |
| $150,000 or more | 12 (6.8%) | 12 (2.0%) |
| Total | 177 (100.0%) | 598 (100.0%) |
Monthly Housing Cost Tiers in Grissom AFB
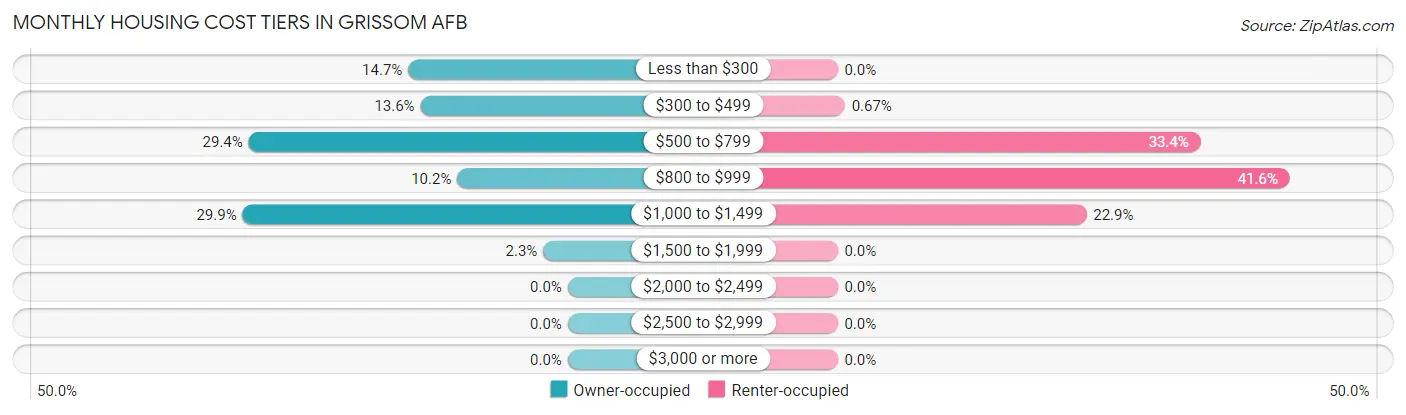
| Monthly Cost | Owner-occupied | Renter-occupied |
| Less than $300 | 26 (14.7%) | 0 (0.0%) |
| $300 to $499 | 24 (13.6%) | 4 (0.7%) |
| $500 to $799 | 52 (29.4%) | 200 (33.4%) |
| $800 to $999 | 18 (10.2%) | 249 (41.6%) |
| $1,000 to $1,499 | 53 (29.9%) | 137 (22.9%) |
| $1,500 to $1,999 | 4 (2.3%) | 0 (0.0%) |
| $2,000 to $2,499 | 0 (0.0%) | 0 (0.0%) |
| $2,500 to $2,999 | 0 (0.0%) | 0 (0.0%) |
| $3,000 or more | 0 (0.0%) | 0 (0.0%) |
| Total | 177 (100.0%) | 598 (100.0%) |
Physical Housing Characteristics in Grissom AFB
Housing Structures in Grissom AFB
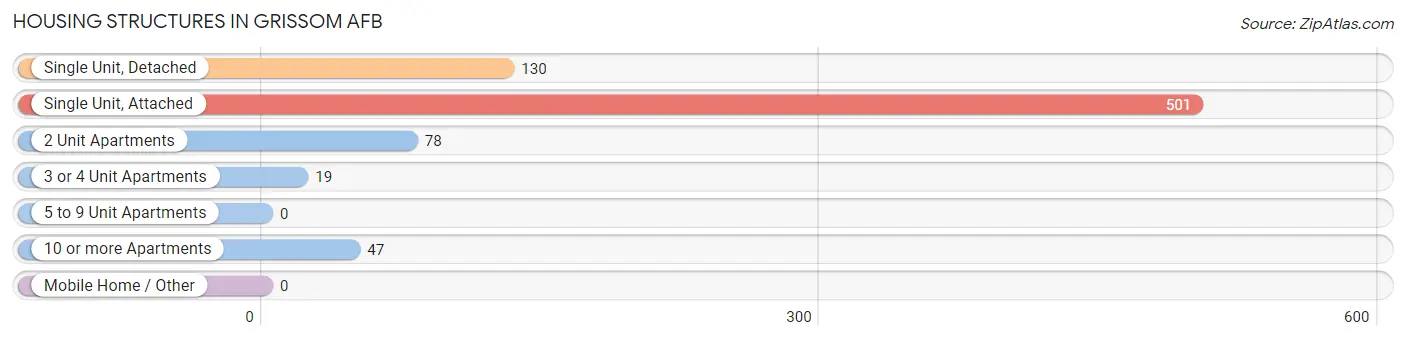
| Structure Type | # Housing Units | % Housing Units |
| Single Unit, Detached | 130 | 16.8% |
| Single Unit, Attached | 501 | 64.6% |
| 2 Unit Apartments | 78 | 10.1% |
| 3 or 4 Unit Apartments | 19 | 2.5% |
| 5 to 9 Unit Apartments | 0 | 0.0% |
| 10 or more Apartments | 47 | 6.1% |
| Mobile Home / Other | 0 | 0.0% |
| Total | 775 | 100.0% |
Housing Structures by Occupancy in Grissom AFB
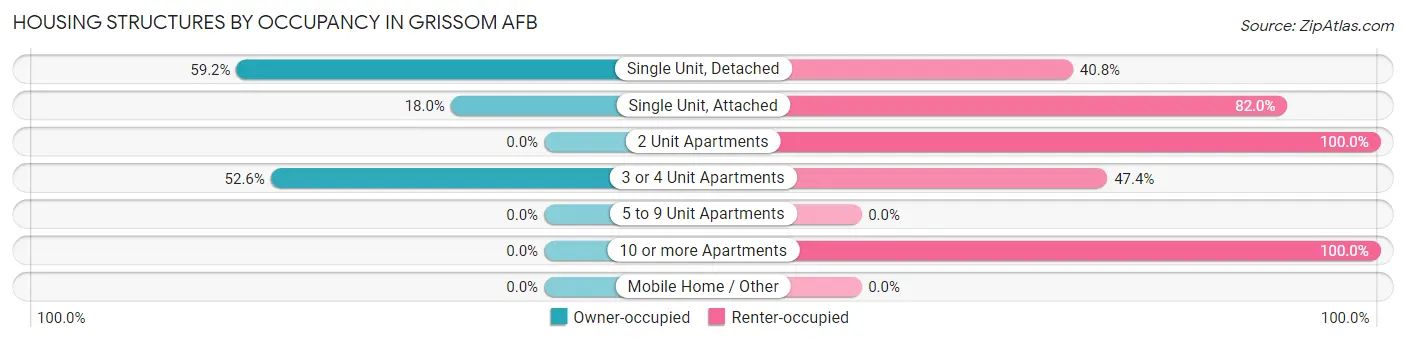
| Structure Type | Owner-occupied | Renter-occupied |
| Single Unit, Detached | 77 (59.2%) | 53 (40.8%) |
| Single Unit, Attached | 90 (18.0%) | 411 (82.0%) |
| 2 Unit Apartments | 0 (0.0%) | 78 (100.0%) |
| 3 or 4 Unit Apartments | 10 (52.6%) | 9 (47.4%) |
| 5 to 9 Unit Apartments | 0 (0.0%) | 0 (0.0%) |
| 10 or more Apartments | 0 (0.0%) | 47 (100.0%) |
| Mobile Home / Other | 0 (0.0%) | 0 (0.0%) |
| Total | 177 (22.8%) | 598 (77.2%) |
Housing Structures by Number of Rooms in Grissom AFB
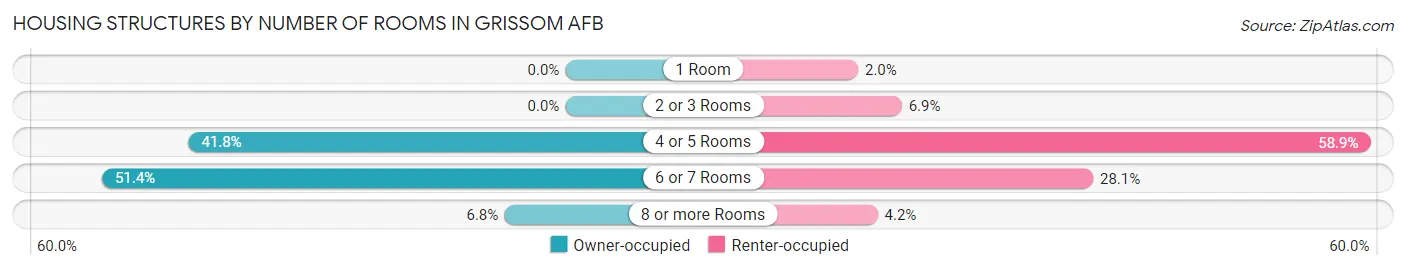
| Number of Rooms | Owner-occupied | Renter-occupied |
| 1 Room | 0 (0.0%) | 12 (2.0%) |
| 2 or 3 Rooms | 0 (0.0%) | 41 (6.9%) |
| 4 or 5 Rooms | 74 (41.8%) | 352 (58.9%) |
| 6 or 7 Rooms | 91 (51.4%) | 168 (28.1%) |
| 8 or more Rooms | 12 (6.8%) | 25 (4.2%) |
| Total | 177 (100.0%) | 598 (100.0%) |
Housing Structure by Heating Type in Grissom AFB
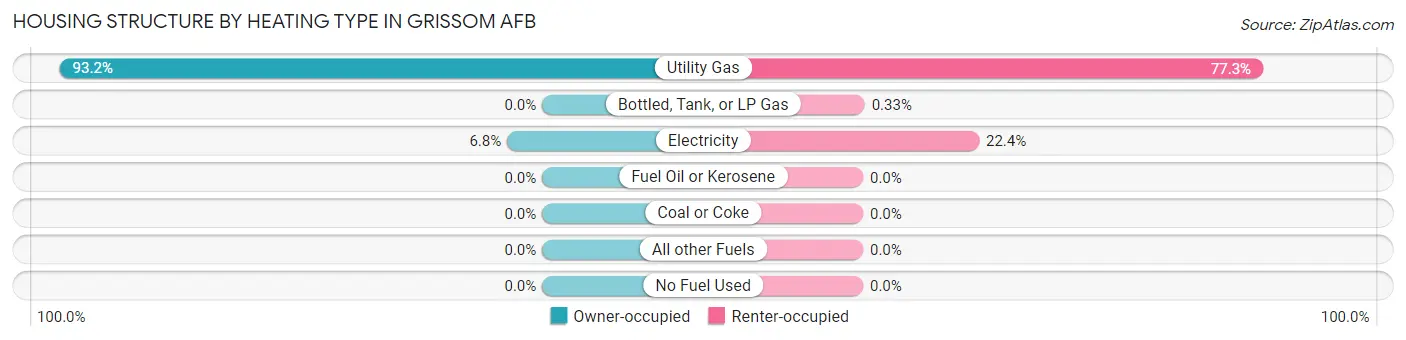
| Heating Type | Owner-occupied | Renter-occupied |
| Utility Gas | 165 (93.2%) | 462 (77.3%) |
| Bottled, Tank, or LP Gas | 0 (0.0%) | 2 (0.3%) |
| Electricity | 12 (6.8%) | 134 (22.4%) |
| Fuel Oil or Kerosene | 0 (0.0%) | 0 (0.0%) |
| Coal or Coke | 0 (0.0%) | 0 (0.0%) |
| All other Fuels | 0 (0.0%) | 0 (0.0%) |
| No Fuel Used | 0 (0.0%) | 0 (0.0%) |
| Total | 177 (100.0%) | 598 (100.0%) |
Household Vehicle Usage in Grissom AFB
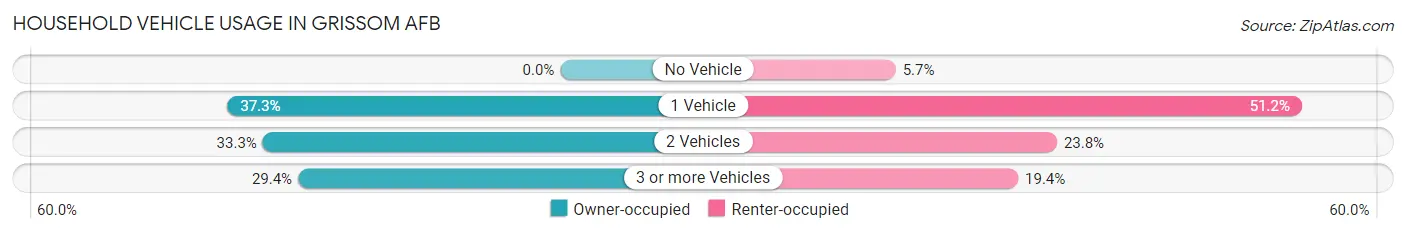
| Vehicles per Household | Owner-occupied | Renter-occupied |
| No Vehicle | 0 (0.0%) | 34 (5.7%) |
| 1 Vehicle | 66 (37.3%) | 306 (51.2%) |
| 2 Vehicles | 59 (33.3%) | 142 (23.7%) |
| 3 or more Vehicles | 52 (29.4%) | 116 (19.4%) |
| Total | 177 (100.0%) | 598 (100.0%) |
Real Estate & Mortgages in Grissom AFB
Real Estate and Mortgage Overview in Grissom AFB
| Characteristic | Without Mortgage | With Mortgage |
| Housing Units | 41 | 136 |
| Median Property Value | $46,800 | $81,900 |
| Median Household Income | - | - |
| Monthly Housing Costs | $254 | $0 |
| Real Estate Taxes | $199 | $22 |
Property Value by Mortgage Status in Grissom AFB
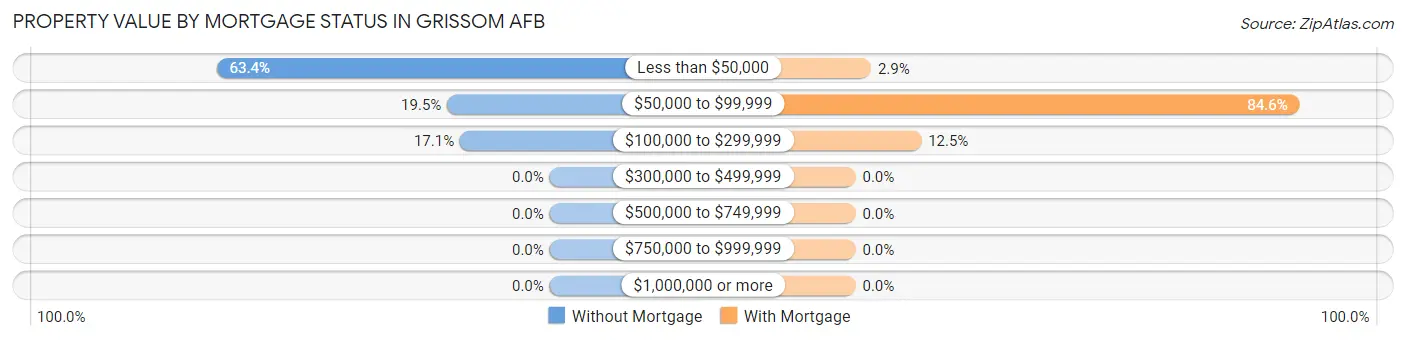
| Property Value | Without Mortgage | With Mortgage |
| Less than $50,000 | 26 (63.4%) | 4 (2.9%) |
| $50,000 to $99,999 | 8 (19.5%) | 115 (84.6%) |
| $100,000 to $299,999 | 7 (17.1%) | 17 (12.5%) |
| $300,000 to $499,999 | 0 (0.0%) | 0 (0.0%) |
| $500,000 to $749,999 | 0 (0.0%) | 0 (0.0%) |
| $750,000 to $999,999 | 0 (0.0%) | 0 (0.0%) |
| $1,000,000 or more | 0 (0.0%) | 0 (0.0%) |
| Total | 41 (100.0%) | 136 (100.0%) |
Household Income by Mortgage Status in Grissom AFB
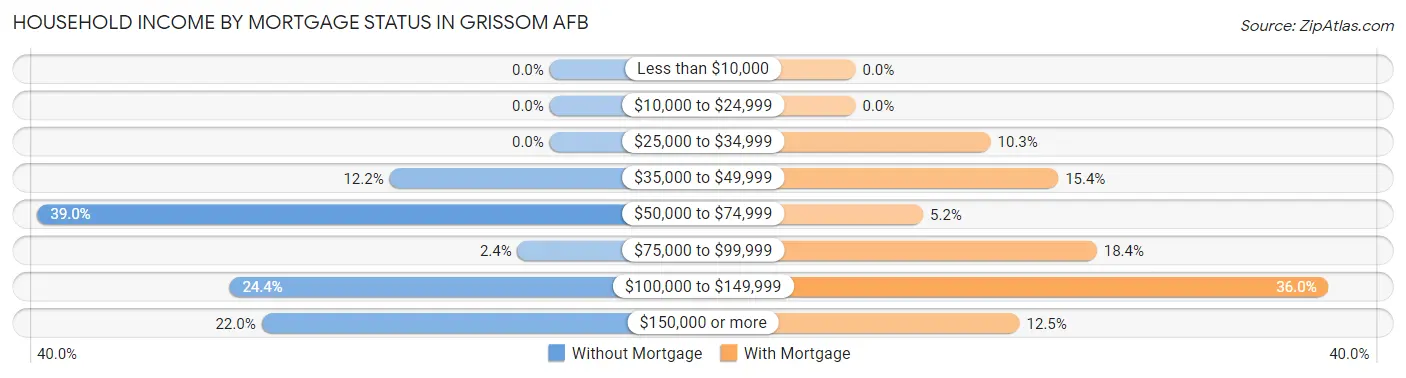
| Household Income | Without Mortgage | With Mortgage |
| Less than $10,000 | 0 (0.0%) | 0 (0.0%) |
| $10,000 to $24,999 | 0 (0.0%) | 0 (0.0%) |
| $25,000 to $34,999 | 0 (0.0%) | 14 (10.3%) |
| $35,000 to $49,999 | 5 (12.2%) | 21 (15.4%) |
| $50,000 to $74,999 | 16 (39.0%) | 7 (5.1%) |
| $75,000 to $99,999 | 1 (2.4%) | 25 (18.4%) |
| $100,000 to $149,999 | 10 (24.4%) | 49 (36.0%) |
| $150,000 or more | 9 (22.0%) | 17 (12.5%) |
| Total | 41 (100.0%) | 136 (100.0%) |
Property Value to Household Income Ratio in Grissom AFB
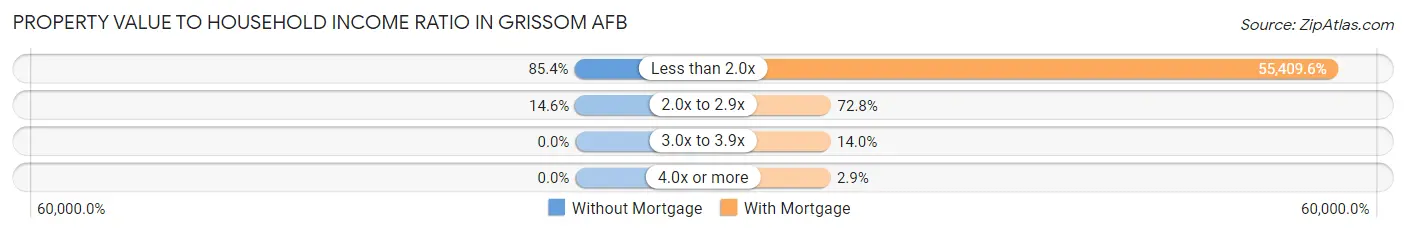
| Value-to-Income Ratio | Without Mortgage | With Mortgage |
| Less than 2.0x | 35 (85.4%) | 75,357 (55,409.6%) |
| 2.0x to 2.9x | 6 (14.6%) | 99 (72.8%) |
| 3.0x to 3.9x | 0 (0.0%) | 19 (14.0%) |
| 4.0x or more | 0 (0.0%) | 4 (2.9%) |
| Total | 41 (100.0%) | 136 (100.0%) |
Real Estate Taxes by Mortgage Status in Grissom AFB
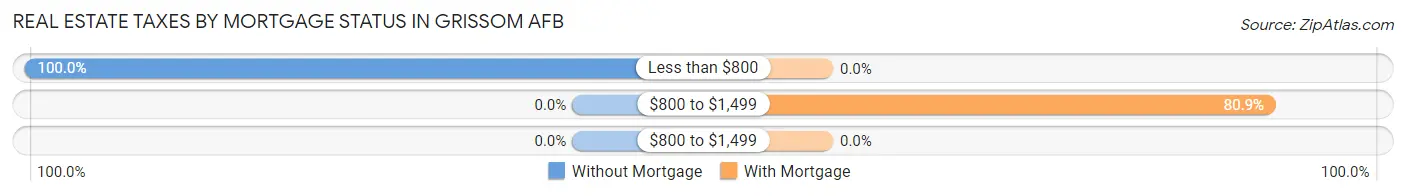
| Property Taxes | Without Mortgage | With Mortgage |
| Less than $800 | 41 (100.0%) | 0 (0.0%) |
| $800 to $1,499 | 0 (0.0%) | 110 (80.9%) |
| $800 to $1,499 | 0 (0.0%) | 0 (0.0%) |
| Total | 41 (100.0%) | 136 (100.0%) |
Health & Disability in Grissom AFB
Health Insurance Coverage by Age in Grissom AFB
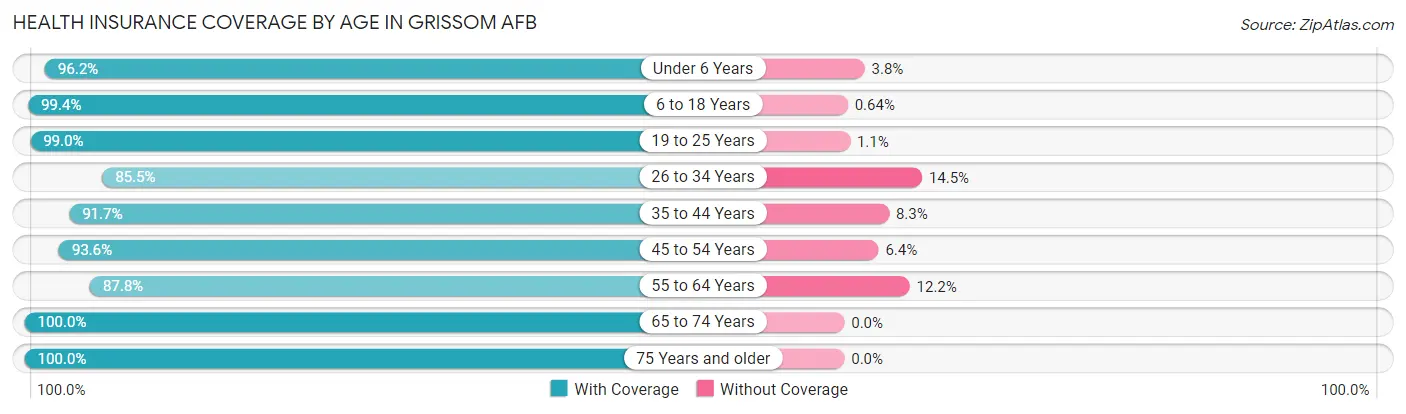
| Age Bracket | With Coverage | Without Coverage |
| Under 6 Years | 203 (96.2%) | 8 (3.8%) |
| 6 to 18 Years | 621 (99.4%) | 4 (0.6%) |
| 19 to 25 Years | 378 (99.0%) | 4 (1.1%) |
| 26 to 34 Years | 307 (85.5%) | 52 (14.5%) |
| 35 to 44 Years | 286 (91.7%) | 26 (8.3%) |
| 45 to 54 Years | 220 (93.6%) | 15 (6.4%) |
| 55 to 64 Years | 173 (87.8%) | 24 (12.2%) |
| 65 to 74 Years | 125 (100.0%) | 0 (0.0%) |
| 75 Years and older | 81 (100.0%) | 0 (0.0%) |
| Total | 2,394 (94.7%) | 133 (5.3%) |
Health Insurance Coverage by Citizenship Status in Grissom AFB
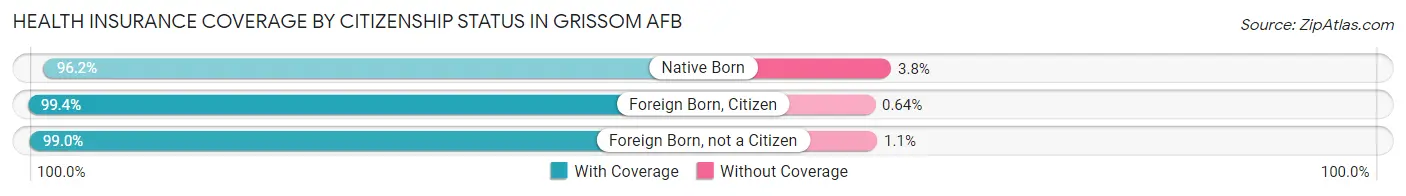
| Citizenship Status | With Coverage | Without Coverage |
| Native Born | 203 (96.2%) | 8 (3.8%) |
| Foreign Born, Citizen | 621 (99.4%) | 4 (0.6%) |
| Foreign Born, not a Citizen | 378 (99.0%) | 4 (1.1%) |
Health Insurance Coverage by Household Income in Grissom AFB
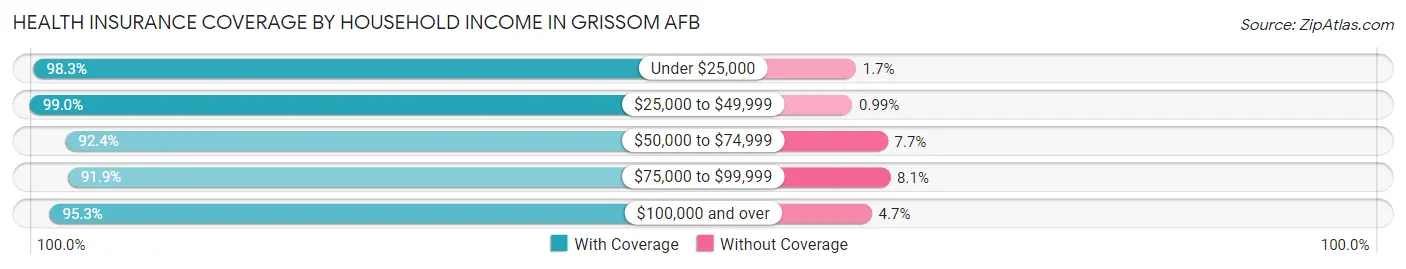
| Household Income | With Coverage | Without Coverage |
| Under $25,000 | 351 (98.3%) | 6 (1.7%) |
| $25,000 to $49,999 | 400 (99.0%) | 4 (1.0%) |
| $50,000 to $74,999 | 362 (92.3%) | 30 (7.6%) |
| $75,000 to $99,999 | 769 (91.9%) | 68 (8.1%) |
| $100,000 and over | 512 (95.3%) | 25 (4.7%) |
Public vs Private Health Insurance Coverage by Age in Grissom AFB
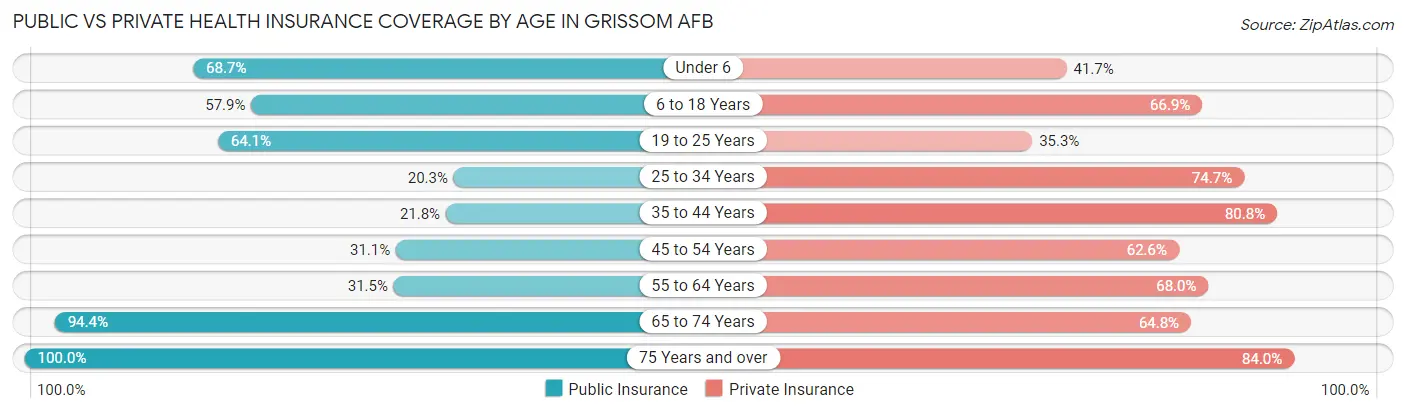
| Age Bracket | Public Insurance | Private Insurance |
| Under 6 | 145 (68.7%) | 88 (41.7%) |
| 6 to 18 Years | 362 (57.9%) | 418 (66.9%) |
| 19 to 25 Years | 245 (64.1%) | 135 (35.3%) |
| 25 to 34 Years | 73 (20.3%) | 268 (74.7%) |
| 35 to 44 Years | 68 (21.8%) | 252 (80.8%) |
| 45 to 54 Years | 73 (31.1%) | 147 (62.5%) |
| 55 to 64 Years | 62 (31.5%) | 134 (68.0%) |
| 65 to 74 Years | 118 (94.4%) | 81 (64.8%) |
| 75 Years and over | 81 (100.0%) | 68 (84.0%) |
| Total | 1,227 (48.6%) | 1,591 (63.0%) |
Disability Status by Sex by Age in Grissom AFB
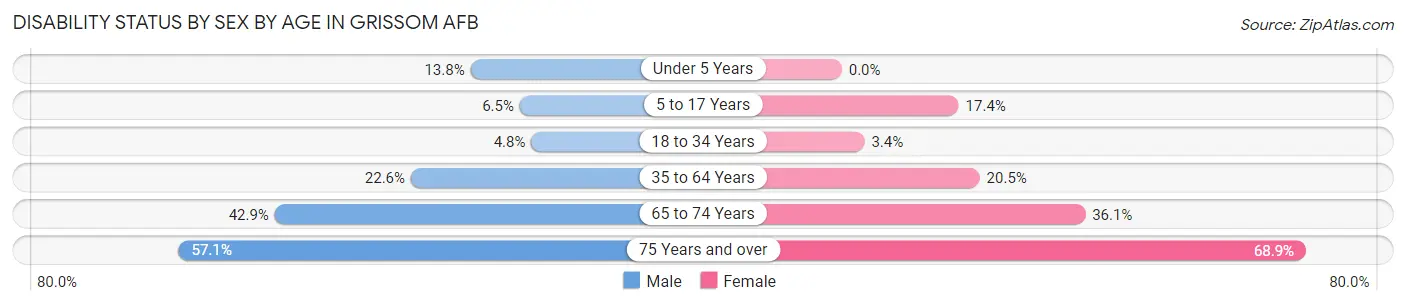
| Age Bracket | Male | Female |
| Under 5 Years | 12 (13.8%) | 0 (0.0%) |
| 5 to 17 Years | 27 (6.5%) | 34 (17.3%) |
| 18 to 34 Years | 20 (4.8%) | 13 (3.4%) |
| 35 to 64 Years | 91 (22.6%) | 70 (20.5%) |
| 65 to 74 Years | 18 (42.9%) | 30 (36.1%) |
| 75 Years and over | 4 (57.1%) | 51 (68.9%) |
Disability Class by Sex by Age in Grissom AFB
Disability Class: Hearing Difficulty
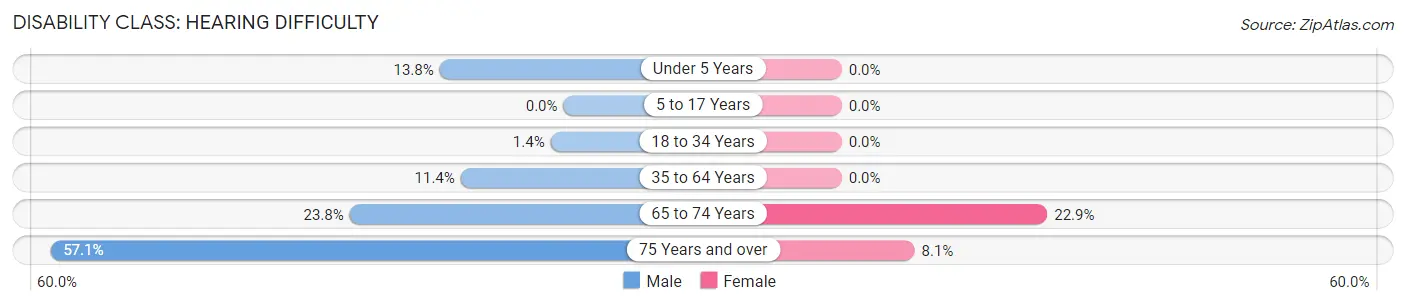
| Age Bracket | Male | Female |
| Under 5 Years | 12 (13.8%) | 0 (0.0%) |
| 5 to 17 Years | 0 (0.0%) | 0 (0.0%) |
| 18 to 34 Years | 6 (1.4%) | 0 (0.0%) |
| 35 to 64 Years | 46 (11.4%) | 0 (0.0%) |
| 65 to 74 Years | 10 (23.8%) | 19 (22.9%) |
| 75 Years and over | 4 (57.1%) | 6 (8.1%) |
Disability Class: Vision Difficulty
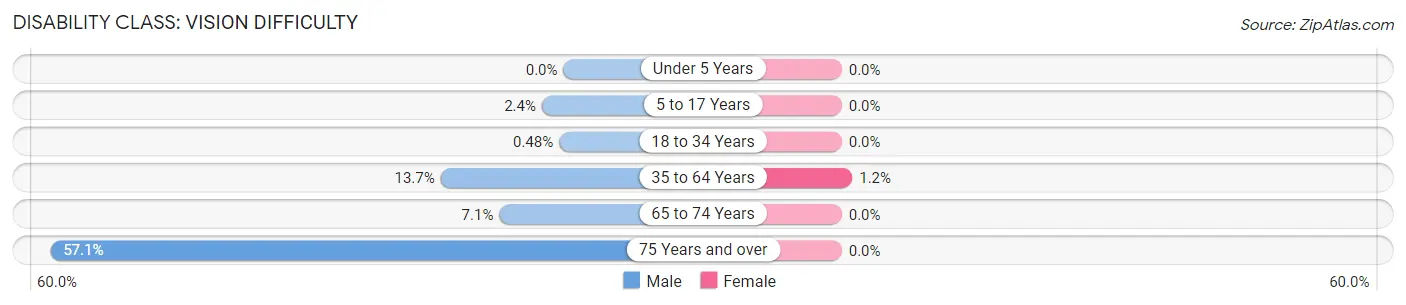
| Age Bracket | Male | Female |
| Under 5 Years | 0 (0.0%) | 0 (0.0%) |
| 5 to 17 Years | 10 (2.4%) | 0 (0.0%) |
| 18 to 34 Years | 2 (0.5%) | 0 (0.0%) |
| 35 to 64 Years | 55 (13.7%) | 4 (1.2%) |
| 65 to 74 Years | 3 (7.1%) | 0 (0.0%) |
| 75 Years and over | 4 (57.1%) | 0 (0.0%) |
Disability Class: Cognitive Difficulty
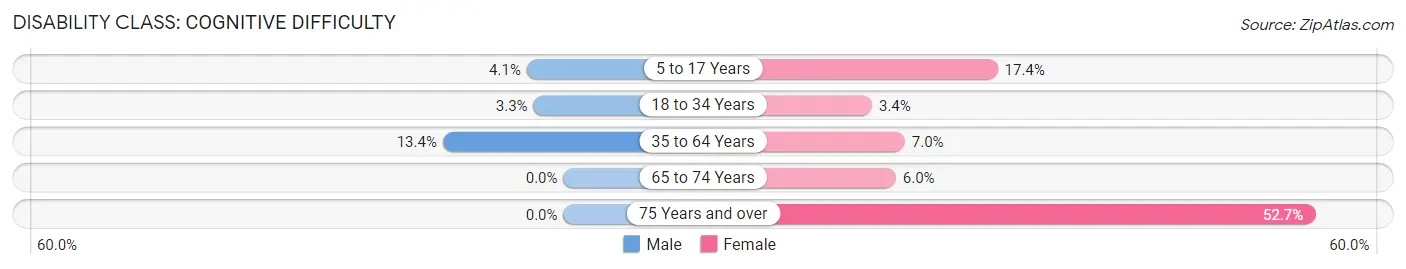
| Age Bracket | Male | Female |
| 5 to 17 Years | 17 (4.1%) | 34 (17.3%) |
| 18 to 34 Years | 14 (3.3%) | 13 (3.4%) |
| 35 to 64 Years | 54 (13.4%) | 24 (7.0%) |
| 65 to 74 Years | 0 (0.0%) | 5 (6.0%) |
| 75 Years and over | 0 (0.0%) | 39 (52.7%) |
Disability Class: Ambulatory Difficulty
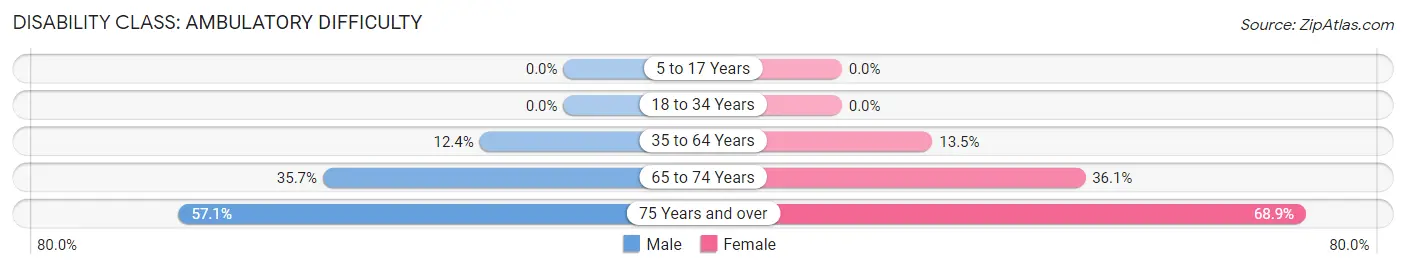
| Age Bracket | Male | Female |
| 5 to 17 Years | 0 (0.0%) | 0 (0.0%) |
| 18 to 34 Years | 0 (0.0%) | 0 (0.0%) |
| 35 to 64 Years | 50 (12.4%) | 46 (13.5%) |
| 65 to 74 Years | 15 (35.7%) | 30 (36.1%) |
| 75 Years and over | 4 (57.1%) | 51 (68.9%) |
Disability Class: Self-Care Difficulty
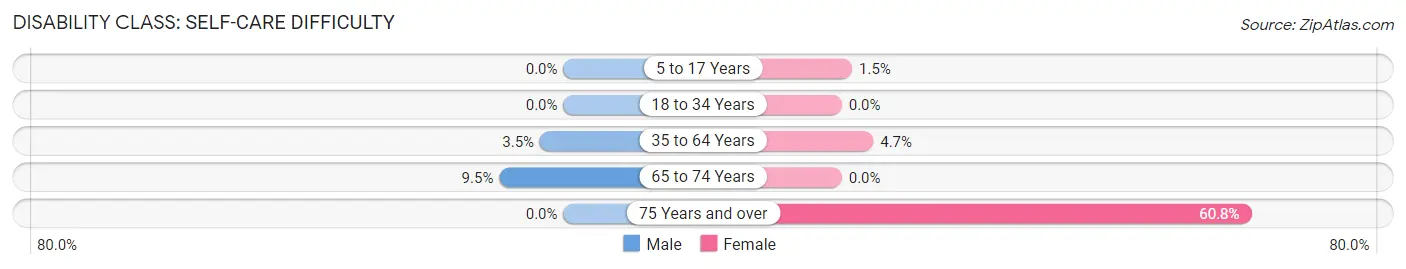
| Age Bracket | Male | Female |
| 5 to 17 Years | 0 (0.0%) | 3 (1.5%) |
| 18 to 34 Years | 0 (0.0%) | 0 (0.0%) |
| 35 to 64 Years | 14 (3.5%) | 16 (4.7%) |
| 65 to 74 Years | 4 (9.5%) | 0 (0.0%) |
| 75 Years and over | 0 (0.0%) | 45 (60.8%) |
Technology Access in Grissom AFB
Computing Device Access in Grissom AFB
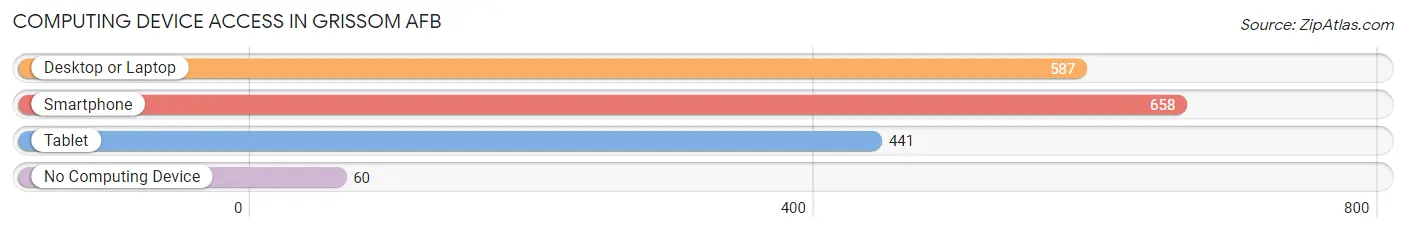
| Device Type | # Households | % Households |
| Desktop or Laptop | 587 | 75.7% |
| Smartphone | 658 | 84.9% |
| Tablet | 441 | 56.9% |
| No Computing Device | 60 | 7.7% |
| Total | 775 | 100.0% |
Internet Access in Grissom AFB
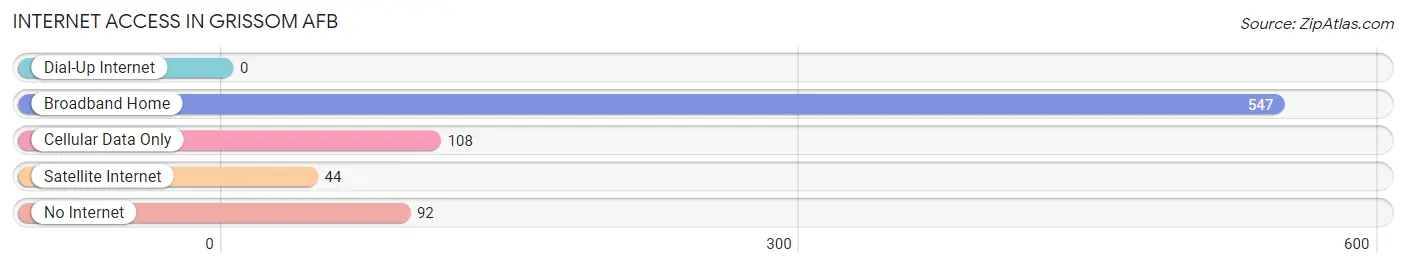
| Internet Type | # Households | % Households |
| Dial-Up Internet | 0 | 0.0% |
| Broadband Home | 547 | 70.6% |
| Cellular Data Only | 108 | 13.9% |
| Satellite Internet | 44 | 5.7% |
| No Internet | 92 | 11.9% |
| Total | 775 | 100.0% |
Grissom AFB Summary
Grissom Air Force Base (AFB) is located in Miami County, Indiana, approximately 12 miles north of Kokomo. It is a joint-use civil airport and military installation, and is home to the 434th Air Refueling Wing of the Air Force Reserve Command. The base is named after Virgil I. "Gus" Grissom, a native of Mitchell, Indiana, and one of the original seven Mercury astronauts.
History
Grissom AFB was originally established in 1942 as the Bunker Hill Naval Air Station. It was renamed Grissom AFB in 1968, in honor of Virgil I. "Gus" Grissom, a native of Mitchell, Indiana, and one of the original seven Mercury astronauts. The base was home to the 434th Air Refueling Wing of the Air Force Reserve Command until its closure in 1994.
Geography
Grissom AFB is located in Miami County, Indiana, approximately 12 miles north of Kokomo. The base is situated on approximately 3,000 acres of land, and is bordered by the cities of Peru, Bunker Hill, and Grissom. The base is located in a rural area, and is surrounded by farmland and wooded areas.
Economy
Grissom AFB was a major economic driver for the region prior to its closure in 1994. The base employed over 4,000 military and civilian personnel, and had an annual payroll of over $100 million. The base also had a significant impact on the local economy through its purchases of goods and services, and its support of local businesses.
Since its closure, Grissom AFB has been redeveloped as a joint-use civil airport and military installation. The base is now home to the Grissom Air Reserve Base, which is home to the 434th Air Refueling Wing of the Air Force Reserve Command. The base also houses the Grissom Aeroplex, which is a business park that is home to over 50 businesses. The base also serves as a major economic driver for the region, providing jobs and economic activity to the local community.
Demographics
As of the 2010 census, the population of Grissom AFB was 1,845. The racial makeup of the base was 94.3% White, 1.7% African American, 0.3% Native American, 0.7% Asian, 0.1% Pacific Islander, 1.2% from other races, and 1.9% from two or more races. Hispanic or Latino of any race were 3.2% of the population.
The median household income at Grissom AFB was $45,938, and the median family income was $50,938. The per capita income was $20,938. About 8.3% of families and 10.2% of the population were below the poverty line, including 14.3% of those under age 18 and none of those age 65 or over.
Conclusion
Grissom AFB is a joint-use civil airport and military installation located in Miami County, Indiana. The base is named after Virgil I. "Gus" Grissom, a native of Mitchell, Indiana, and one of the original seven Mercury astronauts. The base was originally established in 1942 as the Bunker Hill Naval Air Station, and was renamed Grissom AFB in 1968. The base was home to the 434th Air Refueling Wing of the Air Force Reserve Command until its closure in 1994. Since its closure, Grissom AFB has been redeveloped as a joint-use civil airport and military installation. The base is now home to the Grissom Air Reserve Base, which is home to the 434th Air Refueling Wing of the Air Force Reserve Command, and the Grissom Aeroplex, which is a business park that is home to over 50 businesses. The base serves as a major economic driver for the region, providing jobs and economic activity to the local community. As of the 2010 census, the population of Grissom AFB was 1,845. The racial makeup of the base was 94.3% White, 1.7% African American, 0.3% Native American, 0.7% Asian, 0.1% Pacific Islander, 1.2% from other races, and 1.9% from two or more races. Hispanic or Latino of any race were 3.2% of the population. The median household income at Grissom AFB was $45,938, and the median family income was $50,938. The per capita income was $20,938. About 8.3% of families and 10.2% of the population were below the poverty line, including 14.3% of those under age 18 and none of those age 65 or over.
Common Questions
What is Per Capita Income in Grissom AFB?
Per Capita income in Grissom AFB is $22,199.
What is the Median Family Income in Grissom AFB?
Median Family Income in Grissom AFB is $61,250.
What is the Median Household income in Grissom AFB?
Median Household Income in Grissom AFB is $53,542.
What is Income or Wage Gap in Grissom AFB?
Income or Wage Gap in Grissom AFB is 38.8%.
Women in Grissom AFB earn 61.2 cents for every dollar earned by a man.
What is Inequality or Gini Index in Grissom AFB?
Inequality or Gini Index in Grissom AFB is 0.35.
What is the Total Population of Grissom AFB?
Total Population of Grissom AFB is 2,619.
What is the Total Male Population of Grissom AFB?
Total Male Population of Grissom AFB is 1,410.
What is the Total Female Population of Grissom AFB?
Total Female Population of Grissom AFB is 1,209.
What is the Ratio of Males per 100 Females in Grissom AFB?
There are 116.63 Males per 100 Females in Grissom AFB.
What is the Ratio of Females per 100 Males in Grissom AFB?
There are 85.74 Females per 100 Males in Grissom AFB.
What is the Median Population Age in Grissom AFB?
Median Population Age in Grissom AFB is 28.5 Years.
What is the Average Family Size in Grissom AFB
Average Family Size in Grissom AFB is 3.9 People.
What is the Average Household Size in Grissom AFB
Average Household Size in Grissom AFB is 3.3 People.
How Large is the Labor Force in Grissom AFB?
There are 1,240 People in the Labor Forcein in Grissom AFB.
What is the Percentage of People in the Labor Force in Grissom AFB?
64.3% of People are in the Labor Force in Grissom AFB.
What is the Unemployment Rate in Grissom AFB?
Unemployment Rate in Grissom AFB is 3.6%.