Gentryville, IN Map & Demographics
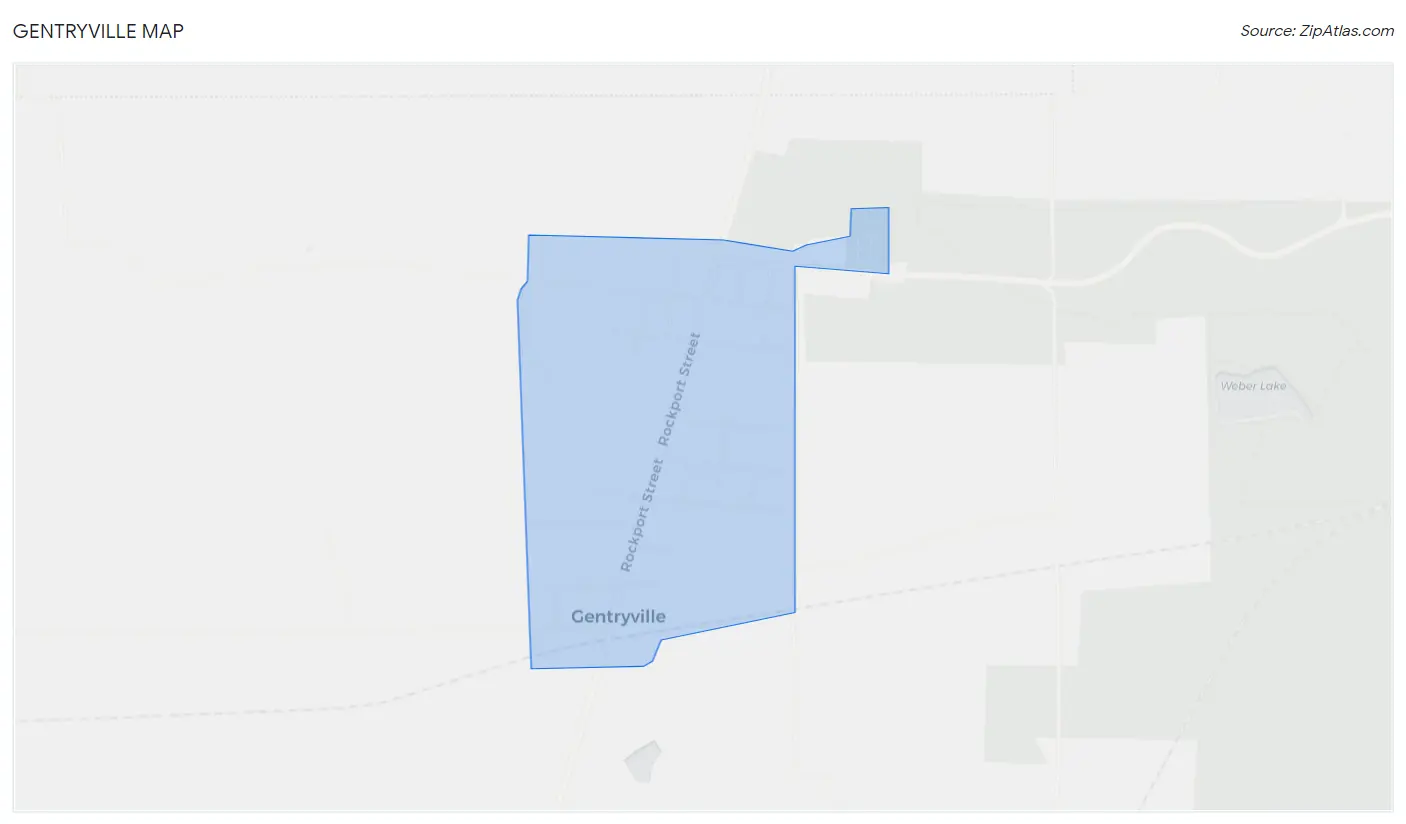
Gentryville Map
Gentryville Overview
$30,987
PER CAPITA INCOME
$62,000
AVG FAMILY INCOME
$46,901
AVG HOUSEHOLD INCOME
0.26
INEQUALITY / GINI INDEX
311
TOTAL POPULATION
160
MALE POPULATION
151
FEMALE POPULATION
105.96
MALES / 100 FEMALES
94.38
FEMALES / 100 MALES
57.7
MEDIAN AGE
2.9
AVG FAMILY SIZE
2.0
AVG HOUSEHOLD SIZE
100
LABOR FORCE [ PEOPLE ]
36.9%
PERCENT IN LABOR FORCE
6.0%
UNEMPLOYMENT RATE
Gentryville Zip Codes
Income in Gentryville
Income Overview in Gentryville
Per Capita Income in Gentryville is $30,987, while median incomes of families and households are $62,000 and $46,901 respectively.
| Characteristic | Number | Measure |
| Per Capita Income | 311 | $30,987 |
| Median Family Income | 74 | $62,000 |
| Mean Family Income | 74 | $68,070 |
| Median Household Income | 159 | $46,901 |
| Mean Household Income | 159 | $57,507 |
| Income Deficit | 74 | $0 |
| Wage / Income Gap (%) | 311 | 0.00% |
| Wage / Income Gap ($) | 311 | 100.00¢ per $1 |
| Gini / Inequality Index | 311 | 0.26 |
Earnings by Sex in Gentryville
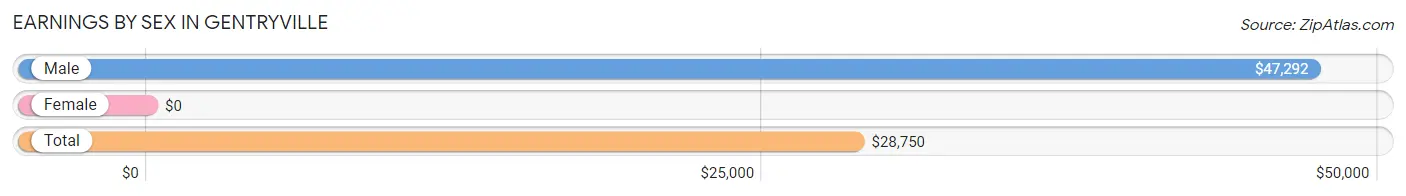
| Sex | Number | Average Earnings |
| Male | 43 (37.7%) | $47,292 |
| Female | 71 (62.3%) | $0 |
| Total | 114 (100.0%) | $28,750 |
Earnings by Sex by Income Bracket in Gentryville
The most common earnings brackets in Gentryville are $45,000 to $49,999 for men (8 | 18.6%) and $5,000 to $7,499 for women (15 | 21.1%).
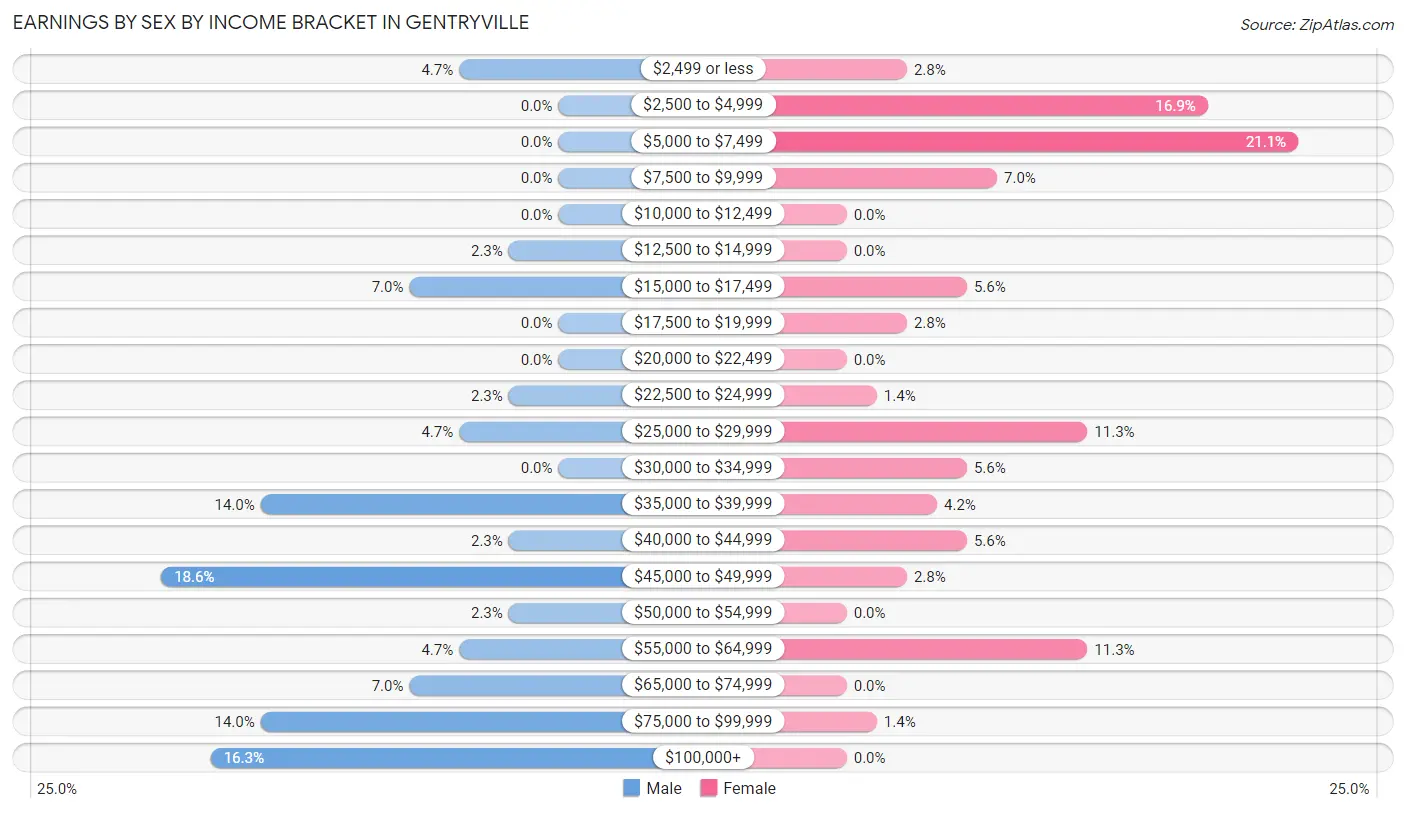
| Income | Male | Female |
| $2,499 or less | 2 (4.6%) | 2 (2.8%) |
| $2,500 to $4,999 | 0 (0.0%) | 12 (16.9%) |
| $5,000 to $7,499 | 0 (0.0%) | 15 (21.1%) |
| $7,500 to $9,999 | 0 (0.0%) | 5 (7.0%) |
| $10,000 to $12,499 | 0 (0.0%) | 0 (0.0%) |
| $12,500 to $14,999 | 1 (2.3%) | 0 (0.0%) |
| $15,000 to $17,499 | 3 (7.0%) | 4 (5.6%) |
| $17,500 to $19,999 | 0 (0.0%) | 2 (2.8%) |
| $20,000 to $22,499 | 0 (0.0%) | 0 (0.0%) |
| $22,500 to $24,999 | 1 (2.3%) | 1 (1.4%) |
| $25,000 to $29,999 | 2 (4.6%) | 8 (11.3%) |
| $30,000 to $34,999 | 0 (0.0%) | 4 (5.6%) |
| $35,000 to $39,999 | 6 (14.0%) | 3 (4.2%) |
| $40,000 to $44,999 | 1 (2.3%) | 4 (5.6%) |
| $45,000 to $49,999 | 8 (18.6%) | 2 (2.8%) |
| $50,000 to $54,999 | 1 (2.3%) | 0 (0.0%) |
| $55,000 to $64,999 | 2 (4.6%) | 8 (11.3%) |
| $65,000 to $74,999 | 3 (7.0%) | 0 (0.0%) |
| $75,000 to $99,999 | 6 (14.0%) | 1 (1.4%) |
| $100,000+ | 7 (16.3%) | 0 (0.0%) |
| Total | 43 (100.0%) | 71 (100.0%) |
Earnings by Sex by Educational Attainment in Gentryville
Average earnings in Gentryville are $47,292 for men and $33,750 for women, a difference of 28.6%. Men with an educational attainment of high school diploma enjoy the highest average annual earnings of $86,250, while those with college or associate's degree education earn the least with $46,667. Women with an educational attainment of bachelor's degree earn the most with the average annual earnings of $58,750, while those with high school diploma education have the smallest earnings of $27,031.
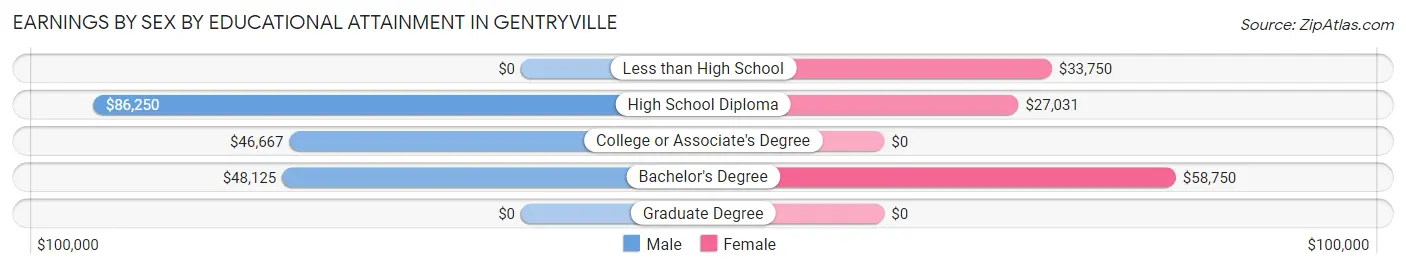
| Educational Attainment | Male Income | Female Income |
| Less than High School | - | - |
| High School Diploma | $86,250 | $27,031 |
| College or Associate's Degree | $46,667 | $0 |
| Bachelor's Degree | $48,125 | $58,750 |
| Graduate Degree | - | - |
| Total | $47,292 | $33,750 |
Family Income in Gentryville
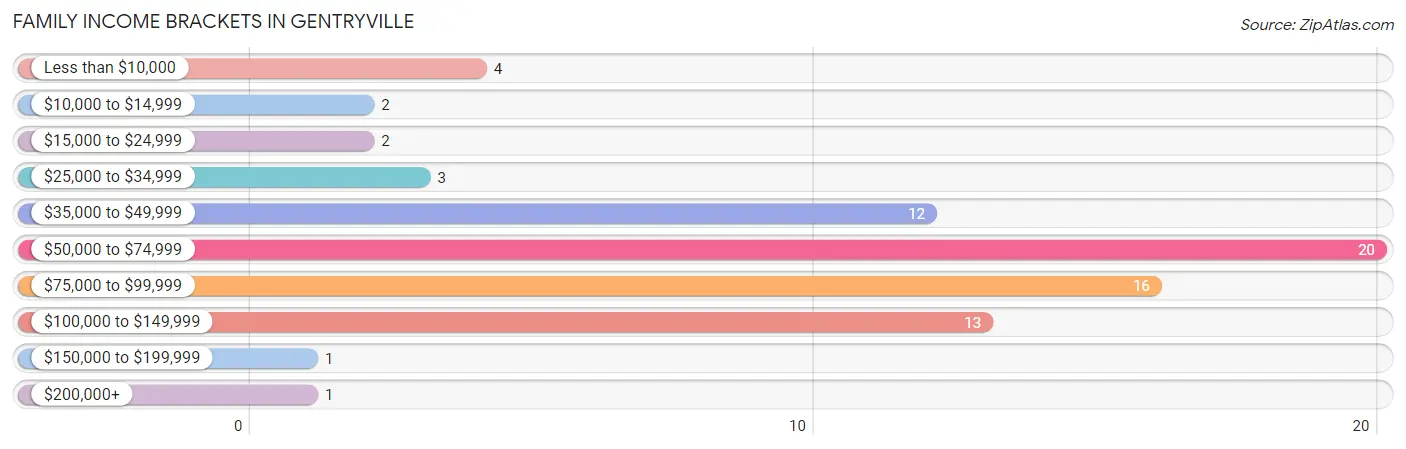
Family Income Brackets in Gentryville
According to the Gentryville family income data, there are 20 families falling into the $50,000 to $74,999 income range, which is the most common income bracket and makes up 27.0% of all families. Conversely, the $150,000 to $199,999 income bracket is the least frequent group with only 1 families (1.3%) belonging to this category.
| Income Bracket | # Families | % Families |
| Less than $10,000 | 4 | 5.4% |
| $10,000 to $14,999 | 2 | 2.7% |
| $15,000 to $24,999 | 2 | 2.7% |
| $25,000 to $34,999 | 3 | 4.1% |
| $35,000 to $49,999 | 12 | 16.2% |
| $50,000 to $74,999 | 20 | 27.0% |
| $75,000 to $99,999 | 16 | 21.6% |
| $100,000 to $149,999 | 13 | 17.6% |
| $150,000 to $199,999 | 1 | 1.4% |
| $200,000+ | 1 | 1.4% |
Family Income by Famaliy Size in Gentryville
4-person families (8 | 10.8%) account for the highest median family income in Gentryville with $101,667 per family, while 2-person families (39 | 52.7%) have the highest median income of $30,375 per family member.
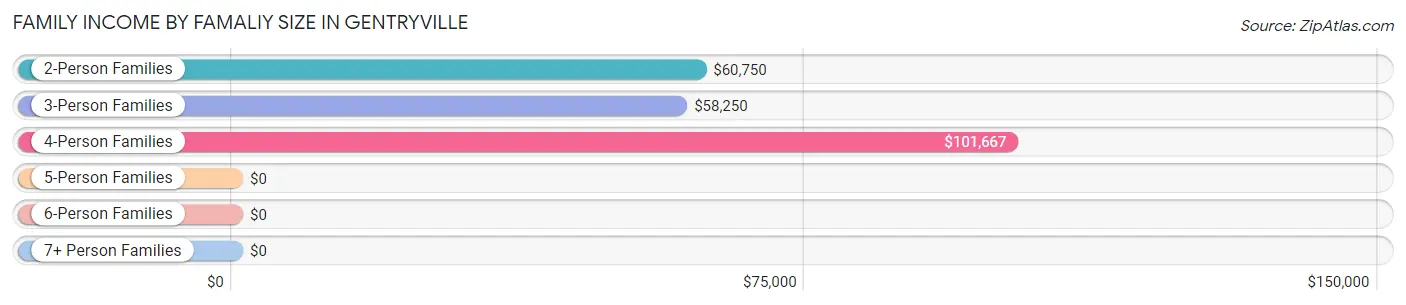
| Income Bracket | # Families | Median Income |
| 2-Person Families | 39 (52.7%) | $60,750 |
| 3-Person Families | 23 (31.1%) | $58,250 |
| 4-Person Families | 8 (10.8%) | $101,667 |
| 5-Person Families | 4 (5.4%) | $0 |
| 6-Person Families | 0 (0.0%) | $0 |
| 7+ Person Families | 0 (0.0%) | $0 |
| Total | 74 (100.0%) | $62,000 |
Family Income by Number of Earners in Gentryville
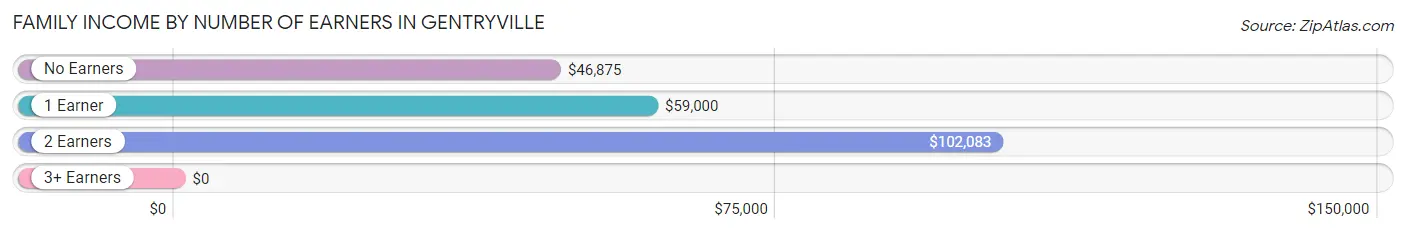
| Number of Earners | # Families | Median Income |
| No Earners | 15 (20.3%) | $46,875 |
| 1 Earner | 40 (54.0%) | $59,000 |
| 2 Earners | 16 (21.6%) | $102,083 |
| 3+ Earners | 3 (4.1%) | $0 |
| Total | 74 (100.0%) | $62,000 |
Household Income in Gentryville
Household Income Brackets in Gentryville
With 86 households falling in the category, the $35,000 to $49,999 income range is the most frequent in Gentryville, accounting for 54.1% of all households. In contrast, only 1 households (0.6%) fall into the $200,000+ income bracket, making it the least populous group.
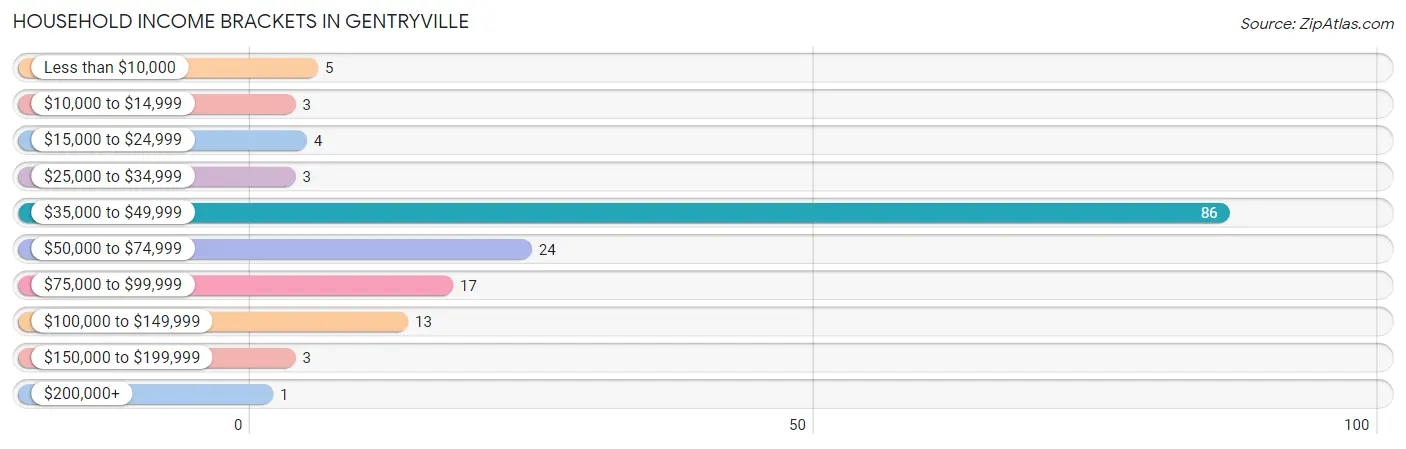
| Income Bracket | # Households | % Households |
| Less than $10,000 | 5 | 3.1% |
| $10,000 to $14,999 | 3 | 1.9% |
| $15,000 to $24,999 | 4 | 2.5% |
| $25,000 to $34,999 | 3 | 1.9% |
| $35,000 to $49,999 | 86 | 54.1% |
| $50,000 to $74,999 | 24 | 15.1% |
| $75,000 to $99,999 | 17 | 10.7% |
| $100,000 to $149,999 | 13 | 8.2% |
| $150,000 to $199,999 | 3 | 1.9% |
| $200,000+ | 1 | 0.6% |
Household Income by Householder Age in Gentryville
The median household income in Gentryville is $46,901, with the highest median household income of $75,313 found in the 45 to 64 years age bracket for the primary householder. A total of 41 households (25.8%) fall into this category. Meanwhile, the 15 to 24 years age bracket for the primary householder has the lowest median household income of $0, with 4 households (2.5%) in this group.
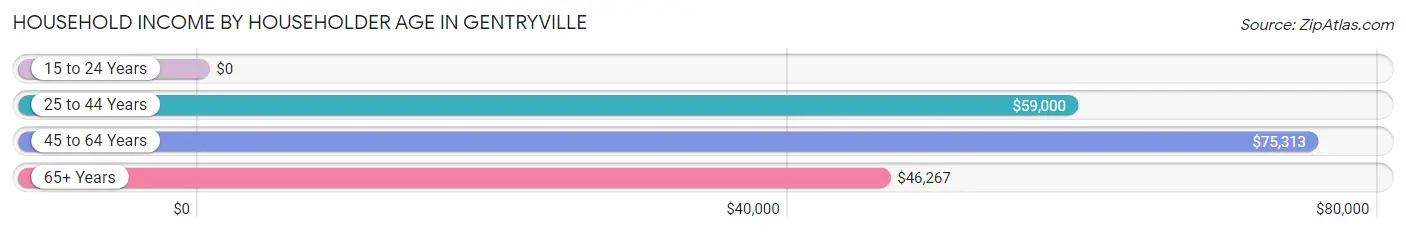
| Income Bracket | # Households | Median Income |
| 15 to 24 Years | 4 (2.5%) | $0 |
| 25 to 44 Years | 18 (11.3%) | $59,000 |
| 45 to 64 Years | 41 (25.8%) | $75,313 |
| 65+ Years | 96 (60.4%) | $46,267 |
| Total | 159 (100.0%) | $46,901 |
Poverty in Gentryville
Income Below Poverty by Sex and Age in Gentryville
With 3.1% poverty level for males and 10.6% for females among the residents of Gentryville, 15 year old males and 5 year old females are the most vulnerable to poverty, with 3 males (60.0%) and 4 females (100.0%) in their respective age groups living below the poverty level.
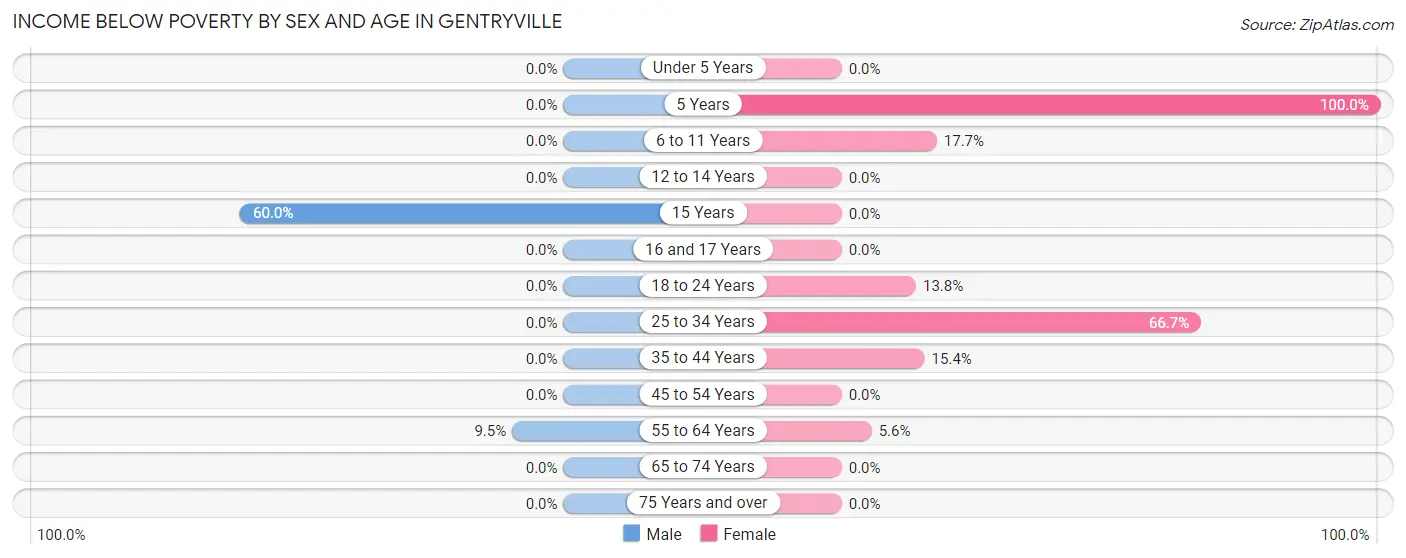
| Age Bracket | Male | Female |
| Under 5 Years | 0 (0.0%) | 0 (0.0%) |
| 5 Years | 0 (0.0%) | 4 (100.0%) |
| 6 to 11 Years | 0 (0.0%) | 3 (17.6%) |
| 12 to 14 Years | 0 (0.0%) | 0 (0.0%) |
| 15 Years | 3 (60.0%) | 0 (0.0%) |
| 16 and 17 Years | 0 (0.0%) | 0 (0.0%) |
| 18 to 24 Years | 0 (0.0%) | 4 (13.8%) |
| 25 to 34 Years | 0 (0.0%) | 2 (66.7%) |
| 35 to 44 Years | 0 (0.0%) | 2 (15.4%) |
| 45 to 54 Years | 0 (0.0%) | 0 (0.0%) |
| 55 to 64 Years | 2 (9.5%) | 1 (5.6%) |
| 65 to 74 Years | 0 (0.0%) | 0 (0.0%) |
| 75 Years and over | 0 (0.0%) | 0 (0.0%) |
| Total | 5 (3.1%) | 16 (10.6%) |
Income Above Poverty by Sex and Age in Gentryville
According to the poverty statistics in Gentryville, males aged 12 to 14 years and females aged under 5 years are the age groups that are most secure financially, with 100.0% of males and 100.0% of females in these age groups living above the poverty line.
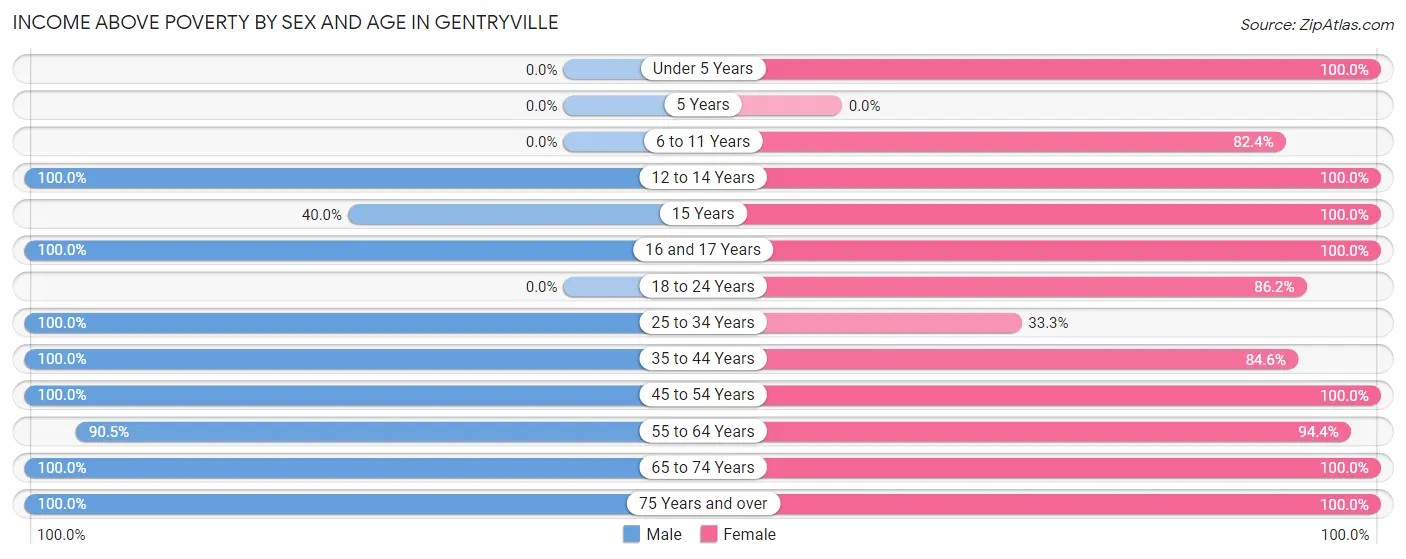
| Age Bracket | Male | Female |
| Under 5 Years | 0 (0.0%) | 8 (100.0%) |
| 5 Years | 0 (0.0%) | 0 (0.0%) |
| 6 to 11 Years | 0 (0.0%) | 14 (82.4%) |
| 12 to 14 Years | 2 (100.0%) | 2 (100.0%) |
| 15 Years | 2 (40.0%) | 2 (100.0%) |
| 16 and 17 Years | 5 (100.0%) | 2 (100.0%) |
| 18 to 24 Years | 0 (0.0%) | 25 (86.2%) |
| 25 to 34 Years | 8 (100.0%) | 1 (33.3%) |
| 35 to 44 Years | 13 (100.0%) | 11 (84.6%) |
| 45 to 54 Years | 14 (100.0%) | 21 (100.0%) |
| 55 to 64 Years | 19 (90.5%) | 17 (94.4%) |
| 65 to 74 Years | 90 (100.0%) | 16 (100.0%) |
| 75 Years and over | 2 (100.0%) | 16 (100.0%) |
| Total | 155 (96.9%) | 135 (89.4%) |
Income Below Poverty Among Married-Couple Families in Gentryville
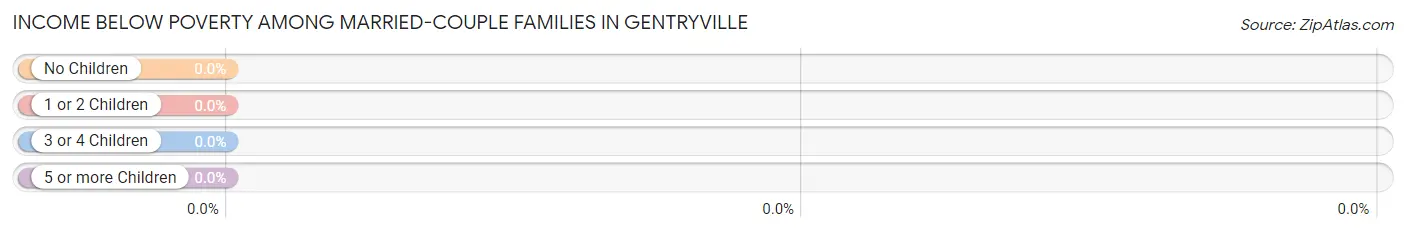
| Children | Above Poverty | Below Poverty |
| No Children | 37 (100.0%) | 0 (0.0%) |
| 1 or 2 Children | 7 (100.0%) | 0 (0.0%) |
| 3 or 4 Children | 4 (100.0%) | 0 (0.0%) |
| 5 or more Children | 0 (0.0%) | 0 (0.0%) |
| Total | 48 (100.0%) | 0 (0.0%) |
Income Below Poverty Among Single-Parent Households in Gentryville
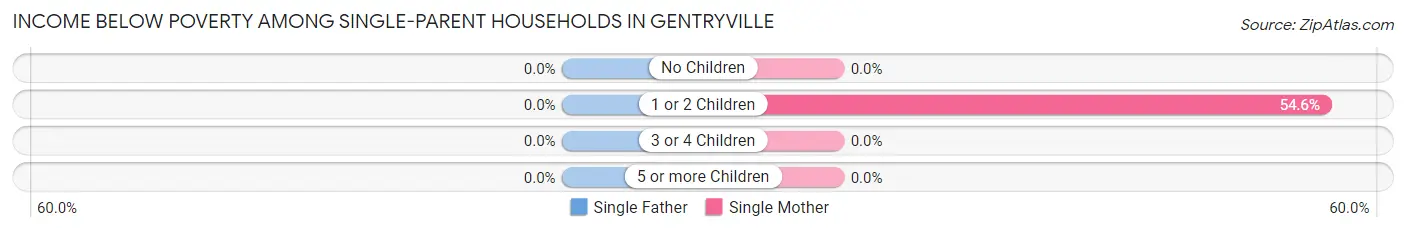
| Children | Single Father | Single Mother |
| No Children | 0 (0.0%) | 0 (0.0%) |
| 1 or 2 Children | 0 (0.0%) | 6 (54.5%) |
| 3 or 4 Children | 0 (0.0%) | 0 (0.0%) |
| 5 or more Children | 0 (0.0%) | 0 (0.0%) |
| Total | 0 (0.0%) | 6 (30.0%) |
Income Below Poverty Among Married-Couple vs Single-Parent Households in Gentryville
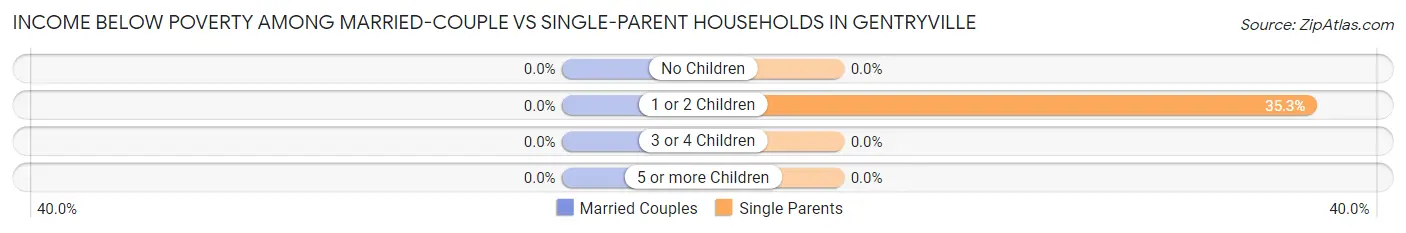
| Children | Married-Couple Families | Single-Parent Households |
| No Children | 0 (0.0%) | 0 (0.0%) |
| 1 or 2 Children | 0 (0.0%) | 6 (35.3%) |
| 3 or 4 Children | 0 (0.0%) | 0 (0.0%) |
| 5 or more Children | 0 (0.0%) | 0 (0.0%) |
| Total | 0 (0.0%) | 6 (23.1%) |
Race in Gentryville
The most populous races in Gentryville are , and White / Caucasian (311 | 100.0%).
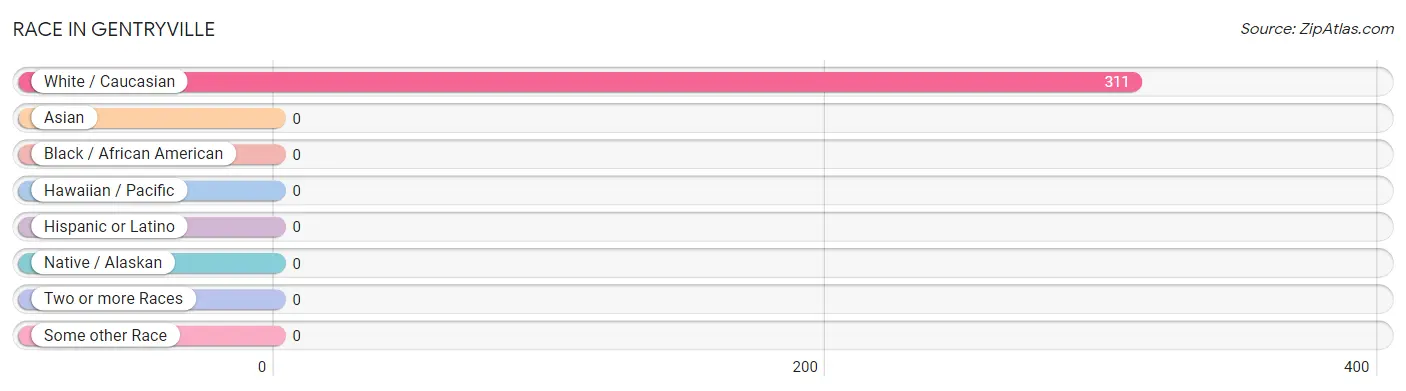
| Race | # Population | % Population |
| Asian | 0 | 0.0% |
| Black / African American | 0 | 0.0% |
| Hawaiian / Pacific | 0 | 0.0% |
| Hispanic or Latino | 0 | 0.0% |
| Native / Alaskan | 0 | 0.0% |
| White / Caucasian | 311 | 100.0% |
| Two or more Races | 0 | 0.0% |
| Some other Race | 0 | 0.0% |
| Total | 311 | 100.0% |
Ancestry in Gentryville
The most populous ancestries reported in Gentryville are Irish (171 | 55.0%), German (155 | 49.8%), English (65 | 20.9%), American (3 | 1.0%), and European (2 | 0.6%), together accounting for 127.3% of all Gentryville residents.
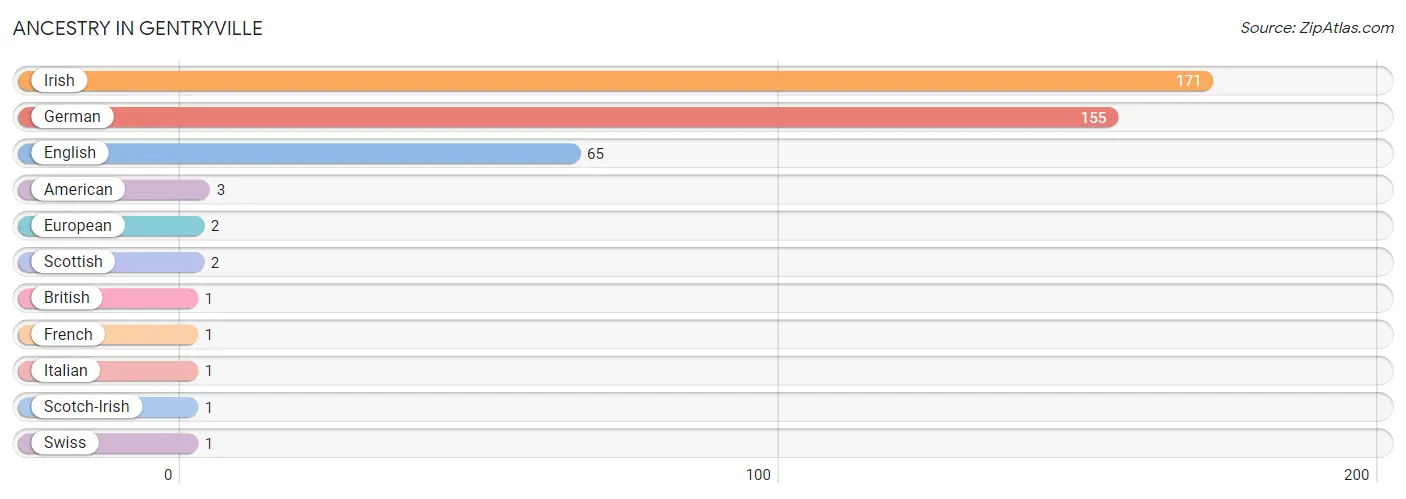
| Ancestry | # Population | % Population |
| American | 3 | 1.0% |
| British | 1 | 0.3% |
| English | 65 | 20.9% |
| European | 2 | 0.6% |
| French | 1 | 0.3% |
| German | 155 | 49.8% |
| Irish | 171 | 55.0% |
| Italian | 1 | 0.3% |
| Scotch-Irish | 1 | 0.3% |
| Scottish | 2 | 0.6% |
| Swiss | 1 | 0.3% | View All 11 Rows |
Immigrants in Gentryville

| Immigration Origin | # Population | % Population | View All 0 Rows |
Sex and Age in Gentryville
Sex and Age in Gentryville
The most populous age groups in Gentryville are 70 to 74 Years (85 | 53.1%) for men and 20 to 24 Years (24 | 15.9%) for women.
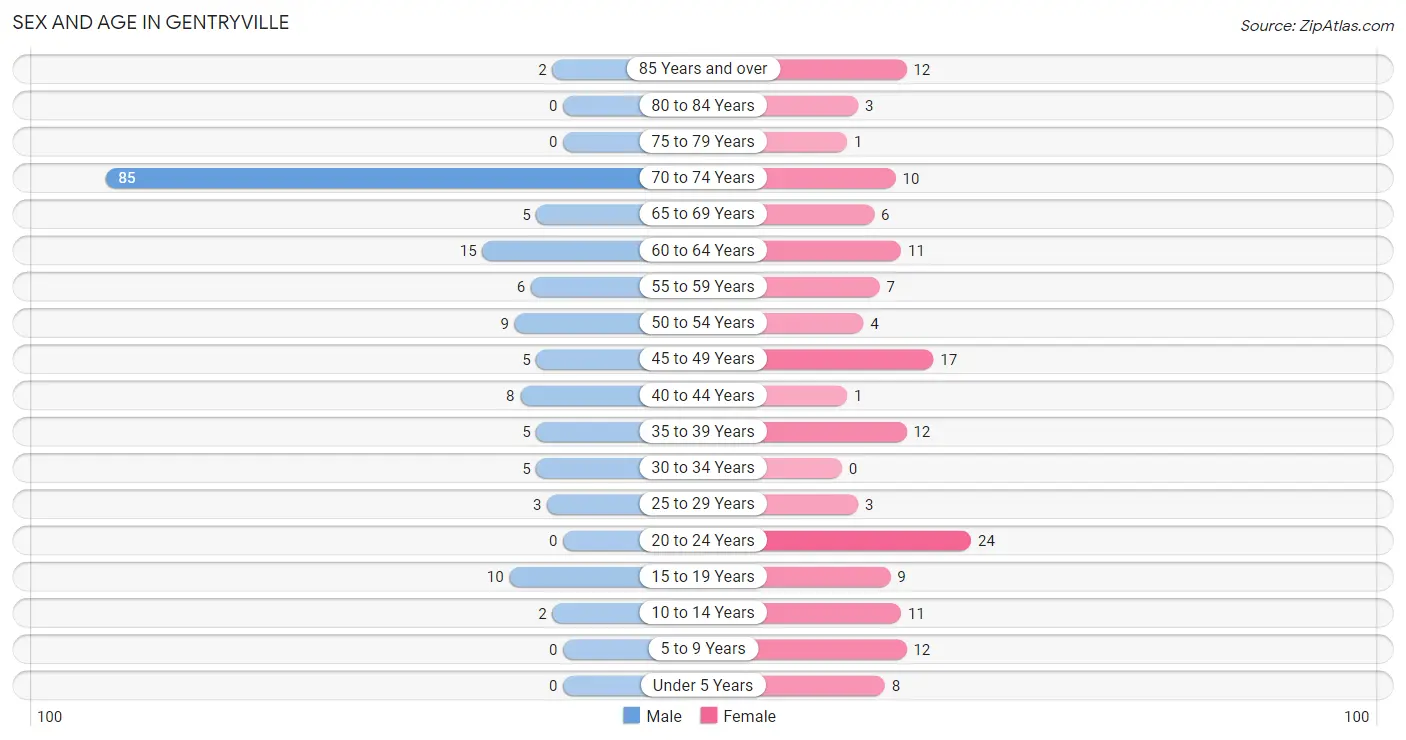
| Age Bracket | Male | Female |
| Under 5 Years | 0 (0.0%) | 8 (5.3%) |
| 5 to 9 Years | 0 (0.0%) | 12 (8.0%) |
| 10 to 14 Years | 2 (1.3%) | 11 (7.3%) |
| 15 to 19 Years | 10 (6.2%) | 9 (6.0%) |
| 20 to 24 Years | 0 (0.0%) | 24 (15.9%) |
| 25 to 29 Years | 3 (1.9%) | 3 (2.0%) |
| 30 to 34 Years | 5 (3.1%) | 0 (0.0%) |
| 35 to 39 Years | 5 (3.1%) | 12 (8.0%) |
| 40 to 44 Years | 8 (5.0%) | 1 (0.7%) |
| 45 to 49 Years | 5 (3.1%) | 17 (11.3%) |
| 50 to 54 Years | 9 (5.6%) | 4 (2.6%) |
| 55 to 59 Years | 6 (3.7%) | 7 (4.6%) |
| 60 to 64 Years | 15 (9.4%) | 11 (7.3%) |
| 65 to 69 Years | 5 (3.1%) | 6 (4.0%) |
| 70 to 74 Years | 85 (53.1%) | 10 (6.6%) |
| 75 to 79 Years | 0 (0.0%) | 1 (0.7%) |
| 80 to 84 Years | 0 (0.0%) | 3 (2.0%) |
| 85 Years and over | 2 (1.3%) | 12 (8.0%) |
| Total | 160 (100.0%) | 151 (100.0%) |
Families and Households in Gentryville
Median Family Size in Gentryville
The median family size in Gentryville is 2.92 persons per family, with married-couple families (48 | 64.9%) accounting for the largest median family size of 3.17 persons per family. On the other hand, single male/father families (6 | 8.1%) represent the smallest median family size with 2.17 persons per family.
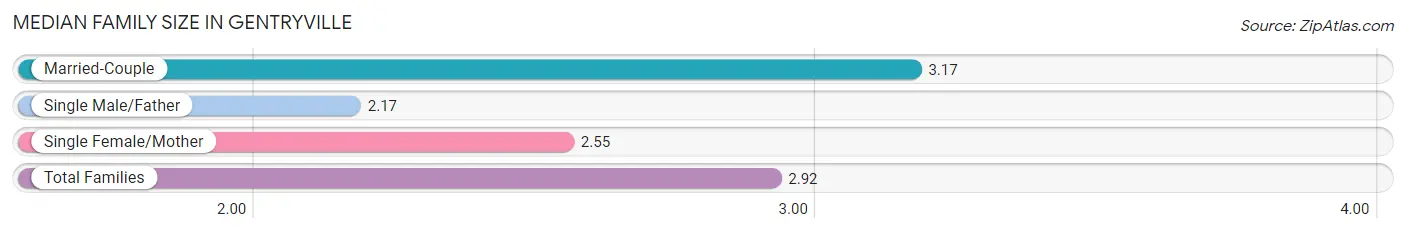
| Family Type | # Families | Family Size |
| Married-Couple | 48 (64.9%) | 3.17 |
| Single Male/Father | 6 (8.1%) | 2.17 |
| Single Female/Mother | 20 (27.0%) | 2.55 |
| Total Families | 74 (100.0%) | 2.92 |
Median Household Size in Gentryville
The median household size in Gentryville is 1.96 persons per household, with married-couple households (48 | 30.2%) accounting for the largest median household size of 3.17 persons per household. non-family households (85 | 53.5%) represent the smallest median household size with 1.07 persons per household.
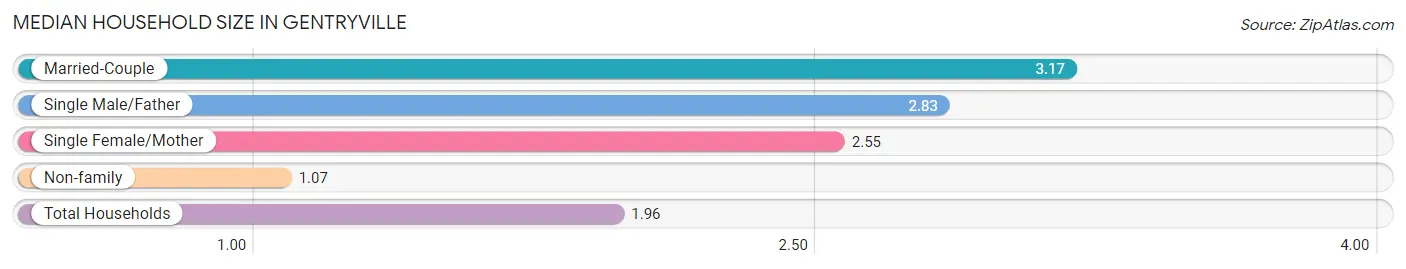
| Household Type | # Households | Household Size |
| Married-Couple | 48 (30.2%) | 3.17 |
| Single Male/Father | 6 (3.8%) | 2.83 |
| Single Female/Mother | 20 (12.6%) | 2.55 |
| Non-family | 85 (53.5%) | 1.07 |
| Total Households | 159 (100.0%) | 1.96 |
Household Size by Marriage Status in Gentryville
Out of a total of 159 households in Gentryville, 74 (46.5%) are family households, while 85 (53.5%) are nonfamily households. The most numerous type of family households are 2-person households, comprising 37, and the most common type of nonfamily households are 1-person households, comprising 80.
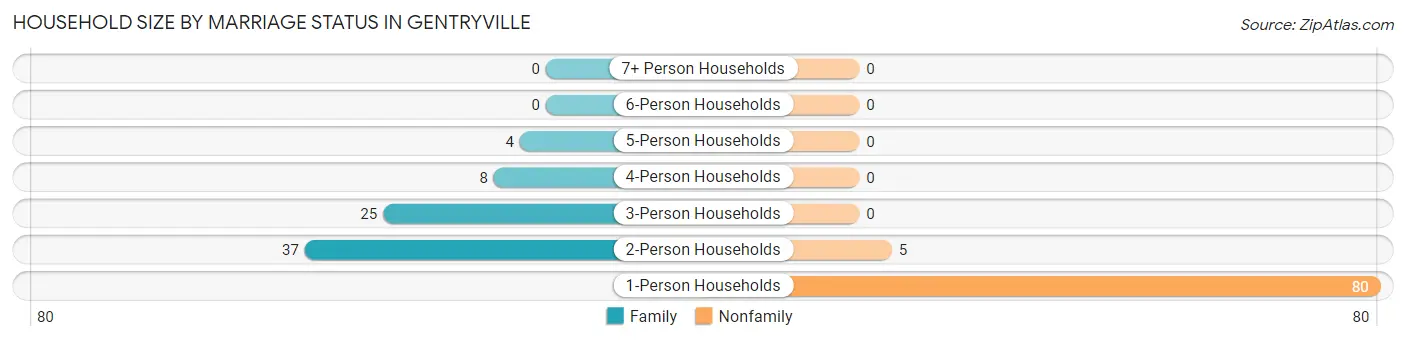
| Household Size | Family Households | Nonfamily Households |
| 1-Person Households | - | 80 (50.3%) |
| 2-Person Households | 37 (23.3%) | 5 (3.1%) |
| 3-Person Households | 25 (15.7%) | 0 (0.0%) |
| 4-Person Households | 8 (5.0%) | 0 (0.0%) |
| 5-Person Households | 4 (2.5%) | 0 (0.0%) |
| 6-Person Households | 0 (0.0%) | 0 (0.0%) |
| 7+ Person Households | 0 (0.0%) | 0 (0.0%) |
| Total | 74 (46.5%) | 85 (53.5%) |
Female Fertility in Gentryville
Fertility by Age in Gentryville
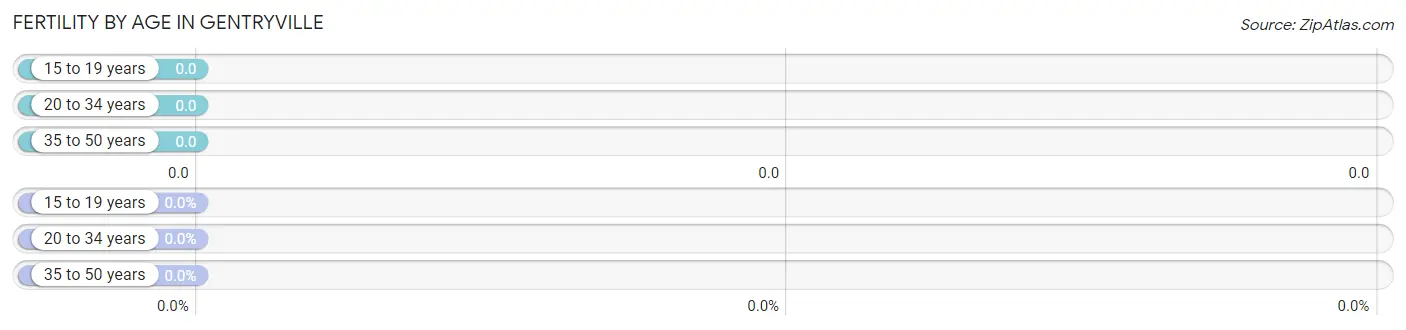
| Age Bracket | Women with Births | Births / 1,000 Women |
| 15 to 19 years | 0 (0.0%) | 0.0 |
| 20 to 34 years | 0 (0.0%) | 0.0 |
| 35 to 50 years | 0 (0.0%) | 0.0 |
| Total | 0 (0.0%) | 0.0 |
Fertility by Age by Marriage Status in Gentryville
| Age Bracket | Married | Unmarried |
| 15 to 19 years | 0 (0.0%) | 0 (0.0%) |
| 20 to 34 years | 0 (0.0%) | 0 (0.0%) |
| 35 to 50 years | 0 (0.0%) | 0 (0.0%) |
| Total | 0 (0.0%) | 0 (0.0%) |
Fertility by Education in Gentryville
| Educational Attainment | Women with Births | Births / 1,000 Women |
| Less than High School | 0 (0.0%) | 0.0 |
| High School Diploma | 0 (0.0%) | 0.0 |
| College or Associate's Degree | 0 (0.0%) | 0.0 |
| Bachelor's Degree | 0 (0.0%) | 0.0 |
| Graduate Degree | 0 (0.0%) | 0.0 |
| Total | 0 (0.0%) | 0.0 |
Fertility by Education by Marriage Status in Gentryville
| Educational Attainment | Married | Unmarried |
| Less than High School | 0 (0.0%) | 0 (0.0%) |
| High School Diploma | 0 (0.0%) | 0 (0.0%) |
| College or Associate's Degree | 0 (0.0%) | 0 (0.0%) |
| Bachelor's Degree | 0 (0.0%) | 0 (0.0%) |
| Graduate Degree | 0 (0.0%) | 0 (0.0%) |
| Total | 0 (0.0%) | 0 (0.0%) |
Employment Characteristics in Gentryville
Employment by Class of Employer in Gentryville
Among the 90 employed individuals in Gentryville, private company employees (80 | 88.9%), local government employees (6 | 6.7%), and not-for-profit organizations (2 | 2.2%) make up the most common classes of employment.
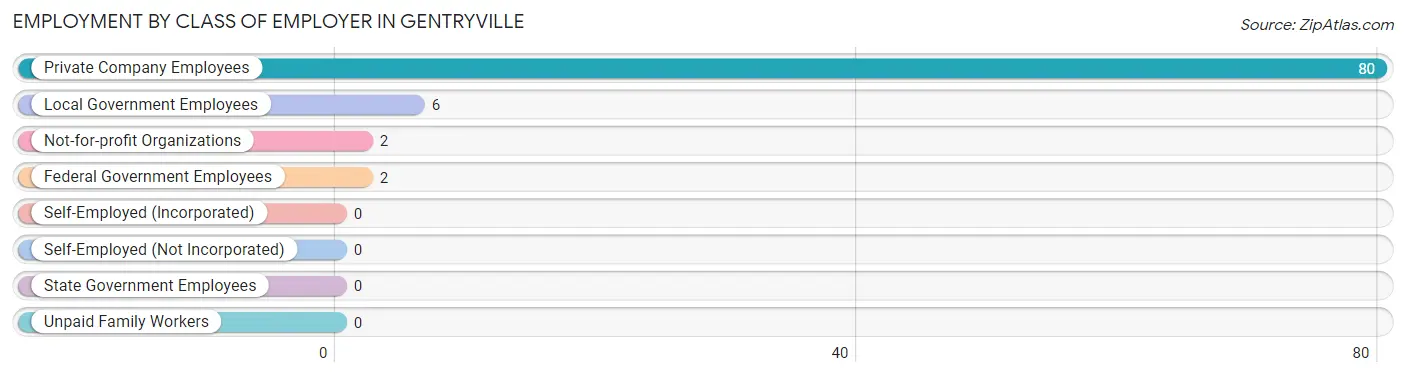
| Employer Class | # Employees | % Employees |
| Private Company Employees | 80 | 88.9% |
| Self-Employed (Incorporated) | 0 | 0.0% |
| Self-Employed (Not Incorporated) | 0 | 0.0% |
| Not-for-profit Organizations | 2 | 2.2% |
| Local Government Employees | 6 | 6.7% |
| State Government Employees | 0 | 0.0% |
| Federal Government Employees | 2 | 2.2% |
| Unpaid Family Workers | 0 | 0.0% |
| Total | 90 | 100.0% |
Employment Status by Age in Gentryville
According to the labor force statistics for Gentryville, out of the total population over 16 years of age (271), 36.9% or 100 individuals are in the labor force, with 6.0% or 6 of them unemployed. The age group with the highest labor force participation rate is 30 to 34 years, with 100.0% or 5 individuals in the labor force. Within the labor force, the 55 to 59 years age range has the highest percentage of unemployed individuals, with 25.0% or 2 of them being unemployed.
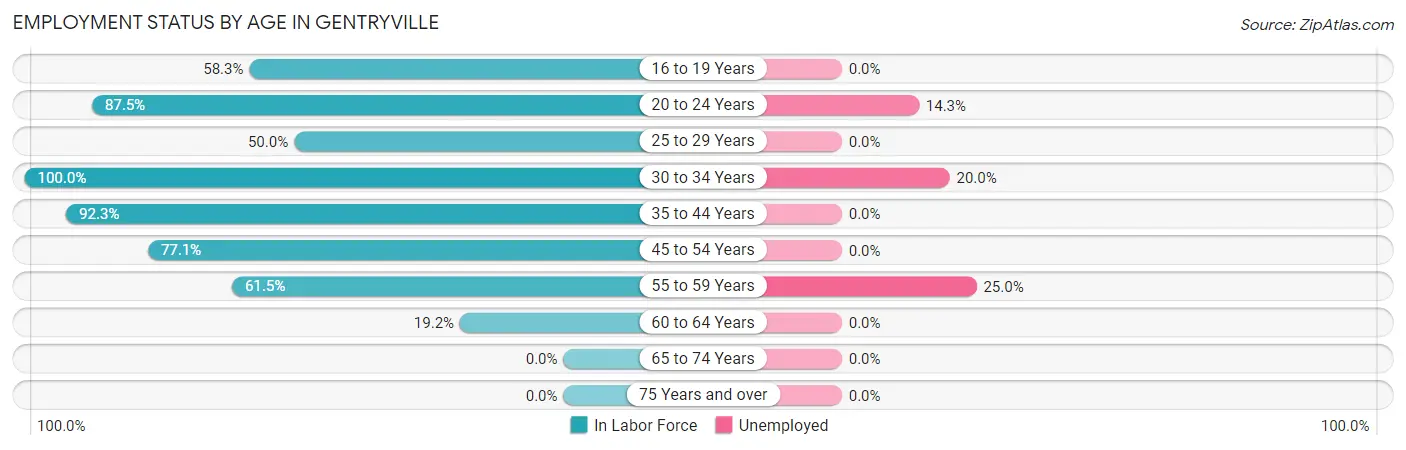
| Age Bracket | In Labor Force | Unemployed |
| 16 to 19 Years | 7 (58.3%) | 0 (0.0%) |
| 20 to 24 Years | 21 (87.5%) | 3 (14.3%) |
| 25 to 29 Years | 3 (50.0%) | 0 (0.0%) |
| 30 to 34 Years | 5 (100.0%) | 1 (20.0%) |
| 35 to 44 Years | 24 (92.3%) | 0 (0.0%) |
| 45 to 54 Years | 27 (77.1%) | 0 (0.0%) |
| 55 to 59 Years | 8 (61.5%) | 2 (25.0%) |
| 60 to 64 Years | 5 (19.2%) | 0 (0.0%) |
| 65 to 74 Years | 0 (0.0%) | 0 (0.0%) |
| 75 Years and over | 0 (0.0%) | 0 (0.0%) |
| Total | 100 (36.9%) | 6 (6.0%) |
Employment Status by Educational Attainment in Gentryville
According to labor force statistics for Gentryville, 64.9% of individuals (72) out of the total population between 25 and 64 years of age (111) are in the labor force, with 4.2% or 3 of them being unemployed. The group with the highest labor force participation rate are those with the educational attainment of bachelor's degree or higher, with 75.0% or 12 individuals in the labor force. Within the labor force, individuals with less than high school education have the highest percentage of unemployment, with 12.5% or 1 of them being unemployed.
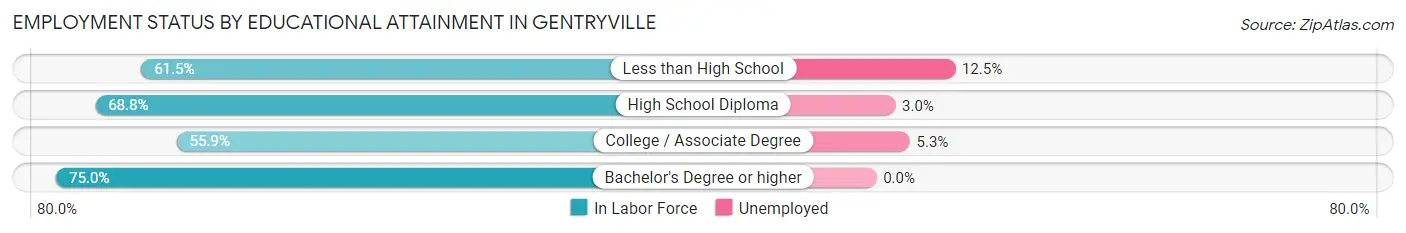
| Educational Attainment | In Labor Force | Unemployed |
| Less than High School | 8 (61.5%) | 2 (12.5%) |
| High School Diploma | 33 (68.8%) | 1 (3.0%) |
| College / Associate Degree | 19 (55.9%) | 2 (5.3%) |
| Bachelor's Degree or higher | 12 (75.0%) | 0 (0.0%) |
| Total | 72 (64.9%) | 5 (4.2%) |
Employment Occupations by Sex in Gentryville
Management, Business, Science and Arts Occupations
The most common Management, Business, Science and Arts occupations in Gentryville are Community & Social Service (5 | 5.3%), Education Instruction & Library (5 | 5.3%), Computers, Engineering & Science (2 | 2.1%), Management (1 | 1.1%), and Computers & Mathematics (1 | 1.1%).
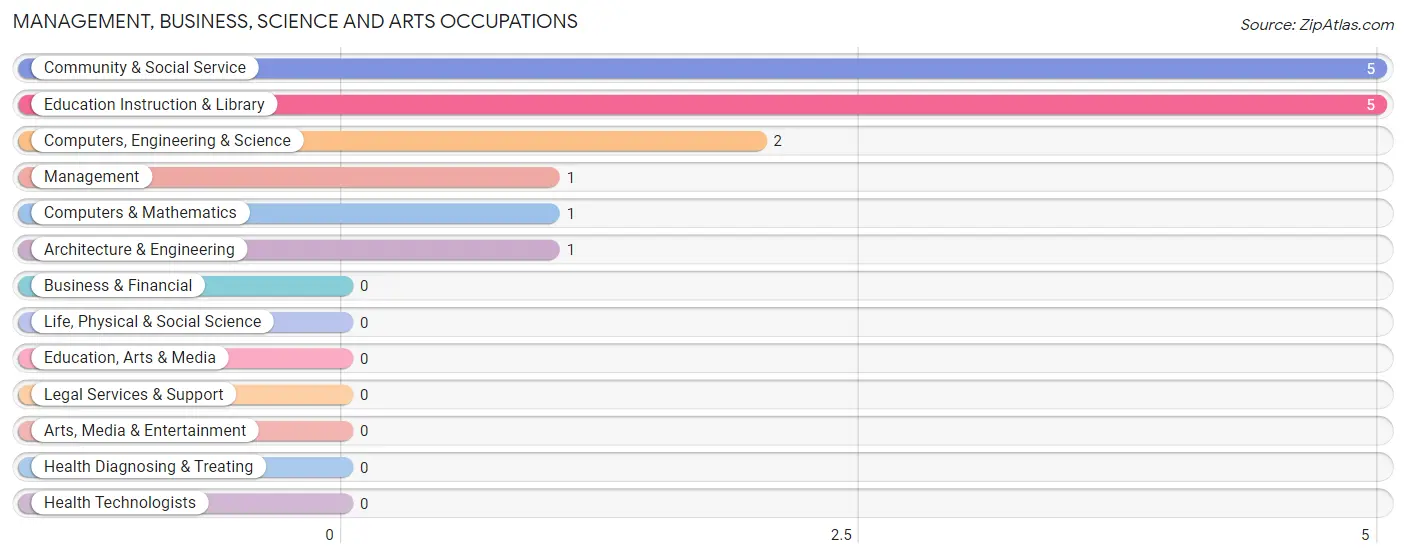
Management, Business, Science and Arts Occupations by Sex
Within the Management, Business, Science and Arts occupations in Gentryville, the most male-oriented occupations are Computers, Engineering & Science (100.0%), Computers & Mathematics (100.0%), and Architecture & Engineering (100.0%), while the most female-oriented occupations are Management (100.0%), Community & Social Service (100.0%), and Education Instruction & Library (100.0%).
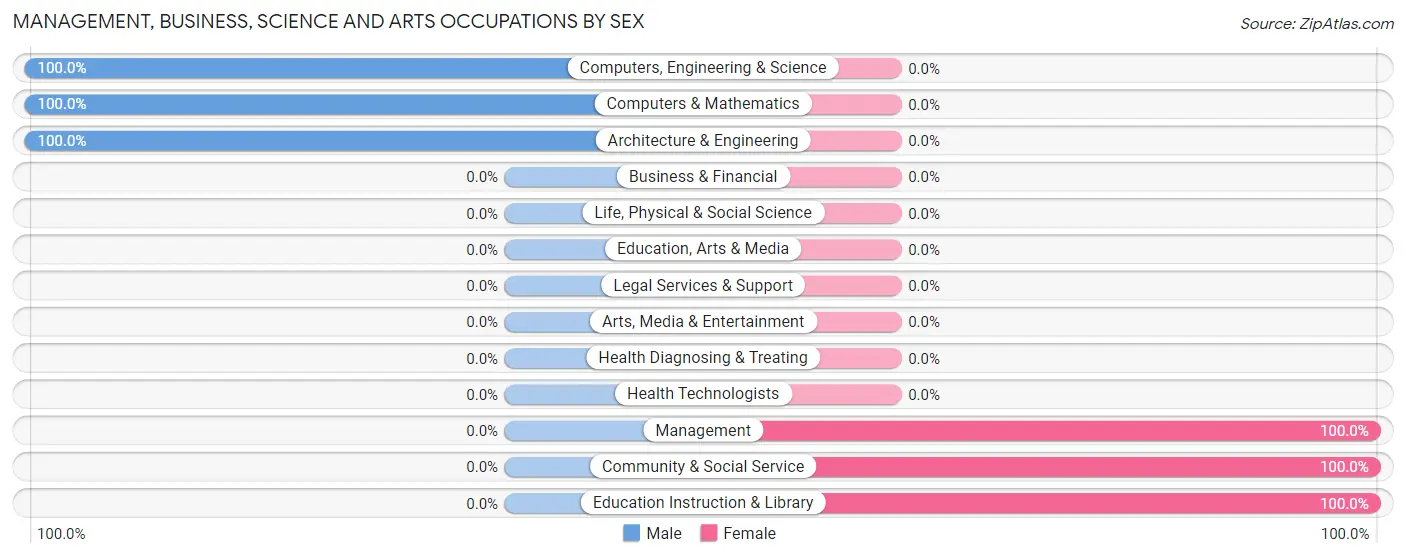
| Occupation | Male | Female |
| Management | 0 (0.0%) | 1 (100.0%) |
| Business & Financial | 0 (0.0%) | 0 (0.0%) |
| Computers, Engineering & Science | 2 (100.0%) | 0 (0.0%) |
| Computers & Mathematics | 1 (100.0%) | 0 (0.0%) |
| Architecture & Engineering | 1 (100.0%) | 0 (0.0%) |
| Life, Physical & Social Science | 0 (0.0%) | 0 (0.0%) |
| Community & Social Service | 0 (0.0%) | 5 (100.0%) |
| Education, Arts & Media | 0 (0.0%) | 0 (0.0%) |
| Legal Services & Support | 0 (0.0%) | 0 (0.0%) |
| Education Instruction & Library | 0 (0.0%) | 5 (100.0%) |
| Arts, Media & Entertainment | 0 (0.0%) | 0 (0.0%) |
| Health Diagnosing & Treating | 0 (0.0%) | 0 (0.0%) |
| Health Technologists | 0 (0.0%) | 0 (0.0%) |
| Total (Category) | 2 (25.0%) | 6 (75.0%) |
| Total (Overall) | 33 (35.1%) | 61 (64.9%) |
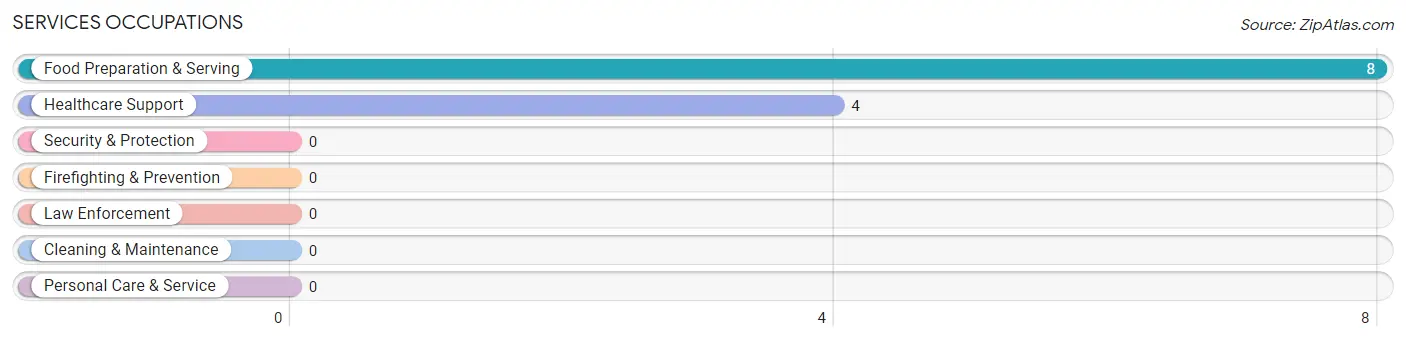
Services Occupations
The most common Services occupations in Gentryville are Food Preparation & Serving (8 | 8.5%), and Healthcare Support (4 | 4.3%).
Services Occupations by Sex
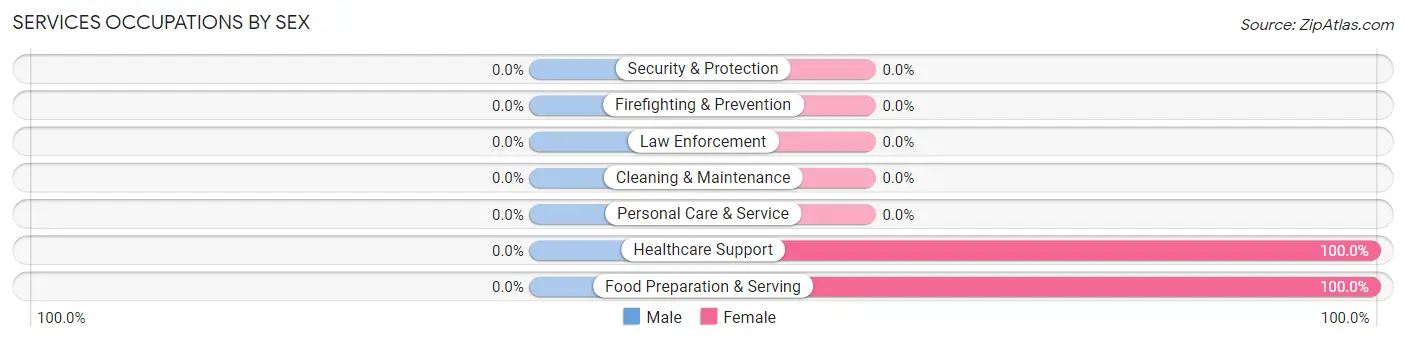
| Occupation | Male | Female |
| Healthcare Support | 0 (0.0%) | 4 (100.0%) |
| Security & Protection | 0 (0.0%) | 0 (0.0%) |
| Firefighting & Prevention | 0 (0.0%) | 0 (0.0%) |
| Law Enforcement | 0 (0.0%) | 0 (0.0%) |
| Food Preparation & Serving | 0 (0.0%) | 8 (100.0%) |
| Cleaning & Maintenance | 0 (0.0%) | 0 (0.0%) |
| Personal Care & Service | 0 (0.0%) | 0 (0.0%) |
| Total (Category) | 0 (0.0%) | 12 (100.0%) |
| Total (Overall) | 33 (35.1%) | 61 (64.9%) |
Sales and Office Occupations
The most common Sales and Office occupations in Gentryville are Office & Administration (7 | 7.4%), and Sales & Related (4 | 4.3%).
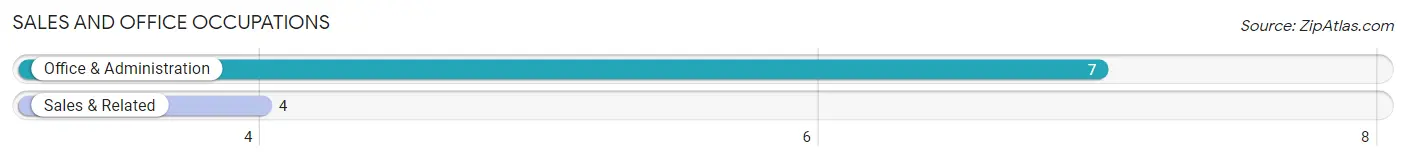
Sales and Office Occupations by Sex
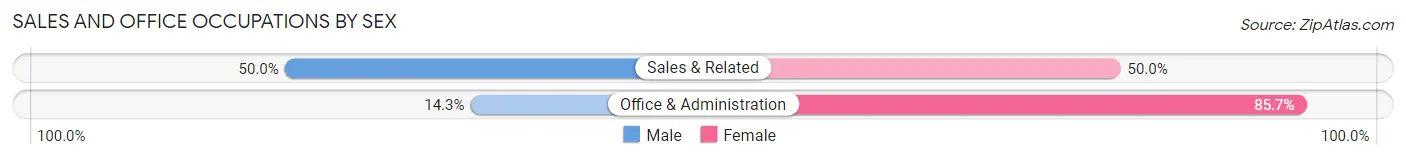
| Occupation | Male | Female |
| Sales & Related | 2 (50.0%) | 2 (50.0%) |
| Office & Administration | 1 (14.3%) | 6 (85.7%) |
| Total (Category) | 3 (27.3%) | 8 (72.7%) |
| Total (Overall) | 33 (35.1%) | 61 (64.9%) |
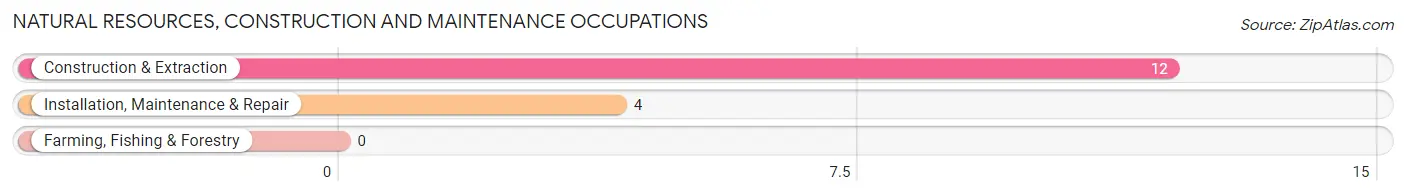
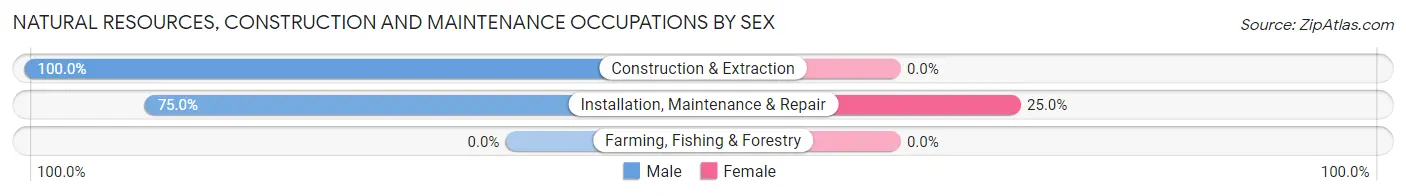
Natural Resources, Construction and Maintenance Occupations
The most common Natural Resources, Construction and Maintenance occupations in Gentryville are Construction & Extraction (12 | 12.8%), and Installation, Maintenance & Repair (4 | 4.3%).
Natural Resources, Construction and Maintenance Occupations by Sex
| Occupation | Male | Female |
| Farming, Fishing & Forestry | 0 (0.0%) | 0 (0.0%) |
| Construction & Extraction | 12 (100.0%) | 0 (0.0%) |
| Installation, Maintenance & Repair | 3 (75.0%) | 1 (25.0%) |
| Total (Category) | 15 (93.8%) | 1 (6.2%) |
| Total (Overall) | 33 (35.1%) | 61 (64.9%) |
Production, Transportation and Moving Occupations
The most common Production, Transportation and Moving occupations in Gentryville are Production (35 | 37.2%), Material Moving (11 | 11.7%), and Transportation (1 | 1.1%).
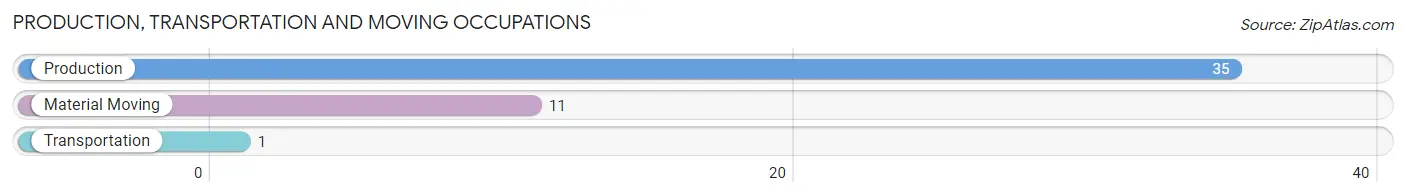
Production, Transportation and Moving Occupations by Sex
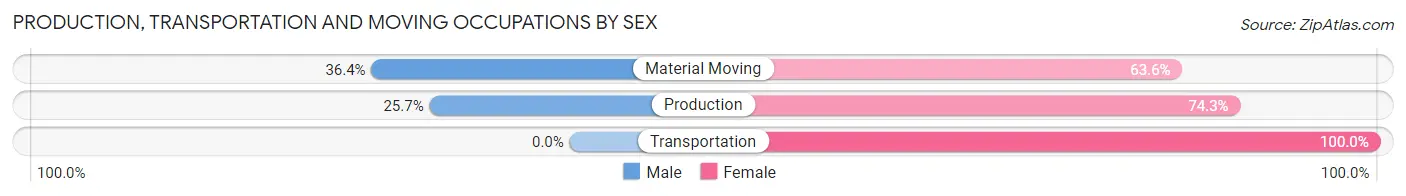
| Occupation | Male | Female |
| Production | 9 (25.7%) | 26 (74.3%) |
| Transportation | 0 (0.0%) | 1 (100.0%) |
| Material Moving | 4 (36.4%) | 7 (63.6%) |
| Total (Category) | 13 (27.7%) | 34 (72.3%) |
| Total (Overall) | 33 (35.1%) | 61 (64.9%) |
Employment Industries by Sex in Gentryville
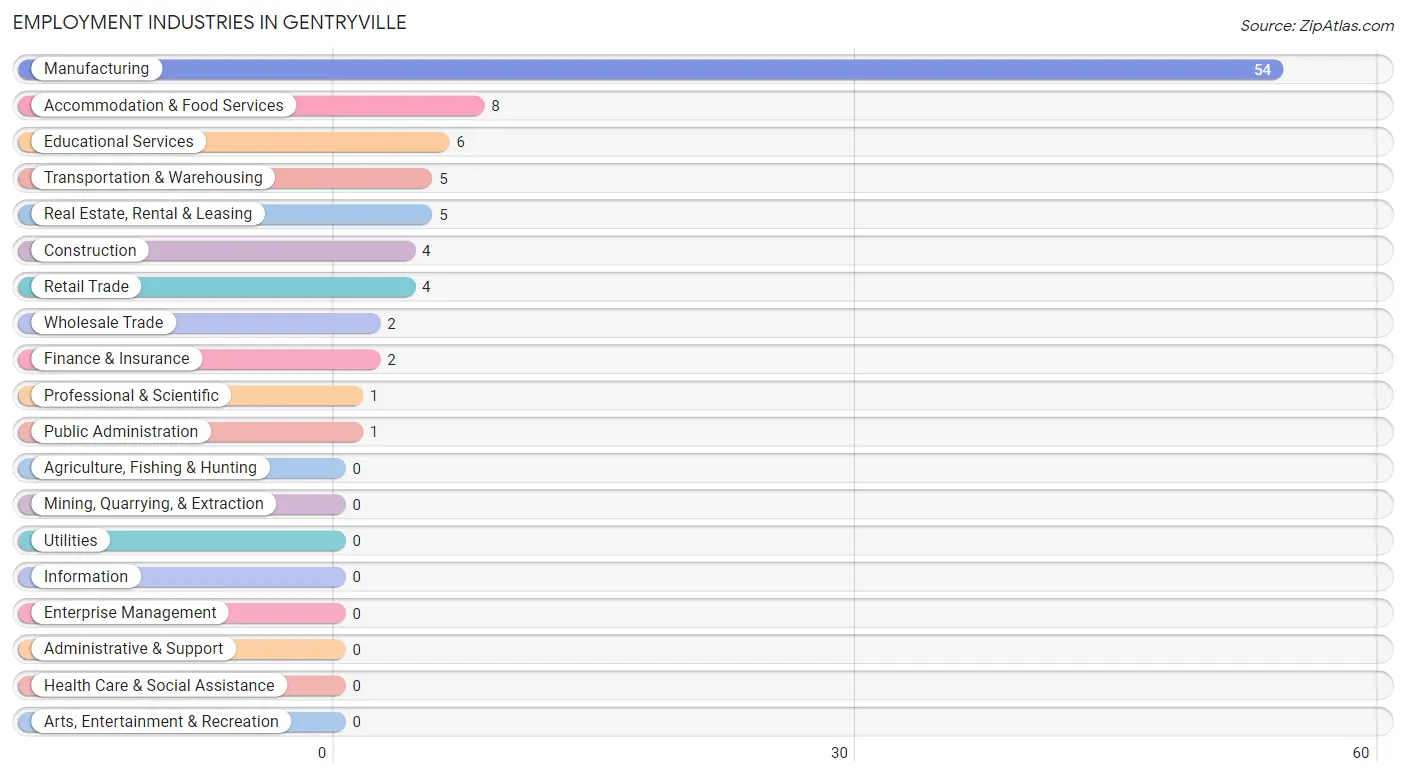
Employment Industries in Gentryville
The major employment industries in Gentryville include Manufacturing (54 | 57.5%), Accommodation & Food Services (8 | 8.5%), Educational Services (6 | 6.4%), Transportation & Warehousing (5 | 5.3%), and Real Estate, Rental & Leasing (5 | 5.3%).
Employment Industries by Sex in Gentryville
The Gentryville industries that see more men than women are Construction (100.0%), Wholesale Trade (100.0%), and Finance & Insurance (100.0%), whereas the industries that tend to have a higher number of women are Retail Trade (100.0%), Professional & Scientific (100.0%), and Educational Services (100.0%).
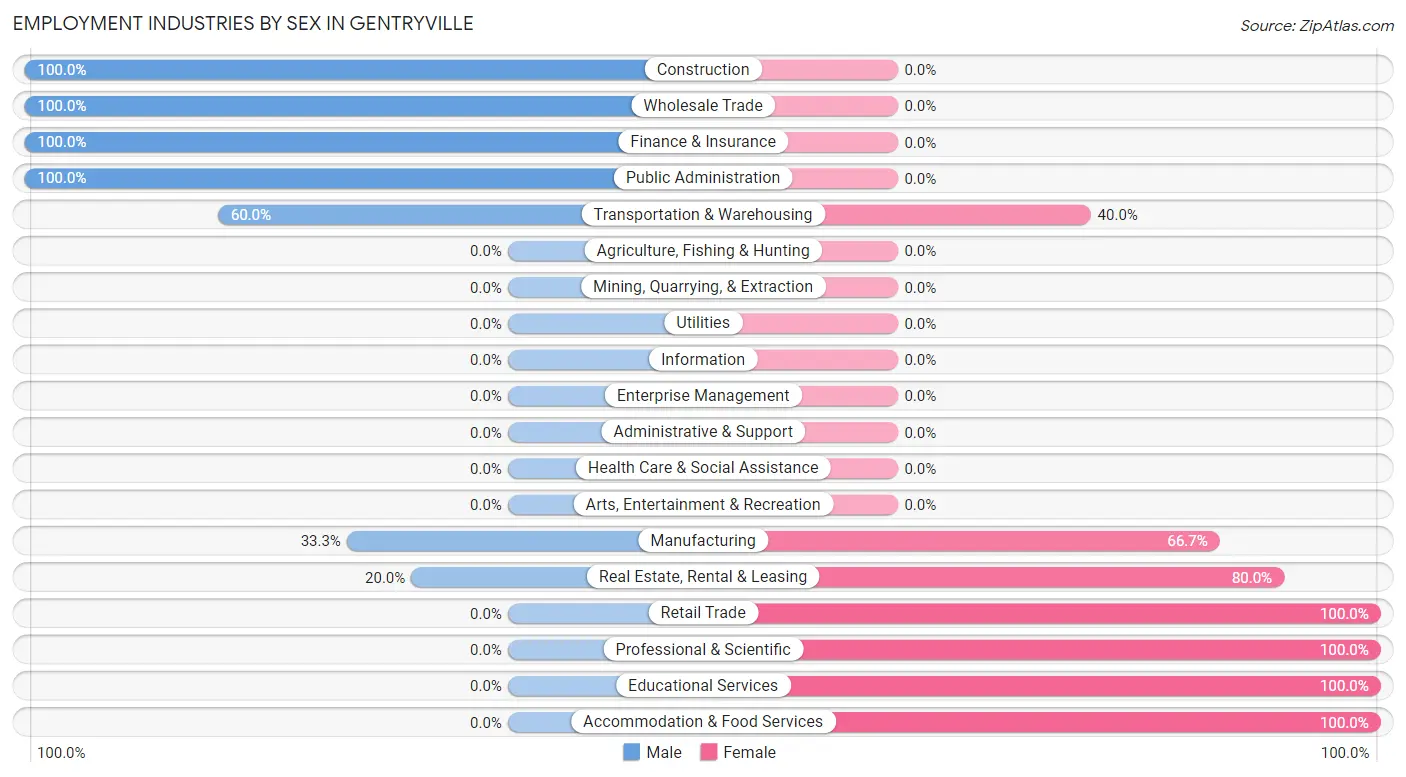
| Industry | Male | Female |
| Agriculture, Fishing & Hunting | 0 (0.0%) | 0 (0.0%) |
| Mining, Quarrying, & Extraction | 0 (0.0%) | 0 (0.0%) |
| Construction | 4 (100.0%) | 0 (0.0%) |
| Manufacturing | 18 (33.3%) | 36 (66.7%) |
| Wholesale Trade | 2 (100.0%) | 0 (0.0%) |
| Retail Trade | 0 (0.0%) | 4 (100.0%) |
| Transportation & Warehousing | 3 (60.0%) | 2 (40.0%) |
| Utilities | 0 (0.0%) | 0 (0.0%) |
| Information | 0 (0.0%) | 0 (0.0%) |
| Finance & Insurance | 2 (100.0%) | 0 (0.0%) |
| Real Estate, Rental & Leasing | 1 (20.0%) | 4 (80.0%) |
| Professional & Scientific | 0 (0.0%) | 1 (100.0%) |
| Enterprise Management | 0 (0.0%) | 0 (0.0%) |
| Administrative & Support | 0 (0.0%) | 0 (0.0%) |
| Educational Services | 0 (0.0%) | 6 (100.0%) |
| Health Care & Social Assistance | 0 (0.0%) | 0 (0.0%) |
| Arts, Entertainment & Recreation | 0 (0.0%) | 0 (0.0%) |
| Accommodation & Food Services | 0 (0.0%) | 8 (100.0%) |
| Public Administration | 1 (100.0%) | 0 (0.0%) |
| Total | 33 (35.1%) | 61 (64.9%) |
Education in Gentryville
School Enrollment in Gentryville
The most common levels of schooling among the 33 students in Gentryville are elementary school (11 | 33.3%), high school (11 | 33.3%), and middle school (10 | 30.3%).
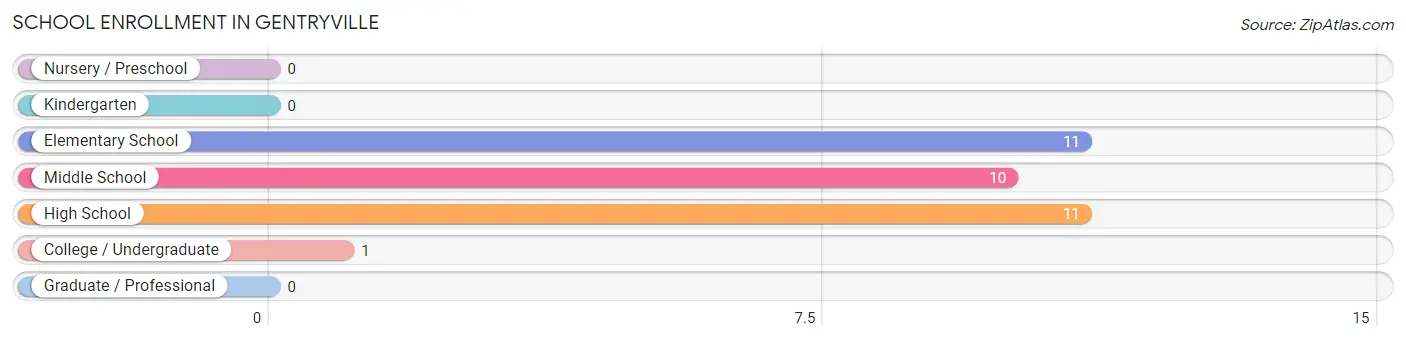
| School Level | # Students | % Students |
| Nursery / Preschool | 0 | 0.0% |
| Kindergarten | 0 | 0.0% |
| Elementary School | 11 | 33.3% |
| Middle School | 10 | 30.3% |
| High School | 11 | 33.3% |
| College / Undergraduate | 1 | 3.0% |
| Graduate / Professional | 0 | 0.0% |
| Total | 33 | 100.0% |
School Enrollment by Age by Funding Source in Gentryville
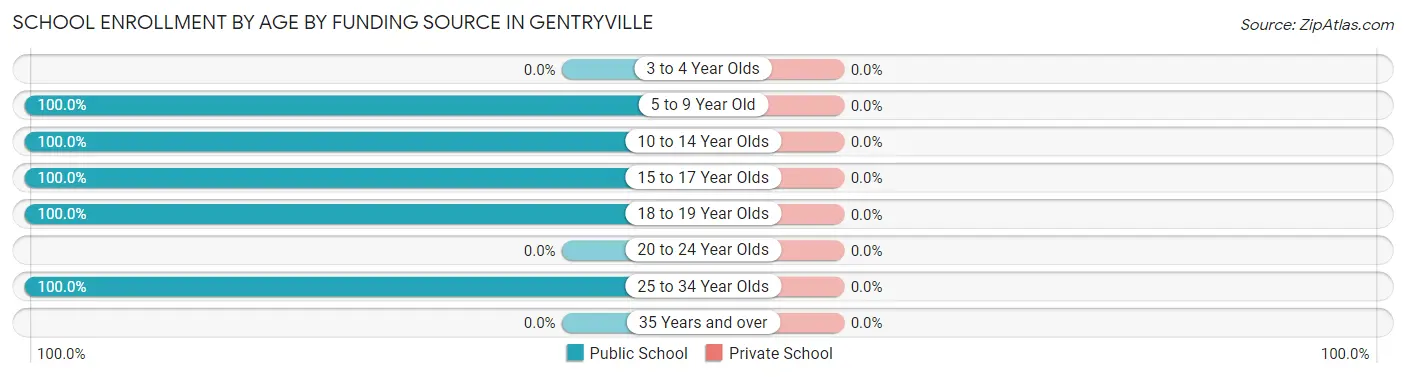
| Age Bracket | Public School | Private School |
| 3 to 4 Year Olds | 0 (0.0%) | 0 (0.0%) |
| 5 to 9 Year Old | 8 (100.0%) | 0 (0.0%) |
| 10 to 14 Year Olds | 13 (100.0%) | 0 (0.0%) |
| 15 to 17 Year Olds | 6 (100.0%) | 0 (0.0%) |
| 18 to 19 Year Olds | 5 (100.0%) | 0 (0.0%) |
| 20 to 24 Year Olds | 0 (0.0%) | 0 (0.0%) |
| 25 to 34 Year Olds | 1 (100.0%) | 0 (0.0%) |
| 35 Years and over | 0 (0.0%) | 0 (0.0%) |
| Total | 33 (100.0%) | 0 (0.0%) |
Educational Attainment by Field of Study in Gentryville
Education (6 | 35.3%), business (3 | 17.6%), psychology (2 | 11.8%), social sciences (2 | 11.8%), and communications (2 | 11.8%) are the most common fields of study among 17 individuals in Gentryville who have obtained a bachelor's degree or higher.
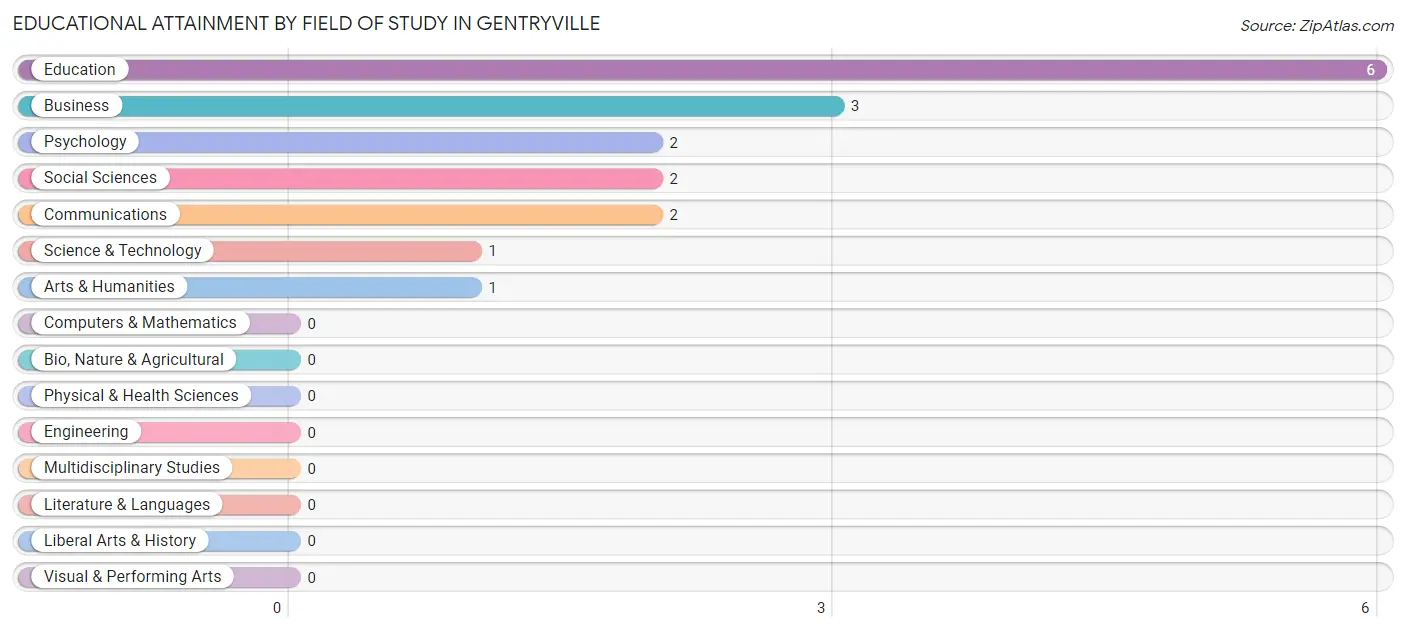
| Field of Study | # Graduates | % Graduates |
| Computers & Mathematics | 0 | 0.0% |
| Bio, Nature & Agricultural | 0 | 0.0% |
| Physical & Health Sciences | 0 | 0.0% |
| Psychology | 2 | 11.8% |
| Social Sciences | 2 | 11.8% |
| Engineering | 0 | 0.0% |
| Multidisciplinary Studies | 0 | 0.0% |
| Science & Technology | 1 | 5.9% |
| Business | 3 | 17.6% |
| Education | 6 | 35.3% |
| Literature & Languages | 0 | 0.0% |
| Liberal Arts & History | 0 | 0.0% |
| Visual & Performing Arts | 0 | 0.0% |
| Communications | 2 | 11.8% |
| Arts & Humanities | 1 | 5.9% |
| Total | 17 | 100.0% |
Transportation & Commute in Gentryville
Vehicle Availability by Sex in Gentryville
The most prevalent vehicle ownership categories in Gentryville are males with 3 vehicles (16, accounting for 48.5%) and females with 3 vehicles (30, making up 28.1%).
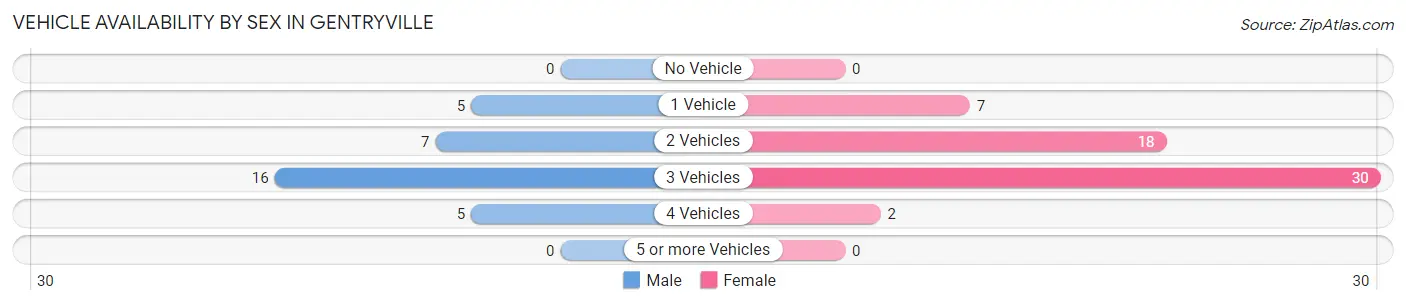
| Vehicles Available | Male | Female |
| No Vehicle | 0 (0.0%) | 0 (0.0%) |
| 1 Vehicle | 5 (15.1%) | 7 (12.3%) |
| 2 Vehicles | 7 (21.2%) | 18 (31.6%) |
| 3 Vehicles | 16 (48.5%) | 30 (52.6%) |
| 4 Vehicles | 5 (15.1%) | 2 (3.5%) |
| 5 or more Vehicles | 0 (0.0%) | 0 (0.0%) |
| Total | 33 (100.0%) | 57 (100.0%) |
Commute Time in Gentryville
The most frequently occuring commute durations in Gentryville are 15 to 19 minutes (24 commuters, 26.7%), 30 to 34 minutes (23 commuters, 25.6%), and 20 to 24 minutes (15 commuters, 16.7%).
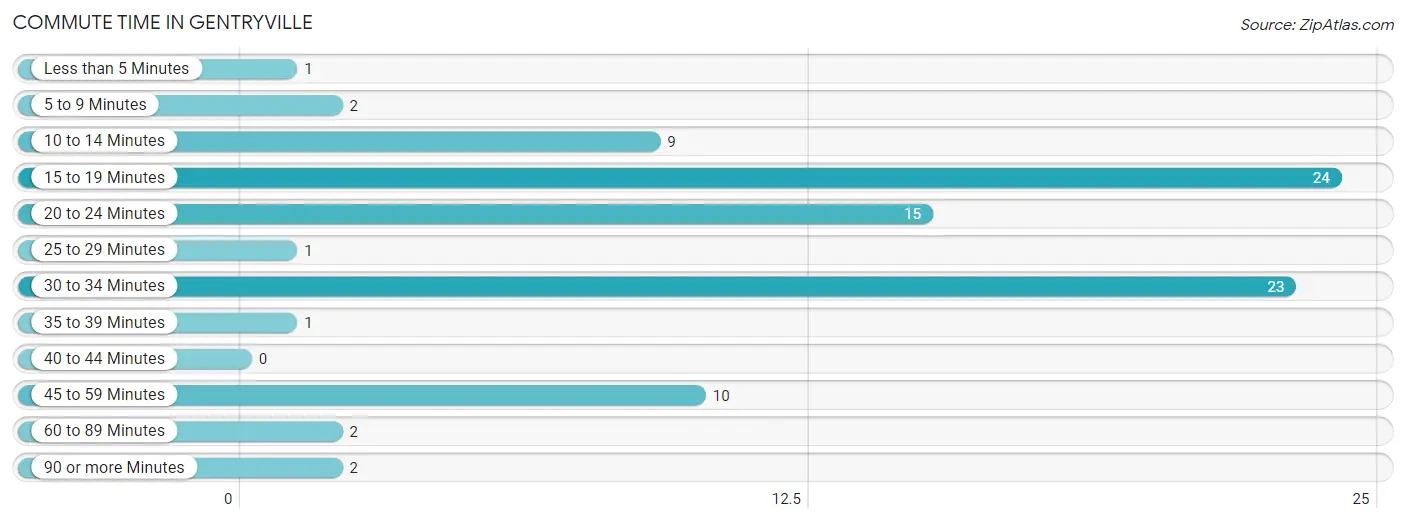
| Commute Time | # Commuters | % Commuters |
| Less than 5 Minutes | 1 | 1.1% |
| 5 to 9 Minutes | 2 | 2.2% |
| 10 to 14 Minutes | 9 | 10.0% |
| 15 to 19 Minutes | 24 | 26.7% |
| 20 to 24 Minutes | 15 | 16.7% |
| 25 to 29 Minutes | 1 | 1.1% |
| 30 to 34 Minutes | 23 | 25.6% |
| 35 to 39 Minutes | 1 | 1.1% |
| 40 to 44 Minutes | 0 | 0.0% |
| 45 to 59 Minutes | 10 | 11.1% |
| 60 to 89 Minutes | 2 | 2.2% |
| 90 or more Minutes | 2 | 2.2% |
Commute Time by Sex in Gentryville
The most common commute times in Gentryville are 15 to 19 minutes (13 commuters, 39.4%) for males and 30 to 34 minutes (15 commuters, 26.3%) for females.
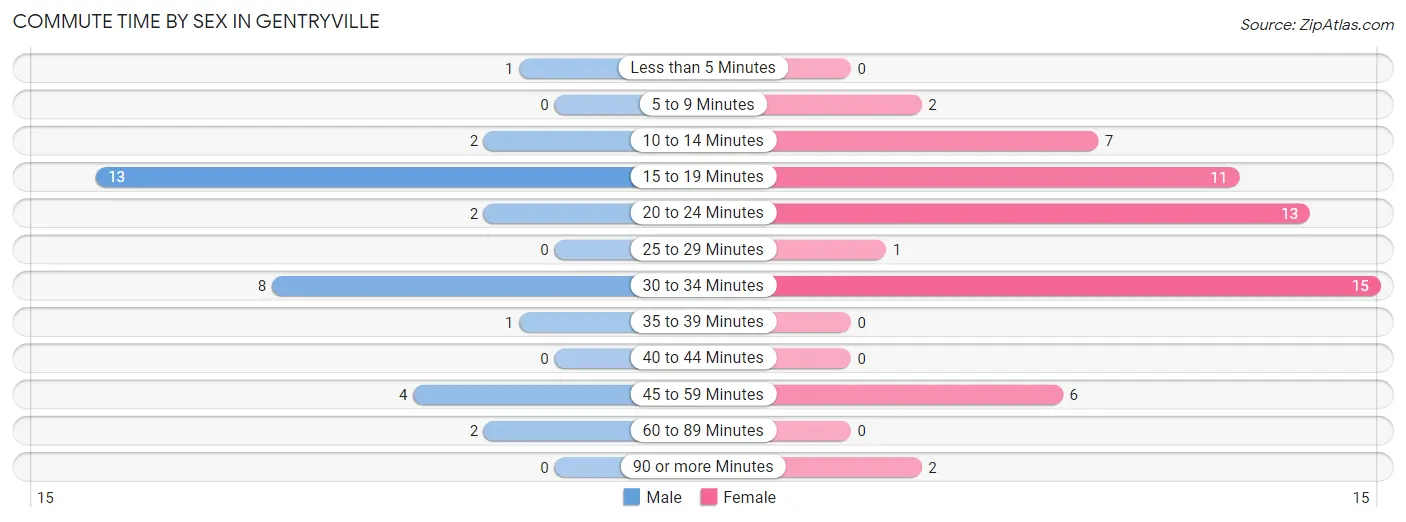
| Commute Time | Male | Female |
| Less than 5 Minutes | 1 (3.0%) | 0 (0.0%) |
| 5 to 9 Minutes | 0 (0.0%) | 2 (3.5%) |
| 10 to 14 Minutes | 2 (6.1%) | 7 (12.3%) |
| 15 to 19 Minutes | 13 (39.4%) | 11 (19.3%) |
| 20 to 24 Minutes | 2 (6.1%) | 13 (22.8%) |
| 25 to 29 Minutes | 0 (0.0%) | 1 (1.8%) |
| 30 to 34 Minutes | 8 (24.2%) | 15 (26.3%) |
| 35 to 39 Minutes | 1 (3.0%) | 0 (0.0%) |
| 40 to 44 Minutes | 0 (0.0%) | 0 (0.0%) |
| 45 to 59 Minutes | 4 (12.1%) | 6 (10.5%) |
| 60 to 89 Minutes | 2 (6.1%) | 0 (0.0%) |
| 90 or more Minutes | 0 (0.0%) | 2 (3.5%) |
Time of Departure to Work by Sex in Gentryville
The most frequent times of departure to work in Gentryville are 5:30 AM to 5:59 AM (9, 27.3%) for males and 7:00 AM to 7:29 AM (22, 38.6%) for females.
| Time of Departure | Male | Female |
| 12:00 AM to 4:59 AM | 5 (15.1%) | 0 (0.0%) |
| 5:00 AM to 5:29 AM | 4 (12.1%) | 1 (1.8%) |
| 5:30 AM to 5:59 AM | 9 (27.3%) | 1 (1.8%) |
| 6:00 AM to 6:29 AM | 7 (21.2%) | 2 (3.5%) |
| 6:30 AM to 6:59 AM | 4 (12.1%) | 21 (36.8%) |
| 7:00 AM to 7:29 AM | 0 (0.0%) | 22 (38.6%) |
| 7:30 AM to 7:59 AM | 2 (6.1%) | 1 (1.8%) |
| 8:00 AM to 8:29 AM | 0 (0.0%) | 3 (5.3%) |
| 8:30 AM to 8:59 AM | 0 (0.0%) | 0 (0.0%) |
| 9:00 AM to 9:59 AM | 0 (0.0%) | 0 (0.0%) |
| 10:00 AM to 10:59 AM | 0 (0.0%) | 0 (0.0%) |
| 11:00 AM to 11:59 AM | 0 (0.0%) | 0 (0.0%) |
| 12:00 PM to 3:59 PM | 0 (0.0%) | 0 (0.0%) |
| 4:00 PM to 11:59 PM | 2 (6.1%) | 6 (10.5%) |
| Total | 33 (100.0%) | 57 (100.0%) |
Housing Occupancy in Gentryville
Occupancy by Ownership in Gentryville
Of the total 159 dwellings in Gentryville, owner-occupied units account for 76 (47.8%), while renter-occupied units make up 83 (52.2%).
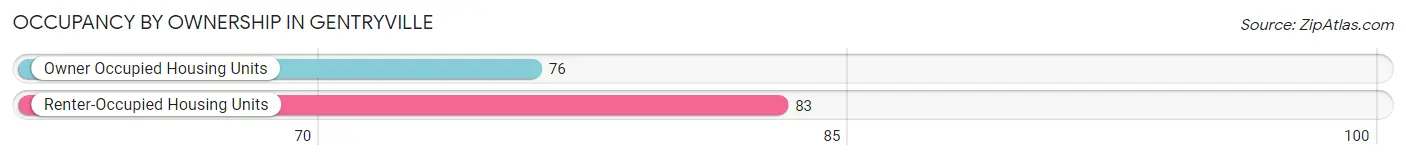
| Occupancy | # Housing Units | % Housing Units |
| Owner Occupied Housing Units | 76 | 47.8% |
| Renter-Occupied Housing Units | 83 | 52.2% |
| Total Occupied Housing Units | 159 | 100.0% |
Occupancy by Household Size in Gentryville
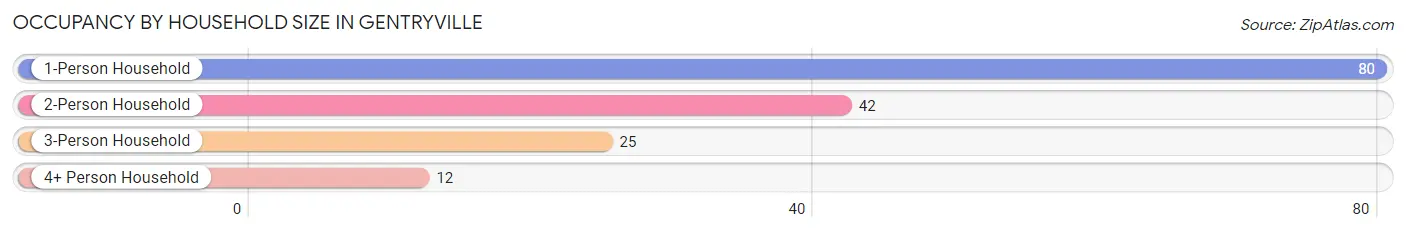
| Household Size | # Housing Units | % Housing Units |
| 1-Person Household | 80 | 50.3% |
| 2-Person Household | 42 | 26.4% |
| 3-Person Household | 25 | 15.7% |
| 4+ Person Household | 12 | 7.5% |
| Total Housing Units | 159 | 100.0% |
Occupancy by Ownership by Household Size in Gentryville
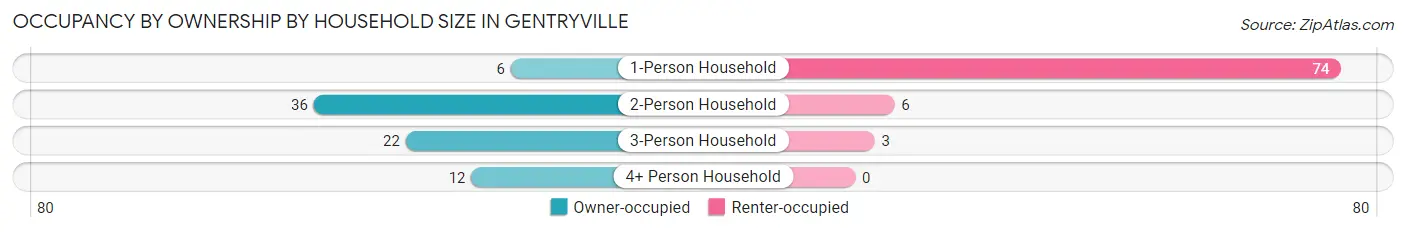
| Household Size | Owner-occupied | Renter-occupied |
| 1-Person Household | 6 (7.5%) | 74 (92.5%) |
| 2-Person Household | 36 (85.7%) | 6 (14.3%) |
| 3-Person Household | 22 (88.0%) | 3 (12.0%) |
| 4+ Person Household | 12 (100.0%) | 0 (0.0%) |
| Total Housing Units | 76 (47.8%) | 83 (52.2%) |
Occupancy by Educational Attainment in Gentryville
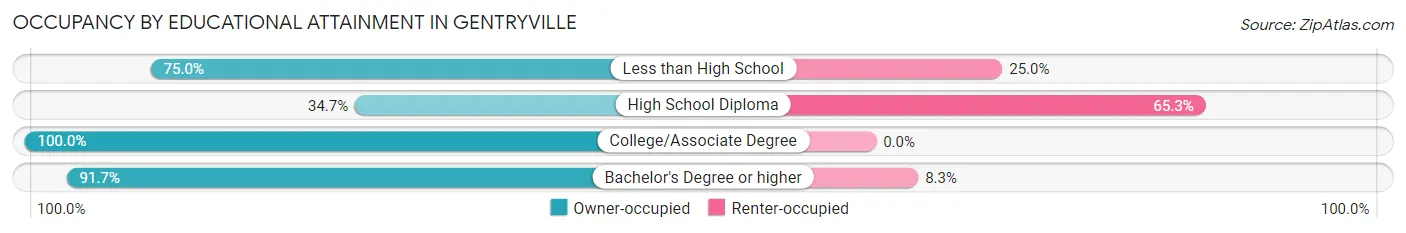
| Household Size | Owner-occupied | Renter-occupied |
| Less than High School | 3 (75.0%) | 1 (25.0%) |
| High School Diploma | 43 (34.7%) | 81 (65.3%) |
| College/Associate Degree | 19 (100.0%) | 0 (0.0%) |
| Bachelor's Degree or higher | 11 (91.7%) | 1 (8.3%) |
Occupancy by Age of Householder in Gentryville
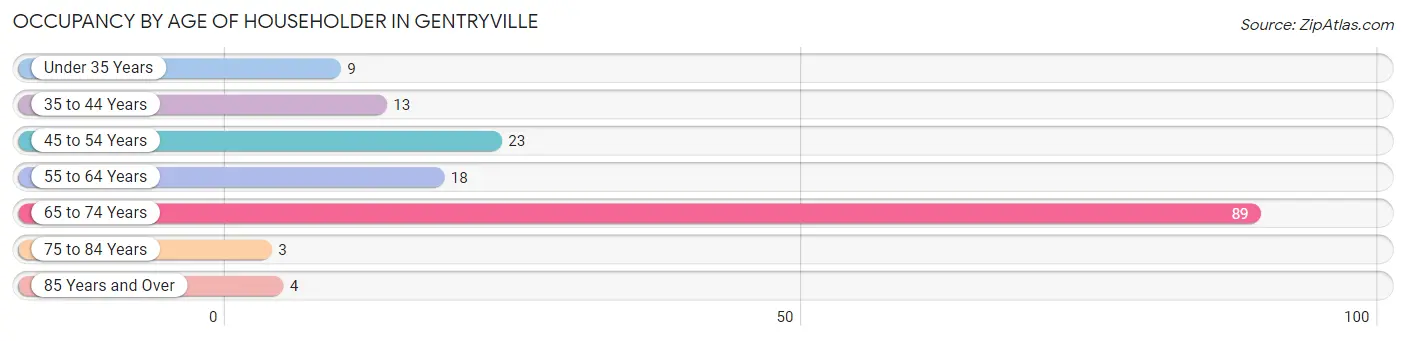
| Age Bracket | # Households | % Households |
| Under 35 Years | 9 | 5.7% |
| 35 to 44 Years | 13 | 8.2% |
| 45 to 54 Years | 23 | 14.5% |
| 55 to 64 Years | 18 | 11.3% |
| 65 to 74 Years | 89 | 56.0% |
| 75 to 84 Years | 3 | 1.9% |
| 85 Years and Over | 4 | 2.5% |
| Total | 159 | 100.0% |
Housing Finances in Gentryville
Median Income by Occupancy in Gentryville
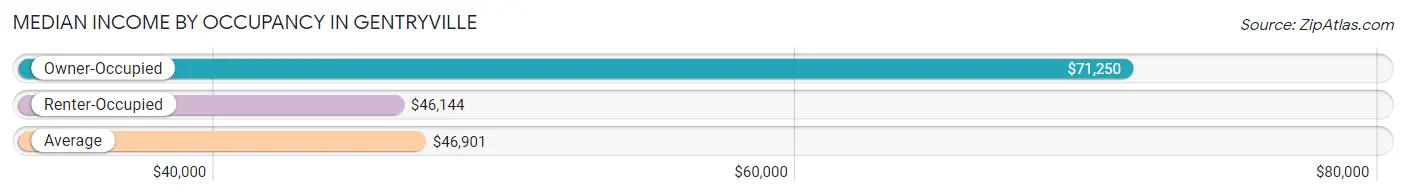
| Occupancy Type | # Households | Median Income |
| Owner-Occupied | 76 (47.8%) | $71,250 |
| Renter-Occupied | 83 (52.2%) | $46,144 |
| Average | 159 (100.0%) | $46,901 |
Occupancy by Householder Income Bracket in Gentryville
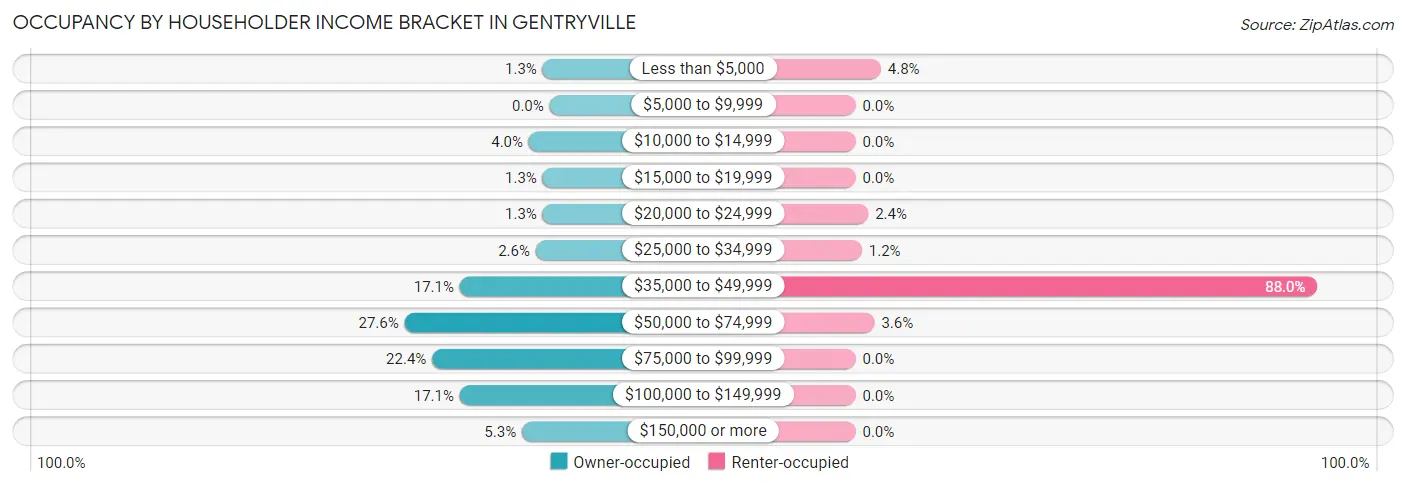
| Income Bracket | Owner-occupied | Renter-occupied |
| Less than $5,000 | 1 (1.3%) | 4 (4.8%) |
| $5,000 to $9,999 | 0 (0.0%) | 0 (0.0%) |
| $10,000 to $14,999 | 3 (4.0%) | 0 (0.0%) |
| $15,000 to $19,999 | 1 (1.3%) | 0 (0.0%) |
| $20,000 to $24,999 | 1 (1.3%) | 2 (2.4%) |
| $25,000 to $34,999 | 2 (2.6%) | 1 (1.2%) |
| $35,000 to $49,999 | 13 (17.1%) | 73 (87.9%) |
| $50,000 to $74,999 | 21 (27.6%) | 3 (3.6%) |
| $75,000 to $99,999 | 17 (22.4%) | 0 (0.0%) |
| $100,000 to $149,999 | 13 (17.1%) | 0 (0.0%) |
| $150,000 or more | 4 (5.3%) | 0 (0.0%) |
| Total | 76 (100.0%) | 83 (100.0%) |
Monthly Housing Cost Tiers in Gentryville
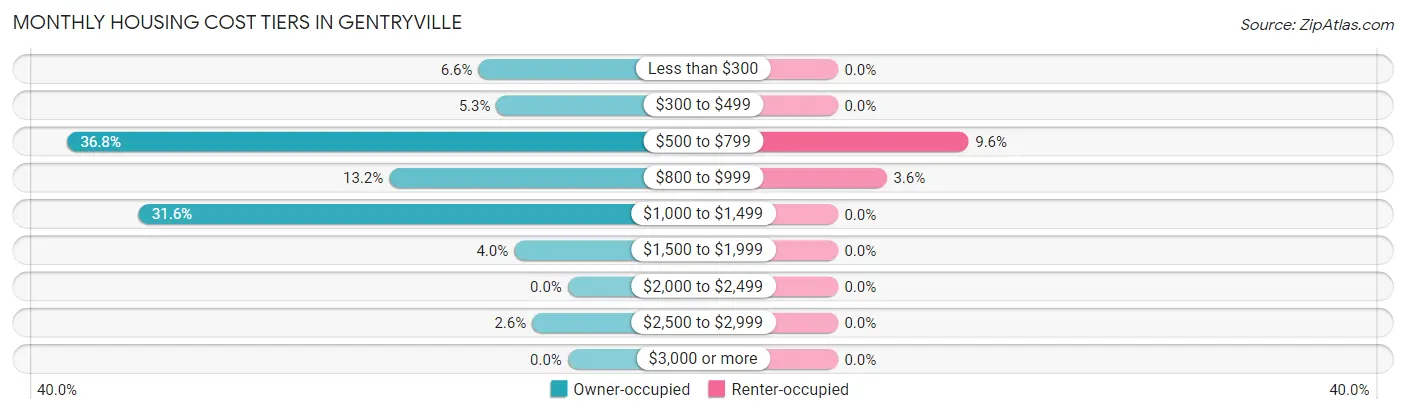
| Monthly Cost | Owner-occupied | Renter-occupied |
| Less than $300 | 5 (6.6%) | 0 (0.0%) |
| $300 to $499 | 4 (5.3%) | 0 (0.0%) |
| $500 to $799 | 28 (36.8%) | 8 (9.6%) |
| $800 to $999 | 10 (13.2%) | 3 (3.6%) |
| $1,000 to $1,499 | 24 (31.6%) | 0 (0.0%) |
| $1,500 to $1,999 | 3 (4.0%) | 0 (0.0%) |
| $2,000 to $2,499 | 0 (0.0%) | 0 (0.0%) |
| $2,500 to $2,999 | 2 (2.6%) | 0 (0.0%) |
| $3,000 or more | 0 (0.0%) | 0 (0.0%) |
| Total | 76 (100.0%) | 83 (100.0%) |
Physical Housing Characteristics in Gentryville
Housing Structures in Gentryville
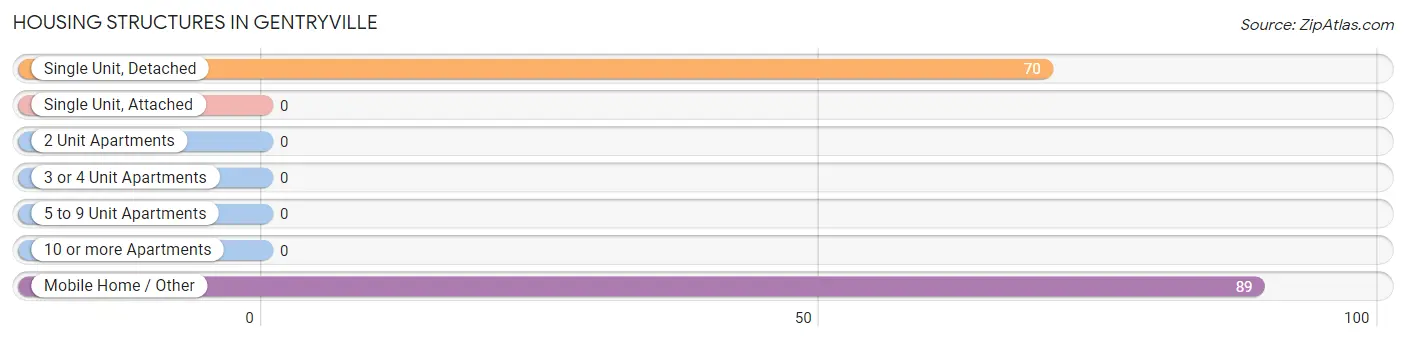
| Structure Type | # Housing Units | % Housing Units |
| Single Unit, Detached | 70 | 44.0% |
| Single Unit, Attached | 0 | 0.0% |
| 2 Unit Apartments | 0 | 0.0% |
| 3 or 4 Unit Apartments | 0 | 0.0% |
| 5 to 9 Unit Apartments | 0 | 0.0% |
| 10 or more Apartments | 0 | 0.0% |
| Mobile Home / Other | 89 | 56.0% |
| Total | 159 | 100.0% |
Housing Structures by Occupancy in Gentryville
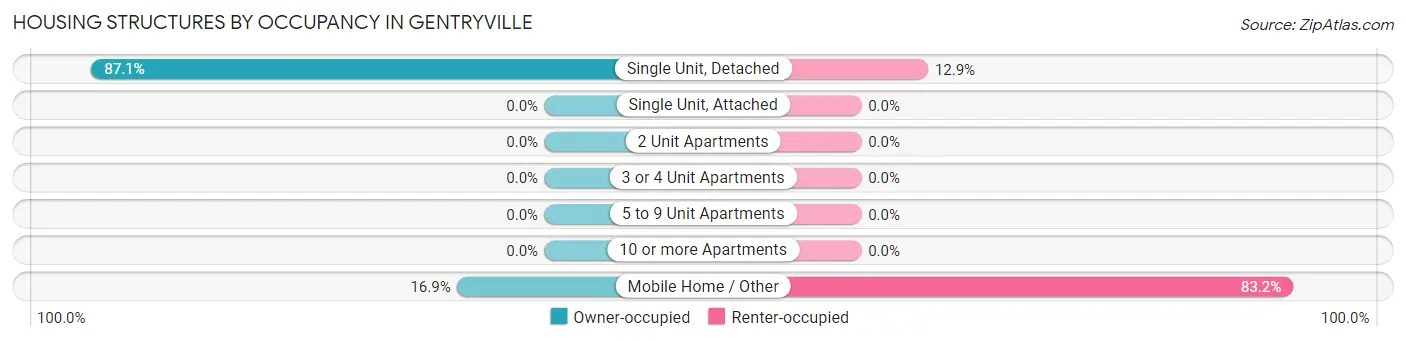
| Structure Type | Owner-occupied | Renter-occupied |
| Single Unit, Detached | 61 (87.1%) | 9 (12.9%) |
| Single Unit, Attached | 0 (0.0%) | 0 (0.0%) |
| 2 Unit Apartments | 0 (0.0%) | 0 (0.0%) |
| 3 or 4 Unit Apartments | 0 (0.0%) | 0 (0.0%) |
| 5 to 9 Unit Apartments | 0 (0.0%) | 0 (0.0%) |
| 10 or more Apartments | 0 (0.0%) | 0 (0.0%) |
| Mobile Home / Other | 15 (16.9%) | 74 (83.2%) |
| Total | 76 (47.8%) | 83 (52.2%) |
Housing Structures by Number of Rooms in Gentryville
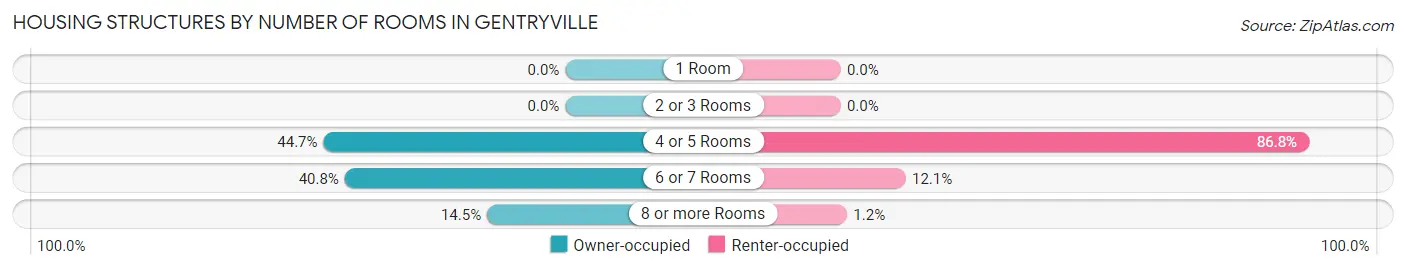
| Number of Rooms | Owner-occupied | Renter-occupied |
| 1 Room | 0 (0.0%) | 0 (0.0%) |
| 2 or 3 Rooms | 0 (0.0%) | 0 (0.0%) |
| 4 or 5 Rooms | 34 (44.7%) | 72 (86.8%) |
| 6 or 7 Rooms | 31 (40.8%) | 10 (12.0%) |
| 8 or more Rooms | 11 (14.5%) | 1 (1.2%) |
| Total | 76 (100.0%) | 83 (100.0%) |
Housing Structure by Heating Type in Gentryville
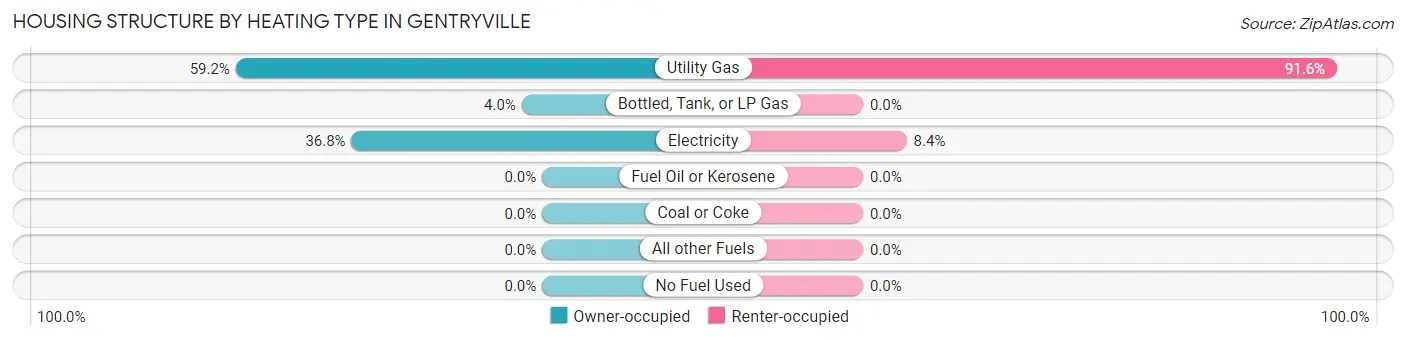
| Heating Type | Owner-occupied | Renter-occupied |
| Utility Gas | 45 (59.2%) | 76 (91.6%) |
| Bottled, Tank, or LP Gas | 3 (4.0%) | 0 (0.0%) |
| Electricity | 28 (36.8%) | 7 (8.4%) |
| Fuel Oil or Kerosene | 0 (0.0%) | 0 (0.0%) |
| Coal or Coke | 0 (0.0%) | 0 (0.0%) |
| All other Fuels | 0 (0.0%) | 0 (0.0%) |
| No Fuel Used | 0 (0.0%) | 0 (0.0%) |
| Total | 76 (100.0%) | 83 (100.0%) |
Household Vehicle Usage in Gentryville
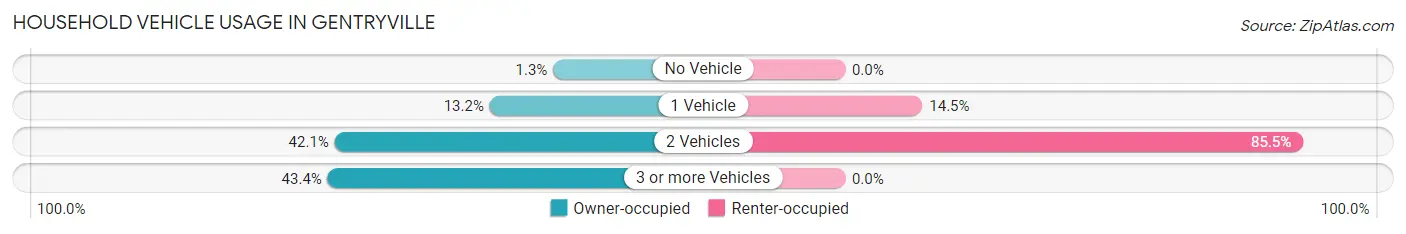
| Vehicles per Household | Owner-occupied | Renter-occupied |
| No Vehicle | 1 (1.3%) | 0 (0.0%) |
| 1 Vehicle | 10 (13.2%) | 12 (14.5%) |
| 2 Vehicles | 32 (42.1%) | 71 (85.5%) |
| 3 or more Vehicles | 33 (43.4%) | 0 (0.0%) |
| Total | 76 (100.0%) | 83 (100.0%) |
Real Estate & Mortgages in Gentryville
Real Estate and Mortgage Overview in Gentryville
| Characteristic | Without Mortgage | With Mortgage |
| Housing Units | 28 | 48 |
| Median Property Value | $66,700 | $135,000 |
| Median Household Income | $57,500 | $3 |
| Monthly Housing Costs | $543 | $0 |
| Real Estate Taxes | $1,000 | $2 |
Property Value by Mortgage Status in Gentryville
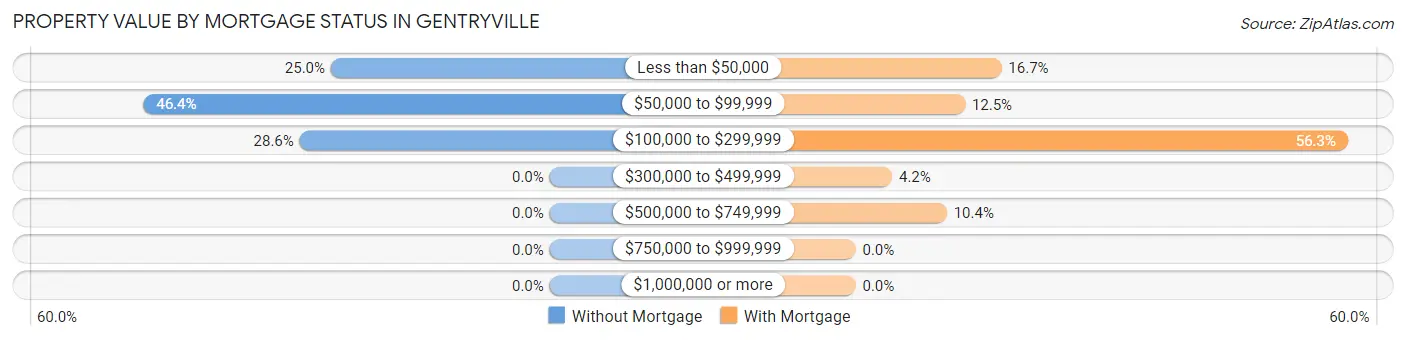
| Property Value | Without Mortgage | With Mortgage |
| Less than $50,000 | 7 (25.0%) | 8 (16.7%) |
| $50,000 to $99,999 | 13 (46.4%) | 6 (12.5%) |
| $100,000 to $299,999 | 8 (28.6%) | 27 (56.2%) |
| $300,000 to $499,999 | 0 (0.0%) | 2 (4.2%) |
| $500,000 to $749,999 | 0 (0.0%) | 5 (10.4%) |
| $750,000 to $999,999 | 0 (0.0%) | 0 (0.0%) |
| $1,000,000 or more | 0 (0.0%) | 0 (0.0%) |
| Total | 28 (100.0%) | 48 (100.0%) |
Household Income by Mortgage Status in Gentryville
| Household Income | Without Mortgage | With Mortgage |
| Less than $10,000 | 0 (0.0%) | 1 (2.1%) |
| $10,000 to $24,999 | 1 (3.6%) | 1 (2.1%) |
| $25,000 to $34,999 | 2 (7.1%) | 4 (8.3%) |
| $35,000 to $49,999 | 9 (32.1%) | 0 (0.0%) |
| $50,000 to $74,999 | 7 (25.0%) | 4 (8.3%) |
| $75,000 to $99,999 | 2 (7.1%) | 14 (29.2%) |
| $100,000 to $149,999 | 6 (21.4%) | 15 (31.2%) |
| $150,000 or more | 1 (3.6%) | 7 (14.6%) |
| Total | 28 (100.0%) | 48 (100.0%) |
Property Value to Household Income Ratio in Gentryville
| Value-to-Income Ratio | Without Mortgage | With Mortgage |
| Less than 2.0x | 19 (67.9%) | 75,625 (157,552.1%) |
| 2.0x to 2.9x | 5 (17.9%) | 25 (52.1%) |
| 3.0x to 3.9x | 2 (7.1%) | 14 (29.2%) |
| 4.0x or more | 2 (7.1%) | 1 (2.1%) |
| Total | 28 (100.0%) | 48 (100.0%) |
Real Estate Taxes by Mortgage Status in Gentryville
| Property Taxes | Without Mortgage | With Mortgage |
| Less than $800 | 13 (46.4%) | 0 (0.0%) |
| $800 to $1,499 | 9 (32.1%) | 20 (41.7%) |
| $800 to $1,499 | 6 (21.4%) | 12 (25.0%) |
| Total | 28 (100.0%) | 48 (100.0%) |
Health & Disability in Gentryville
Health Insurance Coverage by Age in Gentryville
| Age Bracket | With Coverage | Without Coverage |
| Under 6 Years | 12 (100.0%) | 0 (0.0%) |
| 6 to 18 Years | 40 (100.0%) | 0 (0.0%) |
| 19 to 25 Years | 12 (44.4%) | 15 (55.6%) |
| 26 to 34 Years | 6 (75.0%) | 2 (25.0%) |
| 35 to 44 Years | 26 (100.0%) | 0 (0.0%) |
| 45 to 54 Years | 35 (100.0%) | 0 (0.0%) |
| 55 to 64 Years | 37 (94.9%) | 2 (5.1%) |
| 65 to 74 Years | 106 (100.0%) | 0 (0.0%) |
| 75 Years and older | 18 (100.0%) | 0 (0.0%) |
| Total | 292 (93.9%) | 19 (6.1%) |
Health Insurance Coverage by Citizenship Status in Gentryville
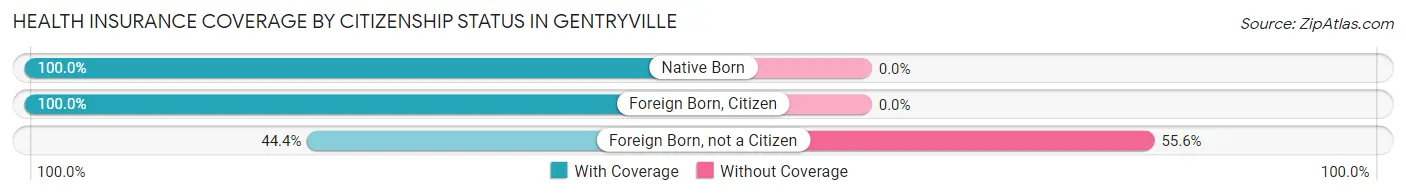
| Citizenship Status | With Coverage | Without Coverage |
| Native Born | 12 (100.0%) | 0 (0.0%) |
| Foreign Born, Citizen | 40 (100.0%) | 0 (0.0%) |
| Foreign Born, not a Citizen | 12 (44.4%) | 15 (55.6%) |
Health Insurance Coverage by Household Income in Gentryville
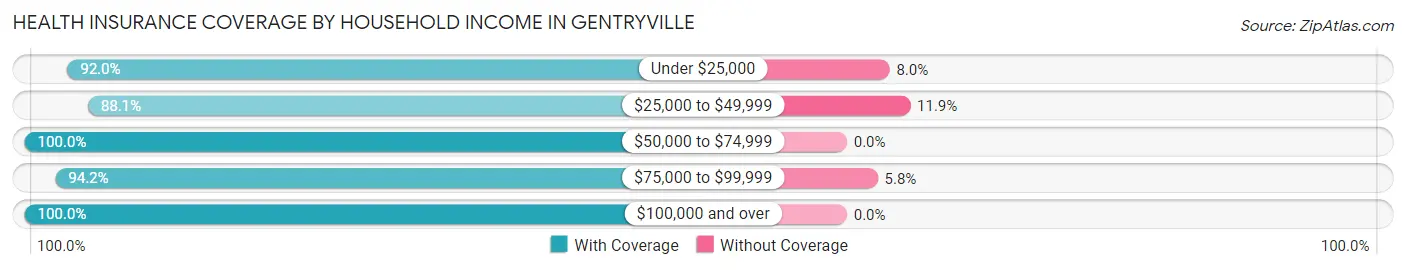
| Household Income | With Coverage | Without Coverage |
| Under $25,000 | 23 (92.0%) | 2 (8.0%) |
| $25,000 to $49,999 | 104 (88.1%) | 14 (11.9%) |
| $50,000 to $74,999 | 58 (100.0%) | 0 (0.0%) |
| $75,000 to $99,999 | 49 (94.2%) | 3 (5.8%) |
| $100,000 and over | 58 (100.0%) | 0 (0.0%) |
Public vs Private Health Insurance Coverage by Age in Gentryville
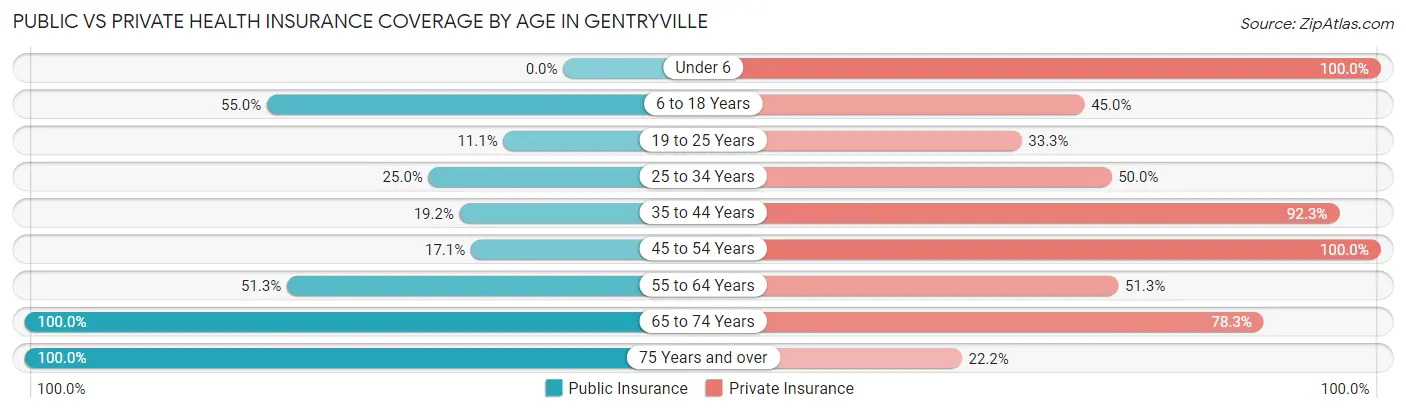
| Age Bracket | Public Insurance | Private Insurance |
| Under 6 | 0 (0.0%) | 12 (100.0%) |
| 6 to 18 Years | 22 (55.0%) | 18 (45.0%) |
| 19 to 25 Years | 3 (11.1%) | 9 (33.3%) |
| 25 to 34 Years | 2 (25.0%) | 4 (50.0%) |
| 35 to 44 Years | 5 (19.2%) | 24 (92.3%) |
| 45 to 54 Years | 6 (17.1%) | 35 (100.0%) |
| 55 to 64 Years | 20 (51.3%) | 20 (51.3%) |
| 65 to 74 Years | 106 (100.0%) | 83 (78.3%) |
| 75 Years and over | 18 (100.0%) | 4 (22.2%) |
| Total | 182 (58.5%) | 209 (67.2%) |
Disability Status by Sex by Age in Gentryville
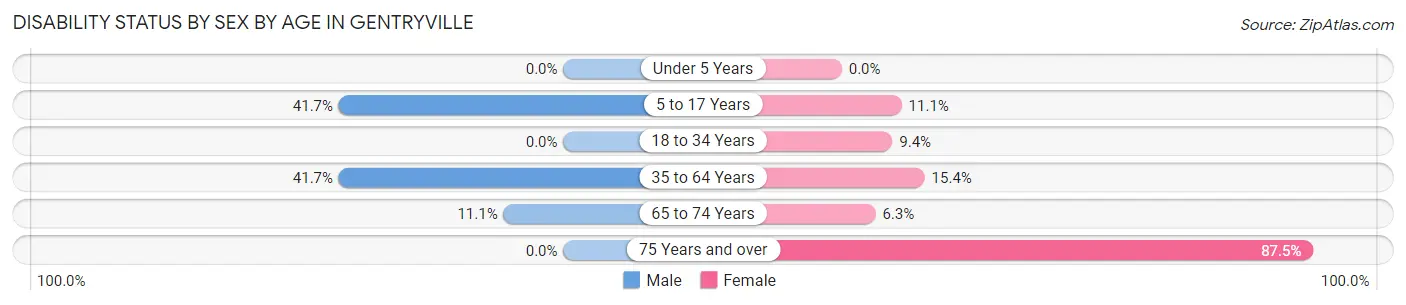
| Age Bracket | Male | Female |
| Under 5 Years | 0 (0.0%) | 0 (0.0%) |
| 5 to 17 Years | 5 (41.7%) | 3 (11.1%) |
| 18 to 34 Years | 0 (0.0%) | 3 (9.4%) |
| 35 to 64 Years | 20 (41.7%) | 8 (15.4%) |
| 65 to 74 Years | 10 (11.1%) | 1 (6.2%) |
| 75 Years and over | 0 (0.0%) | 14 (87.5%) |
Disability Class by Sex by Age in Gentryville
Disability Class: Hearing Difficulty
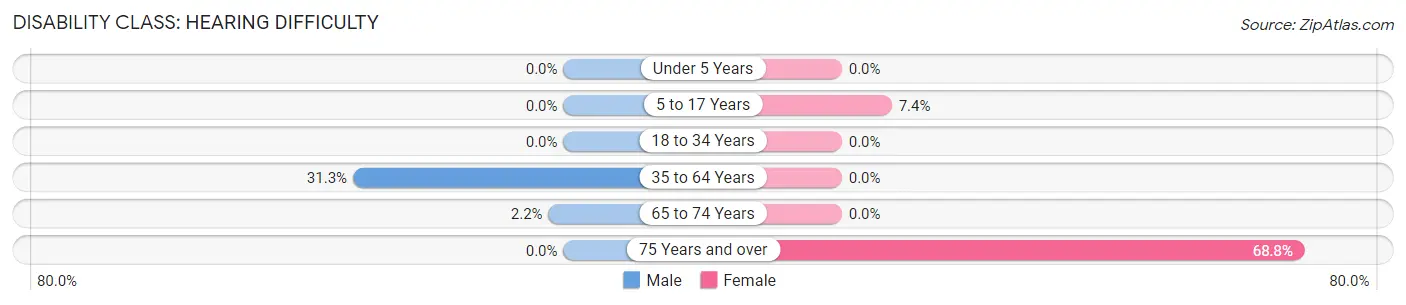
| Age Bracket | Male | Female |
| Under 5 Years | 0 (0.0%) | 0 (0.0%) |
| 5 to 17 Years | 0 (0.0%) | 2 (7.4%) |
| 18 to 34 Years | 0 (0.0%) | 0 (0.0%) |
| 35 to 64 Years | 15 (31.2%) | 0 (0.0%) |
| 65 to 74 Years | 2 (2.2%) | 0 (0.0%) |
| 75 Years and over | 0 (0.0%) | 11 (68.8%) |
Disability Class: Vision Difficulty
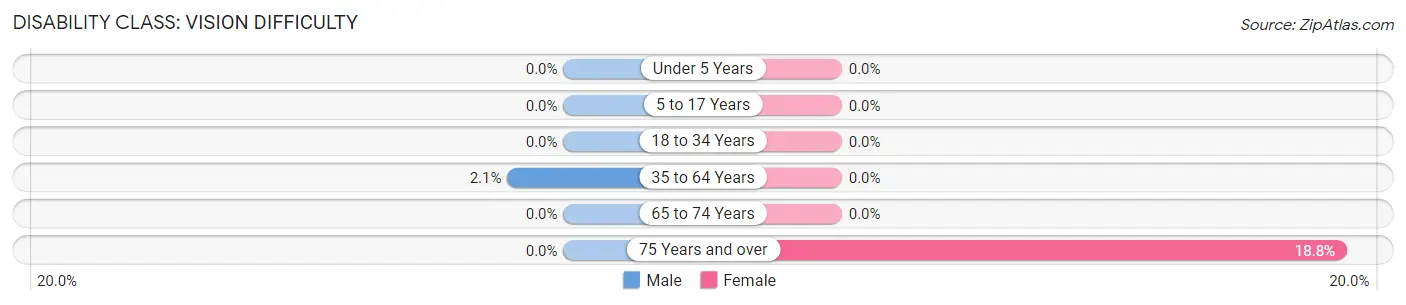
| Age Bracket | Male | Female |
| Under 5 Years | 0 (0.0%) | 0 (0.0%) |
| 5 to 17 Years | 0 (0.0%) | 0 (0.0%) |
| 18 to 34 Years | 0 (0.0%) | 0 (0.0%) |
| 35 to 64 Years | 1 (2.1%) | 0 (0.0%) |
| 65 to 74 Years | 0 (0.0%) | 0 (0.0%) |
| 75 Years and over | 0 (0.0%) | 3 (18.8%) |
Disability Class: Cognitive Difficulty
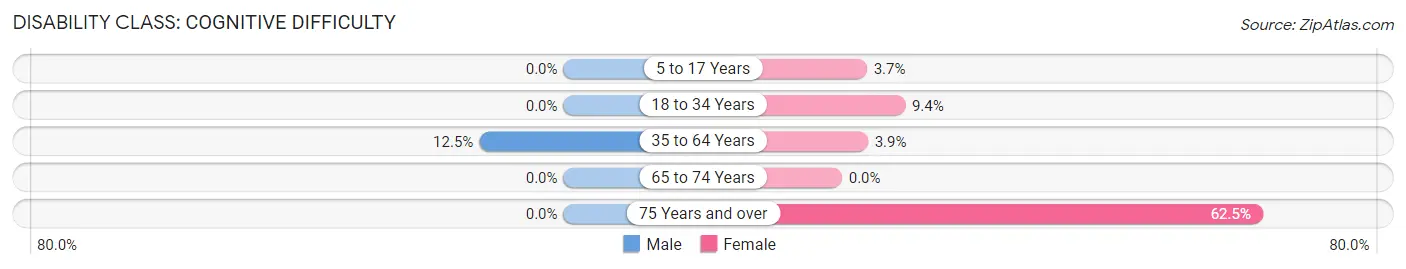
| Age Bracket | Male | Female |
| 5 to 17 Years | 0 (0.0%) | 1 (3.7%) |
| 18 to 34 Years | 0 (0.0%) | 3 (9.4%) |
| 35 to 64 Years | 6 (12.5%) | 2 (3.8%) |
| 65 to 74 Years | 0 (0.0%) | 0 (0.0%) |
| 75 Years and over | 0 (0.0%) | 10 (62.5%) |
Disability Class: Ambulatory Difficulty
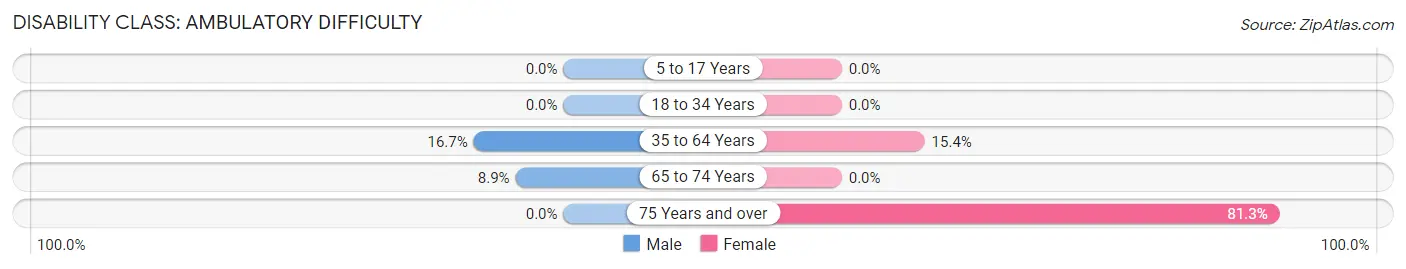
| Age Bracket | Male | Female |
| 5 to 17 Years | 0 (0.0%) | 0 (0.0%) |
| 18 to 34 Years | 0 (0.0%) | 0 (0.0%) |
| 35 to 64 Years | 8 (16.7%) | 8 (15.4%) |
| 65 to 74 Years | 8 (8.9%) | 0 (0.0%) |
| 75 Years and over | 0 (0.0%) | 13 (81.2%) |
Disability Class: Self-Care Difficulty
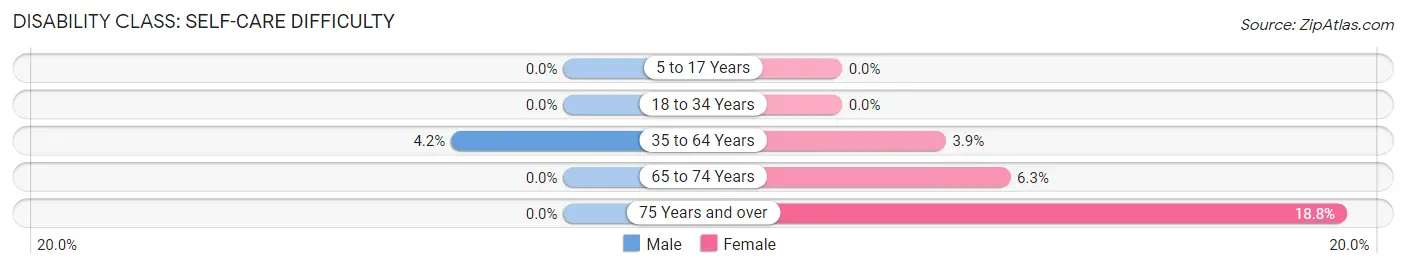
| Age Bracket | Male | Female |
| 5 to 17 Years | 0 (0.0%) | 0 (0.0%) |
| 18 to 34 Years | 0 (0.0%) | 0 (0.0%) |
| 35 to 64 Years | 2 (4.2%) | 2 (3.8%) |
| 65 to 74 Years | 0 (0.0%) | 1 (6.2%) |
| 75 Years and over | 0 (0.0%) | 3 (18.8%) |
Technology Access in Gentryville
Computing Device Access in Gentryville
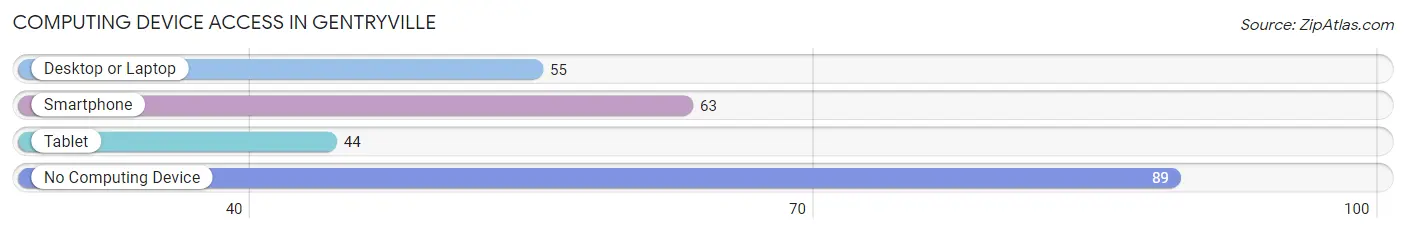
| Device Type | # Households | % Households |
| Desktop or Laptop | 55 | 34.6% |
| Smartphone | 63 | 39.6% |
| Tablet | 44 | 27.7% |
| No Computing Device | 89 | 56.0% |
| Total | 159 | 100.0% |
Internet Access in Gentryville
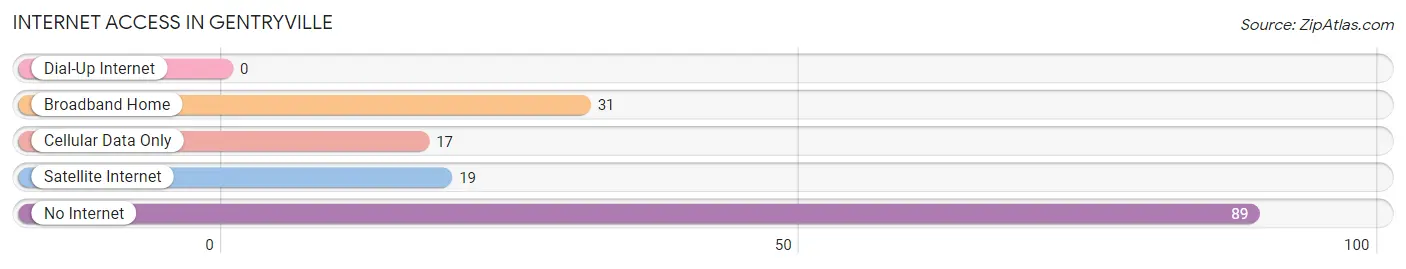
| Internet Type | # Households | % Households |
| Dial-Up Internet | 0 | 0.0% |
| Broadband Home | 31 | 19.5% |
| Cellular Data Only | 17 | 10.7% |
| Satellite Internet | 19 | 11.9% |
| No Internet | 89 | 56.0% |
| Total | 159 | 100.0% |
Gentryville Summary
Gentryville is a small town located in Spencer County, Indiana, United States. It is situated on the banks of the Patoka River, about 10 miles east of the county seat of Rockport. The population of Gentryville was estimated to be 545 in the year 2000.
History
Gentryville was founded in 1837 by William Gentry, a local landowner. Gentry had purchased the land from the federal government in 1835 and began to develop the area. He built a sawmill and a gristmill, and the town soon became a center of commerce for the surrounding area. The town was officially incorporated in 1845.
Gentryville was a thriving community in the late 19th century, with a population of over 1,000 people. The town had several stores, a hotel, a bank, a post office, and a newspaper. The town was also home to a number of churches, including the Methodist Episcopal Church, the Baptist Church, and the Presbyterian Church.
In the early 20th century, Gentryville began to decline. The population dropped to just over 500 by the year 2000. The decline was due to a number of factors, including the decline of the local agricultural economy and the lack of industry in the area.
Geography
Gentryville is located in the southwestern corner of Spencer County, Indiana. It is situated on the banks of the Patoka River, about 10 miles east of the county seat of Rockport. The town is surrounded by rolling hills and farmland. The climate is humid continental, with hot summers and cold winters.
Economy
The economy of Gentryville is largely based on agriculture. The town is home to several farms, which produce corn, soybeans, and wheat. There are also several small businesses in the area, including a grocery store, a hardware store, and a few restaurants.
Demographics
As of the year 2000, the population of Gentryville was estimated to be 545. The racial makeup of the town was 97.3% White, 0.7% African American, 0.2% Native American, 0.2% Asian, and 1.6% from other races. The median household income was $30,000, and the median family income was $35,000. The per capita income was $14,000.
Conclusion
Gentryville is a small town located in Spencer County, Indiana. It was founded in 1837 and has a population of 545 as of the year 2000. The economy of Gentryville is largely based on agriculture, and the town is home to several small businesses. The racial makeup of the town is predominantly White, with a small percentage of African American, Native American, and Asian residents.
Common Questions
What is Per Capita Income in Gentryville?
Per Capita income in Gentryville is $30,987.
What is the Median Family Income in Gentryville?
Median Family Income in Gentryville is $62,000.
What is the Median Household income in Gentryville?
Median Household Income in Gentryville is $46,901.
What is Inequality or Gini Index in Gentryville?
Inequality or Gini Index in Gentryville is 0.26.
What is the Total Population of Gentryville?
Total Population of Gentryville is 311.
What is the Total Male Population of Gentryville?
Total Male Population of Gentryville is 160.
What is the Total Female Population of Gentryville?
Total Female Population of Gentryville is 151.
What is the Ratio of Males per 100 Females in Gentryville?
There are 105.96 Males per 100 Females in Gentryville.
What is the Ratio of Females per 100 Males in Gentryville?
There are 94.38 Females per 100 Males in Gentryville.
What is the Median Population Age in Gentryville?
Median Population Age in Gentryville is 57.7 Years.
What is the Average Family Size in Gentryville
Average Family Size in Gentryville is 2.9 People.
What is the Average Household Size in Gentryville
Average Household Size in Gentryville is 2.0 People.
How Large is the Labor Force in Gentryville?
There are 100 People in the Labor Forcein in Gentryville.
What is the Percentage of People in the Labor Force in Gentryville?
36.9% of People are in the Labor Force in Gentryville.
What is the Unemployment Rate in Gentryville?
Unemployment Rate in Gentryville is 6.0%.