Zip Codes with the Highest Percentage of Population Employed in Real Estate, Rental & Leasing in Indiana
RELATED REPORTS & OPTIONS
Real Estate, Rental & Leasing
Indiana
Compare Zip Codes
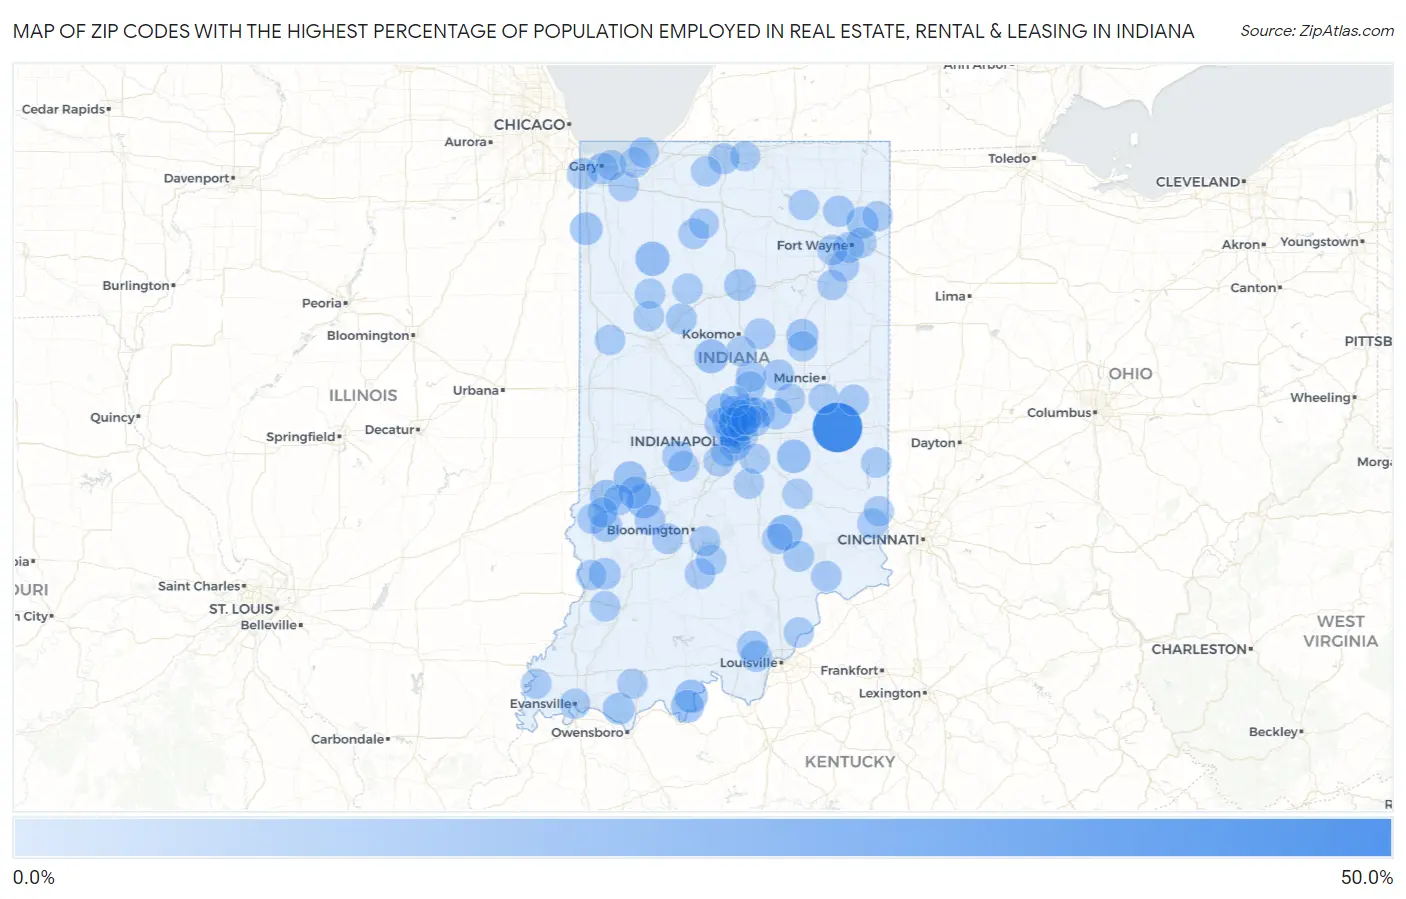
Map of Zip Codes with the Highest Percentage of Population Employed in Real Estate, Rental & Leasing in Indiana
0.0%
50.0%
Zip Codes with the Highest Percentage of Population Employed in Real Estate, Rental & Leasing in Indiana
| Zip Code | % Employed | vs State | vs National | |
| 1. | 47366 | 44.4% | 1.4%(+43.0)#1 | 1.9%(+42.6)#21 |
| 2. | 47236 | 12.5% | 1.4%(+11.1)#2 | 1.9%(+10.6)#244 |
| 3. | 47946 | 10.7% | 1.4%(+9.24)#3 | 1.9%(+8.79)#331 |
| 4. | 47833 | 10.2% | 1.4%(+8.74)#4 | 1.9%(+8.28)#367 |
| 5. | 46057 | 10.2% | 1.4%(+8.73)#5 | 1.9%(+8.28)#368 |
| 6. | 46144 | 9.0% | 1.4%(+7.60)#6 | 1.9%(+7.15)#460 |
| 7. | 47525 | 8.2% | 1.4%(+6.81)#7 | 1.9%(+6.36)#521 |
| 8. | 47871 | 7.7% | 1.4%(+6.30)#8 | 1.9%(+5.84)#598 |
| 9. | 47574 | 7.7% | 1.4%(+6.26)#9 | 1.9%(+5.80)#609 |
| 10. | 46376 | 7.4% | 1.4%(+5.97)#10 | 1.9%(+5.52)#657 |
| 11. | 47857 | 7.1% | 1.4%(+5.66)#11 | 1.9%(+5.20)#716 |
| 12. | 47840 | 6.4% | 1.4%(+4.92)#12 | 1.9%(+4.47)#867 |
| 13. | 46933 | 6.1% | 1.4%(+4.65)#13 | 1.9%(+4.20)#944 |
| 14. | 46765 | 5.7% | 1.4%(+4.22)#14 | 1.9%(+3.77)#1,094 |
| 15. | 47634 | 5.3% | 1.4%(+3.83)#15 | 1.9%(+3.38)#1,261 |
| 16. | 46958 | 5.2% | 1.4%(+3.75)#16 | 1.9%(+3.29)#1,297 |
| 17. | 47535 | 5.0% | 1.4%(+3.52)#17 | 1.9%(+3.07)#1,419 |
| 18. | 47855 | 4.7% | 1.4%(+3.22)#18 | 1.9%(+2.76)#1,602 |
| 19. | 46048 | 4.6% | 1.4%(+3.15)#19 | 1.9%(+2.69)#1,652 |
| 20. | 46763 | 4.4% | 1.4%(+2.94)#20 | 1.9%(+2.48)#1,812 |
| 21. | 46407 | 4.3% | 1.4%(+2.84)#21 | 1.9%(+2.39)#1,882 |
| 22. | 47122 | 4.2% | 1.4%(+2.75)#22 | 1.9%(+2.29)#1,975 |
| 23. | 46228 | 4.1% | 1.4%(+2.67)#23 | 1.9%(+2.21)#2,053 |
| 24. | 47124 | 3.9% | 1.4%(+2.47)#24 | 1.9%(+2.02)#2,275 |
| 25. | 46321 | 3.9% | 1.4%(+2.45)#25 | 1.9%(+2.00)#2,289 |
| 26. | 47282 | 3.8% | 1.4%(+2.32)#26 | 1.9%(+1.87)#2,435 |
| 27. | 46044 | 3.7% | 1.4%(+2.26)#27 | 1.9%(+1.80)#2,527 |
| 28. | 46923 | 3.7% | 1.4%(+2.25)#28 | 1.9%(+1.79)#2,543 |
| 29. | 46613 | 3.6% | 1.4%(+2.17)#29 | 1.9%(+1.72)#2,655 |
| 30. | 46208 | 3.6% | 1.4%(+2.16)#30 | 1.9%(+1.70)#2,676 |
| 31. | 46225 | 3.5% | 1.4%(+2.11)#31 | 1.9%(+1.65)#2,763 |
| 32. | 46033 | 3.5% | 1.4%(+2.05)#32 | 1.9%(+1.59)#2,867 |
| 33. | 46037 | 3.5% | 1.4%(+2.05)#33 | 1.9%(+1.59)#2,876 |
| 34. | 47358 | 3.3% | 1.4%(+1.88)#34 | 1.9%(+1.43)#3,168 |
| 35. | 46278 | 3.3% | 1.4%(+1.85)#35 | 1.9%(+1.39)#3,249 |
| 36. | 47250 | 3.3% | 1.4%(+1.82)#36 | 1.9%(+1.37)#3,298 |
| 37. | 46798 | 3.3% | 1.4%(+1.81)#37 | 1.9%(+1.36)#3,321 |
| 38. | 46031 | 3.2% | 1.4%(+1.79)#38 | 1.9%(+1.33)#3,367 |
| 39. | 46936 | 3.2% | 1.4%(+1.77)#39 | 1.9%(+1.31)#3,404 |
| 40. | 47431 | 3.1% | 1.4%(+1.68)#40 | 1.9%(+1.22)#3,590 |
| 41. | 46180 | 3.1% | 1.4%(+1.63)#41 | 1.9%(+1.17)#3,729 |
| 42. | 46240 | 3.1% | 1.4%(+1.61)#42 | 1.9%(+1.16)#3,757 |
| 43. | 47846 | 3.0% | 1.4%(+1.60)#43 | 1.9%(+1.15)#3,787 |
| 44. | 47232 | 3.0% | 1.4%(+1.57)#44 | 1.9%(+1.12)#3,876 |
| 45. | 47459 | 3.0% | 1.4%(+1.55)#45 | 1.9%(+1.10)#3,925 |
| 46. | 47421 | 2.9% | 1.4%(+1.50)#46 | 1.9%(+1.05)#4,062 |
| 47. | 46218 | 2.9% | 1.4%(+1.48)#47 | 1.9%(+1.03)#4,118 |
| 48. | 46077 | 2.9% | 1.4%(+1.48)#48 | 1.9%(+1.03)#4,122 |
| 49. | 46802 | 2.9% | 1.4%(+1.46)#49 | 1.9%(+1.01)#4,176 |
| 50. | 46121 | 2.9% | 1.4%(+1.45)#50 | 1.9%(+0.999)#4,197 |
| 51. | 47850 | 2.9% | 1.4%(+1.45)#51 | 1.9%(+0.994)#4,213 |
| 52. | 46034 | 2.8% | 1.4%(+1.32)#52 | 1.9%(+0.866)#4,551 |
| 53. | 46814 | 2.8% | 1.4%(+1.31)#53 | 1.9%(+0.859)#4,583 |
| 54. | 46960 | 2.7% | 1.4%(+1.29)#54 | 1.9%(+0.837)#4,657 |
| 55. | 47436 | 2.7% | 1.4%(+1.27)#55 | 1.9%(+0.814)#4,726 |
| 56. | 47923 | 2.7% | 1.4%(+1.27)#56 | 1.9%(+0.809)#4,743 |
| 57. | 46221 | 2.7% | 1.4%(+1.25)#57 | 1.9%(+0.791)#4,797 |
| 58. | 46268 | 2.7% | 1.4%(+1.25)#58 | 1.9%(+0.791)#4,800 |
| 59. | 46760 | 2.7% | 1.4%(+1.24)#59 | 1.9%(+0.783)#4,828 |
| 60. | 46554 | 2.7% | 1.4%(+1.23)#60 | 1.9%(+0.777)#4,861 |
| 61. | 46202 | 2.7% | 1.4%(+1.22)#61 | 1.9%(+0.760)#4,929 |
| 62. | 46038 | 2.6% | 1.4%(+1.21)#62 | 1.9%(+0.754)#4,944 |
| 63. | 46815 | 2.6% | 1.4%(+1.21)#63 | 1.9%(+0.750)#4,965 |
| 64. | 46032 | 2.6% | 1.4%(+1.16)#64 | 1.9%(+0.707)#5,107 |
| 65. | 47022 | 2.6% | 1.4%(+1.12)#65 | 1.9%(+0.669)#5,245 |
| 66. | 46385 | 2.5% | 1.4%(+1.11)#66 | 1.9%(+0.654)#5,308 |
| 67. | 47353 | 2.5% | 1.4%(+1.10)#67 | 1.9%(+0.645)#5,342 |
| 68. | 47386 | 2.5% | 1.4%(+1.10)#68 | 1.9%(+0.643)#5,358 |
| 69. | 47866 | 2.5% | 1.4%(+1.09)#69 | 1.9%(+0.635)#5,387 |
| 70. | 47401 | 2.5% | 1.4%(+1.07)#70 | 1.9%(+0.618)#5,447 |
| 71. | 46280 | 2.5% | 1.4%(+1.07)#71 | 1.9%(+0.617)#5,452 |
| 72. | 46220 | 2.5% | 1.4%(+1.04)#72 | 1.9%(+0.589)#5,557 |
| 73. | 46113 | 2.5% | 1.4%(+1.03)#73 | 1.9%(+0.578)#5,594 |
| 74. | 47975 | 2.5% | 1.4%(+1.03)#74 | 1.9%(+0.577)#5,597 |
| 75. | 46930 | 2.5% | 1.4%(+1.03)#75 | 1.9%(+0.577)#5,598 |
| 76. | 47926 | 2.5% | 1.4%(+1.02)#76 | 1.9%(+0.567)#5,633 |
| 77. | 46304 | 2.5% | 1.4%(+1.02)#77 | 1.9%(+0.566)#5,640 |
| 78. | 47980 | 2.4% | 1.4%(+1.00)#78 | 1.9%(+0.547)#5,722 |
| 79. | 46013 | 2.4% | 1.4%(+0.999)#79 | 1.9%(+0.544)#5,739 |
| 80. | 47111 | 2.4% | 1.4%(+0.993)#80 | 1.9%(+0.537)#5,766 |
| 81. | 47597 | 2.4% | 1.4%(+0.991)#81 | 1.9%(+0.535)#5,774 |
| 82. | 47631 | 2.4% | 1.4%(+0.988)#82 | 1.9%(+0.532)#5,787 |
| 83. | 46770 | 2.4% | 1.4%(+0.960)#83 | 1.9%(+0.504)#5,911 |
| 84. | 46260 | 2.4% | 1.4%(+0.956)#84 | 1.9%(+0.500)#5,929 |
| 85. | 46301 | 2.4% | 1.4%(+0.945)#85 | 1.9%(+0.489)#5,973 |
| 86. | 47537 | 2.4% | 1.4%(+0.934)#86 | 1.9%(+0.478)#6,020 |
| 87. | 47561 | 2.3% | 1.4%(+0.890)#87 | 1.9%(+0.434)#6,200 |
| 88. | 46131 | 2.3% | 1.4%(+0.882)#88 | 1.9%(+0.426)#6,229 |
| 89. | 46256 | 2.3% | 1.4%(+0.860)#89 | 1.9%(+0.405)#6,318 |
| 90. | 47708 | 2.3% | 1.4%(+0.860)#90 | 1.9%(+0.404)#6,321 |
| 91. | 46259 | 2.3% | 1.4%(+0.839)#91 | 1.9%(+0.384)#6,427 |
| 92. | 46074 | 2.3% | 1.4%(+0.839)#92 | 1.9%(+0.383)#6,430 |
| 93. | 46403 | 2.3% | 1.4%(+0.828)#93 | 1.9%(+0.372)#6,494 |
| 94. | 46788 | 2.3% | 1.4%(+0.816)#94 | 1.9%(+0.361)#6,558 |
| 95. | 47272 | 2.3% | 1.4%(+0.816)#95 | 1.9%(+0.360)#6,562 |
| 96. | 47060 | 2.2% | 1.4%(+0.800)#96 | 1.9%(+0.344)#6,629 |
| 97. | 46511 | 2.2% | 1.4%(+0.797)#97 | 1.9%(+0.342)#6,643 |
| 98. | 46068 | 2.2% | 1.4%(+0.797)#98 | 1.9%(+0.341)#6,645 |
| 99. | 46250 | 2.2% | 1.4%(+0.792)#99 | 1.9%(+0.336)#6,675 |
| 100. | 46561 | 2.2% | 1.4%(+0.791)#100 | 1.9%(+0.335)#6,677 |
Common Questions
What are the Top 10 Zip Codes with the Highest Percentage of Population Employed in Real Estate, Rental & Leasing in Indiana?
Top 10 Zip Codes with the Highest Percentage of Population Employed in Real Estate, Rental & Leasing in Indiana are:
What zip code has the Highest Percentage of Population Employed in Real Estate, Rental & Leasing in Indiana?
47366 has the Highest Percentage of Population Employed in Real Estate, Rental & Leasing in Indiana with 44.4%.
What is the Percentage of Population Employed in Real Estate, Rental & Leasing in the State of Indiana?
Percentage of Population Employed in Real Estate, Rental & Leasing in Indiana is 1.4%.
What is the Percentage of Population Employed in Real Estate, Rental & Leasing in the United States?
Percentage of Population Employed in Real Estate, Rental & Leasing in the United States is 1.9%.