Zip Codes with the Highest Percentage of Population Employed in Real Estate, Rental & Leasing in Indianapolis, IN

RELATED REPORTS & OPTIONS

Real Estate, Rental & Leasing
Population
Families and Households
Female Fertility
Female Fertility (Unmarried)
Race (Community Size)
Race (Percentage)
Ancestry (Community Size)
AfghanAfricanAlaskan AthabascanAlbanianAlsatianAmericanApacheArabArgentineanArmenianAustralianAustrianBahamianBangladeshiBarbadianBasqueBelgianBelizeanBhutaneseBlackfeetBolivianBrazilianBritishBritish West IndianBulgarianBurmeseCajunCanadianCelticCentral AmericanCentral American IndianCherokeeChickasawChileanChippewaChoctawColombianCosta RicanCroatianCrowCubanCzechCzechoslovakianDanishDominicanDutchEastern EuropeanEcuadorianEgyptianEnglishEstonianEthiopianEuropeanFilipinoFinnishFrenchFrench CanadianGermanGerman RussianGhanaianGreekGuamanian / ChamorroGuatemalanGuyaneseHaitianHonduranHopiHungarianIcelanderIndian (Asian)IndonesianInupiatIranianIraqiIrishIroquoisIsraeliItalianJamaicanJapaneseJordanianKenyanKoreanLaotianLatvianLebaneseLiberianLithuanianLuxembourgerMacedonianMalaysianMenomineeMexicanMexican American IndianMongolianMoroccanNative HawaiianNavajoNew ZealanderNicaraguanNigerianNorthern EuropeanNorwegianPakistaniPalestinianPanamanianPennsylvania GermanPeruvianPolishPortuguesePotawatomiPuerto RicanRomanianRussianSalvadoranSamoanScandinavianScotch-IrishScottishSeminoleSenegaleseSerbianSierra LeoneanSiouxSlavicSlovakSloveneSouth AfricanSouth AmericanSouth American IndianSpaniardSpanishSri LankanSubsaharan AfricanSudaneseSwedishSwissSyrianThaiTonganTrinidadian and TobagonianTurkishUgandanUkrainianUruguayanVenezuelanVietnameseWelshWest IndianYugoslavianZimbabwean
Ancestry (Percentage)
AfghanAfricanAlaskan AthabascanAlbanianAlsatianAmericanApacheArabArgentineanArmenianAustralianAustrianBahamianBangladeshiBarbadianBasqueBelgianBelizeanBhutaneseBlackfeetBolivianBrazilianBritishBritish West IndianBulgarianBurmeseCajunCanadianCelticCentral AmericanCentral American IndianCherokeeChickasawChileanChippewaChoctawColombianCosta RicanCroatianCrowCubanCzechCzechoslovakianDanishDominicanDutchEastern EuropeanEcuadorianEgyptianEnglishEstonianEthiopianEuropeanFilipinoFinnishFrenchFrench CanadianGermanGerman RussianGhanaianGreekGuamanian / ChamorroGuatemalanGuyaneseHaitianHonduranHopiHungarianIcelanderIndian (Asian)IndonesianInupiatIranianIraqiIrishIroquoisIsraeliItalianJamaicanJapaneseJordanianKenyanKoreanLaotianLatvianLebaneseLiberianLithuanianLuxembourgerMacedonianMalaysianMenomineeMexicanMexican American IndianMongolianMoroccanNative HawaiianNavajoNew ZealanderNicaraguanNigerianNorthern EuropeanNorwegianPakistaniPalestinianPanamanianPennsylvania GermanPeruvianPolishPortuguesePotawatomiPuerto RicanRomanianRussianSalvadoranSamoanScandinavianScotch-IrishScottishSeminoleSenegaleseSerbianSierra LeoneanSiouxSlavicSlovakSloveneSouth AfricanSouth AmericanSouth American IndianSpaniardSpanishSri LankanSubsaharan AfricanSudaneseSwedishSwissSyrianThaiTonganTrinidadian and TobagonianTurkishUgandanUkrainianUruguayanVenezuelanVietnameseWelshWest IndianYugoslavianZimbabwean
Immigrant Origin (Total)
AfghanistanAfricaArgentinaAsiaAustraliaAustriaBahamasBangladeshBarbadosBelarusBoliviaBosnia and HerzegovinaBrazilBulgariaBurma / MyanmarCambodiaCameroonCanadaCaribbeanCentral AmericaChileChinaColombiaCongoCosta RicaCubaDenmarkDominican RepublicEastern AfricaEastern AsiaEastern EuropeEcuadorEgyptEl SalvadorEnglandEritreaEthiopiaEuropeFranceGermanyGhanaGreeceGuatemalaGuyanaHaitiHondurasHong KongHungaryIndiaIndonesiaIranIraqIrelandIsraelItalyJamaicaJapanJordanKenyaKoreaLaosLatin AmericaLatviaLebanonLiberiaMalaysiaMexicoMiddle AfricaMoldovaMoroccoNepalNetherlandsNicaraguaNigeriaNorth MacedoniaNorthern AfricaNorthern EuropeNorwayOceaniaPakistanPanamaPeruPhilippinesPolandPortugalRomaniaRussiaSaudi ArabiaScotlandSenegalSerbiaSierra LeoneSingaporeSouth AfricaSouth AmericaSouth Central AsiaSouth Eastern AsiaSouthern EuropeSpainSt. Vincent and the GrenadinesSudanSyriaTaiwanThailandTrinidad and TobagoTurkeyUgandaUkraineUzbekistanVenezuelaVietnamWest IndiesWestern AfricaWestern AsiaWestern EuropeYemenZaireZimbabwe
Immigrant Origin (Percentage)
AfghanistanAfricaArgentinaAsiaAustraliaAustriaBahamasBangladeshBarbadosBelarusBoliviaBosnia and HerzegovinaBrazilBulgariaBurma / MyanmarCambodiaCameroonCanadaCaribbeanCentral AmericaChileChinaColombiaCongoCosta RicaCubaDenmarkDominican RepublicEastern AfricaEastern AsiaEastern EuropeEcuadorEgyptEl SalvadorEnglandEritreaEthiopiaEuropeFranceGermanyGhanaGreeceGuatemalaGuyanaHaitiHondurasHong KongHungaryIndiaIndonesiaIranIraqIrelandIsraelItalyJamaicaJapanJordanKenyaKoreaLaosLatin AmericaLatviaLebanonLiberiaMalaysiaMexicoMiddle AfricaMoldovaMoroccoNepalNetherlandsNicaraguaNigeriaNorth MacedoniaNorthern AfricaNorthern EuropeNorwayOceaniaPakistanPanamaPeruPhilippinesPolandPortugalRomaniaRussiaSaudi ArabiaScotlandSenegalSerbiaSierra LeoneSingaporeSouth AfricaSouth AmericaSouth Central AsiaSouth Eastern AsiaSouthern EuropeSpainSt. Vincent and the GrenadinesSudanSyriaTaiwanThailandTrinidad and TobagoTurkeyUgandaUkraineUzbekistanVenezuelaVietnamWest IndiesWestern AfricaWestern AsiaWestern EuropeYemenZaireZimbabwe
Income
Income (Families)
Income (Households)
Poverty
Poverty (Families)
Unemployment
Employment Occupations
Employment Industries
Employer Class
Commute Time
Commute Means
School Enrollment
Education by Degree Field
Occupancy
Finances
Physical Characteristics
Indianapolis
Compare Zip Codes
Comparison Subject

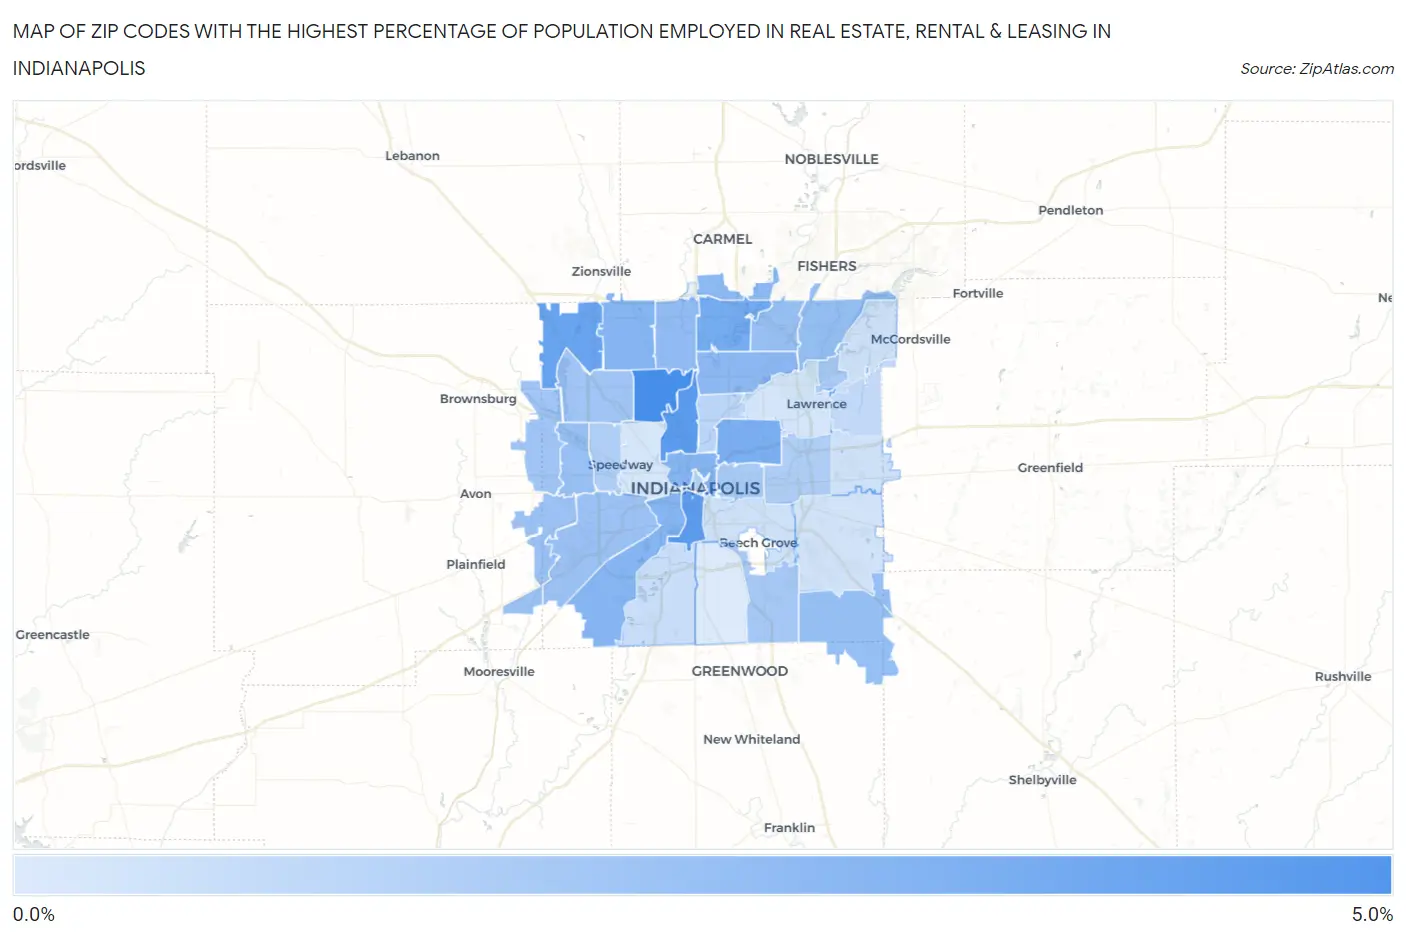
Map of Zip Codes with the Highest Percentage of Population Employed in Real Estate, Rental & Leasing in Indianapolis

0.0%
5.0%
Zip Codes with the Highest Percentage of Population Employed in Real Estate, Rental & Leasing in Indianapolis Map

Zip Codes with the Highest Percentage of Population Employed in Real Estate, Rental & Leasing in Indianapolis, IN

Zip Code % Employed vs State vs National
1.462284.1%1.4%(+2.67)#231.9%(+2.21)#2,053
2.462083.6%1.4%(+2.16)#301.9%(+1.70)#2,676
3.462253.5%1.4%(+2.11)#311.9%(+1.65)#2,763
4.462783.3%1.4%(+1.85)#351.9%(+1.39)#3,249
5.462403.1%1.4%(+1.61)#421.9%(+1.16)#3,757
6.462182.9%1.4%(+1.48)#471.9%(+1.03)#4,118
7.462212.7%1.4%(+1.25)#571.9%(+0.791)#4,797
8.462682.7%1.4%(+1.25)#581.9%(+0.791)#4,800
9.462022.7%1.4%(+1.22)#611.9%(+0.760)#4,929
10.462802.5%1.4%(+1.07)#711.9%(+0.617)#5,452
11.462202.5%1.4%(+1.04)#721.9%(+0.589)#5,557
12.462602.4%1.4%(+0.956)#841.9%(+0.500)#5,929
13.462562.3%1.4%(+0.860)#891.9%(+0.405)#6,318
14.462592.3%1.4%(+0.839)#911.9%(+0.384)#6,427
15.462502.2%1.4%(+0.792)#991.9%(+0.336)#6,675
16.462142.2%1.4%(+0.788)#1011.9%(+0.332)#6,695
17.462312.2%1.4%(+0.744)#1071.9%(+0.288)#6,905
18.462412.1%1.4%(+0.707)#1091.9%(+0.251)#7,105
19.462342.0%1.4%(+0.589)#1201.9%(+0.134)#7,711
20.462542.0%1.4%(+0.567)#1221.9%(+0.111)#7,817
21.462371.9%1.4%(+0.455)#1351.9%(-0.001)#8,535
22.462011.9%1.4%(+0.420)#1401.9%(-0.035)#8,737
23.462161.8%1.4%(+0.381)#1481.9%(-0.075)#9,006
24.462191.7%1.4%(+0.251)#1741.9%(-0.205)#9,852
25.462241.7%1.4%(+0.228)#1801.9%(-0.228)#10,013
26.462051.5%1.4%(+0.020)#2161.9%(-0.436)#11,526
27.462041.4%1.4%(-0.014)#2241.9%(-0.469)#11,803
28.462351.3%1.4%(-0.162)#2541.9%(-0.618)#12,916
29.462171.1%1.4%(-0.311)#2871.9%(-0.767)#14,067
30.462030.96%1.4%(-0.480)#3191.9%(-0.935)#15,510
31.462290.95%1.4%(-0.482)#3231.9%(-0.938)#15,530
32.462360.95%1.4%(-0.490)#3261.9%(-0.946)#15,587
33.462390.89%1.4%(-0.542)#3411.9%(-0.997)#16,000
34.462260.86%1.4%(-0.572)#3521.9%(-1.03)#16,236
35.462220.82%1.4%(-0.616)#3621.9%(-1.07)#16,570
36.462270.66%1.4%(-0.779)#3991.9%(-1.23)#17,817

Common Questions

What are the Top 10 Zip Codes with the Highest Percentage of Population Employed in Real Estate, Rental & Leasing in Indianapolis, IN?
Top 10 Zip Codes with the Highest Percentage of Population Employed in Real Estate, Rental & Leasing in Indianapolis, IN are:
#1
4.1%
#2
3.6%
#3
3.5%
#4
3.3%
#5
3.1%
#6
2.9%
#7
2.7%
#8
2.7%
#9
2.7%
#10
2.5%
What zip code has the Highest Percentage of Population Employed in Real Estate, Rental & Leasing in Indianapolis, IN?
46228 has the Highest Percentage of Population Employed in Real Estate, Rental & Leasing in Indianapolis, IN with 4.1%.
What is the Percentage of Population Employed in Real Estate, Rental & Leasing in Indianapolis, IN?
Percentage of Population Employed in Real Estate, Rental & Leasing in Indianapolis is 1.9%.
What is the Percentage of Population Employed in Real Estate, Rental & Leasing in Indiana?
Percentage of Population Employed in Real Estate, Rental & Leasing in Indiana is 1.4%.
What is the Percentage of Population Employed in Real Estate, Rental & Leasing in the United States?
Percentage of Population Employed in Real Estate, Rental & Leasing in the United States is 1.9%.