Zip Codes with the Highest Percentage of Population Employed in Computer & Mathematics in Indianapolis, IN

RELATED REPORTS & OPTIONS

Computer & Mathematics
Population
Families and Households
Female Fertility
Female Fertility (Unmarried)
Race (Community Size)
Race (Percentage)
Ancestry (Community Size)
AfghanAfricanAlaskan AthabascanAlbanianAlsatianAmericanApacheArabArgentineanArmenianAustralianAustrianBahamianBangladeshiBarbadianBasqueBelgianBelizeanBhutaneseBlackfeetBolivianBrazilianBritishBritish West IndianBulgarianBurmeseCajunCanadianCelticCentral AmericanCentral American IndianCherokeeChickasawChileanChippewaChoctawColombianCosta RicanCroatianCrowCubanCzechCzechoslovakianDanishDominicanDutchEastern EuropeanEcuadorianEgyptianEnglishEstonianEthiopianEuropeanFilipinoFinnishFrenchFrench CanadianGermanGerman RussianGhanaianGreekGuamanian / ChamorroGuatemalanGuyaneseHaitianHonduranHopiHungarianIcelanderIndian (Asian)IndonesianInupiatIranianIraqiIrishIroquoisIsraeliItalianJamaicanJapaneseJordanianKenyanKoreanLaotianLatvianLebaneseLiberianLithuanianLuxembourgerMacedonianMalaysianMenomineeMexicanMexican American IndianMongolianMoroccanNative HawaiianNavajoNew ZealanderNicaraguanNigerianNorthern EuropeanNorwegianPakistaniPalestinianPanamanianPennsylvania GermanPeruvianPolishPortuguesePotawatomiPuerto RicanRomanianRussianSalvadoranSamoanScandinavianScotch-IrishScottishSeminoleSenegaleseSerbianSierra LeoneanSiouxSlavicSlovakSloveneSouth AfricanSouth AmericanSouth American IndianSpaniardSpanishSri LankanSubsaharan AfricanSudaneseSwedishSwissSyrianThaiTonganTrinidadian and TobagonianTurkishUgandanUkrainianUruguayanVenezuelanVietnameseWelshWest IndianYugoslavianZimbabwean
Ancestry (Percentage)
AfghanAfricanAlaskan AthabascanAlbanianAlsatianAmericanApacheArabArgentineanArmenianAustralianAustrianBahamianBangladeshiBarbadianBasqueBelgianBelizeanBhutaneseBlackfeetBolivianBrazilianBritishBritish West IndianBulgarianBurmeseCajunCanadianCelticCentral AmericanCentral American IndianCherokeeChickasawChileanChippewaChoctawColombianCosta RicanCroatianCrowCubanCzechCzechoslovakianDanishDominicanDutchEastern EuropeanEcuadorianEgyptianEnglishEstonianEthiopianEuropeanFilipinoFinnishFrenchFrench CanadianGermanGerman RussianGhanaianGreekGuamanian / ChamorroGuatemalanGuyaneseHaitianHonduranHopiHungarianIcelanderIndian (Asian)IndonesianInupiatIranianIraqiIrishIroquoisIsraeliItalianJamaicanJapaneseJordanianKenyanKoreanLaotianLatvianLebaneseLiberianLithuanianLuxembourgerMacedonianMalaysianMenomineeMexicanMexican American IndianMongolianMoroccanNative HawaiianNavajoNew ZealanderNicaraguanNigerianNorthern EuropeanNorwegianPakistaniPalestinianPanamanianPennsylvania GermanPeruvianPolishPortuguesePotawatomiPuerto RicanRomanianRussianSalvadoranSamoanScandinavianScotch-IrishScottishSeminoleSenegaleseSerbianSierra LeoneanSiouxSlavicSlovakSloveneSouth AfricanSouth AmericanSouth American IndianSpaniardSpanishSri LankanSubsaharan AfricanSudaneseSwedishSwissSyrianThaiTonganTrinidadian and TobagonianTurkishUgandanUkrainianUruguayanVenezuelanVietnameseWelshWest IndianYugoslavianZimbabwean
Immigrant Origin (Total)
AfghanistanAfricaArgentinaAsiaAustraliaAustriaBahamasBangladeshBarbadosBelarusBoliviaBosnia and HerzegovinaBrazilBulgariaBurma / MyanmarCambodiaCameroonCanadaCaribbeanCentral AmericaChileChinaColombiaCongoCosta RicaCubaDenmarkDominican RepublicEastern AfricaEastern AsiaEastern EuropeEcuadorEgyptEl SalvadorEnglandEritreaEthiopiaEuropeFranceGermanyGhanaGreeceGuatemalaGuyanaHaitiHondurasHong KongHungaryIndiaIndonesiaIranIraqIrelandIsraelItalyJamaicaJapanJordanKenyaKoreaLaosLatin AmericaLatviaLebanonLiberiaMalaysiaMexicoMiddle AfricaMoldovaMoroccoNepalNetherlandsNicaraguaNigeriaNorth MacedoniaNorthern AfricaNorthern EuropeNorwayOceaniaPakistanPanamaPeruPhilippinesPolandPortugalRomaniaRussiaSaudi ArabiaScotlandSenegalSerbiaSierra LeoneSingaporeSouth AfricaSouth AmericaSouth Central AsiaSouth Eastern AsiaSouthern EuropeSpainSt. Vincent and the GrenadinesSudanSyriaTaiwanThailandTrinidad and TobagoTurkeyUgandaUkraineUzbekistanVenezuelaVietnamWest IndiesWestern AfricaWestern AsiaWestern EuropeYemenZaireZimbabwe
Immigrant Origin (Percentage)
AfghanistanAfricaArgentinaAsiaAustraliaAustriaBahamasBangladeshBarbadosBelarusBoliviaBosnia and HerzegovinaBrazilBulgariaBurma / MyanmarCambodiaCameroonCanadaCaribbeanCentral AmericaChileChinaColombiaCongoCosta RicaCubaDenmarkDominican RepublicEastern AfricaEastern AsiaEastern EuropeEcuadorEgyptEl SalvadorEnglandEritreaEthiopiaEuropeFranceGermanyGhanaGreeceGuatemalaGuyanaHaitiHondurasHong KongHungaryIndiaIndonesiaIranIraqIrelandIsraelItalyJamaicaJapanJordanKenyaKoreaLaosLatin AmericaLatviaLebanonLiberiaMalaysiaMexicoMiddle AfricaMoldovaMoroccoNepalNetherlandsNicaraguaNigeriaNorth MacedoniaNorthern AfricaNorthern EuropeNorwayOceaniaPakistanPanamaPeruPhilippinesPolandPortugalRomaniaRussiaSaudi ArabiaScotlandSenegalSerbiaSierra LeoneSingaporeSouth AfricaSouth AmericaSouth Central AsiaSouth Eastern AsiaSouthern EuropeSpainSt. Vincent and the GrenadinesSudanSyriaTaiwanThailandTrinidad and TobagoTurkeyUgandaUkraineUzbekistanVenezuelaVietnamWest IndiesWestern AfricaWestern AsiaWestern EuropeYemenZaireZimbabwe
Income
Income (Families)
Income (Households)
Poverty
Poverty (Families)
Unemployment
Employment Occupations
Employment Industries
Employer Class
Commute Time
Commute Means
School Enrollment
Education by Degree Field
Occupancy
Finances
Physical Characteristics
Indianapolis
Compare Zip Codes
Comparison Subject

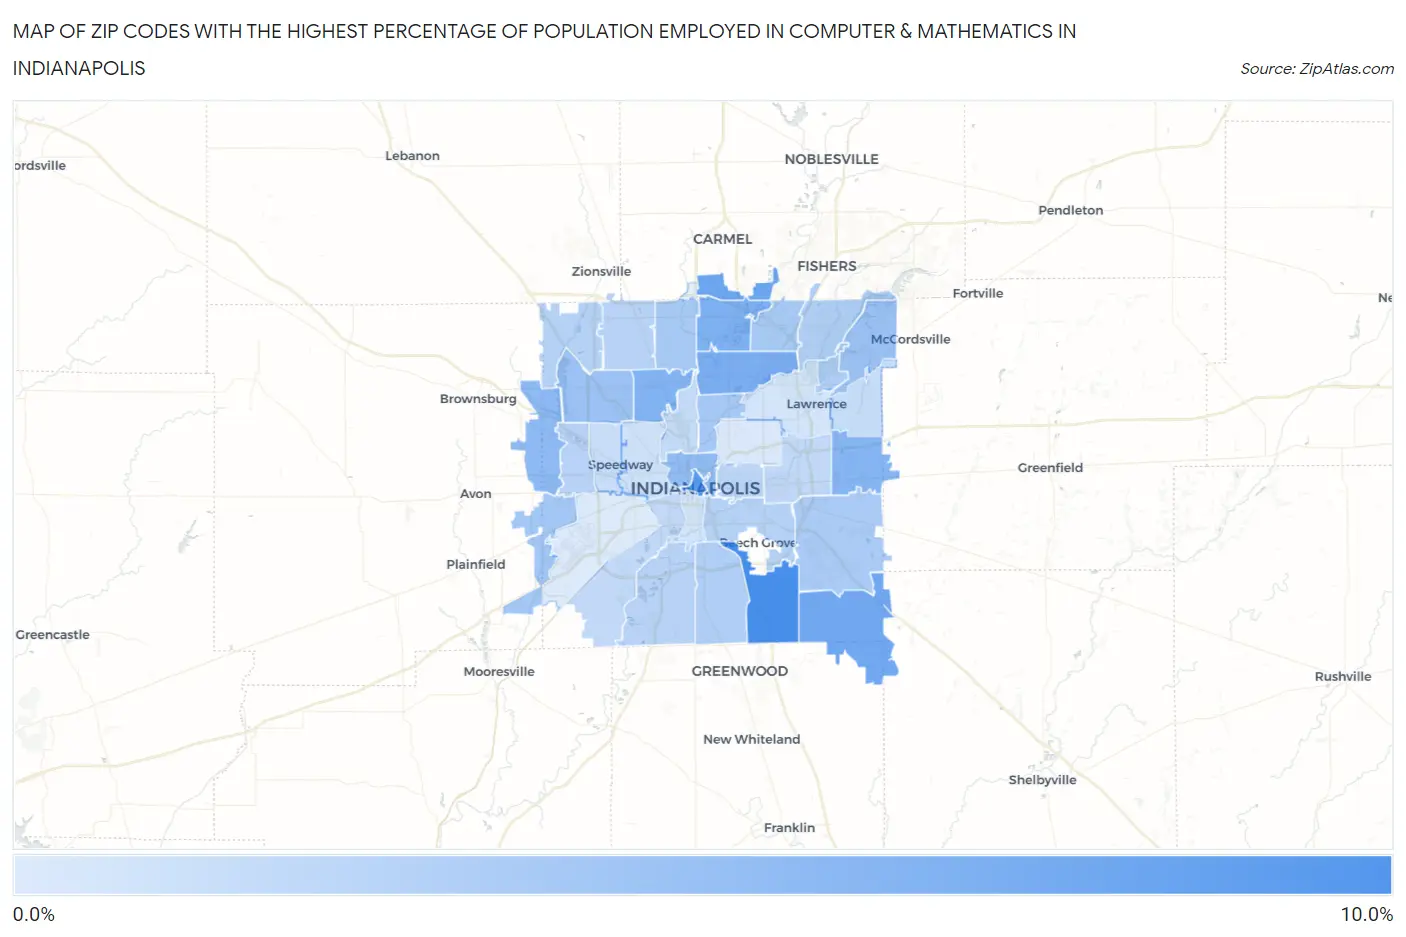
Map of Zip Codes with the Highest Percentage of Population Employed in Computer & Mathematics in Indianapolis

0.0%
10.0%
Zip Codes with the Highest Percentage of Population Employed in Computer & Mathematics in Indianapolis Map

Zip Codes with the Highest Percentage of Population Employed in Computer & Mathematics in Indianapolis, IN

Zip Code % Employed vs State vs National
1.462378.2%2.4%(+5.77)#113.5%(+4.66)#1,153
2.462047.4%2.4%(+4.98)#163.5%(+3.87)#1,430
3.462806.4%2.4%(+3.94)#203.5%(+2.83)#2,036
4.462596.1%2.4%(+3.71)#223.5%(+2.60)#2,201
5.462205.6%2.4%(+3.23)#303.5%(+2.12)#2,643
6.462405.4%2.4%(+2.96)#353.5%(+1.85)#2,926
7.462285.3%2.4%(+2.87)#363.5%(+1.76)#3,020
8.462295.1%2.4%(+2.67)#403.5%(+1.56)#3,251
9.462344.7%2.4%(+2.25)#543.5%(+1.14)#3,838
10.462024.5%2.4%(+2.10)#563.5%(+0.991)#4,055
11.462364.1%2.4%(+1.69)#643.5%(+0.580)#4,806
12.462544.0%2.4%(+1.58)#683.5%(+0.471)#5,060
13.462313.6%2.4%(+1.18)#903.5%(+0.066)#5,971
14.462053.5%2.4%(+1.08)#933.5%(-0.032)#6,221
15.462603.4%2.4%(+1.00)#1003.5%(-0.108)#6,433
16.462503.3%2.4%(+0.914)#1083.5%(-0.196)#6,687
17.462393.2%2.4%(+0.821)#1163.5%(-0.289)#6,990
18.462563.0%2.4%(+0.542)#1373.5%(-0.569)#7,908
19.462272.9%2.4%(+0.512)#1403.5%(-0.599)#8,015
20.462162.9%2.4%(+0.493)#1433.5%(-0.618)#8,074
21.462782.7%2.4%(+0.335)#1553.5%(-0.775)#8,624
22.462032.7%2.4%(+0.313)#1583.5%(-0.798)#8,724
23.462172.6%2.4%(+0.213)#1643.5%(-0.897)#9,122
24.462682.6%2.4%(+0.169)#1693.5%(-0.941)#9,273
25.462142.6%2.4%(+0.162)#1703.5%(-0.948)#9,306
26.462012.4%2.4%(-0.054)#1933.5%(-1.16)#10,190
27.462212.2%2.4%(-0.264)#2203.5%(-1.37)#11,115
28.462192.1%2.4%(-0.290)#2263.5%(-1.40)#11,240
29.462082.1%2.4%(-0.343)#2333.5%(-1.45)#11,471
30.462351.9%2.4%(-0.525)#2613.5%(-1.63)#12,354
31.462241.8%2.4%(-0.605)#2733.5%(-1.71)#12,706
32.462221.5%2.4%(-0.946)#3263.5%(-2.06)#14,572
33.462261.3%2.4%(-1.15)#3583.5%(-2.26)#15,752
34.462251.3%2.4%(-1.16)#3613.5%(-2.27)#15,799
35.462181.00%2.4%(-1.42)#4093.5%(-2.53)#17,401
36.462410.84%2.4%(-1.57)#4413.5%(-2.68)#18,393

Common Questions

What are the Top 10 Zip Codes with the Highest Percentage of Population Employed in Computer & Mathematics in Indianapolis, IN?
Top 10 Zip Codes with the Highest Percentage of Population Employed in Computer & Mathematics in Indianapolis, IN are:
#1
8.2%
#2
7.4%
#3
6.4%
#4
6.1%
#5
5.6%
#6
5.4%
#7
5.3%
#8
5.1%
#9
4.7%
#10
4.5%
What zip code has the Highest Percentage of Population Employed in Computer & Mathematics in Indianapolis, IN?
46237 has the Highest Percentage of Population Employed in Computer & Mathematics in Indianapolis, IN with 8.2%.
What is the Percentage of Population Employed in Computer & Mathematics in Indianapolis, IN?
Percentage of Population Employed in Computer & Mathematics in Indianapolis is 3.3%.
What is the Percentage of Population Employed in Computer & Mathematics in Indiana?
Percentage of Population Employed in Computer & Mathematics in Indiana is 2.4%.
What is the Percentage of Population Employed in Computer & Mathematics in the United States?
Percentage of Population Employed in Computer & Mathematics in the United States is 3.5%.