Zip Codes with the Highest Percentage of Population Employed in Computer & Mathematics in Greenwood, IN
RELATED REPORTS & OPTIONS
Computer & Mathematics
Greenwood
Compare Zip Codes
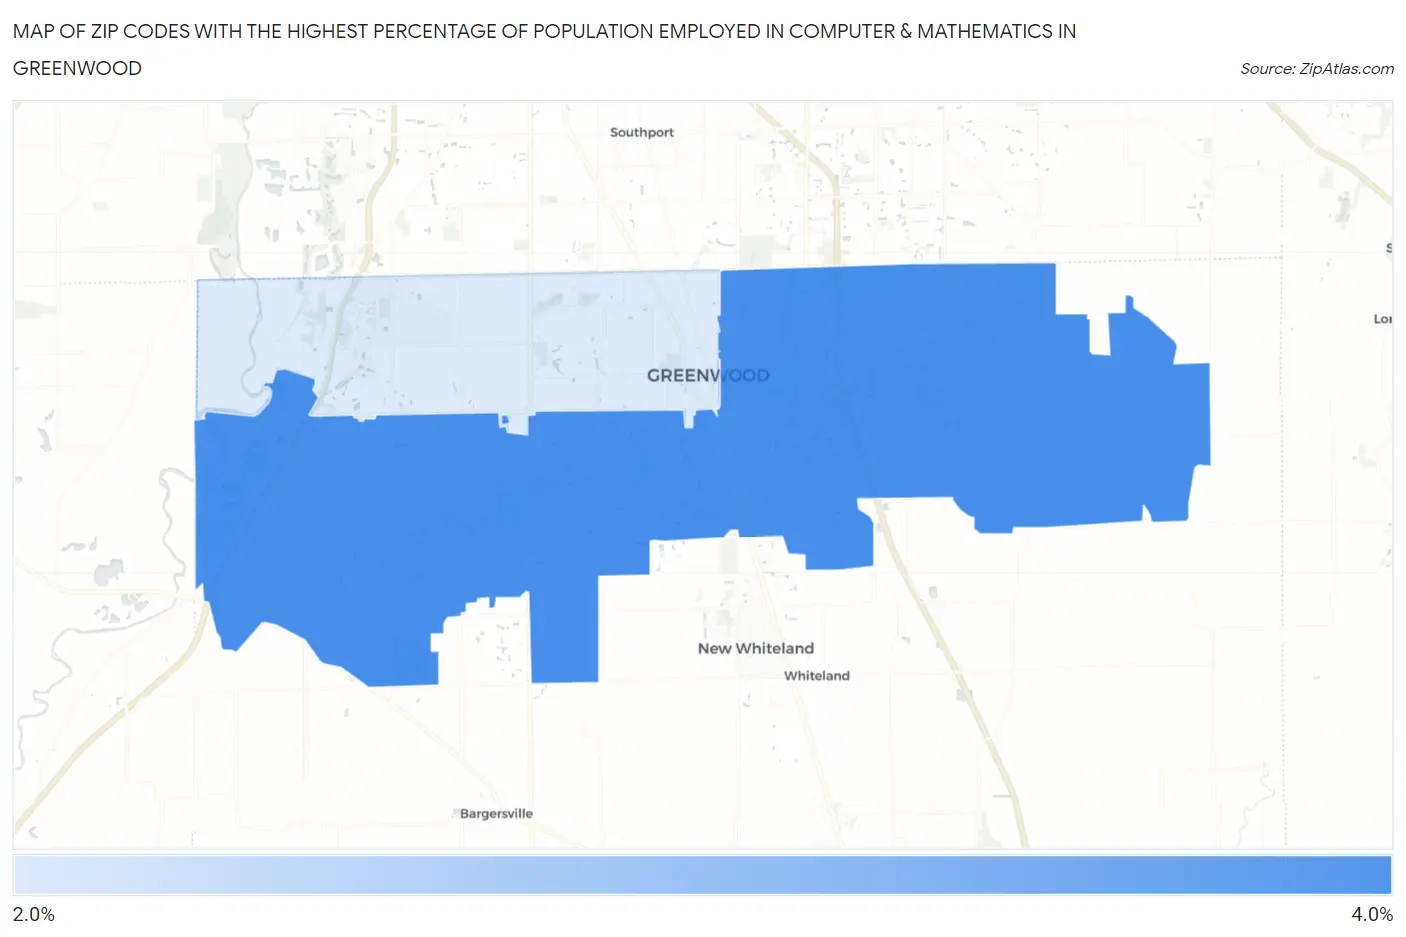
Map of Zip Codes with the Highest Percentage of Population Employed in Computer & Mathematics in Greenwood
2.4%
3.5%
Zip Codes with the Highest Percentage of Population Employed in Computer & Mathematics in Greenwood, IN
| Zip Code | % Employed | vs State | vs National | |
| 1. | 46143 | 3.5% | 2.4%(+1.13)#91 | 3.5%(+0.018)#6,087 |
| 2. | 46142 | 2.4% | 2.4%(-0.013)#188 | 3.5%(-1.12)#10,029 |
1
Common Questions
What are the Top Zip Codes with the Highest Percentage of Population Employed in Computer & Mathematics in Greenwood, IN?
Top Zip Codes with the Highest Percentage of Population Employed in Computer & Mathematics in Greenwood, IN are:
What zip code has the Highest Percentage of Population Employed in Computer & Mathematics in Greenwood, IN?
46143 has the Highest Percentage of Population Employed in Computer & Mathematics in Greenwood, IN with 3.5%.
What is the Percentage of Population Employed in Computer & Mathematics in Greenwood, IN?
Percentage of Population Employed in Computer & Mathematics in Greenwood is 3.2%.
What is the Percentage of Population Employed in Computer & Mathematics in Indiana?
Percentage of Population Employed in Computer & Mathematics in Indiana is 2.4%.
What is the Percentage of Population Employed in Computer & Mathematics in the United States?
Percentage of Population Employed in Computer & Mathematics in the United States is 3.5%.