Zip Codes with the Highest Percentage of Population Employed in Computer & Mathematics in Fishers, IN
RELATED REPORTS & OPTIONS
Computer & Mathematics
Fishers
Compare Zip Codes
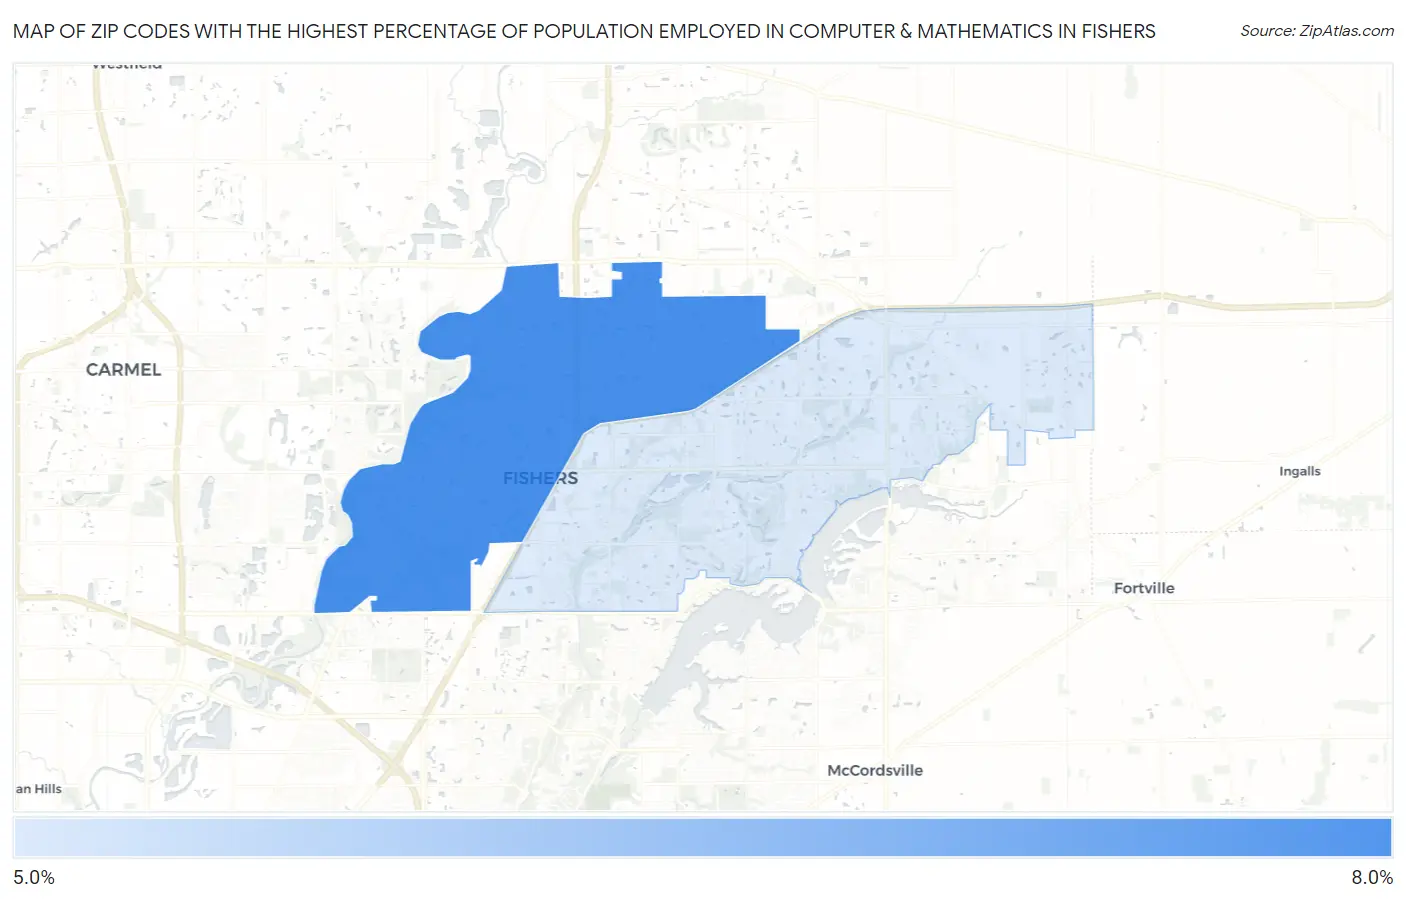
Map of Zip Codes with the Highest Percentage of Population Employed in Computer & Mathematics in Fishers
5.7%
7.2%
Zip Codes with the Highest Percentage of Population Employed in Computer & Mathematics in Fishers, IN
| Zip Code | % Employed | vs State | vs National | |
| 1. | 46038 | 7.2% | 2.4%(+4.80)#17 | 3.5%(+3.69)#1,505 |
| 2. | 46037 | 5.7% | 2.4%(+3.26)#28 | 3.5%(+2.15)#2,609 |
1
Common Questions
What are the Top Zip Codes with the Highest Percentage of Population Employed in Computer & Mathematics in Fishers, IN?
Top Zip Codes with the Highest Percentage of Population Employed in Computer & Mathematics in Fishers, IN are:
What zip code has the Highest Percentage of Population Employed in Computer & Mathematics in Fishers, IN?
46038 has the Highest Percentage of Population Employed in Computer & Mathematics in Fishers, IN with 7.2%.
What is the Percentage of Population Employed in Computer & Mathematics in Fishers, IN?
Percentage of Population Employed in Computer & Mathematics in Fishers is 6.1%.
What is the Percentage of Population Employed in Computer & Mathematics in Indiana?
Percentage of Population Employed in Computer & Mathematics in Indiana is 2.4%.
What is the Percentage of Population Employed in Computer & Mathematics in the United States?
Percentage of Population Employed in Computer & Mathematics in the United States is 3.5%.