Zip Codes with the Highest Percentage of Population Employed in Computer & Mathematics in Indiana
RELATED REPORTS & OPTIONS
Computer & Mathematics
Indiana
Compare Zip Codes
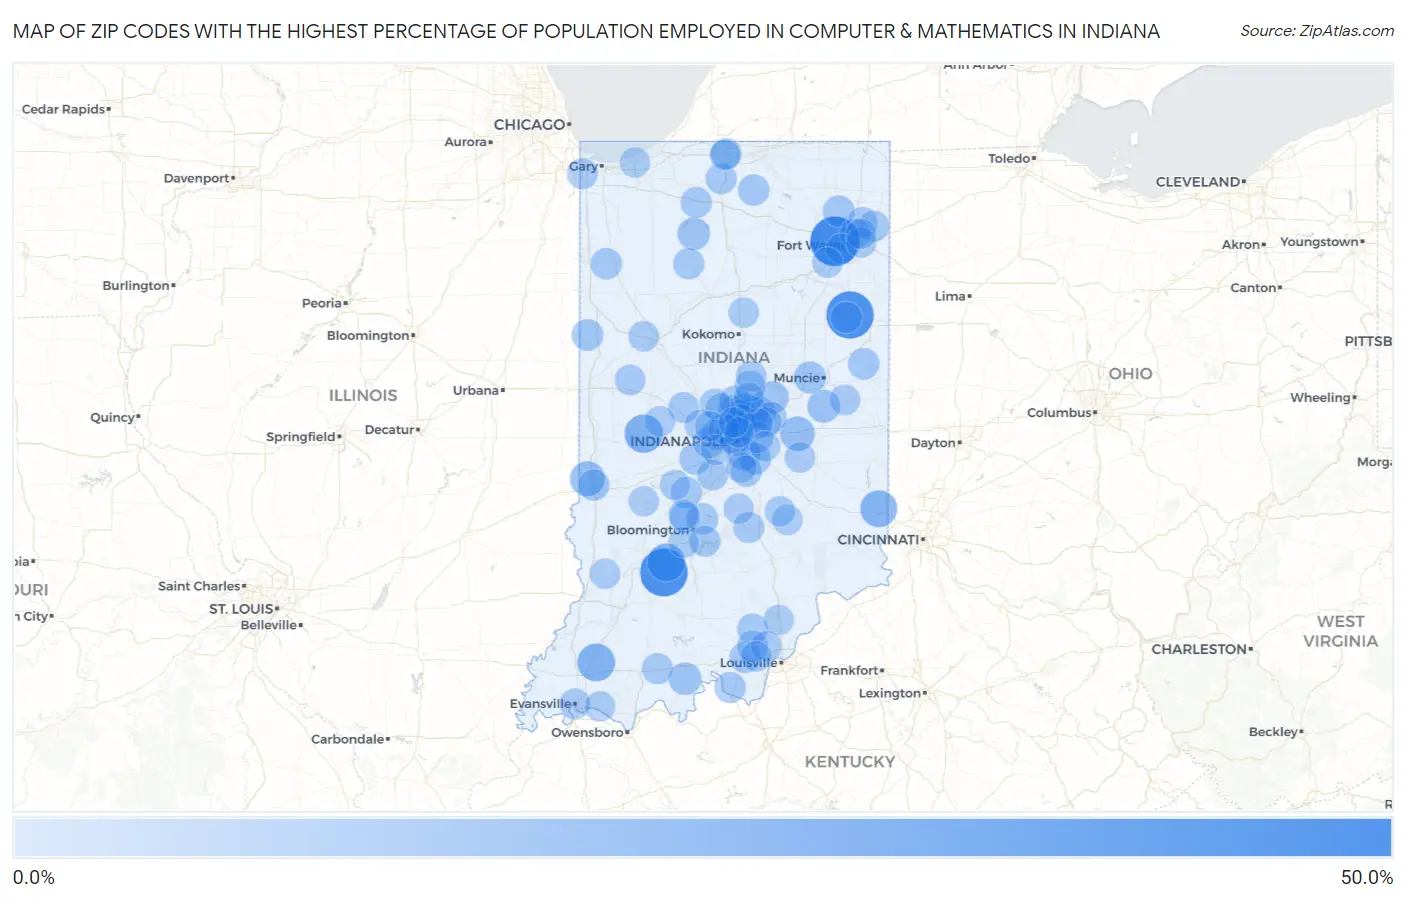
Map of Zip Codes with the Highest Percentage of Population Employed in Computer & Mathematics in Indiana
0.0%
50.0%
Zip Codes with the Highest Percentage of Population Employed in Computer & Mathematics in Indiana
| Zip Code | % Employed | vs State | vs National | |
| 1. | 46704 | 42.1% | 2.4%(+39.7)#1 | 3.5%(+38.6)#18 |
| 2. | 47522 | 38.6% | 2.4%(+36.2)#2 | 3.5%(+35.1)#22 |
| 3. | 46778 | 37.5% | 2.4%(+35.1)#3 | 3.5%(+34.0)#24 |
| 4. | 46175 | 19.4% | 2.4%(+17.0)#4 | 3.5%(+15.9)#142 |
| 5. | 47453 | 18.3% | 2.4%(+15.8)#5 | 3.5%(+14.7)#169 |
| 6. | 47654 | 18.2% | 2.4%(+15.8)#6 | 3.5%(+14.7)#172 |
| 7. | 47035 | 16.2% | 2.4%(+13.8)#7 | 3.5%(+12.7)#214 |
| 8. | 47876 | 12.4% | 2.4%(+9.97)#8 | 3.5%(+8.86)#408 |
| 9. | 46117 | 11.5% | 2.4%(+9.04)#9 | 3.5%(+7.93)#501 |
| 10. | 47361 | 8.5% | 2.4%(+6.04)#10 | 3.5%(+4.93)#1,068 |
| 11. | 46237 | 8.2% | 2.4%(+5.77)#11 | 3.5%(+4.66)#1,153 |
| 12. | 46960 | 8.0% | 2.4%(+5.61)#12 | 3.5%(+4.50)#1,197 |
| 13. | 46051 | 7.9% | 2.4%(+5.44)#13 | 3.5%(+4.33)#1,259 |
| 14. | 47514 | 7.8% | 2.4%(+5.43)#14 | 3.5%(+4.32)#1,262 |
| 15. | 46033 | 7.8% | 2.4%(+5.37)#15 | 3.5%(+4.26)#1,293 |
| 16. | 46204 | 7.4% | 2.4%(+4.98)#16 | 3.5%(+3.87)#1,430 |
| 17. | 46038 | 7.2% | 2.4%(+4.80)#17 | 3.5%(+3.69)#1,505 |
| 18. | 47396 | 7.2% | 2.4%(+4.74)#18 | 3.5%(+3.63)#1,540 |
| 19. | 46032 | 6.6% | 2.4%(+4.14)#19 | 3.5%(+3.03)#1,887 |
| 20. | 46280 | 6.4% | 2.4%(+3.94)#20 | 3.5%(+2.83)#2,036 |
| 21. | 47917 | 6.2% | 2.4%(+3.74)#21 | 3.5%(+2.63)#2,179 |
| 22. | 46259 | 6.1% | 2.4%(+3.71)#22 | 3.5%(+2.60)#2,201 |
| 23. | 46763 | 6.1% | 2.4%(+3.66)#23 | 3.5%(+2.55)#2,247 |
| 24. | 46118 | 5.8% | 2.4%(+3.43)#24 | 3.5%(+2.32)#2,453 |
| 25. | 47380 | 5.7% | 2.4%(+3.32)#25 | 3.5%(+2.21)#2,555 |
| 26. | 47964 | 5.7% | 2.4%(+3.30)#26 | 3.5%(+2.19)#2,570 |
| 27. | 46123 | 5.7% | 2.4%(+3.29)#27 | 3.5%(+2.18)#2,583 |
| 28. | 46037 | 5.7% | 2.4%(+3.26)#28 | 3.5%(+2.15)#2,609 |
| 29. | 46550 | 5.7% | 2.4%(+3.25)#29 | 3.5%(+2.14)#2,621 |
| 30. | 46220 | 5.6% | 2.4%(+3.23)#30 | 3.5%(+2.12)#2,643 |
| 31. | 47408 | 5.5% | 2.4%(+3.04)#31 | 3.5%(+1.93)#2,832 |
| 32. | 47809 | 5.5% | 2.4%(+3.04)#32 | 3.5%(+1.93)#2,834 |
| 33. | 46759 | 5.5% | 2.4%(+3.04)#33 | 3.5%(+1.93)#2,836 |
| 34. | 46074 | 5.4% | 2.4%(+3.00)#34 | 3.5%(+1.89)#2,881 |
| 35. | 46240 | 5.4% | 2.4%(+2.96)#35 | 3.5%(+1.85)#2,926 |
| 36. | 46228 | 5.3% | 2.4%(+2.87)#36 | 3.5%(+1.76)#3,020 |
| 37. | 46166 | 5.2% | 2.4%(+2.80)#37 | 3.5%(+1.69)#3,105 |
| 38. | 46985 | 5.2% | 2.4%(+2.78)#38 | 3.5%(+1.67)#3,134 |
| 39. | 46040 | 5.2% | 2.4%(+2.77)#39 | 3.5%(+1.66)#3,145 |
| 40. | 46229 | 5.1% | 2.4%(+2.67)#40 | 3.5%(+1.56)#3,251 |
| 41. | 46184 | 5.0% | 2.4%(+2.63)#41 | 3.5%(+1.52)#3,310 |
| 42. | 46741 | 5.0% | 2.4%(+2.55)#42 | 3.5%(+1.44)#3,395 |
| 43. | 47532 | 4.9% | 2.4%(+2.53)#43 | 3.5%(+1.42)#3,436 |
| 44. | 46111 | 4.9% | 2.4%(+2.50)#44 | 3.5%(+1.39)#3,487 |
| 45. | 47114 | 4.9% | 2.4%(+2.48)#45 | 3.5%(+1.37)#3,514 |
| 46. | 47142 | 4.9% | 2.4%(+2.47)#46 | 3.5%(+1.36)#3,526 |
| 47. | 47201 | 4.9% | 2.4%(+2.47)#47 | 3.5%(+1.36)#3,529 |
| 48. | 46531 | 4.9% | 2.4%(+2.45)#48 | 3.5%(+1.34)#3,554 |
| 49. | 47401 | 4.9% | 2.4%(+2.44)#49 | 3.5%(+1.33)#3,565 |
| 50. | 46536 | 4.9% | 2.4%(+2.44)#50 | 3.5%(+1.33)#3,568 |
| 51. | 46034 | 4.8% | 2.4%(+2.43)#51 | 3.5%(+1.32)#3,574 |
| 52. | 46102 | 4.8% | 2.4%(+2.39)#52 | 3.5%(+1.28)#3,641 |
| 53. | 46617 | 4.7% | 2.4%(+2.27)#53 | 3.5%(+1.16)#3,814 |
| 54. | 46234 | 4.7% | 2.4%(+2.25)#54 | 3.5%(+1.14)#3,838 |
| 55. | 47124 | 4.5% | 2.4%(+2.10)#55 | 3.5%(+0.992)#4,052 |
| 56. | 46202 | 4.5% | 2.4%(+2.10)#56 | 3.5%(+0.991)#4,055 |
| 57. | 46077 | 4.5% | 2.4%(+2.07)#57 | 3.5%(+0.955)#4,114 |
| 58. | 46765 | 4.4% | 2.4%(+2.03)#58 | 3.5%(+0.923)#4,182 |
| 59. | 47708 | 4.3% | 2.4%(+1.92)#59 | 3.5%(+0.812)#4,368 |
| 60. | 47165 | 4.3% | 2.4%(+1.89)#60 | 3.5%(+0.779)#4,425 |
| 61. | 47354 | 4.2% | 2.4%(+1.79)#61 | 3.5%(+0.677)#4,606 |
| 62. | 46055 | 4.2% | 2.4%(+1.76)#62 | 3.5%(+0.650)#4,660 |
| 63. | 46031 | 4.1% | 2.4%(+1.70)#63 | 3.5%(+0.594)#4,779 |
| 64. | 46236 | 4.1% | 2.4%(+1.69)#64 | 3.5%(+0.580)#4,806 |
| 65. | 46167 | 4.1% | 2.4%(+1.69)#65 | 3.5%(+0.579)#4,809 |
| 66. | 47119 | 4.0% | 2.4%(+1.63)#66 | 3.5%(+0.516)#4,943 |
| 67. | 47404 | 4.0% | 2.4%(+1.61)#67 | 3.5%(+0.499)#4,987 |
| 68. | 46254 | 4.0% | 2.4%(+1.58)#68 | 3.5%(+0.471)#5,060 |
| 69. | 46321 | 4.0% | 2.4%(+1.56)#69 | 3.5%(+0.448)#5,106 |
| 70. | 47994 | 3.9% | 2.4%(+1.53)#70 | 3.5%(+0.423)#5,157 |
| 71. | 46825 | 3.9% | 2.4%(+1.51)#71 | 3.5%(+0.404)#5,194 |
| 72. | 47906 | 3.9% | 2.4%(+1.50)#72 | 3.5%(+0.394)#5,215 |
| 73. | 46104 | 3.9% | 2.4%(+1.50)#73 | 3.5%(+0.387)#5,234 |
| 74. | 47122 | 3.9% | 2.4%(+1.48)#74 | 3.5%(+0.371)#5,261 |
| 75. | 46804 | 3.8% | 2.4%(+1.40)#75 | 3.5%(+0.290)#5,443 |
| 76. | 47954 | 3.8% | 2.4%(+1.39)#76 | 3.5%(+0.279)#5,472 |
| 77. | 47403 | 3.8% | 2.4%(+1.38)#77 | 3.5%(+0.268)#5,503 |
| 78. | 46783 | 3.8% | 2.4%(+1.36)#78 | 3.5%(+0.250)#5,544 |
| 79. | 47244 | 3.7% | 2.4%(+1.33)#79 | 3.5%(+0.219)#5,610 |
| 80. | 46075 | 3.7% | 2.4%(+1.32)#80 | 3.5%(+0.211)#5,631 |
| 81. | 47535 | 3.7% | 2.4%(+1.30)#81 | 3.5%(+0.194)#5,670 |
| 82. | 47630 | 3.7% | 2.4%(+1.30)#82 | 3.5%(+0.193)#5,679 |
| 83. | 47246 | 3.7% | 2.4%(+1.29)#83 | 3.5%(+0.185)#5,699 |
| 84. | 47429 | 3.7% | 2.4%(+1.29)#84 | 3.5%(+0.183)#5,703 |
| 85. | 46601 | 3.7% | 2.4%(+1.28)#85 | 3.5%(+0.168)#5,744 |
| 86. | 47833 | 3.6% | 2.4%(+1.23)#86 | 3.5%(+0.122)#5,851 |
| 87. | 46163 | 3.6% | 2.4%(+1.21)#87 | 3.5%(+0.103)#5,897 |
| 88. | 46914 | 3.6% | 2.4%(+1.20)#88 | 3.5%(+0.092)#5,921 |
| 89. | 47126 | 3.6% | 2.4%(+1.20)#89 | 3.5%(+0.086)#5,937 |
| 90. | 46231 | 3.6% | 2.4%(+1.18)#90 | 3.5%(+0.066)#5,971 |
| 91. | 46143 | 3.5% | 2.4%(+1.13)#91 | 3.5%(+0.018)#6,087 |
| 92. | 46062 | 3.5% | 2.4%(+1.08)#92 | 3.5%(-0.030)#6,219 |
| 93. | 46205 | 3.5% | 2.4%(+1.08)#93 | 3.5%(-0.032)#6,221 |
| 94. | 47456 | 3.5% | 2.4%(+1.08)#94 | 3.5%(-0.034)#6,233 |
| 95. | 46164 | 3.5% | 2.4%(+1.06)#95 | 3.5%(-0.047)#6,258 |
| 96. | 46304 | 3.5% | 2.4%(+1.06)#96 | 3.5%(-0.054)#6,277 |
| 97. | 46815 | 3.5% | 2.4%(+1.04)#97 | 3.5%(-0.073)#6,336 |
| 98. | 46112 | 3.4% | 2.4%(+1.01)#98 | 3.5%(-0.097)#6,398 |
| 99. | 46835 | 3.4% | 2.4%(+1.01)#99 | 3.5%(-0.105)#6,426 |
| 100. | 46260 | 3.4% | 2.4%(+1.00)#100 | 3.5%(-0.108)#6,433 |
Common Questions
What are the Top 10 Zip Codes with the Highest Percentage of Population Employed in Computer & Mathematics in Indiana?
Top 10 Zip Codes with the Highest Percentage of Population Employed in Computer & Mathematics in Indiana are:
What zip code has the Highest Percentage of Population Employed in Computer & Mathematics in Indiana?
46704 has the Highest Percentage of Population Employed in Computer & Mathematics in Indiana with 42.1%.
What is the Percentage of Population Employed in Computer & Mathematics in the State of Indiana?
Percentage of Population Employed in Computer & Mathematics in Indiana is 2.4%.
What is the Percentage of Population Employed in Computer & Mathematics in the United States?
Percentage of Population Employed in Computer & Mathematics in the United States is 3.5%.