New Pekin, IN Map & Demographics
New Pekin Map
New Pekin Overview
$25,262
PER CAPITA INCOME
$61,719
AVG FAMILY INCOME
$49,444
AVG HOUSEHOLD INCOME
15.3%
WAGE / INCOME GAP [ % ]
84.7¢/ $1
WAGE / INCOME GAP [ $ ]
0.44
INEQUALITY / GINI INDEX
1,224
TOTAL POPULATION
569
MALE POPULATION
655
FEMALE POPULATION
86.87
MALES / 100 FEMALES
115.11
FEMALES / 100 MALES
40.5
MEDIAN AGE
3.0
AVG FAMILY SIZE
2.4
AVG HOUSEHOLD SIZE
557
LABOR FORCE [ PEOPLE ]
56.7%
PERCENT IN LABOR FORCE
4.5%
UNEMPLOYMENT RATE
Income in New Pekin
Income Overview in New Pekin
Per Capita Income in New Pekin is $25,262, while median incomes of families and households are $61,719 and $49,444 respectively.
| Characteristic | Number | Measure |
| Per Capita Income | 1,224 | $25,262 |
| Median Family Income | 329 | $61,719 |
| Mean Family Income | 329 | $66,542 |
| Median Household Income | 508 | $49,444 |
| Mean Household Income | 508 | $58,986 |
| Income Deficit | 329 | $0 |
| Wage / Income Gap (%) | 1,224 | 15.25% |
| Wage / Income Gap ($) | 1,224 | 84.75¢ per $1 |
| Gini / Inequality Index | 1,224 | 0.44 |
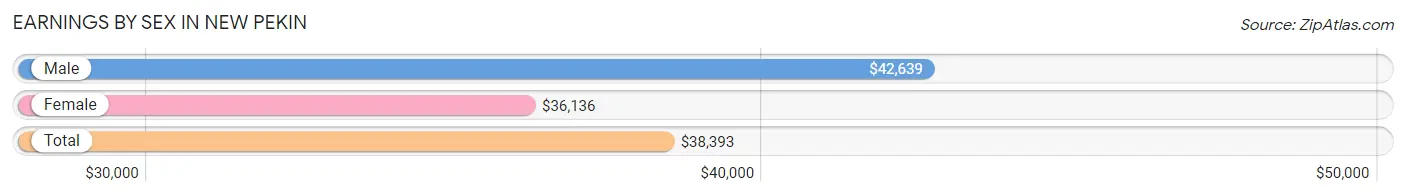
Earnings by Sex in New Pekin
Average Earnings in New Pekin are $38,393, $42,639 for men and $36,136 for women, a difference of 15.2%.
| Sex | Number | Average Earnings |
| Male | 345 (59.8%) | $42,639 |
| Female | 232 (40.2%) | $36,136 |
| Total | 577 (100.0%) | $38,393 |
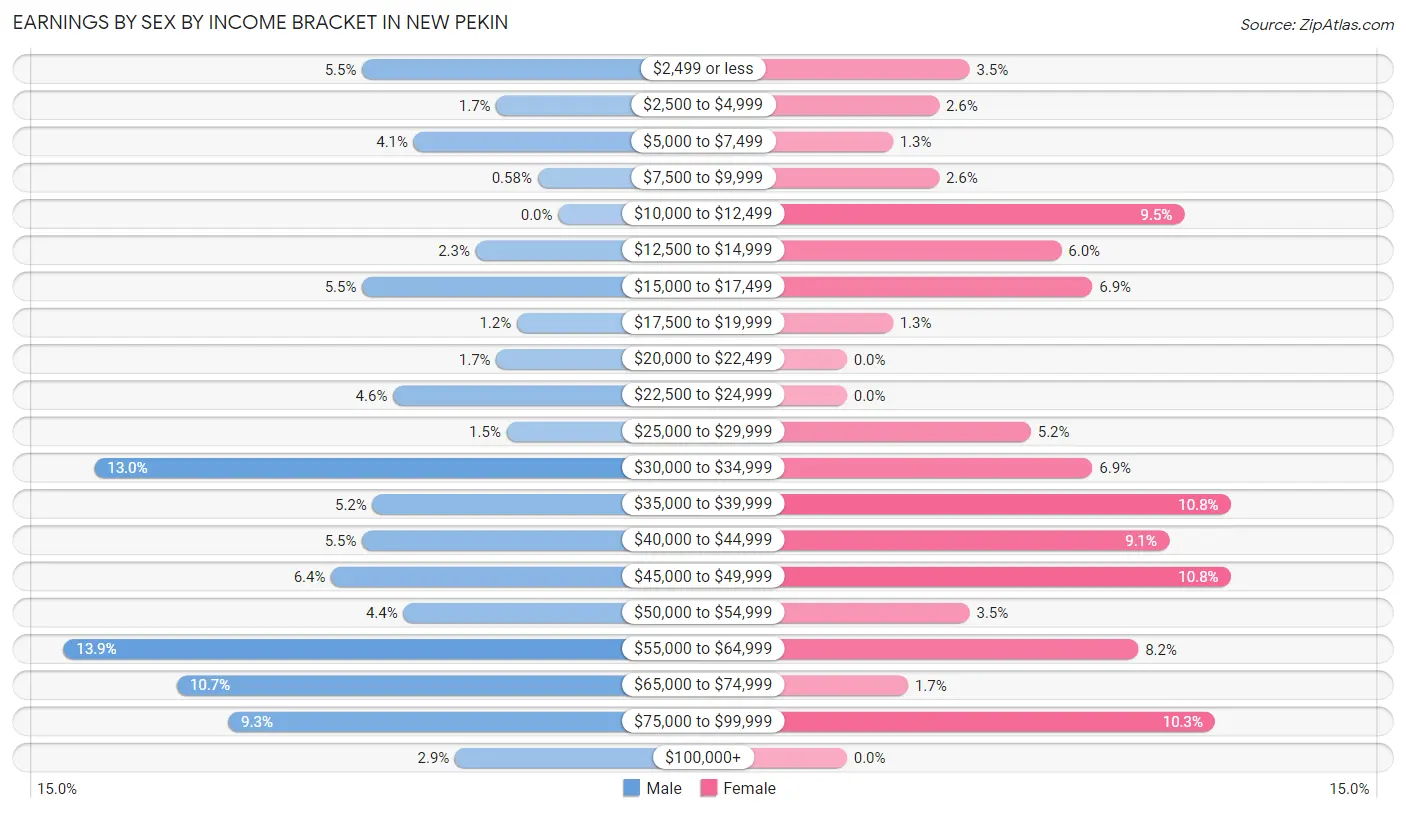
Earnings by Sex by Income Bracket in New Pekin
The most common earnings brackets in New Pekin are $55,000 to $64,999 for men (48 | 13.9%) and $35,000 to $39,999 for women (25 | 10.8%).
| Income | Male | Female |
| $2,499 or less | 19 (5.5%) | 8 (3.5%) |
| $2,500 to $4,999 | 6 (1.7%) | 6 (2.6%) |
| $5,000 to $7,499 | 14 (4.1%) | 3 (1.3%) |
| $7,500 to $9,999 | 2 (0.6%) | 6 (2.6%) |
| $10,000 to $12,499 | 0 (0.0%) | 22 (9.5%) |
| $12,500 to $14,999 | 8 (2.3%) | 14 (6.0%) |
| $15,000 to $17,499 | 19 (5.5%) | 16 (6.9%) |
| $17,500 to $19,999 | 4 (1.2%) | 3 (1.3%) |
| $20,000 to $22,499 | 6 (1.7%) | 0 (0.0%) |
| $22,500 to $24,999 | 16 (4.6%) | 0 (0.0%) |
| $25,000 to $29,999 | 5 (1.5%) | 12 (5.2%) |
| $30,000 to $34,999 | 45 (13.0%) | 16 (6.9%) |
| $35,000 to $39,999 | 18 (5.2%) | 25 (10.8%) |
| $40,000 to $44,999 | 19 (5.5%) | 21 (9.0%) |
| $45,000 to $49,999 | 22 (6.4%) | 25 (10.8%) |
| $50,000 to $54,999 | 15 (4.3%) | 8 (3.5%) |
| $55,000 to $64,999 | 48 (13.9%) | 19 (8.2%) |
| $65,000 to $74,999 | 37 (10.7%) | 4 (1.7%) |
| $75,000 to $99,999 | 32 (9.3%) | 24 (10.3%) |
| $100,000+ | 10 (2.9%) | 0 (0.0%) |
| Total | 345 (100.0%) | 232 (100.0%) |
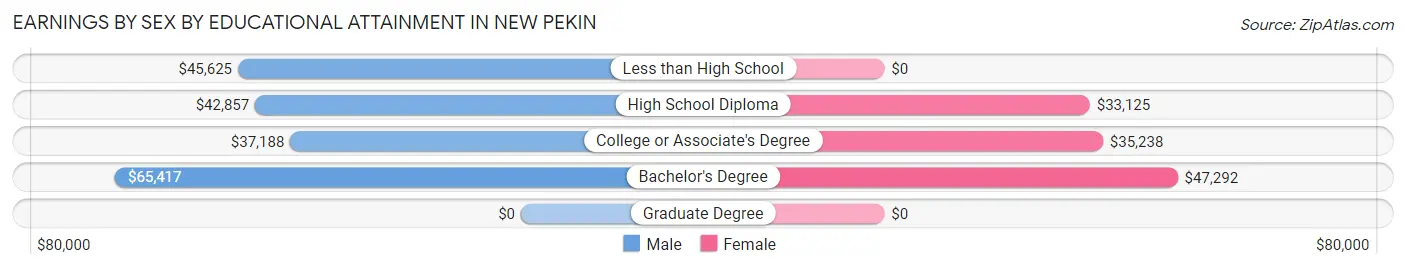
Earnings by Sex by Educational Attainment in New Pekin
Average earnings in New Pekin are $46,339 for men and $36,364 for women, a difference of 21.5%. Men with an educational attainment of bachelor's degree enjoy the highest average annual earnings of $65,417, while those with college or associate's degree education earn the least with $37,188. Women with an educational attainment of bachelor's degree earn the most with the average annual earnings of $47,292, while those with high school diploma education have the smallest earnings of $33,125.
| Educational Attainment | Male Income | Female Income |
| Less than High School | $45,625 | $0 |
| High School Diploma | $42,857 | $33,125 |
| College or Associate's Degree | $37,188 | $35,238 |
| Bachelor's Degree | $65,417 | $47,292 |
| Graduate Degree | - | - |
| Total | $46,339 | $36,364 |
Family Income in New Pekin
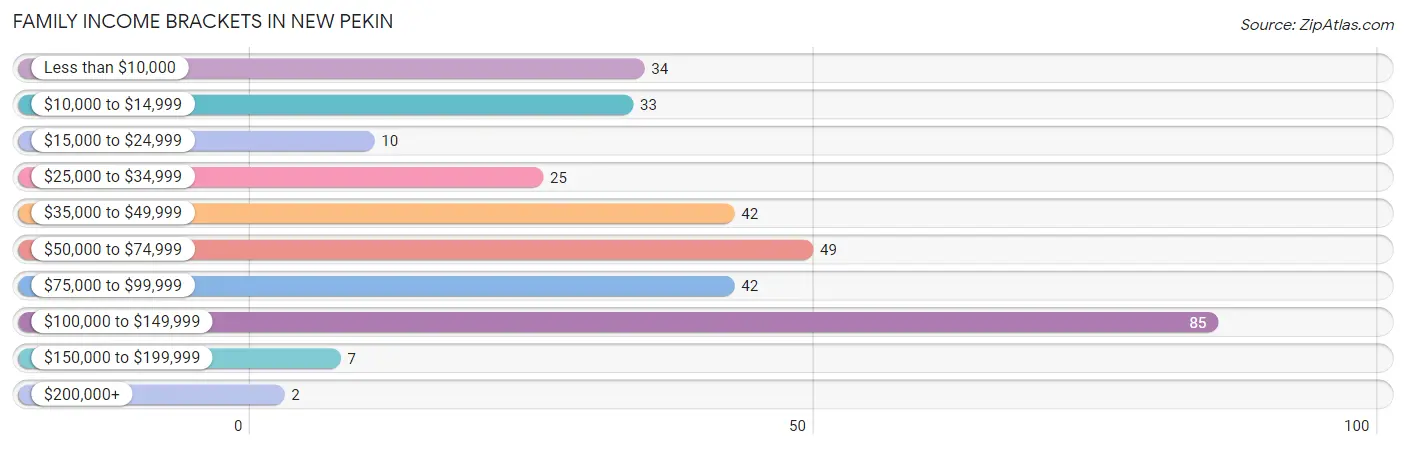
Family Income Brackets in New Pekin
According to the New Pekin family income data, there are 85 families falling into the $100,000 to $149,999 income range, which is the most common income bracket and makes up 25.8% of all families. Conversely, the $200,000+ income bracket is the least frequent group with only 2 families (0.6%) belonging to this category.
| Income Bracket | # Families | % Families |
| Less than $10,000 | 34 | 10.3% |
| $10,000 to $14,999 | 33 | 10.0% |
| $15,000 to $24,999 | 10 | 3.0% |
| $25,000 to $34,999 | 25 | 7.6% |
| $35,000 to $49,999 | 42 | 12.8% |
| $50,000 to $74,999 | 49 | 14.9% |
| $75,000 to $99,999 | 42 | 12.8% |
| $100,000 to $149,999 | 85 | 25.8% |
| $150,000 to $199,999 | 7 | 2.1% |
| $200,000+ | 2 | 0.6% |
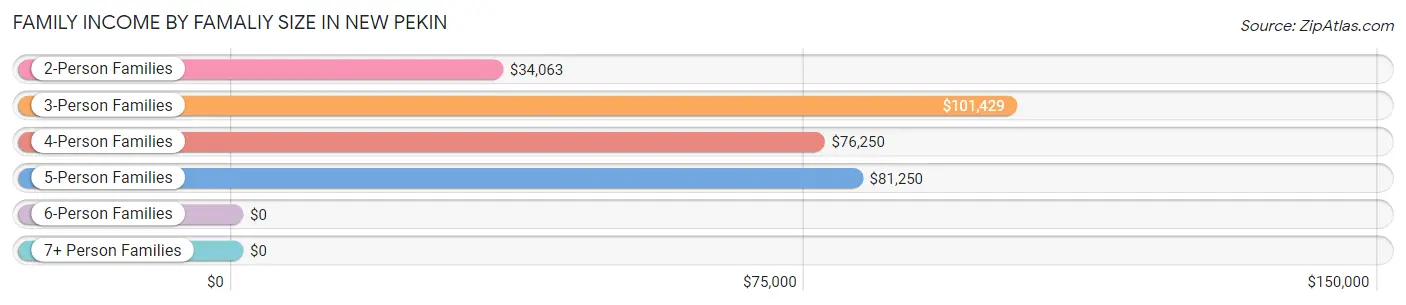
Family Income by Famaliy Size in New Pekin
3-person families (78 | 23.7%) account for the highest median family income in New Pekin with $101,429 per family, while 3-person families (78 | 23.7%) have the highest median income of $33,810 per family member.
| Income Bracket | # Families | Median Income |
| 2-Person Families | 170 (51.7%) | $34,063 |
| 3-Person Families | 78 (23.7%) | $101,429 |
| 4-Person Families | 56 (17.0%) | $76,250 |
| 5-Person Families | 7 (2.1%) | $81,250 |
| 6-Person Families | 14 (4.3%) | $0 |
| 7+ Person Families | 4 (1.2%) | $0 |
| Total | 329 (100.0%) | $61,719 |
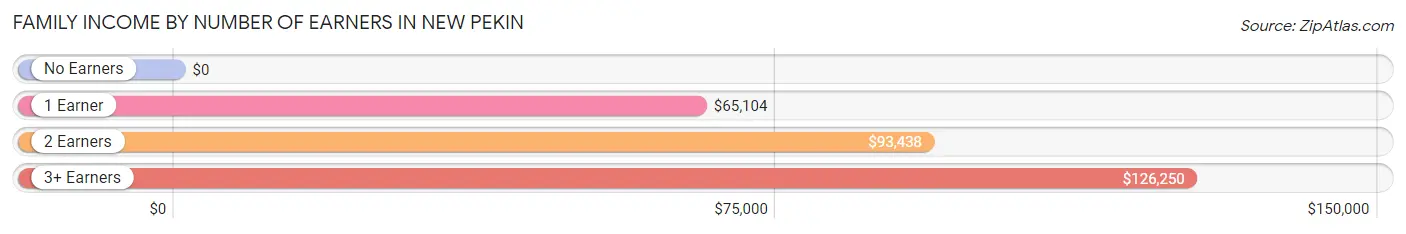
Family Income by Number of Earners in New Pekin
| Number of Earners | # Families | Median Income |
| No Earners | 91 (27.7%) | $0 |
| 1 Earner | 107 (32.5%) | $65,104 |
| 2 Earners | 103 (31.3%) | $93,438 |
| 3+ Earners | 28 (8.5%) | $126,250 |
| Total | 329 (100.0%) | $61,719 |
Household Income in New Pekin
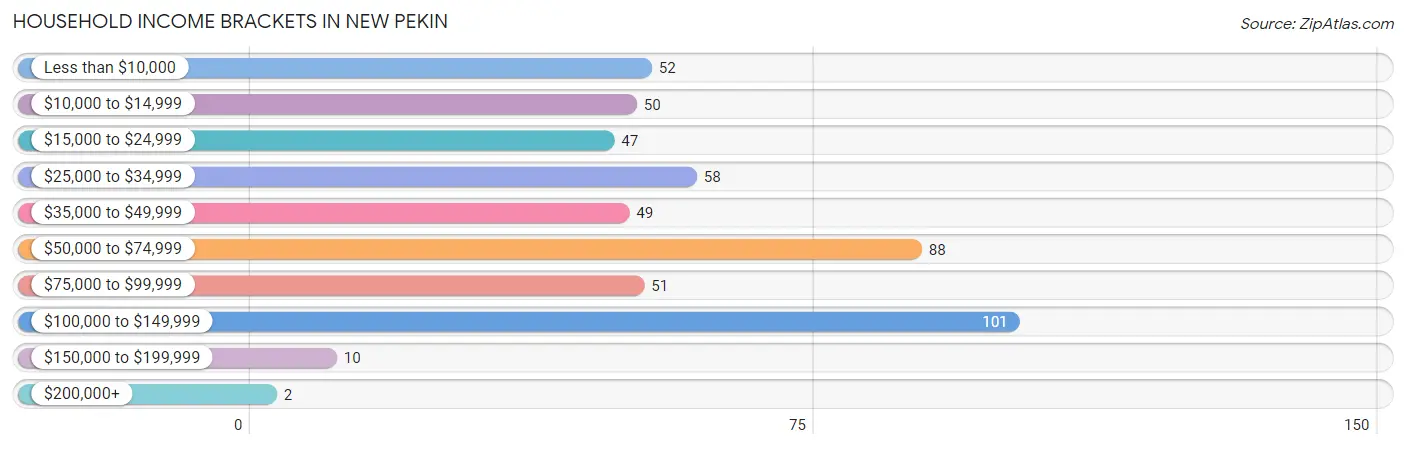
Household Income Brackets in New Pekin
With 101 households falling in the category, the $100,000 to $149,999 income range is the most frequent in New Pekin, accounting for 19.9% of all households. In contrast, only 2 households (0.4%) fall into the $200,000+ income bracket, making it the least populous group.
| Income Bracket | # Households | % Households |
| Less than $10,000 | 52 | 10.2% |
| $10,000 to $14,999 | 50 | 9.8% |
| $15,000 to $24,999 | 47 | 9.3% |
| $25,000 to $34,999 | 58 | 11.4% |
| $35,000 to $49,999 | 49 | 9.6% |
| $50,000 to $74,999 | 88 | 17.3% |
| $75,000 to $99,999 | 51 | 10.0% |
| $100,000 to $149,999 | 101 | 19.9% |
| $150,000 to $199,999 | 10 | 2.0% |
| $200,000+ | 2 | 0.4% |
Household Income by Householder Age in New Pekin
The median household income in New Pekin is $49,444, with the highest median household income of $71,250 found in the 25 to 44 years age bracket for the primary householder. A total of 134 households (26.4%) fall into this category. Meanwhile, the 15 to 24 years age bracket for the primary householder has the lowest median household income of $0, with 13 households (2.6%) in this group.
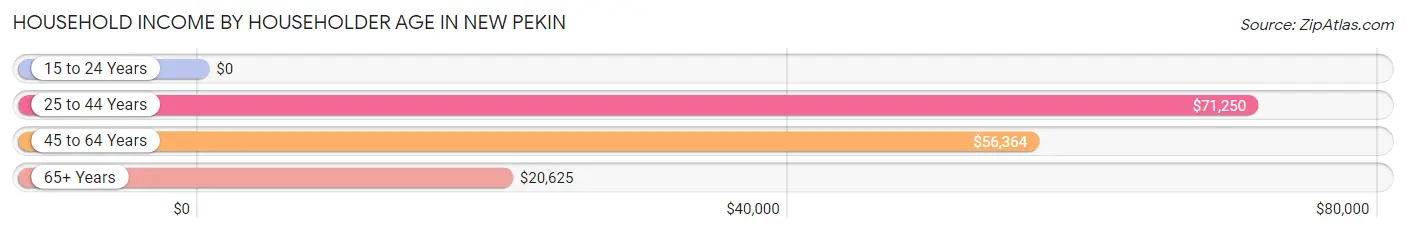
| Income Bracket | # Households | Median Income |
| 15 to 24 Years | 13 (2.6%) | $0 |
| 25 to 44 Years | 134 (26.4%) | $71,250 |
| 45 to 64 Years | 208 (40.9%) | $56,364 |
| 65+ Years | 153 (30.1%) | $20,625 |
| Total | 508 (100.0%) | $49,444 |
Poverty in New Pekin
Income Below Poverty by Sex and Age in New Pekin
With 9.7% poverty level for males and 27.6% for females among the residents of New Pekin, 6 to 11 year old males and 75 year old and over females are the most vulnerable to poverty, with 13 males (39.4%) and 35 females (52.2%) in their respective age groups living below the poverty level.
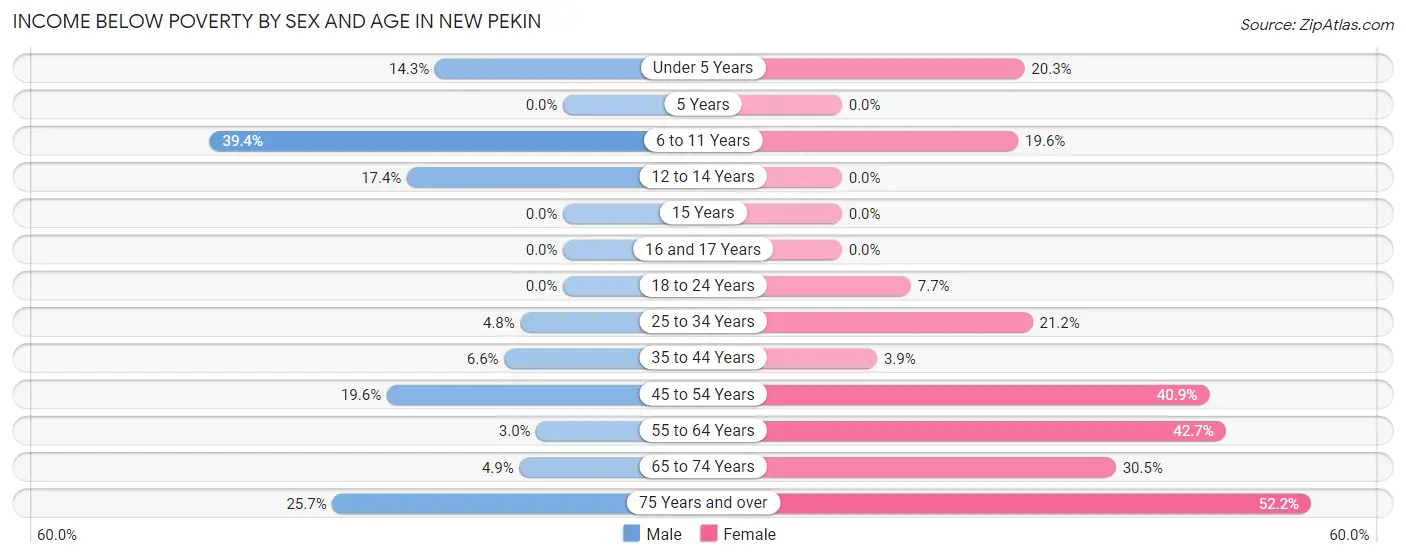
| Age Bracket | Male | Female |
| Under 5 Years | 5 (14.3%) | 12 (20.3%) |
| 5 Years | 0 (0.0%) | 0 (0.0%) |
| 6 to 11 Years | 13 (39.4%) | 11 (19.6%) |
| 12 to 14 Years | 4 (17.4%) | 0 (0.0%) |
| 15 Years | 0 (0.0%) | 0 (0.0%) |
| 16 and 17 Years | 0 (0.0%) | 0 (0.0%) |
| 18 to 24 Years | 0 (0.0%) | 2 (7.7%) |
| 25 to 34 Years | 4 (4.8%) | 24 (21.2%) |
| 35 to 44 Years | 4 (6.6%) | 2 (3.9%) |
| 45 to 54 Years | 11 (19.6%) | 27 (40.9%) |
| 55 to 64 Years | 3 (3.0%) | 50 (42.7%) |
| 65 to 74 Years | 2 (4.9%) | 18 (30.5%) |
| 75 Years and over | 9 (25.7%) | 35 (52.2%) |
| Total | 55 (9.7%) | 181 (27.6%) |
Income Above Poverty by Sex and Age in New Pekin
According to the poverty statistics in New Pekin, males aged 5 years and females aged 5 years are the age groups that are most secure financially, with 100.0% of males and 100.0% of females in these age groups living above the poverty line.
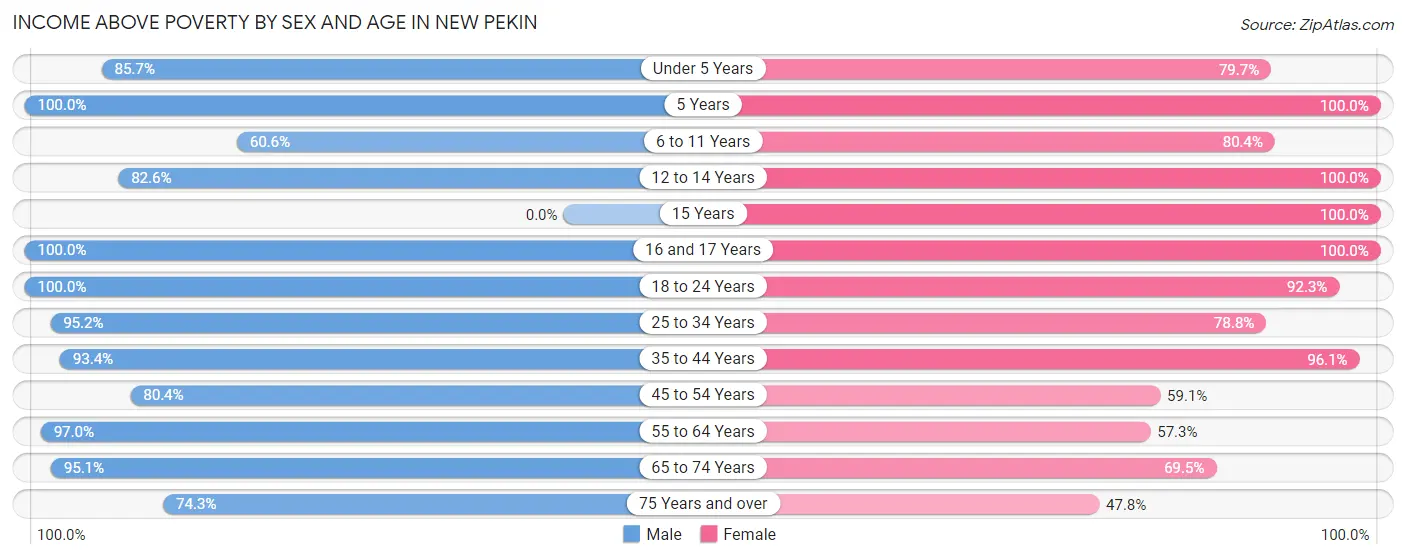
| Age Bracket | Male | Female |
| Under 5 Years | 30 (85.7%) | 47 (79.7%) |
| 5 Years | 12 (100.0%) | 5 (100.0%) |
| 6 to 11 Years | 20 (60.6%) | 45 (80.4%) |
| 12 to 14 Years | 19 (82.6%) | 4 (100.0%) |
| 15 Years | 0 (0.0%) | 13 (100.0%) |
| 16 and 17 Years | 8 (100.0%) | 19 (100.0%) |
| 18 to 24 Years | 79 (100.0%) | 24 (92.3%) |
| 25 to 34 Years | 80 (95.2%) | 89 (78.8%) |
| 35 to 44 Years | 57 (93.4%) | 49 (96.1%) |
| 45 to 54 Years | 45 (80.4%) | 39 (59.1%) |
| 55 to 64 Years | 97 (97.0%) | 67 (57.3%) |
| 65 to 74 Years | 39 (95.1%) | 41 (69.5%) |
| 75 Years and over | 26 (74.3%) | 32 (47.8%) |
| Total | 512 (90.3%) | 474 (72.4%) |
Income Below Poverty Among Married-Couple Families in New Pekin
The poverty statistics for married-couple families in New Pekin show that 4.5% or 9 of the total 198 families live below the poverty line. Families with 3 or 4 children have the highest poverty rate of 57.1%, comprising of 4 families. On the other hand, families with 1 or 2 children have the lowest poverty rate of 0.0%, which includes 0 families.
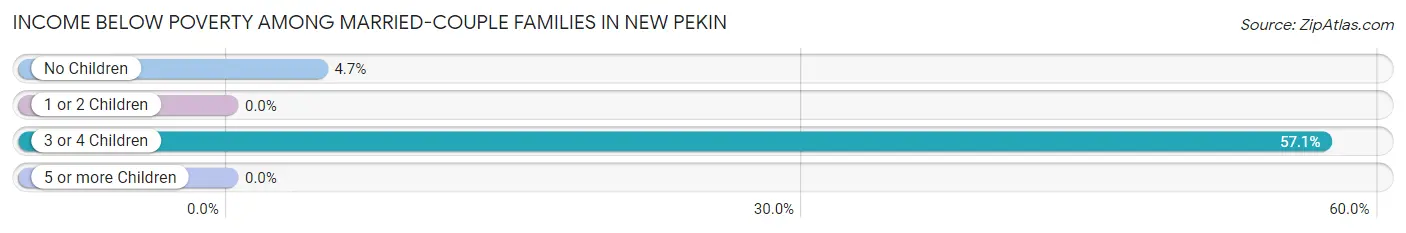
| Children | Above Poverty | Below Poverty |
| No Children | 102 (95.3%) | 5 (4.7%) |
| 1 or 2 Children | 84 (100.0%) | 0 (0.0%) |
| 3 or 4 Children | 3 (42.9%) | 4 (57.1%) |
| 5 or more Children | 0 (0.0%) | 0 (0.0%) |
| Total | 189 (95.5%) | 9 (4.5%) |
Income Below Poverty Among Single-Parent Households in New Pekin
According to the poverty data in New Pekin, 16.7% or 4 single-father households and 57.0% or 61 single-mother households are living below the poverty line. Among single-father households, those with 1 or 2 children have the highest poverty rate, with 4 households (26.7%) experiencing poverty. Likewise, among single-mother households, those with 1 or 2 children have the highest poverty rate, with 36 households (58.1%) falling below the poverty line.
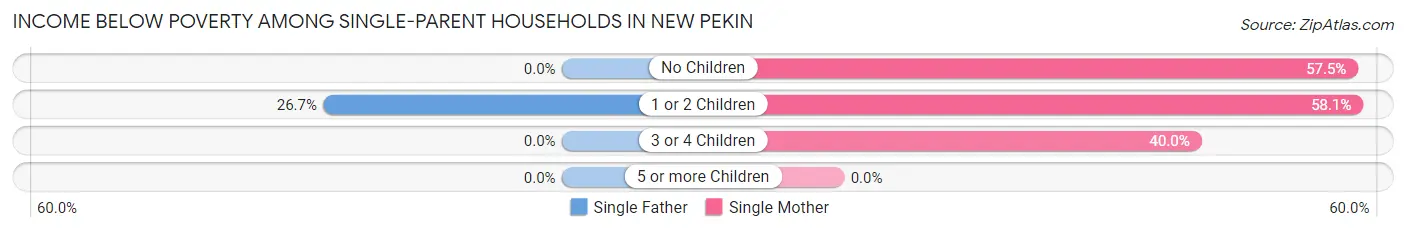
| Children | Single Father | Single Mother |
| No Children | 0 (0.0%) | 23 (57.5%) |
| 1 or 2 Children | 4 (26.7%) | 36 (58.1%) |
| 3 or 4 Children | 0 (0.0%) | 2 (40.0%) |
| 5 or more Children | 0 (0.0%) | 0 (0.0%) |
| Total | 4 (16.7%) | 61 (57.0%) |
Income Below Poverty Among Married-Couple vs Single-Parent Households in New Pekin
The poverty data for New Pekin shows that 9 of the married-couple family households (4.5%) and 65 of the single-parent households (49.6%) are living below the poverty level. Within the married-couple family households, those with 3 or 4 children have the highest poverty rate, with 4 households (57.1%) falling below the poverty line. Among the single-parent households, those with no children have the highest poverty rate, with 23 household (54.8%) living below poverty.
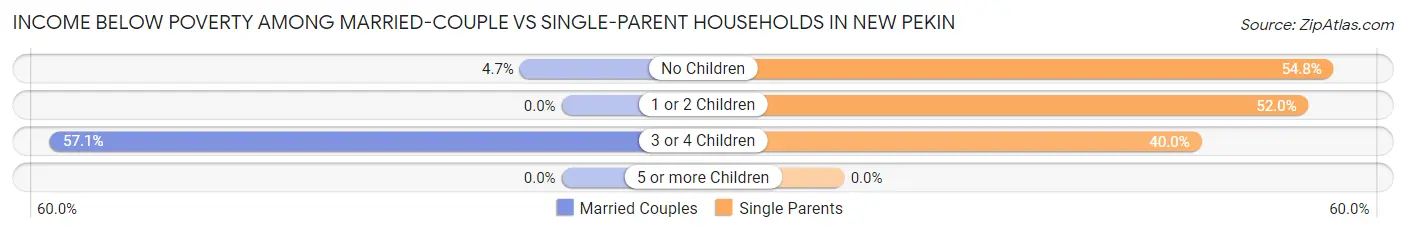
| Children | Married-Couple Families | Single-Parent Households |
| No Children | 5 (4.7%) | 23 (54.8%) |
| 1 or 2 Children | 0 (0.0%) | 40 (51.9%) |
| 3 or 4 Children | 4 (57.1%) | 2 (40.0%) |
| 5 or more Children | 0 (0.0%) | 0 (0.0%) |
| Total | 9 (4.5%) | 65 (49.6%) |
Race in New Pekin
The most populous races in New Pekin are White / Caucasian (1,148 | 93.8%), Two or more Races (73 | 6.0%), and Hispanic or Latino (31 | 2.5%).
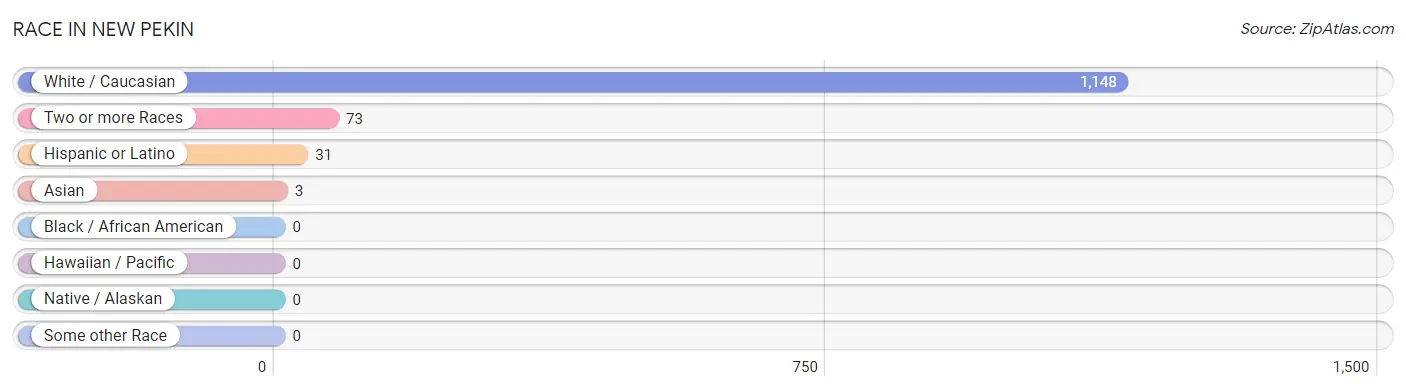
| Race | # Population | % Population |
| Asian | 3 | 0.3% |
| Black / African American | 0 | 0.0% |
| Hawaiian / Pacific | 0 | 0.0% |
| Hispanic or Latino | 31 | 2.5% |
| Native / Alaskan | 0 | 0.0% |
| White / Caucasian | 1,148 | 93.8% |
| Two or more Races | 73 | 6.0% |
| Some other Race | 0 | 0.0% |
| Total | 1,224 | 100.0% |
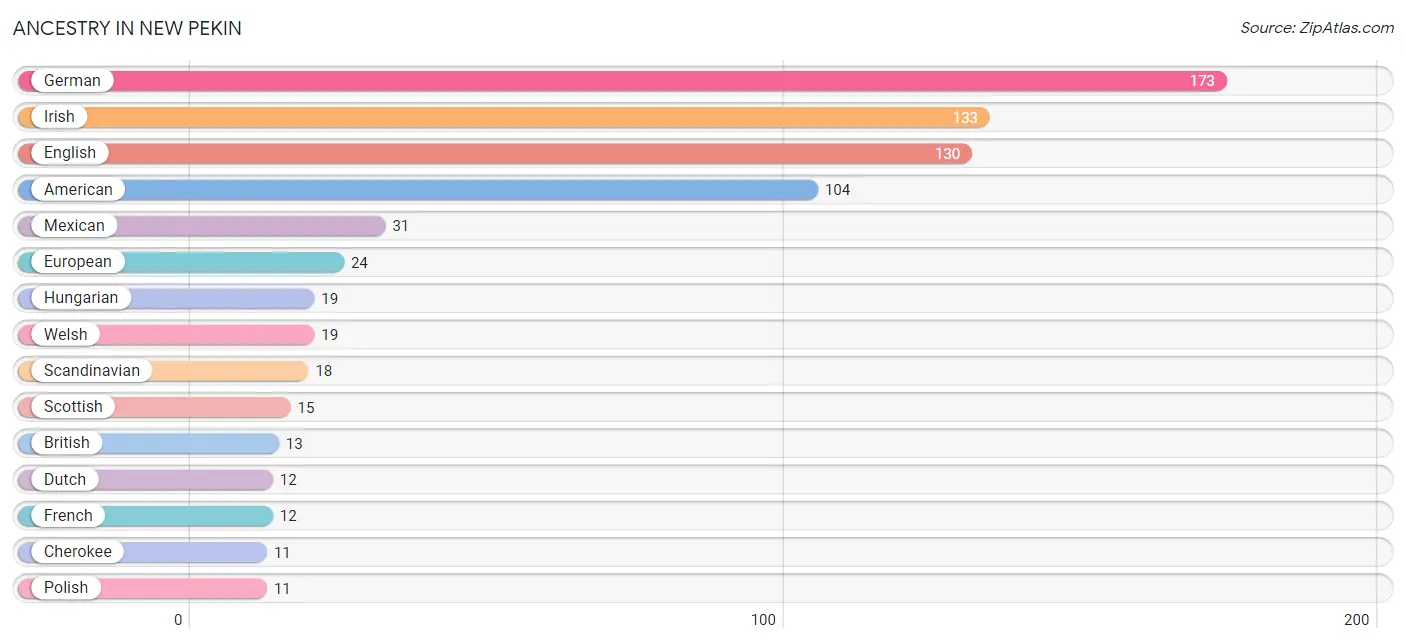
Ancestry in New Pekin
The most populous ancestries reported in New Pekin are German (173 | 14.1%), Irish (133 | 10.9%), English (130 | 10.6%), American (104 | 8.5%), and Mexican (31 | 2.5%), together accounting for 46.7% of all New Pekin residents.
| Ancestry | # Population | % Population |
| African | 6 | 0.5% |
| American | 104 | 8.5% |
| Bhutanese | 5 | 0.4% |
| Blackfeet | 5 | 0.4% |
| British | 13 | 1.1% |
| Cherokee | 11 | 0.9% |
| Dutch | 12 | 1.0% |
| English | 130 | 10.6% |
| European | 24 | 2.0% |
| French | 12 | 1.0% |
| German | 173 | 14.1% |
| Hungarian | 19 | 1.5% |
| Irish | 133 | 10.9% |
| Italian | 6 | 0.5% |
| Korean | 5 | 0.4% |
| Mexican | 31 | 2.5% |
| Norwegian | 4 | 0.3% |
| Pakistani | 3 | 0.3% |
| Polish | 11 | 0.9% |
| Scandinavian | 18 | 1.5% |
| Scotch-Irish | 10 | 0.8% |
| Scottish | 15 | 1.2% |
| Slovak | 7 | 0.6% |
| Subsaharan African | 6 | 0.5% |
| Swiss | 2 | 0.2% |
| Turkish | 5 | 0.4% |
| Welsh | 19 | 1.5% | View All 27 Rows |
Immigrants in New Pekin
The most numerous immigrant groups reported in New Pekin came from Europe (14 | 1.1%), Eastern Europe (7 | 0.6%), Romania (7 | 0.6%), Germany (4 | 0.3%), and Western Europe (4 | 0.3%), together accounting for 2.9% of all New Pekin residents.
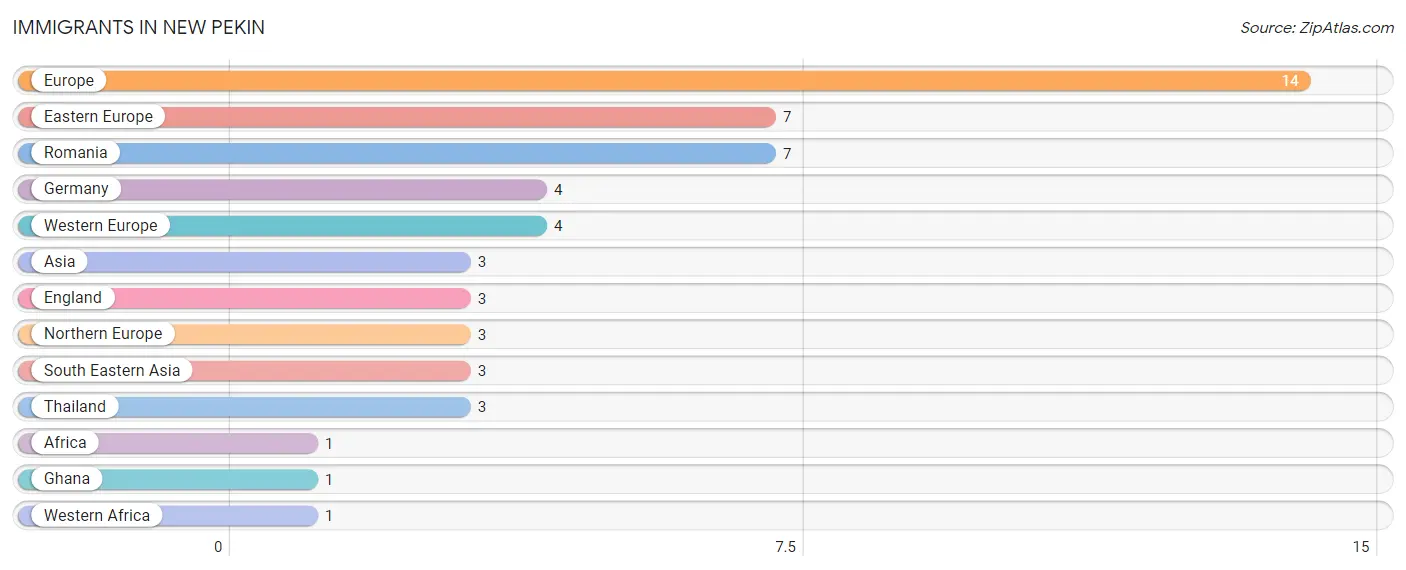
| Immigration Origin | # Population | % Population |
| Africa | 1 | 0.1% |
| Asia | 3 | 0.3% |
| Eastern Europe | 7 | 0.6% |
| England | 3 | 0.3% |
| Europe | 14 | 1.1% |
| Germany | 4 | 0.3% |
| Ghana | 1 | 0.1% |
| Northern Europe | 3 | 0.3% |
| Romania | 7 | 0.6% |
| South Eastern Asia | 3 | 0.3% |
| Thailand | 3 | 0.3% |
| Western Africa | 1 | 0.1% |
| Western Europe | 4 | 0.3% | View All 13 Rows |
Sex and Age in New Pekin
Sex and Age in New Pekin
The most populous age groups in New Pekin are 55 to 59 Years (79 | 13.9%) for men and 25 to 29 Years (85 | 13.0%) for women.
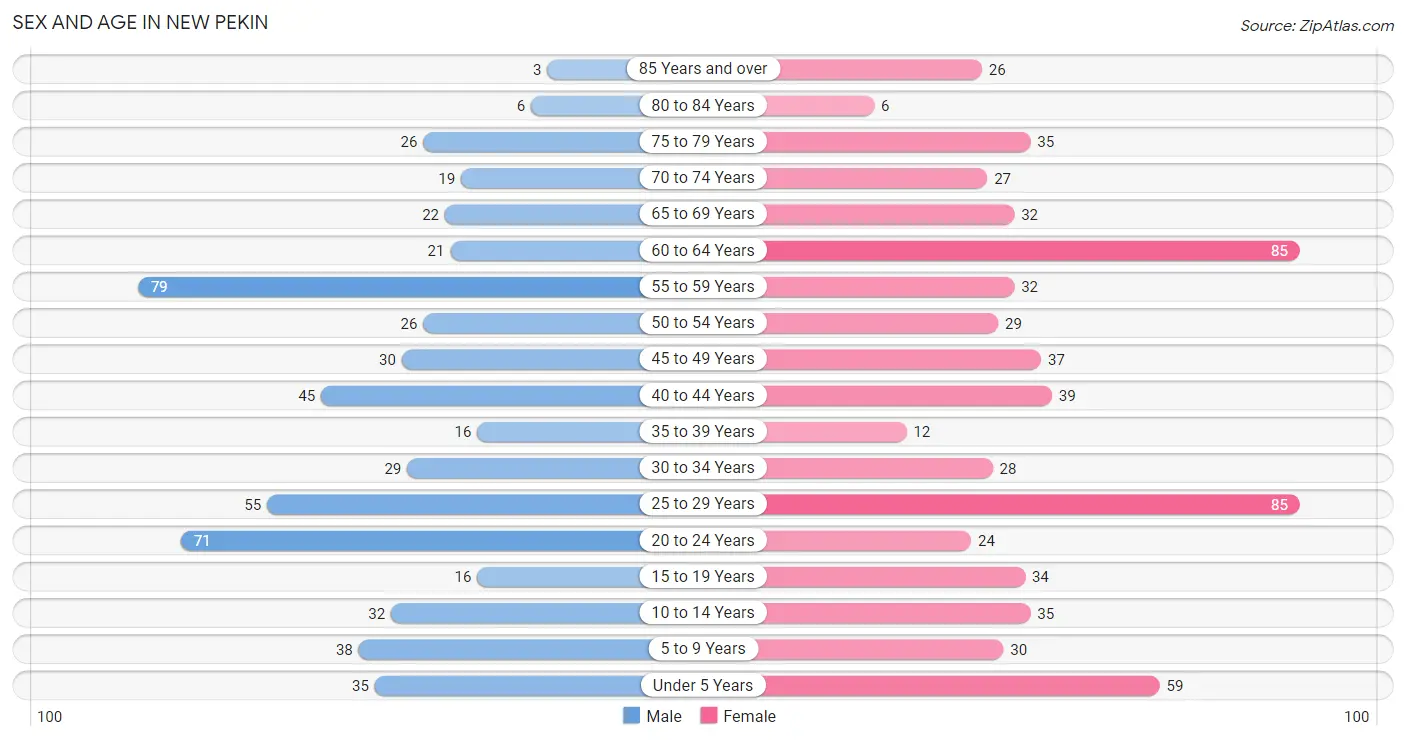
| Age Bracket | Male | Female |
| Under 5 Years | 35 (6.1%) | 59 (9.0%) |
| 5 to 9 Years | 38 (6.7%) | 30 (4.6%) |
| 10 to 14 Years | 32 (5.6%) | 35 (5.3%) |
| 15 to 19 Years | 16 (2.8%) | 34 (5.2%) |
| 20 to 24 Years | 71 (12.5%) | 24 (3.7%) |
| 25 to 29 Years | 55 (9.7%) | 85 (13.0%) |
| 30 to 34 Years | 29 (5.1%) | 28 (4.3%) |
| 35 to 39 Years | 16 (2.8%) | 12 (1.8%) |
| 40 to 44 Years | 45 (7.9%) | 39 (5.9%) |
| 45 to 49 Years | 30 (5.3%) | 37 (5.7%) |
| 50 to 54 Years | 26 (4.6%) | 29 (4.4%) |
| 55 to 59 Years | 79 (13.9%) | 32 (4.9%) |
| 60 to 64 Years | 21 (3.7%) | 85 (13.0%) |
| 65 to 69 Years | 22 (3.9%) | 32 (4.9%) |
| 70 to 74 Years | 19 (3.3%) | 27 (4.1%) |
| 75 to 79 Years | 26 (4.6%) | 35 (5.3%) |
| 80 to 84 Years | 6 (1.1%) | 6 (0.9%) |
| 85 Years and over | 3 (0.5%) | 26 (4.0%) |
| Total | 569 (100.0%) | 655 (100.0%) |
Families and Households in New Pekin
Median Family Size in New Pekin
The median family size in New Pekin is 3.00 persons per family, with single male/father families (24 | 7.3%) accounting for the largest median family size of 3.88 persons per family. On the other hand, single female/mother families (107 | 32.5%) represent the smallest median family size with 2.52 persons per family.
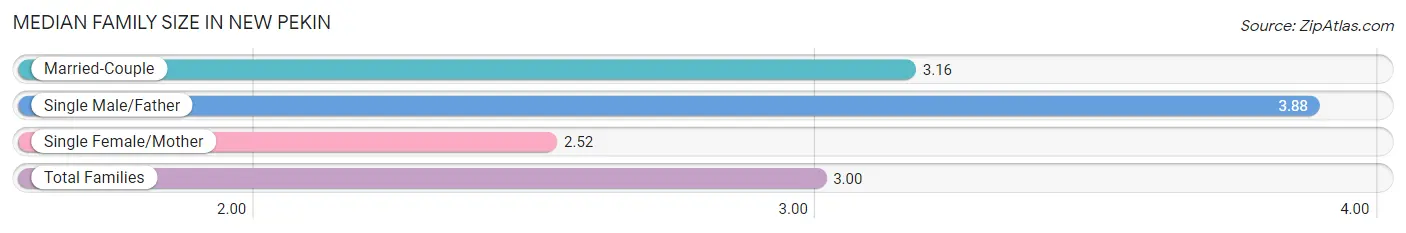
| Family Type | # Families | Family Size |
| Married-Couple | 198 (60.2%) | 3.16 |
| Single Male/Father | 24 (7.3%) | 3.88 |
| Single Female/Mother | 107 (32.5%) | 2.52 |
| Total Families | 329 (100.0%) | 3.00 |
Median Household Size in New Pekin
The median household size in New Pekin is 2.41 persons per household, with single male/father households (24 | 4.7%) accounting for the largest median household size of 4.42 persons per household. non-family households (179 | 35.2%) represent the smallest median household size with 1.20 persons per household.
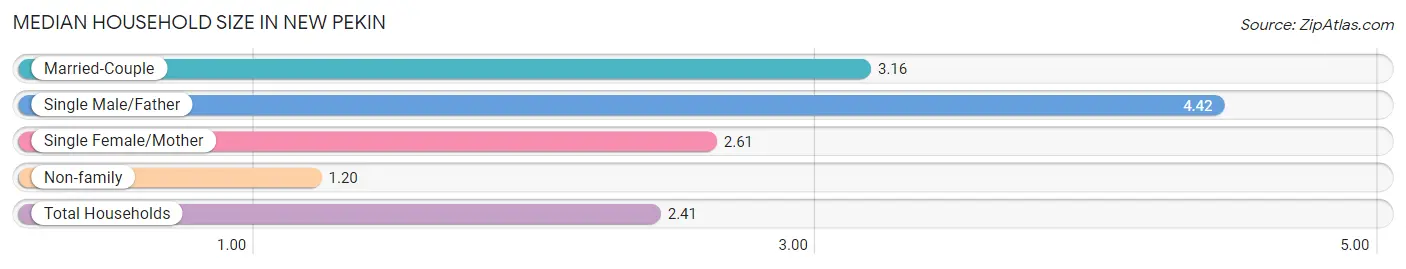
| Household Type | # Households | Household Size |
| Married-Couple | 198 (39.0%) | 3.16 |
| Single Male/Father | 24 (4.7%) | 4.42 |
| Single Female/Mother | 107 (21.1%) | 2.61 |
| Non-family | 179 (35.2%) | 1.20 |
| Total Households | 508 (100.0%) | 2.41 |
Household Size by Marriage Status in New Pekin
Out of a total of 508 households in New Pekin, 329 (64.8%) are family households, while 179 (35.2%) are nonfamily households. The most numerous type of family households are 2-person households, comprising 162, and the most common type of nonfamily households are 1-person households, comprising 154.
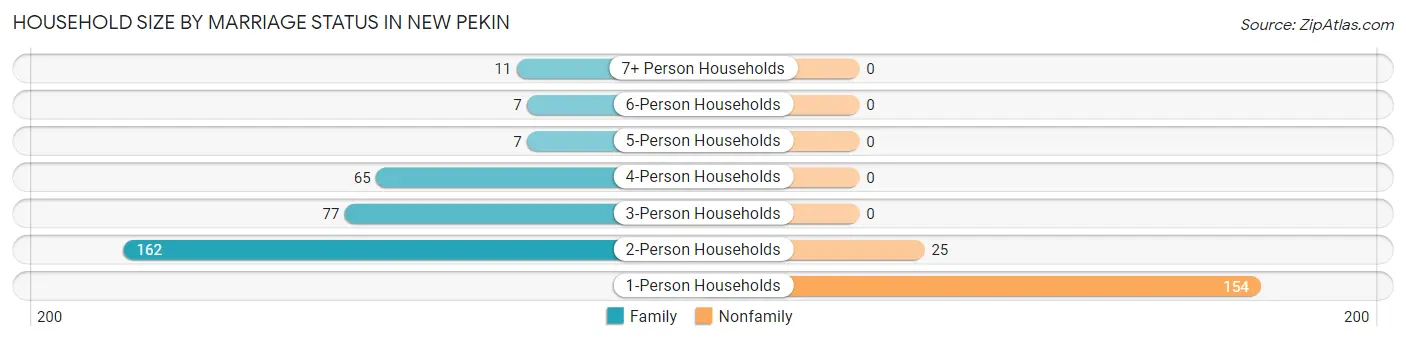
| Household Size | Family Households | Nonfamily Households |
| 1-Person Households | - | 154 (30.3%) |
| 2-Person Households | 162 (31.9%) | 25 (4.9%) |
| 3-Person Households | 77 (15.2%) | 0 (0.0%) |
| 4-Person Households | 65 (12.8%) | 0 (0.0%) |
| 5-Person Households | 7 (1.4%) | 0 (0.0%) |
| 6-Person Households | 7 (1.4%) | 0 (0.0%) |
| 7+ Person Households | 11 (2.2%) | 0 (0.0%) |
| Total | 329 (64.8%) | 179 (35.2%) |
Female Fertility in New Pekin
Fertility by Age in New Pekin
Average fertility rate in New Pekin is 99.0 births per 1,000 women. Women in the age bracket of 20 to 34 years have the highest fertility rate with 190.0 births per 1,000 women. Women in the age bracket of 20 to 34 years acount for 100.0% of all women with births.
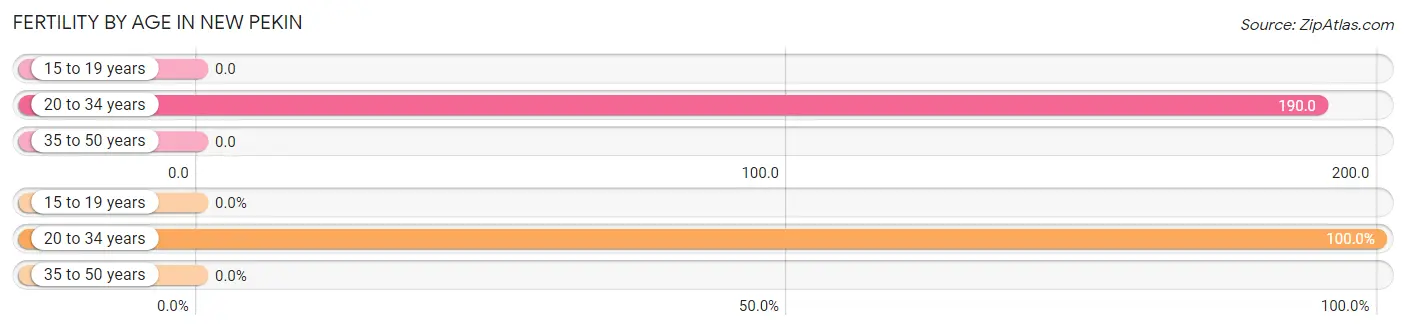
| Age Bracket | Women with Births | Births / 1,000 Women |
| 15 to 19 years | 0 (0.0%) | 0.0 |
| 20 to 34 years | 26 (100.0%) | 190.0 |
| 35 to 50 years | 0 (0.0%) | 0.0 |
| Total | 26 (100.0%) | 99.0 |
Fertility by Age by Marriage Status in New Pekin
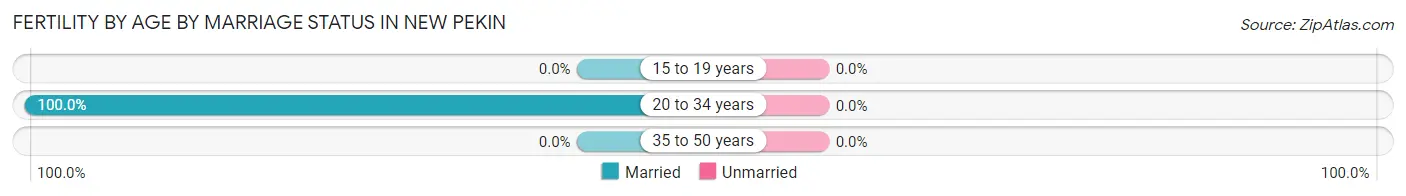
| Age Bracket | Married | Unmarried |
| 15 to 19 years | 0 (0.0%) | 0 (0.0%) |
| 20 to 34 years | 26 (100.0%) | 0 (0.0%) |
| 35 to 50 years | 0 (0.0%) | 0 (0.0%) |
| Total | 26 (100.0%) | 0 (0.0%) |
Fertility by Education in New Pekin
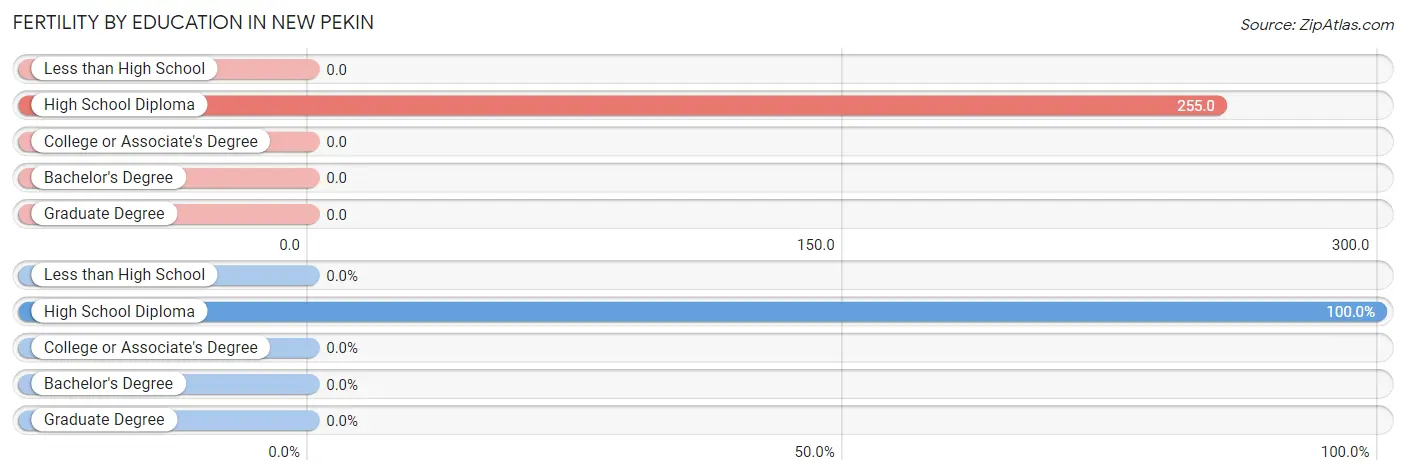
| Educational Attainment | Women with Births | Births / 1,000 Women |
| Less than High School | 0 (0.0%) | 0.0 |
| High School Diploma | 26 (100.0%) | 255.0 |
| College or Associate's Degree | 0 (0.0%) | 0.0 |
| Bachelor's Degree | 0 (0.0%) | 0.0 |
| Graduate Degree | 0 (0.0%) | 0.0 |
| Total | 26 (100.0%) | 99.0 |
Fertility by Education by Marriage Status in New Pekin
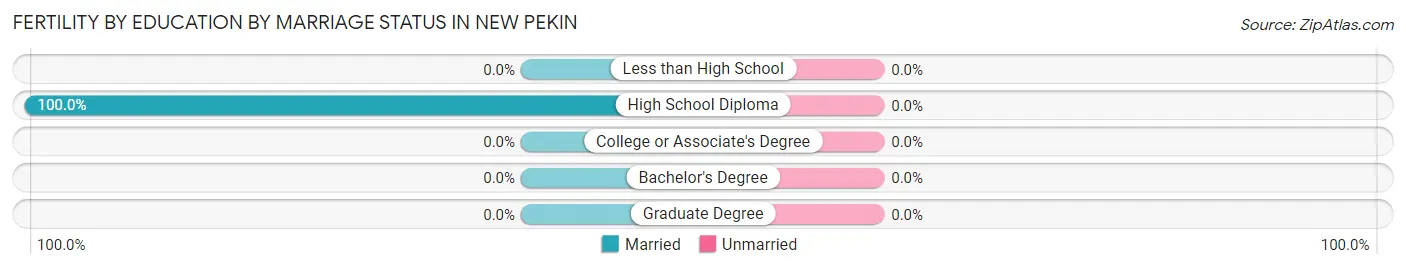
| Educational Attainment | Married | Unmarried |
| Less than High School | 0 (0.0%) | 0 (0.0%) |
| High School Diploma | 26 (100.0%) | 0 (0.0%) |
| College or Associate's Degree | 0 (0.0%) | 0 (0.0%) |
| Bachelor's Degree | 0 (0.0%) | 0 (0.0%) |
| Graduate Degree | 0 (0.0%) | 0 (0.0%) |
| Total | 26 (100.0%) | 0 (0.0%) |
Employment Characteristics in New Pekin
Employment by Class of Employer in New Pekin
Among the 516 employed individuals in New Pekin, private company employees (340 | 65.9%), not-for-profit organizations (53 | 10.3%), and local government employees (40 | 7.7%) make up the most common classes of employment.
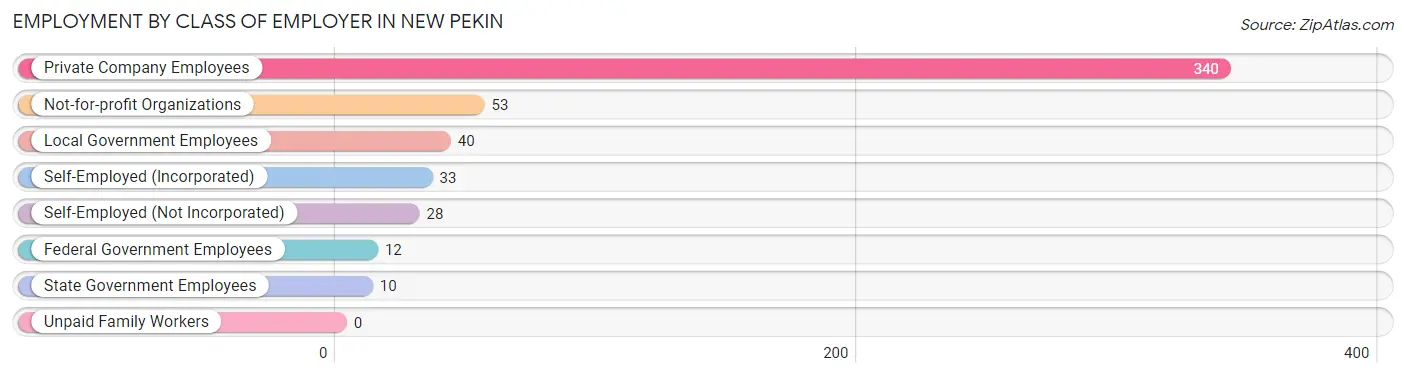
| Employer Class | # Employees | % Employees |
| Private Company Employees | 340 | 65.9% |
| Self-Employed (Incorporated) | 33 | 6.4% |
| Self-Employed (Not Incorporated) | 28 | 5.4% |
| Not-for-profit Organizations | 53 | 10.3% |
| Local Government Employees | 40 | 7.7% |
| State Government Employees | 10 | 1.9% |
| Federal Government Employees | 12 | 2.3% |
| Unpaid Family Workers | 0 | 0.0% |
| Total | 516 | 100.0% |
Employment Status by Age in New Pekin
According to the labor force statistics for New Pekin, out of the total population over 16 years of age (982), 56.7% or 557 individuals are in the labor force, with 4.5% or 25 of them unemployed. The age group with the highest labor force participation rate is 30 to 34 years, with 94.7% or 54 individuals in the labor force. Within the labor force, the 20 to 24 years age range has the highest percentage of unemployed individuals, with 15.9% or 13 of them being unemployed.
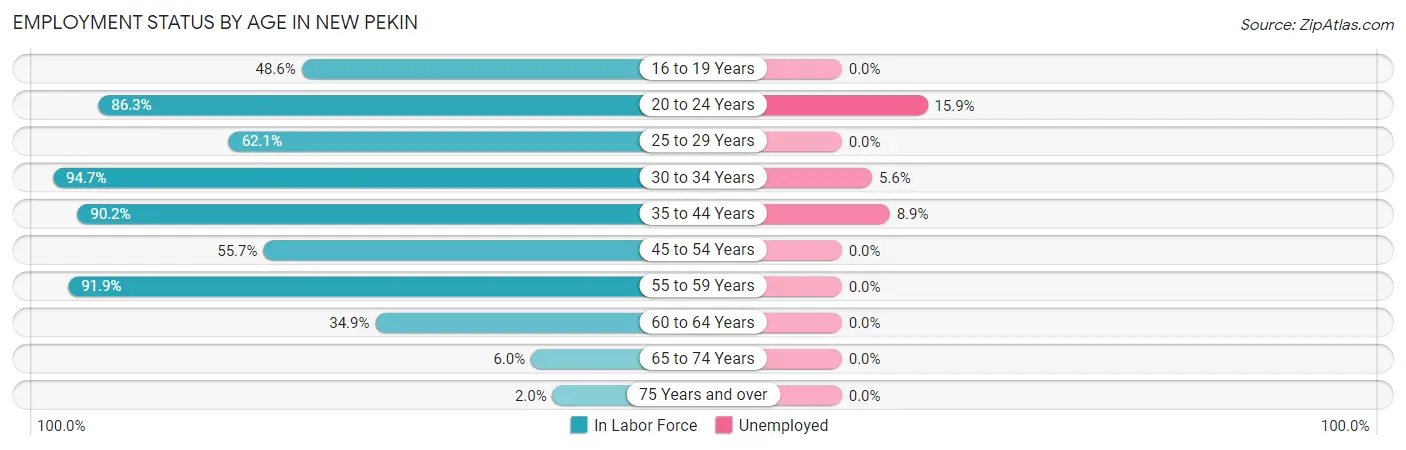
| Age Bracket | In Labor Force | Unemployed |
| 16 to 19 Years | 18 (48.6%) | 0 (0.0%) |
| 20 to 24 Years | 82 (86.3%) | 13 (15.9%) |
| 25 to 29 Years | 87 (62.1%) | 0 (0.0%) |
| 30 to 34 Years | 54 (94.7%) | 3 (5.6%) |
| 35 to 44 Years | 101 (90.2%) | 9 (8.9%) |
| 45 to 54 Years | 68 (55.7%) | 0 (0.0%) |
| 55 to 59 Years | 102 (91.9%) | 0 (0.0%) |
| 60 to 64 Years | 37 (34.9%) | 0 (0.0%) |
| 65 to 74 Years | 6 (6.0%) | 0 (0.0%) |
| 75 Years and over | 2 (2.0%) | 0 (0.0%) |
| Total | 557 (56.7%) | 25 (4.5%) |
Employment Status by Educational Attainment in New Pekin
According to labor force statistics for New Pekin, 69.3% of individuals (449) out of the total population between 25 and 64 years of age (648) are in the labor force, with 2.7% or 12 of them being unemployed. The group with the highest labor force participation rate are those with the educational attainment of bachelor's degree or higher, with 82.1% or 69 individuals in the labor force. Within the labor force, individuals with college / associate degree education have the highest percentage of unemployment, with 7.9% or 12 of them being unemployed.
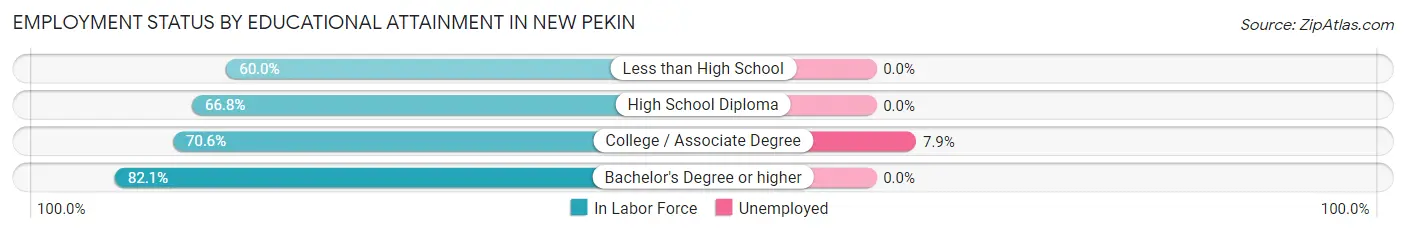
| Educational Attainment | In Labor Force | Unemployed |
| Less than High School | 42 (60.0%) | 0 (0.0%) |
| High School Diploma | 187 (66.8%) | 0 (0.0%) |
| College / Associate Degree | 151 (70.6%) | 17 (7.9%) |
| Bachelor's Degree or higher | 69 (82.1%) | 0 (0.0%) |
| Total | 449 (69.3%) | 17 (2.7%) |
Employment Occupations by Sex in New Pekin
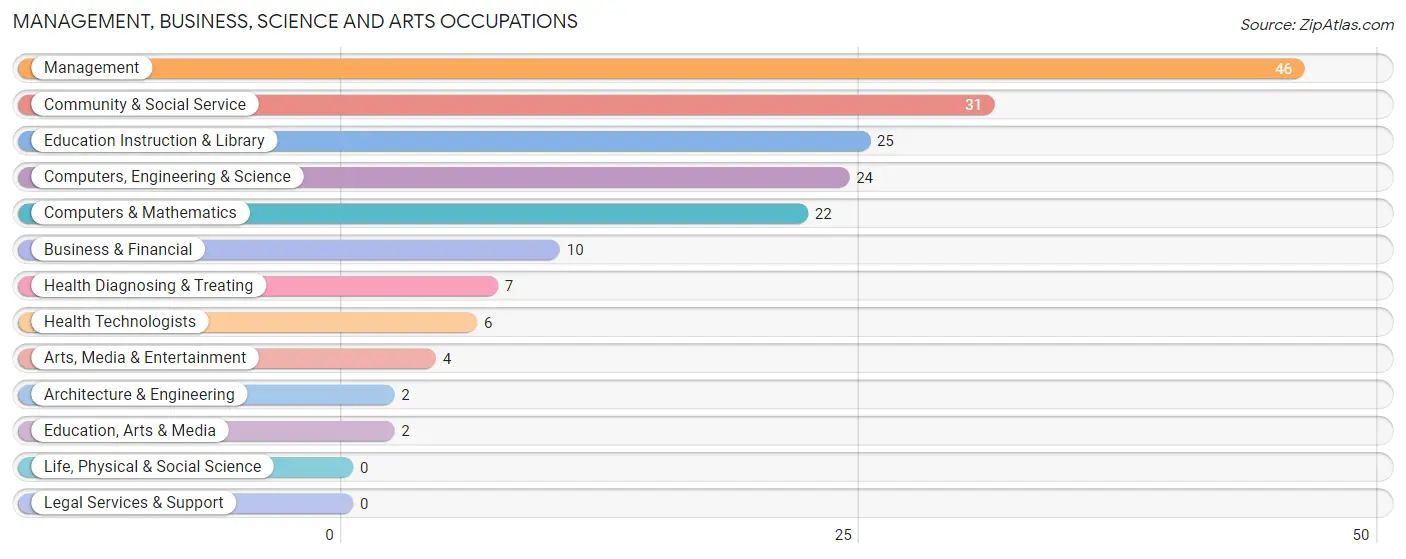
Management, Business, Science and Arts Occupations
The most common Management, Business, Science and Arts occupations in New Pekin are Management (46 | 8.6%), Community & Social Service (31 | 5.8%), Education Instruction & Library (25 | 4.7%), Computers, Engineering & Science (24 | 4.5%), and Computers & Mathematics (22 | 4.1%).
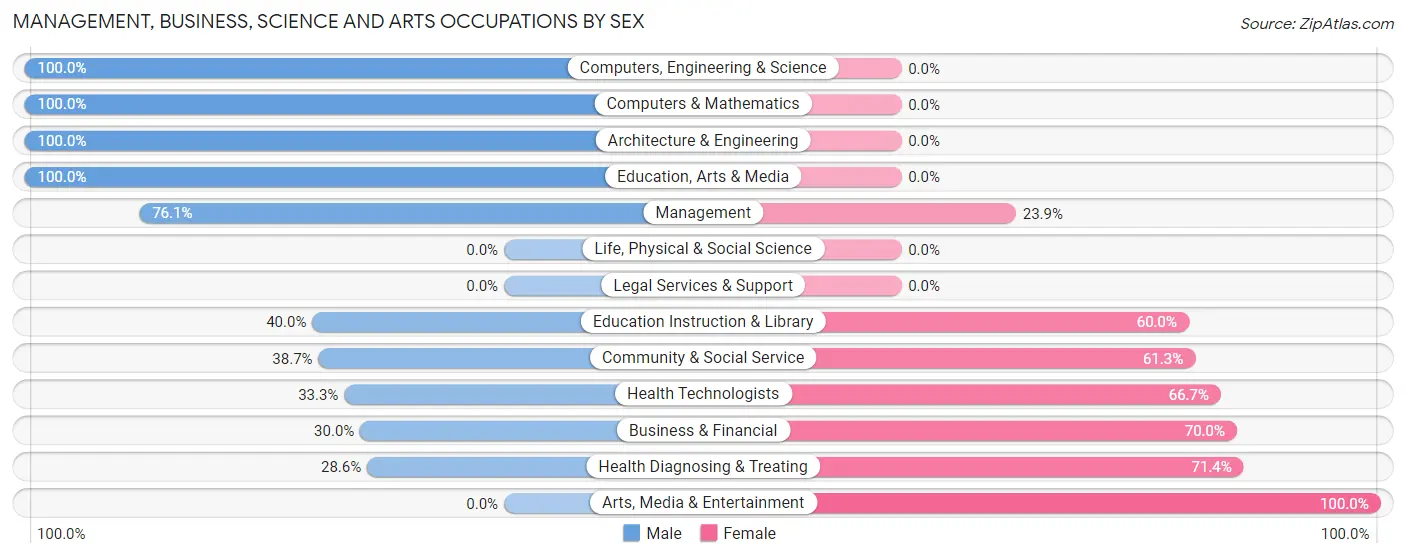
Management, Business, Science and Arts Occupations by Sex
Within the Management, Business, Science and Arts occupations in New Pekin, the most male-oriented occupations are Computers, Engineering & Science (100.0%), Computers & Mathematics (100.0%), and Architecture & Engineering (100.0%), while the most female-oriented occupations are Arts, Media & Entertainment (100.0%), Health Diagnosing & Treating (71.4%), and Business & Financial (70.0%).
| Occupation | Male | Female |
| Management | 35 (76.1%) | 11 (23.9%) |
| Business & Financial | 3 (30.0%) | 7 (70.0%) |
| Computers, Engineering & Science | 24 (100.0%) | 0 (0.0%) |
| Computers & Mathematics | 22 (100.0%) | 0 (0.0%) |
| Architecture & Engineering | 2 (100.0%) | 0 (0.0%) |
| Life, Physical & Social Science | 0 (0.0%) | 0 (0.0%) |
| Community & Social Service | 12 (38.7%) | 19 (61.3%) |
| Education, Arts & Media | 2 (100.0%) | 0 (0.0%) |
| Legal Services & Support | 0 (0.0%) | 0 (0.0%) |
| Education Instruction & Library | 10 (40.0%) | 15 (60.0%) |
| Arts, Media & Entertainment | 0 (0.0%) | 4 (100.0%) |
| Health Diagnosing & Treating | 2 (28.6%) | 5 (71.4%) |
| Health Technologists | 2 (33.3%) | 4 (66.7%) |
| Total (Category) | 76 (64.4%) | 42 (35.6%) |
| Total (Overall) | 315 (59.2%) | 217 (40.8%) |
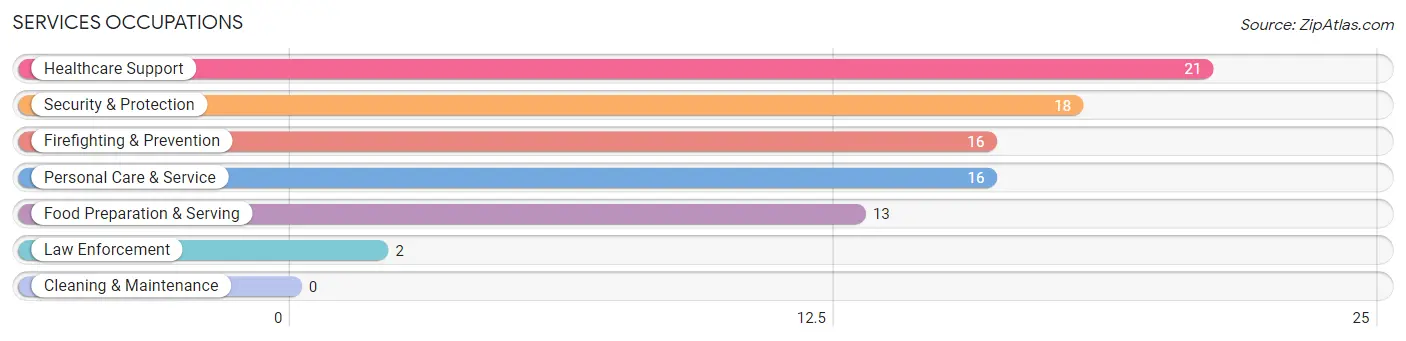
Services Occupations
The most common Services occupations in New Pekin are Healthcare Support (21 | 4.0%), Security & Protection (18 | 3.4%), Firefighting & Prevention (16 | 3.0%), Personal Care & Service (16 | 3.0%), and Food Preparation & Serving (13 | 2.4%).
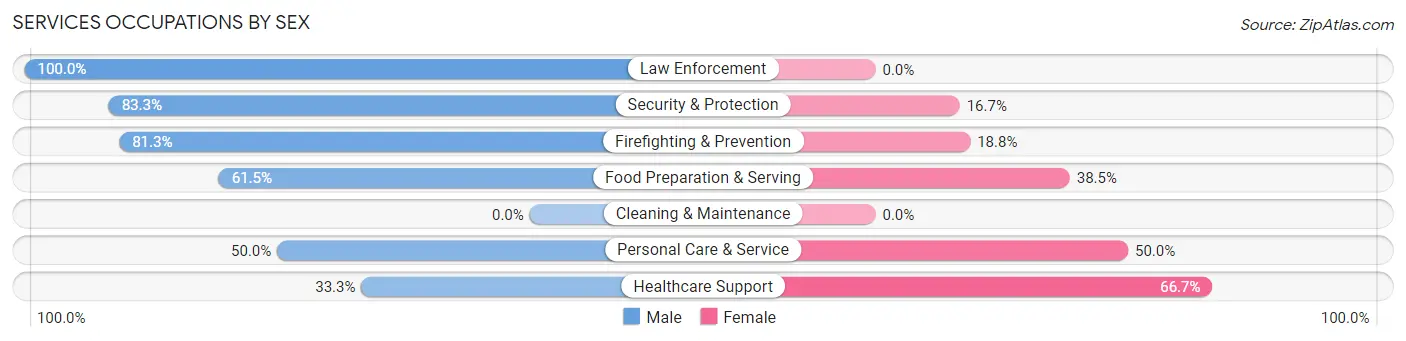
Services Occupations by Sex
Within the Services occupations in New Pekin, the most male-oriented occupations are Law Enforcement (100.0%), Security & Protection (83.3%), and Firefighting & Prevention (81.2%), while the most female-oriented occupations are Healthcare Support (66.7%), Personal Care & Service (50.0%), and Food Preparation & Serving (38.5%).
| Occupation | Male | Female |
| Healthcare Support | 7 (33.3%) | 14 (66.7%) |
| Security & Protection | 15 (83.3%) | 3 (16.7%) |
| Firefighting & Prevention | 13 (81.2%) | 3 (18.8%) |
| Law Enforcement | 2 (100.0%) | 0 (0.0%) |
| Food Preparation & Serving | 8 (61.5%) | 5 (38.5%) |
| Cleaning & Maintenance | 0 (0.0%) | 0 (0.0%) |
| Personal Care & Service | 8 (50.0%) | 8 (50.0%) |
| Total (Category) | 38 (55.9%) | 30 (44.1%) |
| Total (Overall) | 315 (59.2%) | 217 (40.8%) |
Sales and Office Occupations
The most common Sales and Office occupations in New Pekin are Office & Administration (67 | 12.6%), and Sales & Related (48 | 9.0%).

Sales and Office Occupations by Sex
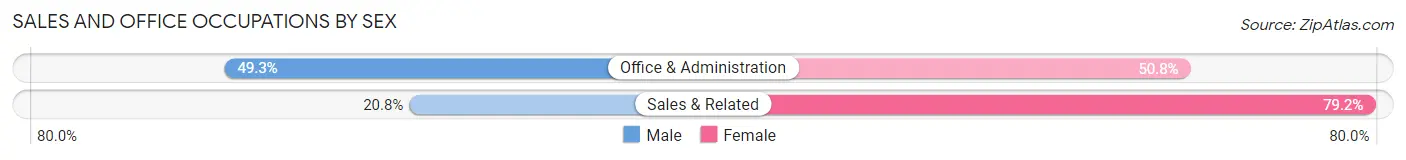
| Occupation | Male | Female |
| Sales & Related | 10 (20.8%) | 38 (79.2%) |
| Office & Administration | 33 (49.2%) | 34 (50.7%) |
| Total (Category) | 43 (37.4%) | 72 (62.6%) |
| Total (Overall) | 315 (59.2%) | 217 (40.8%) |
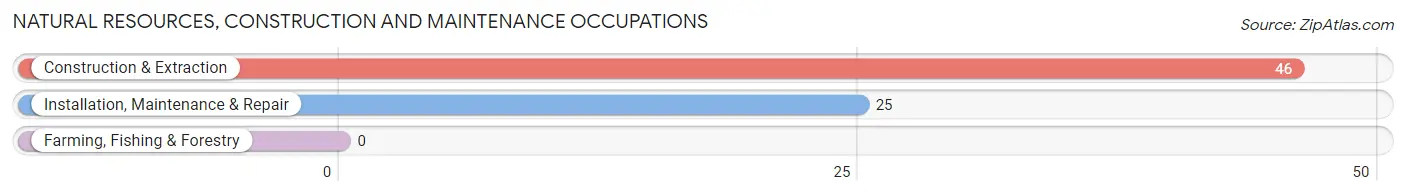
Natural Resources, Construction and Maintenance Occupations
The most common Natural Resources, Construction and Maintenance occupations in New Pekin are Construction & Extraction (46 | 8.6%), and Installation, Maintenance & Repair (25 | 4.7%).
Natural Resources, Construction and Maintenance Occupations by Sex
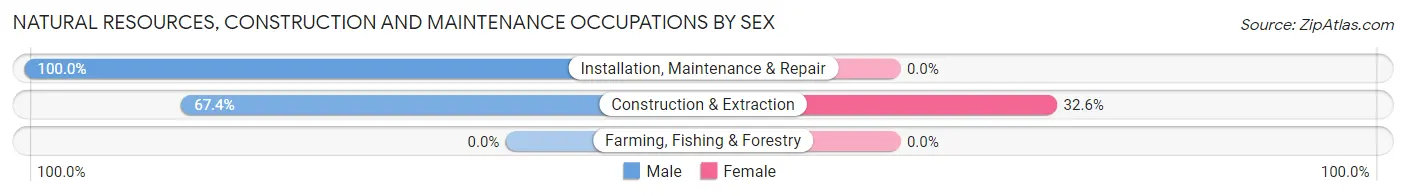
| Occupation | Male | Female |
| Farming, Fishing & Forestry | 0 (0.0%) | 0 (0.0%) |
| Construction & Extraction | 31 (67.4%) | 15 (32.6%) |
| Installation, Maintenance & Repair | 25 (100.0%) | 0 (0.0%) |
| Total (Category) | 56 (78.9%) | 15 (21.1%) |
| Total (Overall) | 315 (59.2%) | 217 (40.8%) |
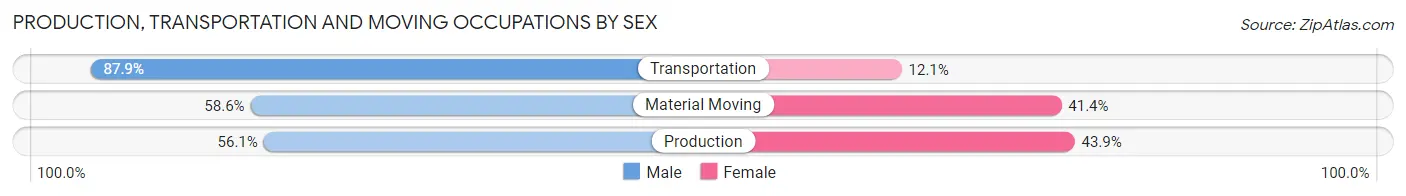
Production, Transportation and Moving Occupations
The most common Production, Transportation and Moving occupations in New Pekin are Material Moving (70 | 13.2%), Production (57 | 10.7%), and Transportation (33 | 6.2%).
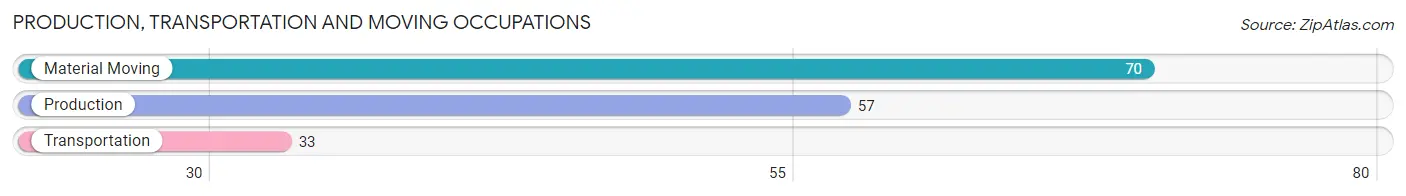
Production, Transportation and Moving Occupations by Sex
| Occupation | Male | Female |
| Production | 32 (56.1%) | 25 (43.9%) |
| Transportation | 29 (87.9%) | 4 (12.1%) |
| Material Moving | 41 (58.6%) | 29 (41.4%) |
| Total (Category) | 102 (63.7%) | 58 (36.2%) |
| Total (Overall) | 315 (59.2%) | 217 (40.8%) |
Employment Industries by Sex in New Pekin
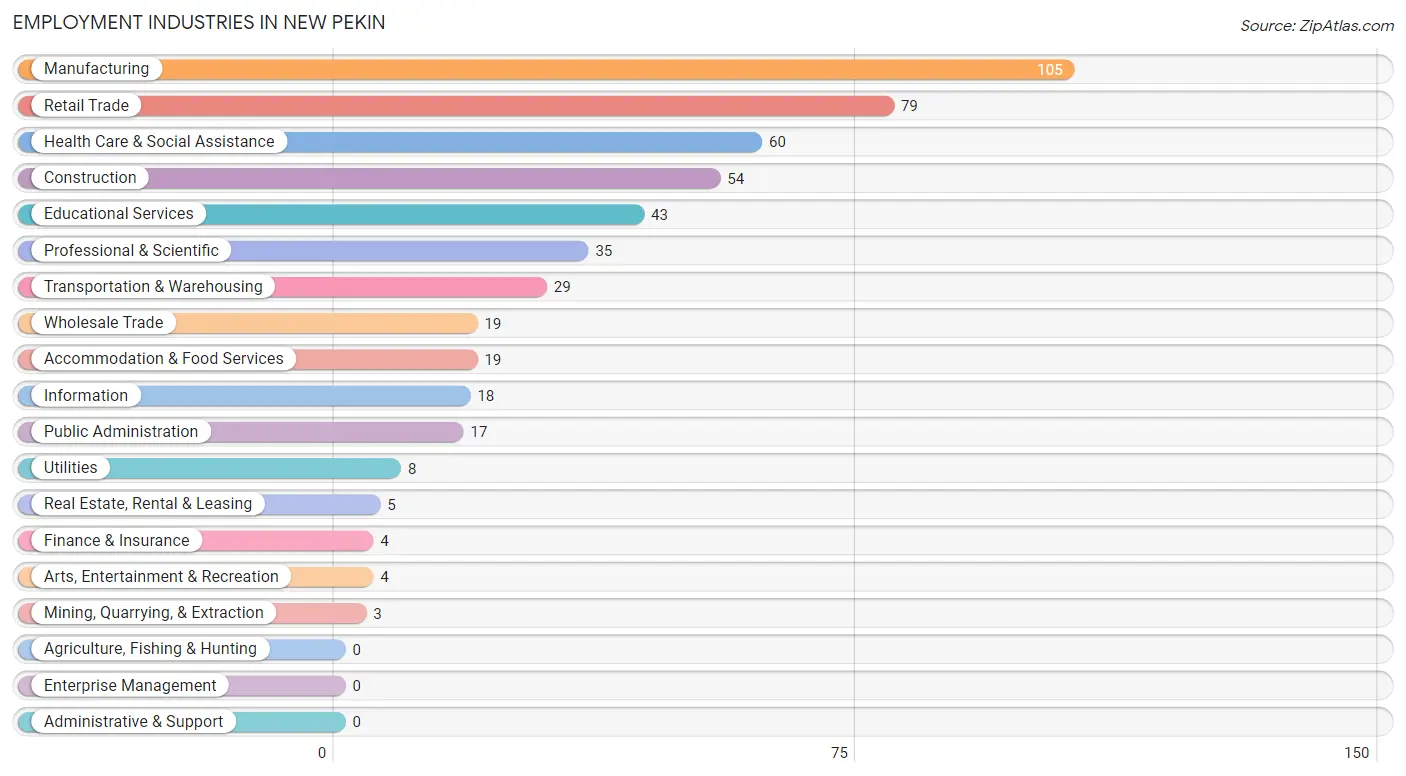
Employment Industries in New Pekin
The major employment industries in New Pekin include Manufacturing (105 | 19.7%), Retail Trade (79 | 14.8%), Health Care & Social Assistance (60 | 11.3%), Construction (54 | 10.2%), and Educational Services (43 | 8.1%).
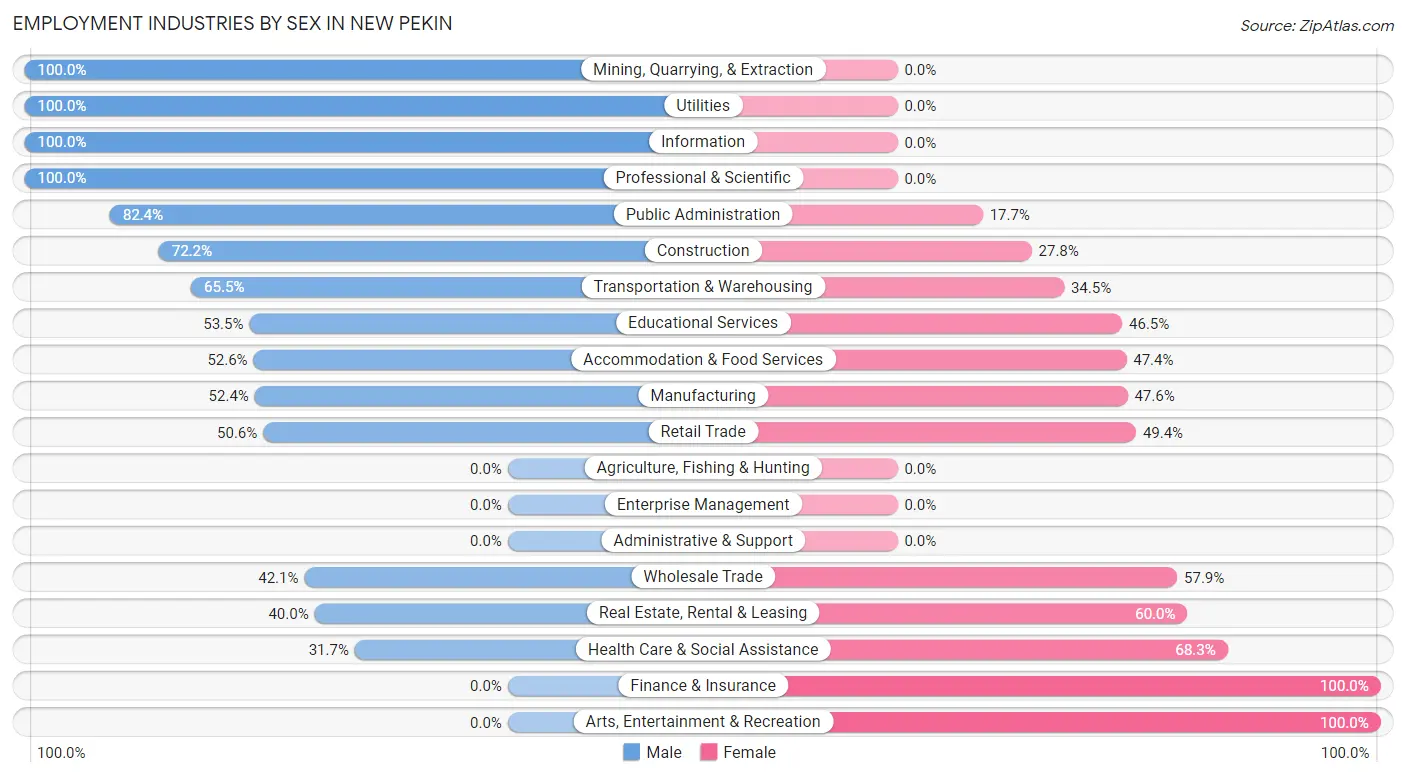
Employment Industries by Sex in New Pekin
The New Pekin industries that see more men than women are Mining, Quarrying, & Extraction (100.0%), Utilities (100.0%), and Information (100.0%), whereas the industries that tend to have a higher number of women are Finance & Insurance (100.0%), Arts, Entertainment & Recreation (100.0%), and Health Care & Social Assistance (68.3%).
| Industry | Male | Female |
| Agriculture, Fishing & Hunting | 0 (0.0%) | 0 (0.0%) |
| Mining, Quarrying, & Extraction | 3 (100.0%) | 0 (0.0%) |
| Construction | 39 (72.2%) | 15 (27.8%) |
| Manufacturing | 55 (52.4%) | 50 (47.6%) |
| Wholesale Trade | 8 (42.1%) | 11 (57.9%) |
| Retail Trade | 40 (50.6%) | 39 (49.4%) |
| Transportation & Warehousing | 19 (65.5%) | 10 (34.5%) |
| Utilities | 8 (100.0%) | 0 (0.0%) |
| Information | 18 (100.0%) | 0 (0.0%) |
| Finance & Insurance | 0 (0.0%) | 4 (100.0%) |
| Real Estate, Rental & Leasing | 2 (40.0%) | 3 (60.0%) |
| Professional & Scientific | 35 (100.0%) | 0 (0.0%) |
| Enterprise Management | 0 (0.0%) | 0 (0.0%) |
| Administrative & Support | 0 (0.0%) | 0 (0.0%) |
| Educational Services | 23 (53.5%) | 20 (46.5%) |
| Health Care & Social Assistance | 19 (31.7%) | 41 (68.3%) |
| Arts, Entertainment & Recreation | 0 (0.0%) | 4 (100.0%) |
| Accommodation & Food Services | 10 (52.6%) | 9 (47.4%) |
| Public Administration | 14 (82.4%) | 3 (17.6%) |
| Total | 315 (59.2%) | 217 (40.8%) |
Education in New Pekin
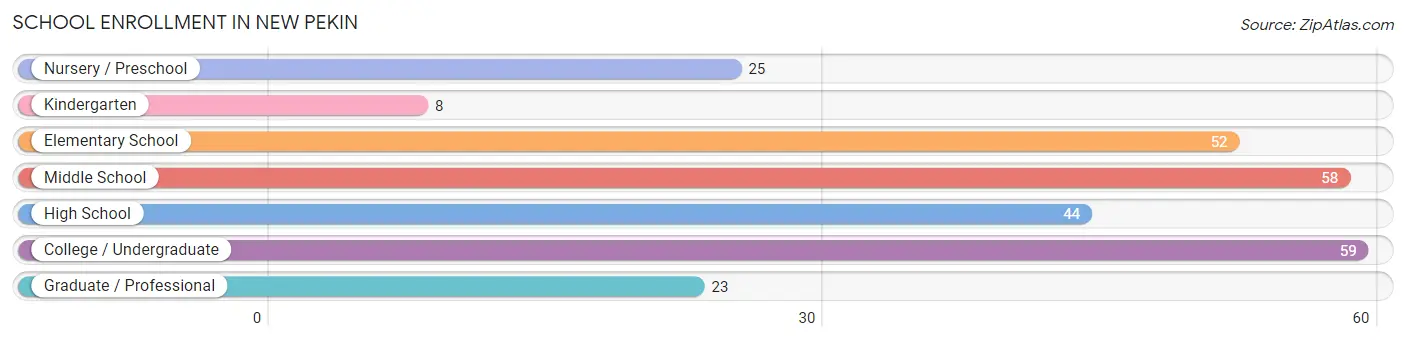
School Enrollment in New Pekin
The most common levels of schooling among the 269 students in New Pekin are college / undergraduate (59 | 21.9%), middle school (58 | 21.6%), and elementary school (52 | 19.3%).
| School Level | # Students | % Students |
| Nursery / Preschool | 25 | 9.3% |
| Kindergarten | 8 | 3.0% |
| Elementary School | 52 | 19.3% |
| Middle School | 58 | 21.6% |
| High School | 44 | 16.4% |
| College / Undergraduate | 59 | 21.9% |
| Graduate / Professional | 23 | 8.6% |
| Total | 269 | 100.0% |
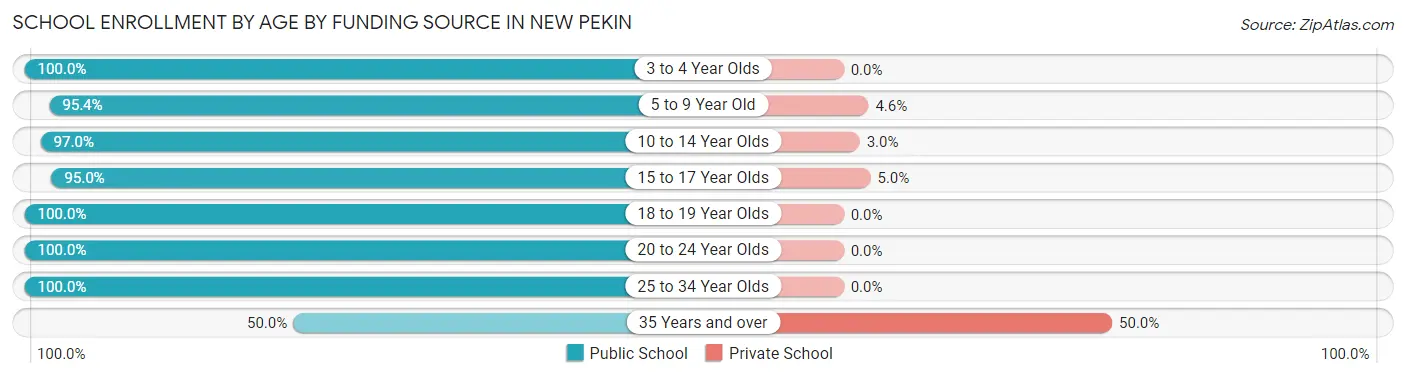
School Enrollment by Age by Funding Source in New Pekin
Out of a total of 269 students who are enrolled in schools in New Pekin, 16 (5.9%) attend a private institution, while the remaining 253 (94.1%) are enrolled in public schools. The age group of 35 years and over has the highest likelihood of being enrolled in private schools, with 9 (50.0% in the age bracket) enrolled. Conversely, the age group of 3 to 4 year olds has the lowest likelihood of being enrolled in a private school, with 15 (100.0% in the age bracket) attending a public institution.
| Age Bracket | Public School | Private School |
| 3 to 4 Year Olds | 15 (100.0%) | 0 (0.0%) |
| 5 to 9 Year Old | 62 (95.4%) | 3 (4.6%) |
| 10 to 14 Year Olds | 65 (97.0%) | 2 (3.0%) |
| 15 to 17 Year Olds | 38 (95.0%) | 2 (5.0%) |
| 18 to 19 Year Olds | 2 (100.0%) | 0 (0.0%) |
| 20 to 24 Year Olds | 34 (100.0%) | 0 (0.0%) |
| 25 to 34 Year Olds | 28 (100.0%) | 0 (0.0%) |
| 35 Years and over | 9 (50.0%) | 9 (50.0%) |
| Total | 253 (94.1%) | 16 (5.9%) |
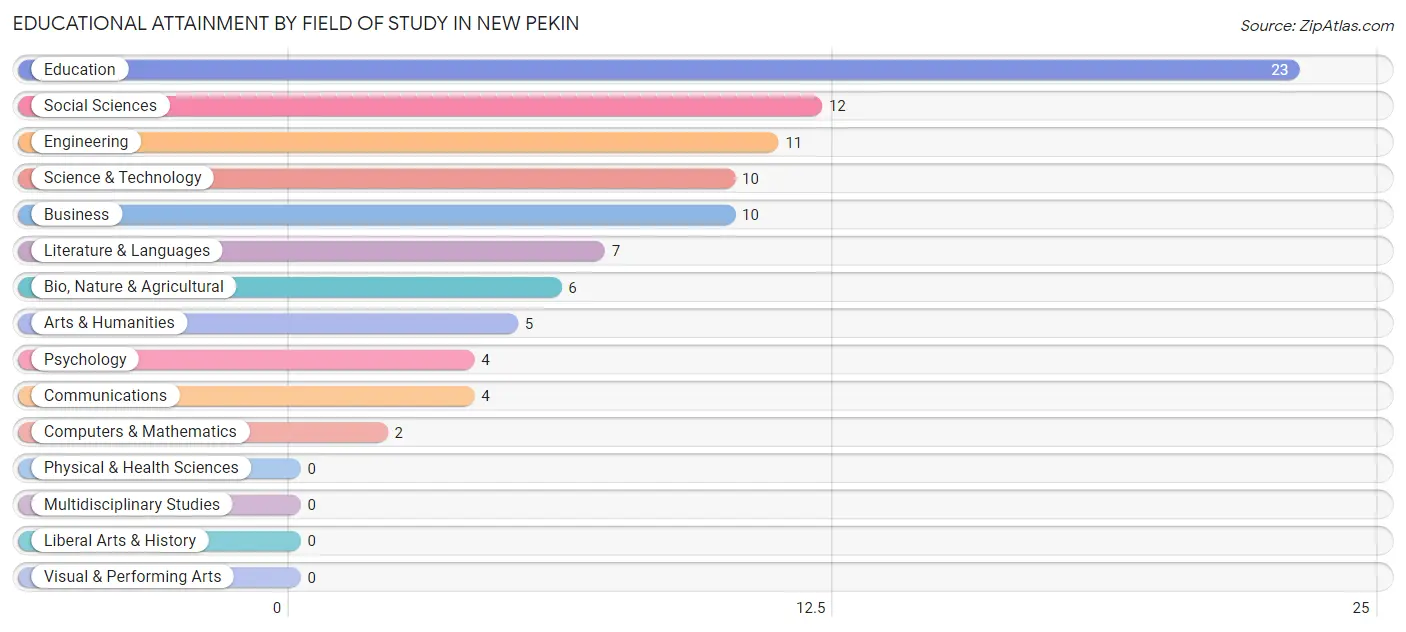
Educational Attainment by Field of Study in New Pekin
Education (23 | 24.5%), social sciences (12 | 12.8%), engineering (11 | 11.7%), science & technology (10 | 10.6%), and business (10 | 10.6%) are the most common fields of study among 94 individuals in New Pekin who have obtained a bachelor's degree or higher.
| Field of Study | # Graduates | % Graduates |
| Computers & Mathematics | 2 | 2.1% |
| Bio, Nature & Agricultural | 6 | 6.4% |
| Physical & Health Sciences | 0 | 0.0% |
| Psychology | 4 | 4.3% |
| Social Sciences | 12 | 12.8% |
| Engineering | 11 | 11.7% |
| Multidisciplinary Studies | 0 | 0.0% |
| Science & Technology | 10 | 10.6% |
| Business | 10 | 10.6% |
| Education | 23 | 24.5% |
| Literature & Languages | 7 | 7.4% |
| Liberal Arts & History | 0 | 0.0% |
| Visual & Performing Arts | 0 | 0.0% |
| Communications | 4 | 4.3% |
| Arts & Humanities | 5 | 5.3% |
| Total | 94 | 100.0% |
Transportation & Commute in New Pekin
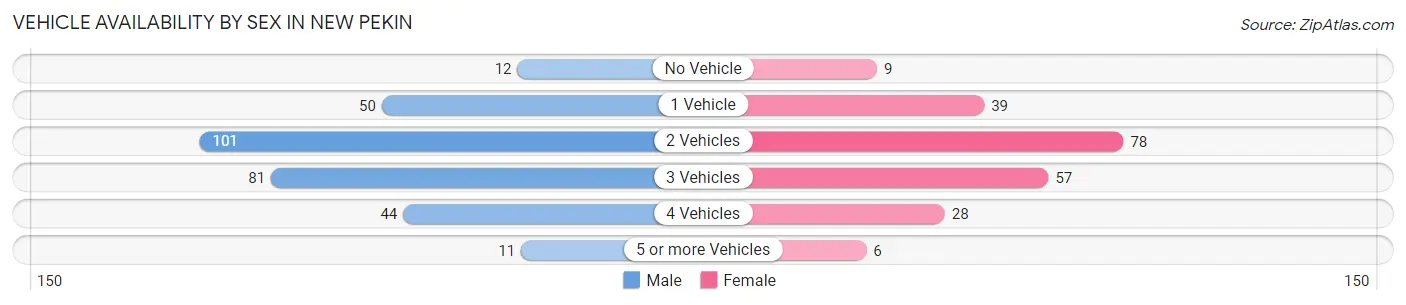
Vehicle Availability by Sex in New Pekin
The most prevalent vehicle ownership categories in New Pekin are males with 2 vehicles (101, accounting for 33.8%) and females with 2 vehicles (78, making up 46.5%).
| Vehicles Available | Male | Female |
| No Vehicle | 12 (4.0%) | 9 (4.2%) |
| 1 Vehicle | 50 (16.7%) | 39 (18.0%) |
| 2 Vehicles | 101 (33.8%) | 78 (35.9%) |
| 3 Vehicles | 81 (27.1%) | 57 (26.3%) |
| 4 Vehicles | 44 (14.7%) | 28 (12.9%) |
| 5 or more Vehicles | 11 (3.7%) | 6 (2.8%) |
| Total | 299 (100.0%) | 217 (100.0%) |
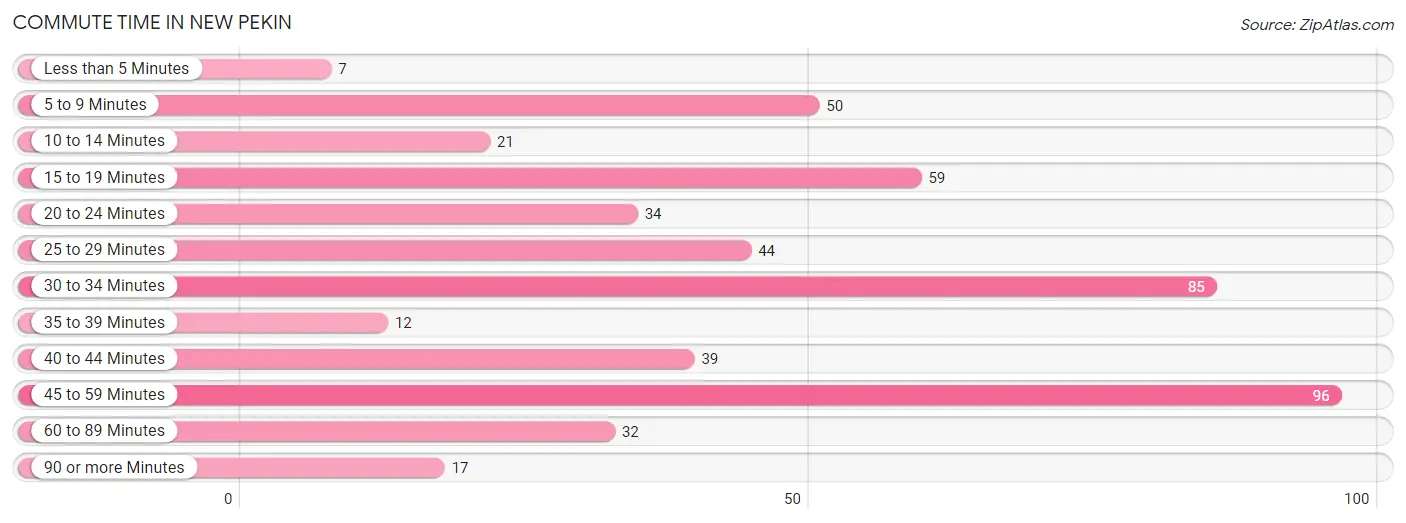
Commute Time in New Pekin
The most frequently occuring commute durations in New Pekin are 45 to 59 minutes (96 commuters, 19.4%), 30 to 34 minutes (85 commuters, 17.1%), and 15 to 19 minutes (59 commuters, 11.9%).
| Commute Time | # Commuters | % Commuters |
| Less than 5 Minutes | 7 | 1.4% |
| 5 to 9 Minutes | 50 | 10.1% |
| 10 to 14 Minutes | 21 | 4.2% |
| 15 to 19 Minutes | 59 | 11.9% |
| 20 to 24 Minutes | 34 | 6.9% |
| 25 to 29 Minutes | 44 | 8.9% |
| 30 to 34 Minutes | 85 | 17.1% |
| 35 to 39 Minutes | 12 | 2.4% |
| 40 to 44 Minutes | 39 | 7.9% |
| 45 to 59 Minutes | 96 | 19.4% |
| 60 to 89 Minutes | 32 | 6.5% |
| 90 or more Minutes | 17 | 3.4% |
Commute Time by Sex in New Pekin
The most common commute times in New Pekin are 45 to 59 minutes (63 commuters, 21.5%) for males and 5 to 9 minutes (37 commuters, 18.2%) for females.
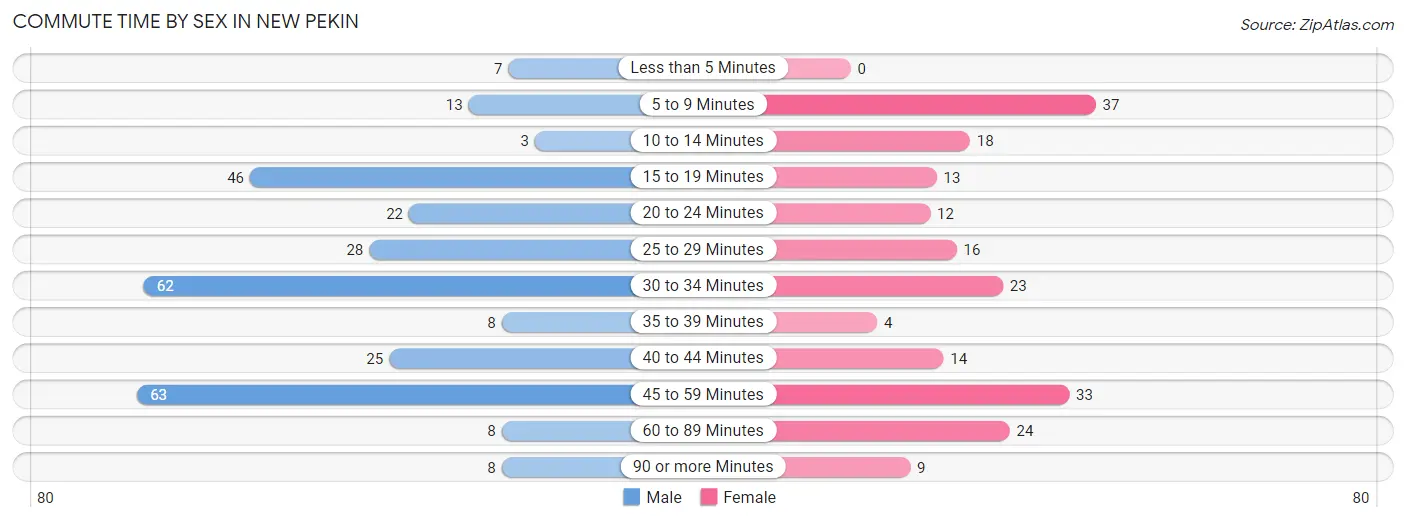
| Commute Time | Male | Female |
| Less than 5 Minutes | 7 (2.4%) | 0 (0.0%) |
| 5 to 9 Minutes | 13 (4.4%) | 37 (18.2%) |
| 10 to 14 Minutes | 3 (1.0%) | 18 (8.9%) |
| 15 to 19 Minutes | 46 (15.7%) | 13 (6.4%) |
| 20 to 24 Minutes | 22 (7.5%) | 12 (5.9%) |
| 25 to 29 Minutes | 28 (9.6%) | 16 (7.9%) |
| 30 to 34 Minutes | 62 (21.2%) | 23 (11.3%) |
| 35 to 39 Minutes | 8 (2.7%) | 4 (2.0%) |
| 40 to 44 Minutes | 25 (8.5%) | 14 (6.9%) |
| 45 to 59 Minutes | 63 (21.5%) | 33 (16.3%) |
| 60 to 89 Minutes | 8 (2.7%) | 24 (11.8%) |
| 90 or more Minutes | 8 (2.7%) | 9 (4.4%) |
Time of Departure to Work by Sex in New Pekin
The most frequent times of departure to work in New Pekin are 7:00 AM to 7:29 AM (81, 27.7%) for males and 7:30 AM to 7:59 AM (32, 15.8%) for females.
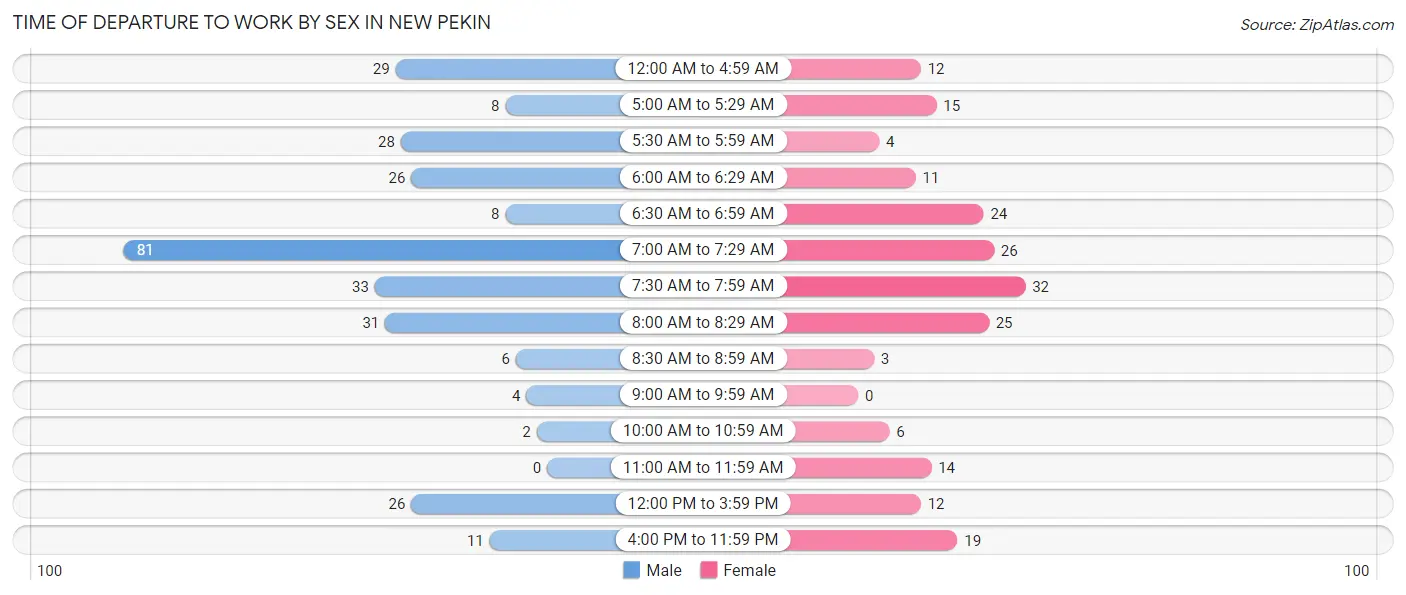
| Time of Departure | Male | Female |
| 12:00 AM to 4:59 AM | 29 (9.9%) | 12 (5.9%) |
| 5:00 AM to 5:29 AM | 8 (2.7%) | 15 (7.4%) |
| 5:30 AM to 5:59 AM | 28 (9.6%) | 4 (2.0%) |
| 6:00 AM to 6:29 AM | 26 (8.9%) | 11 (5.4%) |
| 6:30 AM to 6:59 AM | 8 (2.7%) | 24 (11.8%) |
| 7:00 AM to 7:29 AM | 81 (27.7%) | 26 (12.8%) |
| 7:30 AM to 7:59 AM | 33 (11.3%) | 32 (15.8%) |
| 8:00 AM to 8:29 AM | 31 (10.6%) | 25 (12.3%) |
| 8:30 AM to 8:59 AM | 6 (2.1%) | 3 (1.5%) |
| 9:00 AM to 9:59 AM | 4 (1.4%) | 0 (0.0%) |
| 10:00 AM to 10:59 AM | 2 (0.7%) | 6 (3.0%) |
| 11:00 AM to 11:59 AM | 0 (0.0%) | 14 (6.9%) |
| 12:00 PM to 3:59 PM | 26 (8.9%) | 12 (5.9%) |
| 4:00 PM to 11:59 PM | 11 (3.7%) | 19 (9.4%) |
| Total | 293 (100.0%) | 203 (100.0%) |
Housing Occupancy in New Pekin
Occupancy by Ownership in New Pekin
Of the total 508 dwellings in New Pekin, owner-occupied units account for 300 (59.1%), while renter-occupied units make up 208 (40.9%).
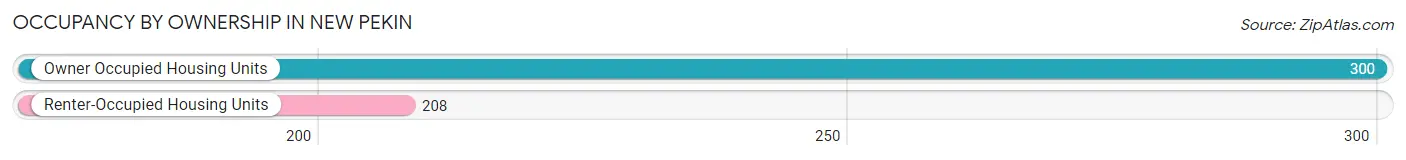
| Occupancy | # Housing Units | % Housing Units |
| Owner Occupied Housing Units | 300 | 59.1% |
| Renter-Occupied Housing Units | 208 | 40.9% |
| Total Occupied Housing Units | 508 | 100.0% |
Occupancy by Household Size in New Pekin
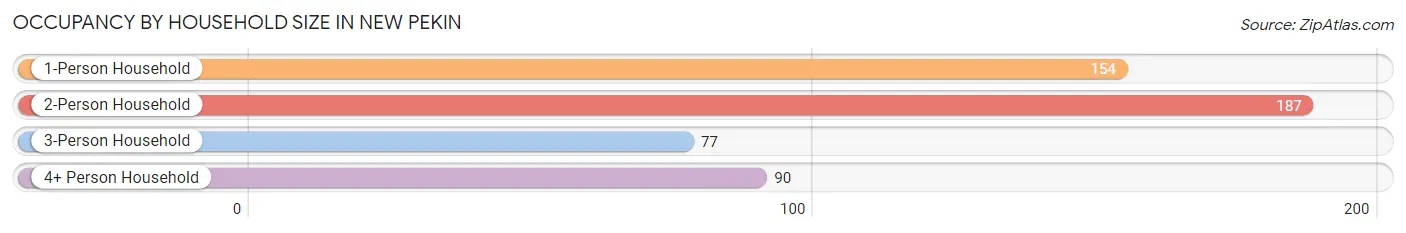
| Household Size | # Housing Units | % Housing Units |
| 1-Person Household | 154 | 30.3% |
| 2-Person Household | 187 | 36.8% |
| 3-Person Household | 77 | 15.2% |
| 4+ Person Household | 90 | 17.7% |
| Total Housing Units | 508 | 100.0% |
Occupancy by Ownership by Household Size in New Pekin
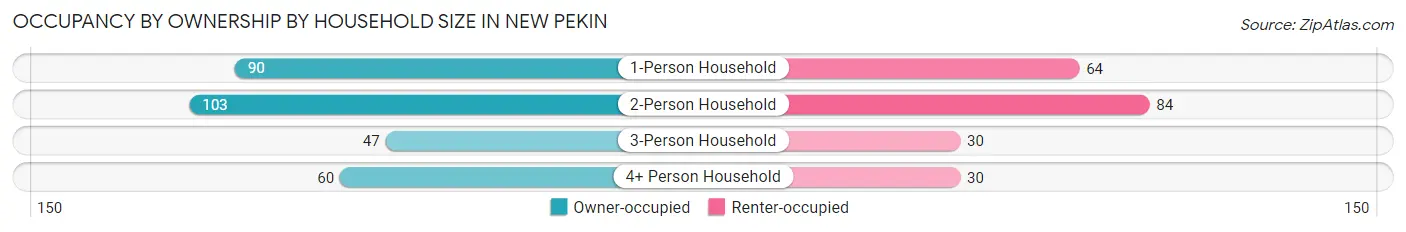
| Household Size | Owner-occupied | Renter-occupied |
| 1-Person Household | 90 (58.4%) | 64 (41.6%) |
| 2-Person Household | 103 (55.1%) | 84 (44.9%) |
| 3-Person Household | 47 (61.0%) | 30 (39.0%) |
| 4+ Person Household | 60 (66.7%) | 30 (33.3%) |
| Total Housing Units | 300 (59.1%) | 208 (40.9%) |
Occupancy by Educational Attainment in New Pekin
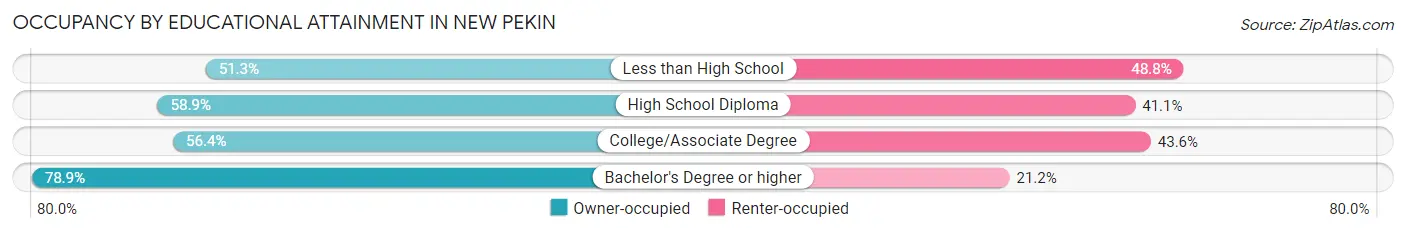
| Household Size | Owner-occupied | Renter-occupied |
| Less than High School | 41 (51.2%) | 39 (48.7%) |
| High School Diploma | 139 (58.9%) | 97 (41.1%) |
| College/Associate Degree | 79 (56.4%) | 61 (43.6%) |
| Bachelor's Degree or higher | 41 (78.8%) | 11 (21.1%) |
Occupancy by Age of Householder in New Pekin
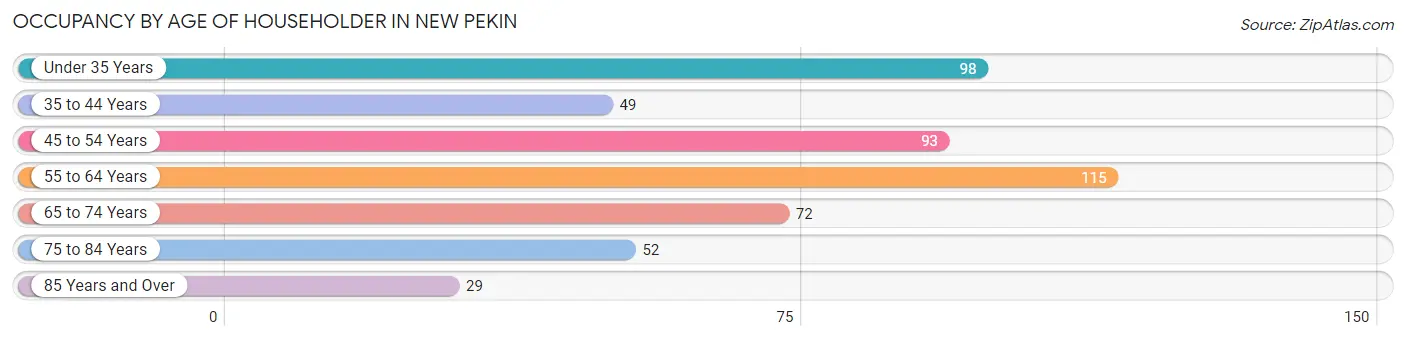
| Age Bracket | # Households | % Households |
| Under 35 Years | 98 | 19.3% |
| 35 to 44 Years | 49 | 9.7% |
| 45 to 54 Years | 93 | 18.3% |
| 55 to 64 Years | 115 | 22.6% |
| 65 to 74 Years | 72 | 14.2% |
| 75 to 84 Years | 52 | 10.2% |
| 85 Years and Over | 29 | 5.7% |
| Total | 508 | 100.0% |
Housing Finances in New Pekin
Median Income by Occupancy in New Pekin
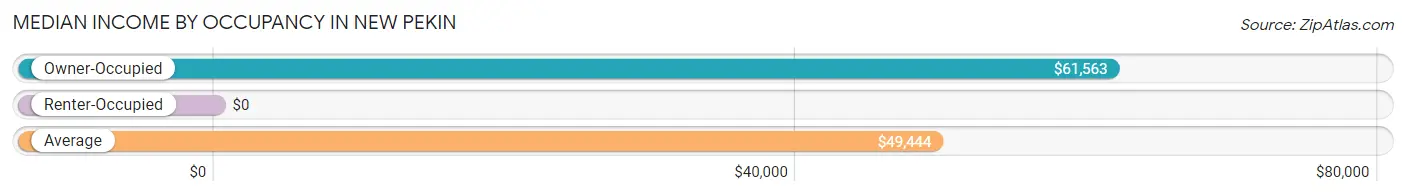
| Occupancy Type | # Households | Median Income |
| Owner-Occupied | 300 (59.1%) | $61,563 |
| Renter-Occupied | 208 (40.9%) | $0 |
| Average | 508 (100.0%) | $49,444 |
Occupancy by Householder Income Bracket in New Pekin
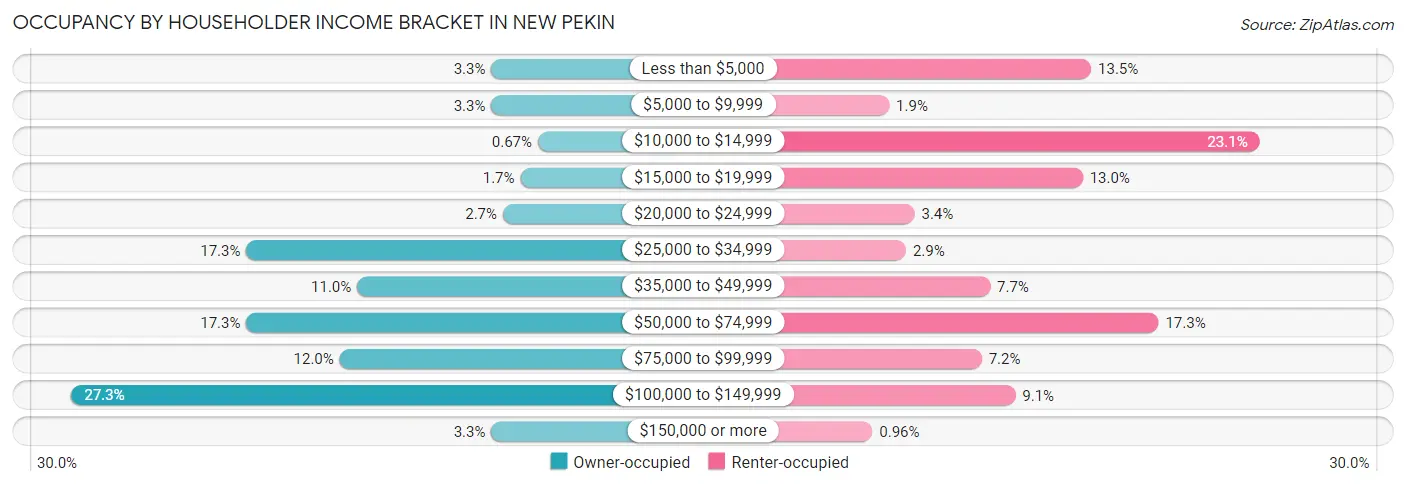
| Income Bracket | Owner-occupied | Renter-occupied |
| Less than $5,000 | 10 (3.3%) | 28 (13.5%) |
| $5,000 to $9,999 | 10 (3.3%) | 4 (1.9%) |
| $10,000 to $14,999 | 2 (0.7%) | 48 (23.1%) |
| $15,000 to $19,999 | 5 (1.7%) | 27 (13.0%) |
| $20,000 to $24,999 | 8 (2.7%) | 7 (3.4%) |
| $25,000 to $34,999 | 52 (17.3%) | 6 (2.9%) |
| $35,000 to $49,999 | 33 (11.0%) | 16 (7.7%) |
| $50,000 to $74,999 | 52 (17.3%) | 36 (17.3%) |
| $75,000 to $99,999 | 36 (12.0%) | 15 (7.2%) |
| $100,000 to $149,999 | 82 (27.3%) | 19 (9.1%) |
| $150,000 or more | 10 (3.3%) | 2 (1.0%) |
| Total | 300 (100.0%) | 208 (100.0%) |
Monthly Housing Cost Tiers in New Pekin
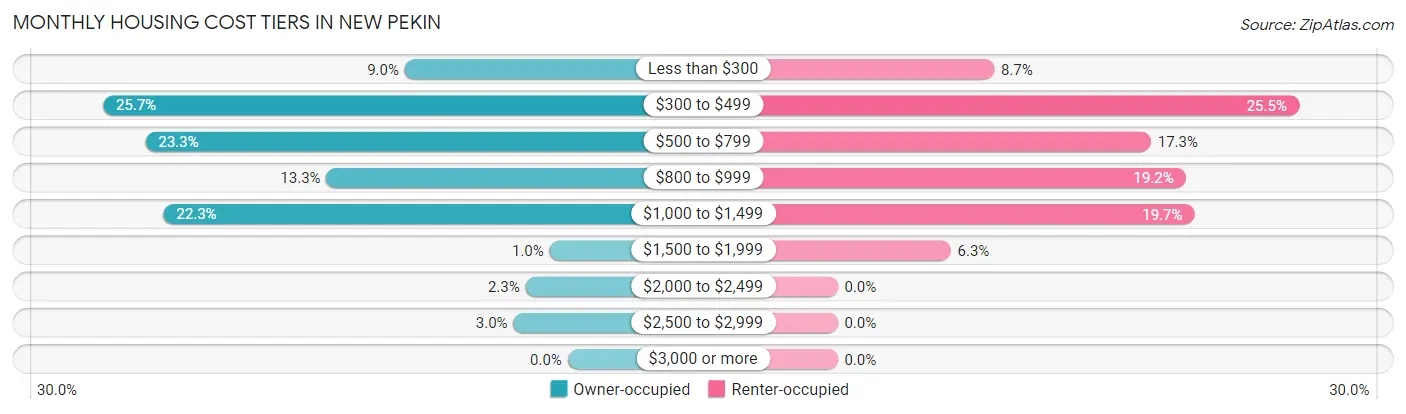
| Monthly Cost | Owner-occupied | Renter-occupied |
| Less than $300 | 27 (9.0%) | 18 (8.6%) |
| $300 to $499 | 77 (25.7%) | 53 (25.5%) |
| $500 to $799 | 70 (23.3%) | 36 (17.3%) |
| $800 to $999 | 40 (13.3%) | 40 (19.2%) |
| $1,000 to $1,499 | 67 (22.3%) | 41 (19.7%) |
| $1,500 to $1,999 | 3 (1.0%) | 13 (6.2%) |
| $2,000 to $2,499 | 7 (2.3%) | 0 (0.0%) |
| $2,500 to $2,999 | 9 (3.0%) | 0 (0.0%) |
| $3,000 or more | 0 (0.0%) | 0 (0.0%) |
| Total | 300 (100.0%) | 208 (100.0%) |
Physical Housing Characteristics in New Pekin
Housing Structures in New Pekin
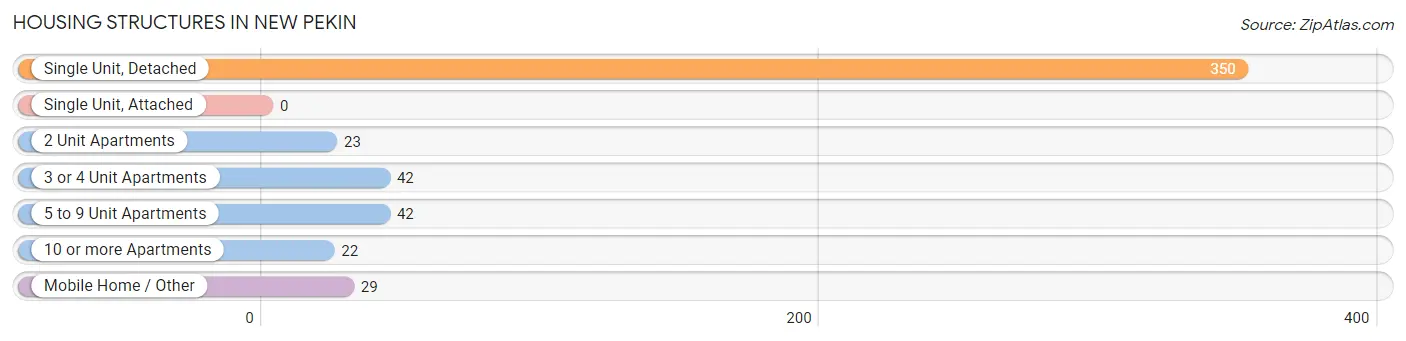
| Structure Type | # Housing Units | % Housing Units |
| Single Unit, Detached | 350 | 68.9% |
| Single Unit, Attached | 0 | 0.0% |
| 2 Unit Apartments | 23 | 4.5% |
| 3 or 4 Unit Apartments | 42 | 8.3% |
| 5 to 9 Unit Apartments | 42 | 8.3% |
| 10 or more Apartments | 22 | 4.3% |
| Mobile Home / Other | 29 | 5.7% |
| Total | 508 | 100.0% |
Housing Structures by Occupancy in New Pekin
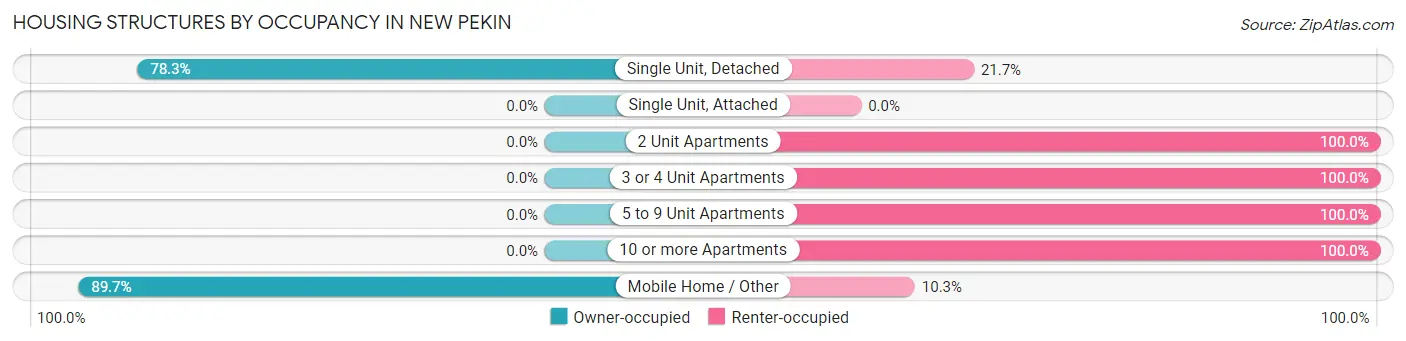
| Structure Type | Owner-occupied | Renter-occupied |
| Single Unit, Detached | 274 (78.3%) | 76 (21.7%) |
| Single Unit, Attached | 0 (0.0%) | 0 (0.0%) |
| 2 Unit Apartments | 0 (0.0%) | 23 (100.0%) |
| 3 or 4 Unit Apartments | 0 (0.0%) | 42 (100.0%) |
| 5 to 9 Unit Apartments | 0 (0.0%) | 42 (100.0%) |
| 10 or more Apartments | 0 (0.0%) | 22 (100.0%) |
| Mobile Home / Other | 26 (89.7%) | 3 (10.3%) |
| Total | 300 (59.1%) | 208 (40.9%) |
Housing Structures by Number of Rooms in New Pekin
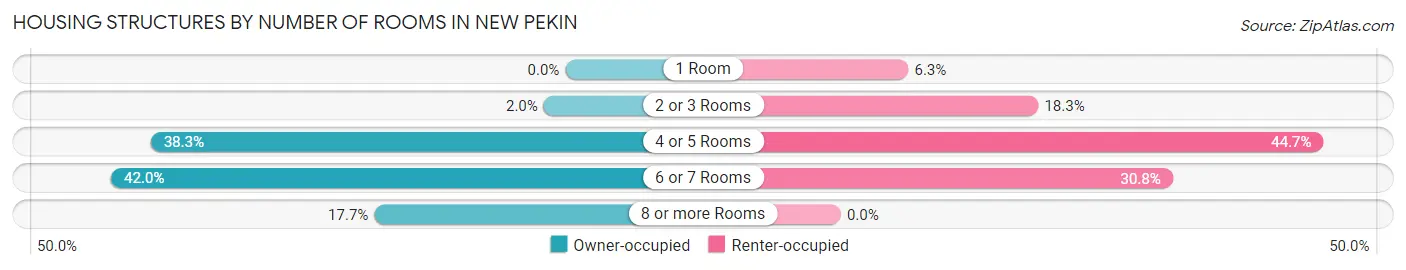
| Number of Rooms | Owner-occupied | Renter-occupied |
| 1 Room | 0 (0.0%) | 13 (6.2%) |
| 2 or 3 Rooms | 6 (2.0%) | 38 (18.3%) |
| 4 or 5 Rooms | 115 (38.3%) | 93 (44.7%) |
| 6 or 7 Rooms | 126 (42.0%) | 64 (30.8%) |
| 8 or more Rooms | 53 (17.7%) | 0 (0.0%) |
| Total | 300 (100.0%) | 208 (100.0%) |
Housing Structure by Heating Type in New Pekin
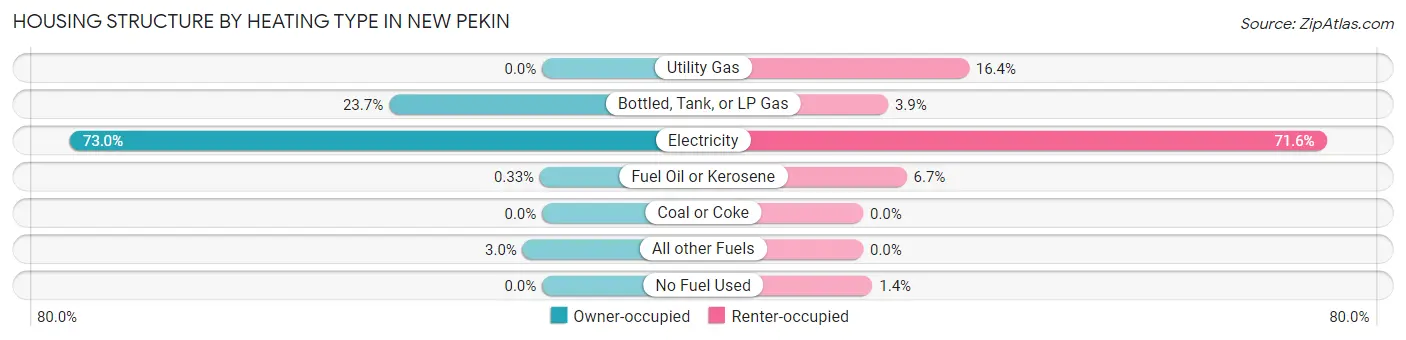
| Heating Type | Owner-occupied | Renter-occupied |
| Utility Gas | 0 (0.0%) | 34 (16.4%) |
| Bottled, Tank, or LP Gas | 71 (23.7%) | 8 (3.8%) |
| Electricity | 219 (73.0%) | 149 (71.6%) |
| Fuel Oil or Kerosene | 1 (0.3%) | 14 (6.7%) |
| Coal or Coke | 0 (0.0%) | 0 (0.0%) |
| All other Fuels | 9 (3.0%) | 0 (0.0%) |
| No Fuel Used | 0 (0.0%) | 3 (1.4%) |
| Total | 300 (100.0%) | 208 (100.0%) |
Household Vehicle Usage in New Pekin
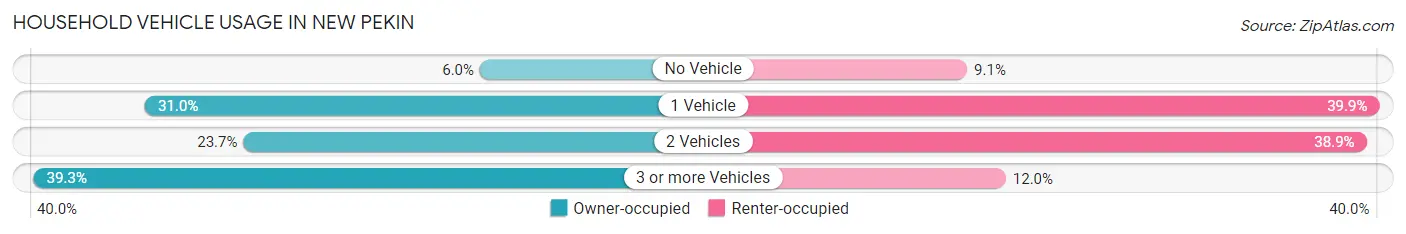
| Vehicles per Household | Owner-occupied | Renter-occupied |
| No Vehicle | 18 (6.0%) | 19 (9.1%) |
| 1 Vehicle | 93 (31.0%) | 83 (39.9%) |
| 2 Vehicles | 71 (23.7%) | 81 (38.9%) |
| 3 or more Vehicles | 118 (39.3%) | 25 (12.0%) |
| Total | 300 (100.0%) | 208 (100.0%) |
Real Estate & Mortgages in New Pekin
Real Estate and Mortgage Overview in New Pekin
| Characteristic | Without Mortgage | With Mortgage |
| Housing Units | 161 | 139 |
| Median Property Value | $102,100 | $135,900 |
| Median Household Income | $34,886 | $7 |
| Monthly Housing Costs | $419 | $0 |
| Real Estate Taxes | $659 | $9 |
Property Value by Mortgage Status in New Pekin
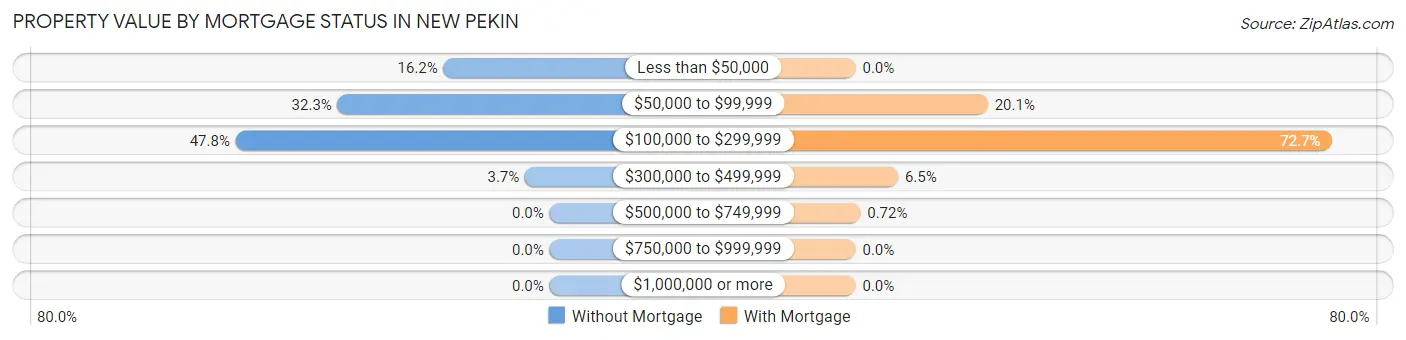
| Property Value | Without Mortgage | With Mortgage |
| Less than $50,000 | 26 (16.2%) | 0 (0.0%) |
| $50,000 to $99,999 | 52 (32.3%) | 28 (20.1%) |
| $100,000 to $299,999 | 77 (47.8%) | 101 (72.7%) |
| $300,000 to $499,999 | 6 (3.7%) | 9 (6.5%) |
| $500,000 to $749,999 | 0 (0.0%) | 1 (0.7%) |
| $750,000 to $999,999 | 0 (0.0%) | 0 (0.0%) |
| $1,000,000 or more | 0 (0.0%) | 0 (0.0%) |
| Total | 161 (100.0%) | 139 (100.0%) |
Household Income by Mortgage Status in New Pekin
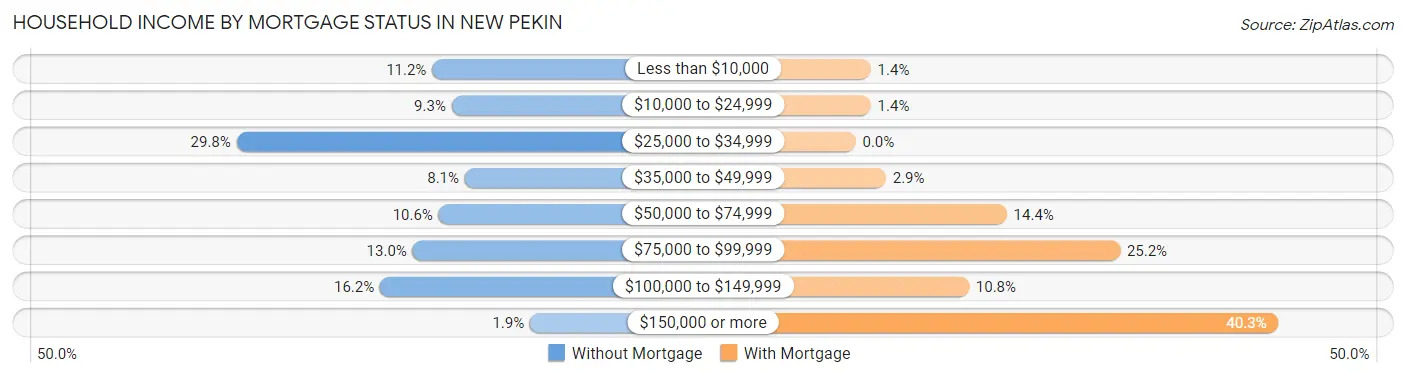
| Household Income | Without Mortgage | With Mortgage |
| Less than $10,000 | 18 (11.2%) | 2 (1.4%) |
| $10,000 to $24,999 | 15 (9.3%) | 2 (1.4%) |
| $25,000 to $34,999 | 48 (29.8%) | 0 (0.0%) |
| $35,000 to $49,999 | 13 (8.1%) | 4 (2.9%) |
| $50,000 to $74,999 | 17 (10.6%) | 20 (14.4%) |
| $75,000 to $99,999 | 21 (13.0%) | 35 (25.2%) |
| $100,000 to $149,999 | 26 (16.2%) | 15 (10.8%) |
| $150,000 or more | 3 (1.9%) | 56 (40.3%) |
| Total | 161 (100.0%) | 139 (100.0%) |
Property Value to Household Income Ratio in New Pekin
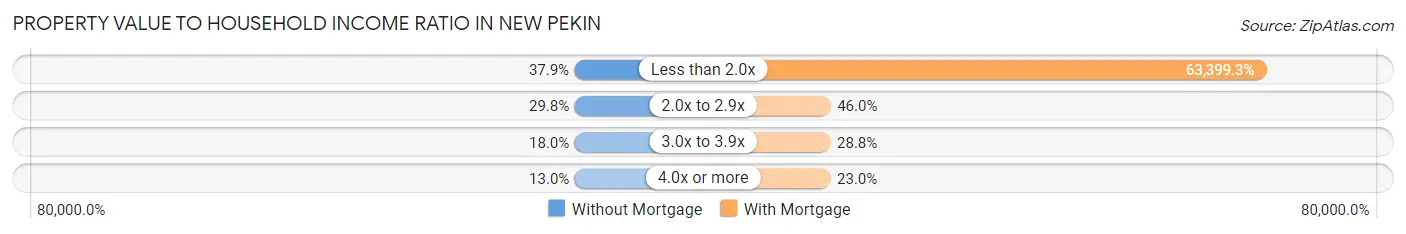
| Value-to-Income Ratio | Without Mortgage | With Mortgage |
| Less than 2.0x | 61 (37.9%) | 88,125 (63,399.3%) |
| 2.0x to 2.9x | 48 (29.8%) | 64 (46.0%) |
| 3.0x to 3.9x | 29 (18.0%) | 40 (28.8%) |
| 4.0x or more | 21 (13.0%) | 32 (23.0%) |
| Total | 161 (100.0%) | 139 (100.0%) |
Real Estate Taxes by Mortgage Status in New Pekin
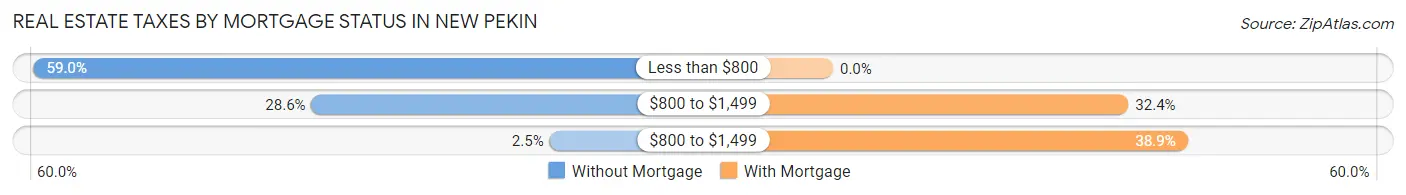
| Property Taxes | Without Mortgage | With Mortgage |
| Less than $800 | 95 (59.0%) | 0 (0.0%) |
| $800 to $1,499 | 46 (28.6%) | 45 (32.4%) |
| $800 to $1,499 | 4 (2.5%) | 54 (38.9%) |
| Total | 161 (100.0%) | 139 (100.0%) |
Health & Disability in New Pekin
Health Insurance Coverage by Age in New Pekin
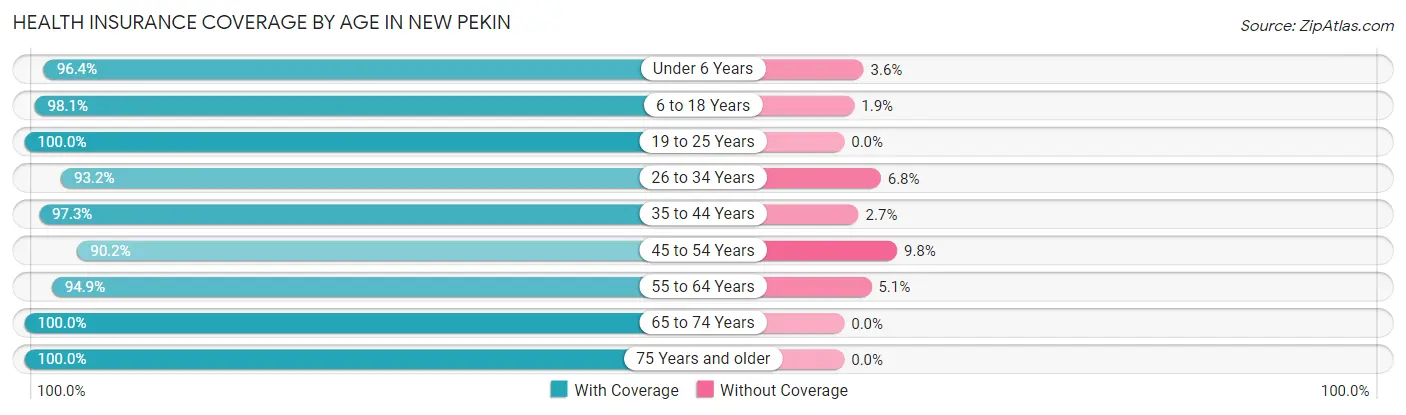
| Age Bracket | With Coverage | Without Coverage |
| Under 6 Years | 107 (96.4%) | 4 (3.6%) |
| 6 to 18 Years | 157 (98.1%) | 3 (1.9%) |
| 19 to 25 Years | 109 (100.0%) | 0 (0.0%) |
| 26 to 34 Years | 178 (93.2%) | 13 (6.8%) |
| 35 to 44 Years | 109 (97.3%) | 3 (2.7%) |
| 45 to 54 Years | 110 (90.2%) | 12 (9.8%) |
| 55 to 64 Years | 206 (94.9%) | 11 (5.1%) |
| 65 to 74 Years | 100 (100.0%) | 0 (0.0%) |
| 75 Years and older | 102 (100.0%) | 0 (0.0%) |
| Total | 1,178 (96.2%) | 46 (3.8%) |
Health Insurance Coverage by Citizenship Status in New Pekin
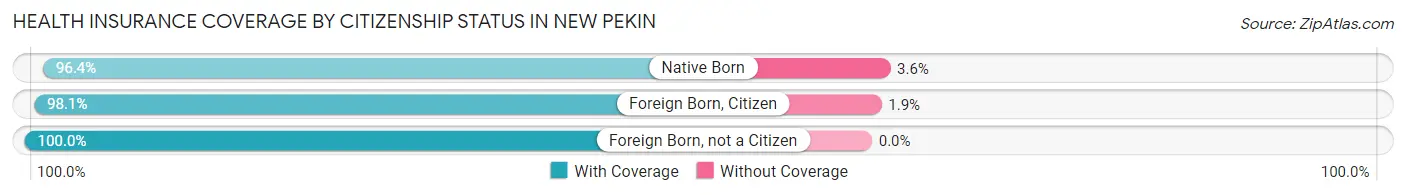
| Citizenship Status | With Coverage | Without Coverage |
| Native Born | 107 (96.4%) | 4 (3.6%) |
| Foreign Born, Citizen | 157 (98.1%) | 3 (1.9%) |
| Foreign Born, not a Citizen | 109 (100.0%) | 0 (0.0%) |
Health Insurance Coverage by Household Income in New Pekin
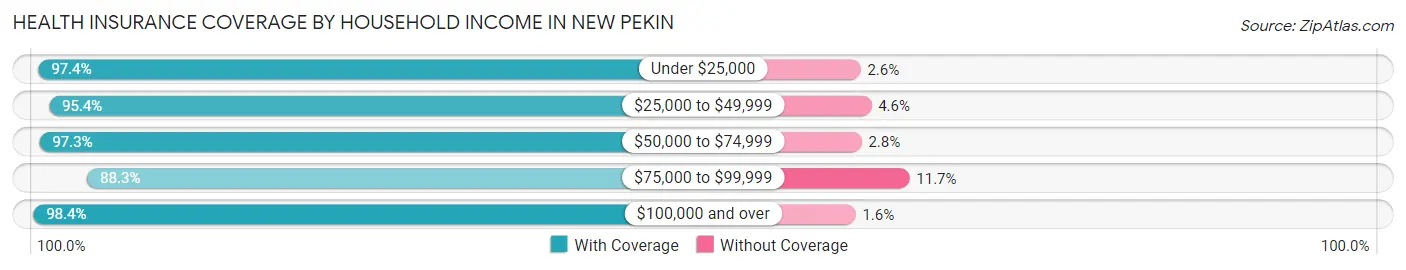
| Household Income | With Coverage | Without Coverage |
| Under $25,000 | 228 (97.4%) | 6 (2.6%) |
| $25,000 to $49,999 | 209 (95.4%) | 10 (4.6%) |
| $50,000 to $74,999 | 248 (97.3%) | 7 (2.8%) |
| $75,000 to $99,999 | 128 (88.3%) | 17 (11.7%) |
| $100,000 and over | 365 (98.4%) | 6 (1.6%) |
Public vs Private Health Insurance Coverage by Age in New Pekin
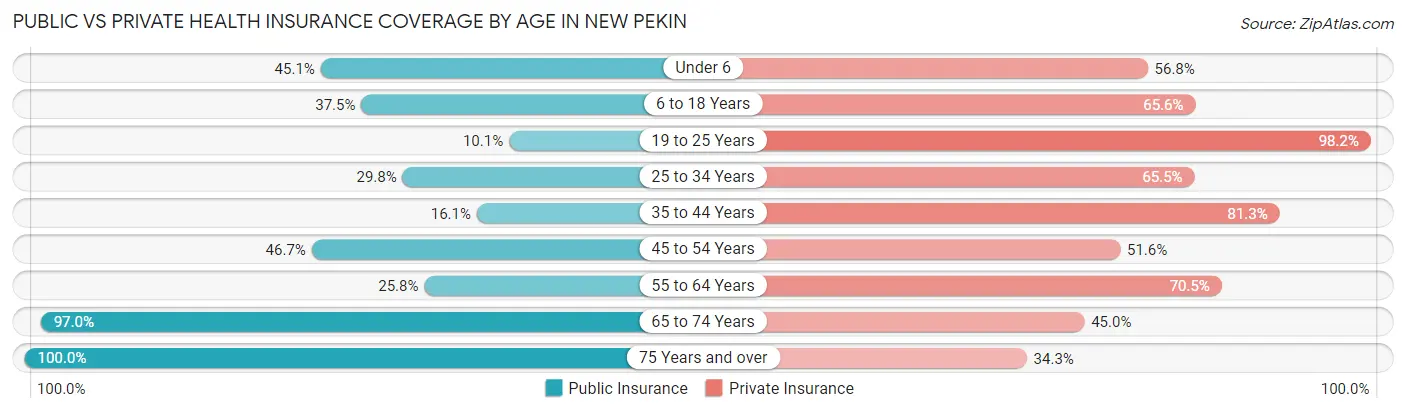
| Age Bracket | Public Insurance | Private Insurance |
| Under 6 | 50 (45.1%) | 63 (56.8%) |
| 6 to 18 Years | 60 (37.5%) | 105 (65.6%) |
| 19 to 25 Years | 11 (10.1%) | 107 (98.2%) |
| 25 to 34 Years | 57 (29.8%) | 125 (65.4%) |
| 35 to 44 Years | 18 (16.1%) | 91 (81.2%) |
| 45 to 54 Years | 57 (46.7%) | 63 (51.6%) |
| 55 to 64 Years | 56 (25.8%) | 153 (70.5%) |
| 65 to 74 Years | 97 (97.0%) | 45 (45.0%) |
| 75 Years and over | 102 (100.0%) | 35 (34.3%) |
| Total | 508 (41.5%) | 787 (64.3%) |
Disability Status by Sex by Age in New Pekin
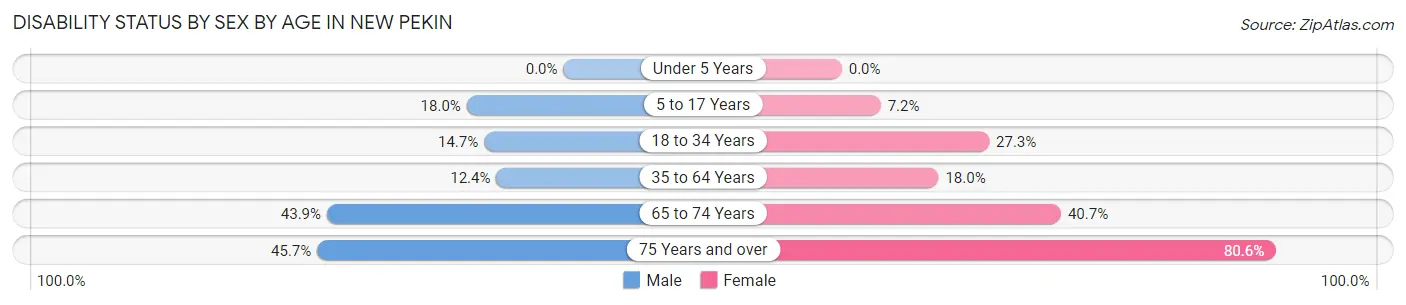
| Age Bracket | Male | Female |
| Under 5 Years | 0 (0.0%) | 0 (0.0%) |
| 5 to 17 Years | 14 (17.9%) | 7 (7.2%) |
| 18 to 34 Years | 24 (14.7%) | 38 (27.3%) |
| 35 to 64 Years | 27 (12.4%) | 42 (17.9%) |
| 65 to 74 Years | 18 (43.9%) | 24 (40.7%) |
| 75 Years and over | 16 (45.7%) | 54 (80.6%) |
Disability Class by Sex by Age in New Pekin
Disability Class: Hearing Difficulty
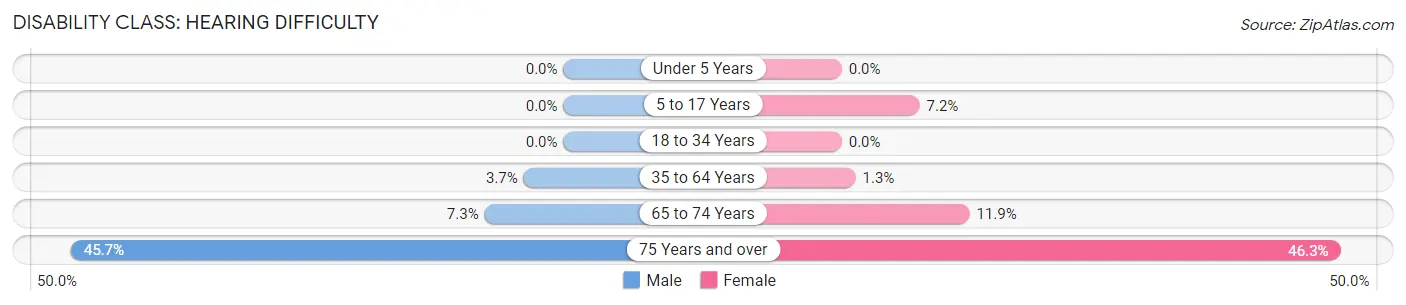
| Age Bracket | Male | Female |
| Under 5 Years | 0 (0.0%) | 0 (0.0%) |
| 5 to 17 Years | 0 (0.0%) | 7 (7.2%) |
| 18 to 34 Years | 0 (0.0%) | 0 (0.0%) |
| 35 to 64 Years | 8 (3.7%) | 3 (1.3%) |
| 65 to 74 Years | 3 (7.3%) | 7 (11.9%) |
| 75 Years and over | 16 (45.7%) | 31 (46.3%) |
Disability Class: Vision Difficulty
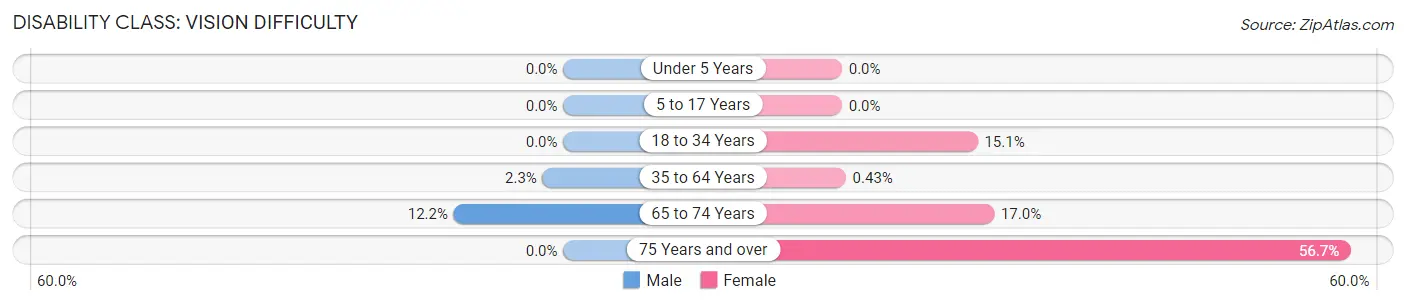
| Age Bracket | Male | Female |
| Under 5 Years | 0 (0.0%) | 0 (0.0%) |
| 5 to 17 Years | 0 (0.0%) | 0 (0.0%) |
| 18 to 34 Years | 0 (0.0%) | 21 (15.1%) |
| 35 to 64 Years | 5 (2.3%) | 1 (0.4%) |
| 65 to 74 Years | 5 (12.2%) | 10 (17.0%) |
| 75 Years and over | 0 (0.0%) | 38 (56.7%) |
Disability Class: Cognitive Difficulty
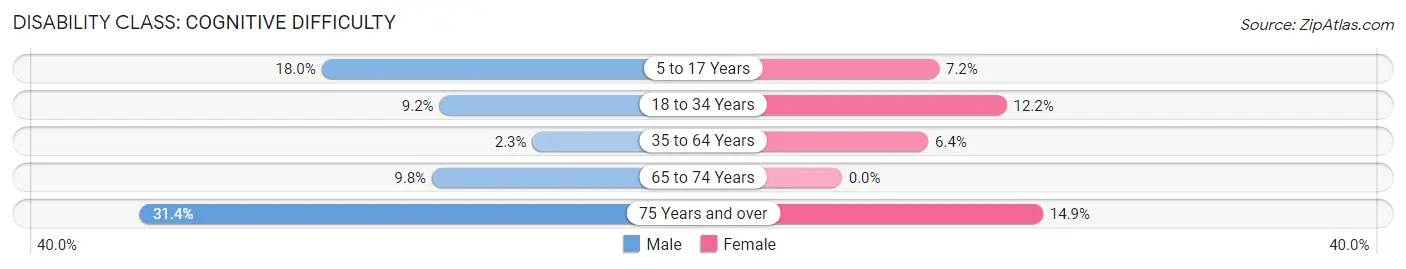
| Age Bracket | Male | Female |
| 5 to 17 Years | 14 (17.9%) | 7 (7.2%) |
| 18 to 34 Years | 15 (9.2%) | 17 (12.2%) |
| 35 to 64 Years | 5 (2.3%) | 15 (6.4%) |
| 65 to 74 Years | 4 (9.8%) | 0 (0.0%) |
| 75 Years and over | 11 (31.4%) | 10 (14.9%) |
Disability Class: Ambulatory Difficulty
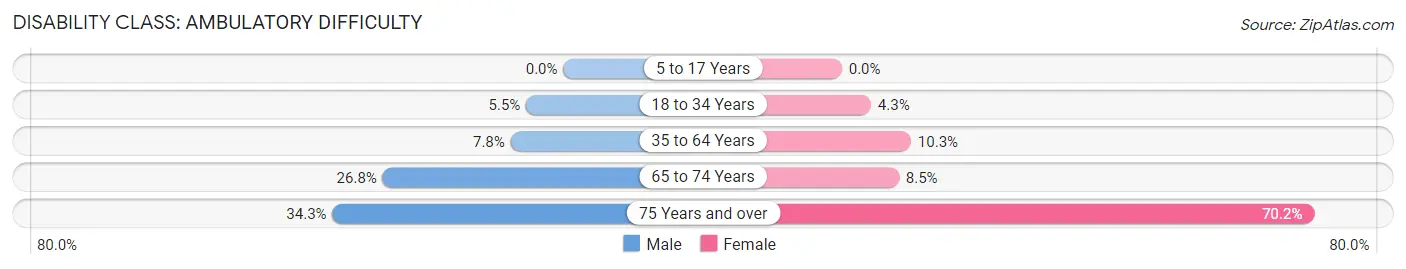
| Age Bracket | Male | Female |
| 5 to 17 Years | 0 (0.0%) | 0 (0.0%) |
| 18 to 34 Years | 9 (5.5%) | 6 (4.3%) |
| 35 to 64 Years | 17 (7.8%) | 24 (10.3%) |
| 65 to 74 Years | 11 (26.8%) | 5 (8.5%) |
| 75 Years and over | 12 (34.3%) | 47 (70.2%) |
Disability Class: Self-Care Difficulty
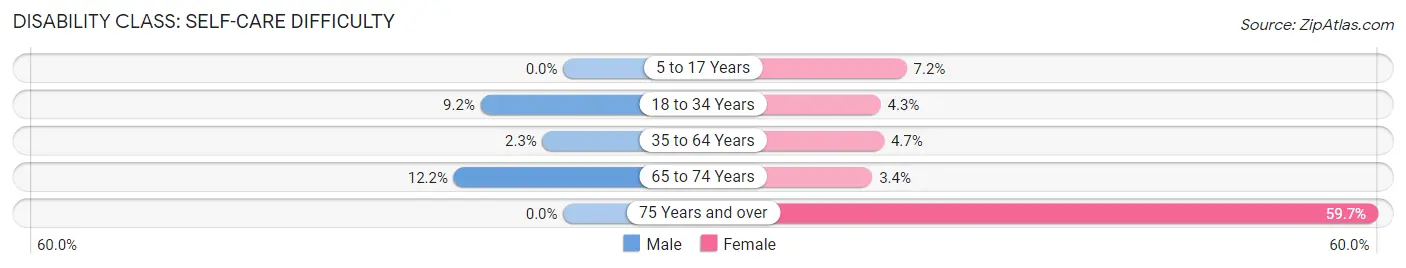
| Age Bracket | Male | Female |
| 5 to 17 Years | 0 (0.0%) | 7 (7.2%) |
| 18 to 34 Years | 15 (9.2%) | 6 (4.3%) |
| 35 to 64 Years | 5 (2.3%) | 11 (4.7%) |
| 65 to 74 Years | 5 (12.2%) | 2 (3.4%) |
| 75 Years and over | 0 (0.0%) | 40 (59.7%) |
Technology Access in New Pekin
Computing Device Access in New Pekin
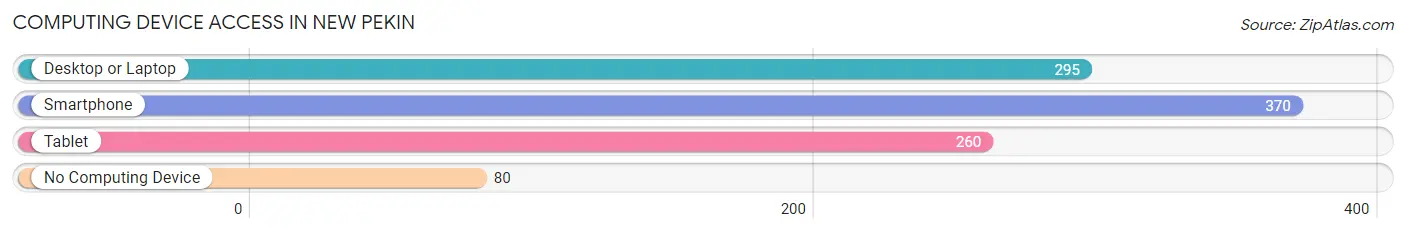
| Device Type | # Households | % Households |
| Desktop or Laptop | 295 | 58.1% |
| Smartphone | 370 | 72.8% |
| Tablet | 260 | 51.2% |
| No Computing Device | 80 | 15.8% |
| Total | 508 | 100.0% |
Internet Access in New Pekin
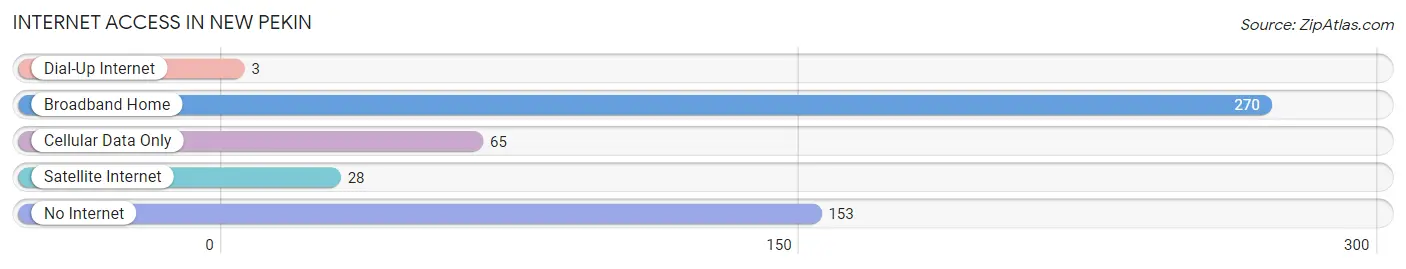
| Internet Type | # Households | % Households |
| Dial-Up Internet | 3 | 0.6% |
| Broadband Home | 270 | 53.1% |
| Cellular Data Only | 65 | 12.8% |
| Satellite Internet | 28 | 5.5% |
| No Internet | 153 | 30.1% |
| Total | 508 | 100.0% |
New Pekin Summary
Pekin, Indiana is a small town located in Washington County, Indiana. It is situated on the banks of the Blue River, approximately 20 miles north of Louisville, Kentucky. The town was founded in 1818 by a group of settlers from North Carolina, and was named after the city of Peking in China. The town has a population of approximately 1,500 people, and is the county seat of Washington County.
History
Pekin was founded in 1818 by a group of settlers from North Carolina. The town was named after the city of Peking in China, and was originally known as Peking. The town was incorporated in 1837, and the name was changed to Pekin in 1845.
The town was an important stop on the Underground Railroad, and was home to several prominent abolitionists. In 1864, the town was the site of a skirmish between Union and Confederate forces during the Civil War.
The town was also home to several prominent businesses, including a flour mill, a sawmill, a grist mill, and a distillery. The town was also home to several churches, including the First Baptist Church, the Methodist Episcopal Church, and the Presbyterian Church.
Geography
Pekin is located in Washington County, Indiana, approximately 20 miles north of Louisville, Kentucky. The town is situated on the banks of the Blue River, and is surrounded by rolling hills and farmland. The town is located in the Central Till Plains region of Indiana, and is part of the Wabash Valley.
The climate in Pekin is humid continental, with hot summers and cold winters. The average annual temperature is around 50 degrees Fahrenheit, and the average annual precipitation is around 40 inches.
Economy
The economy of Pekin is largely based on agriculture and manufacturing. The town is home to several small businesses, including a flour mill, a sawmill, a grist mill, and a distillery. The town is also home to several churches, and is a popular tourist destination.
The town is also home to several large employers, including the Pekin Community School Corporation, the Pekin Hospital, and the Pekin Public Library. The town is also home to several small businesses, including restaurants, retail stores, and service providers.
Demographics
As of the 2010 census, the population of Pekin was 1,500. The racial makeup of the town was 97.3% White, 0.7% African American, 0.3% Native American, 0.3% Asian, and 1.3% from other races. The median household income was $37,500, and the median family income was $45,000.
The town is home to several churches, including the First Baptist Church, the Methodist Episcopal Church, and the Presbyterian Church. The town is also home to several schools, including the Pekin Community School Corporation, the Pekin Hospital, and the Pekin Public Library.
Conclusion
Pekin, Indiana is a small town located in Washington County, Indiana. It is situated on the banks of the Blue River, approximately 20 miles north of Louisville, Kentucky. The town was founded in 1818 by a group of settlers from North Carolina, and was named after the city of Peking in China. The town has a population of approximately 1,500 people, and is the county seat of Washington County. The economy of Pekin is largely based on agriculture and manufacturing, and the town is home to several small businesses, churches, and schools. The racial makeup of the town is 97.3% White, 0.7% African American, 0.3% Native American, 0.3% Asian, and 1.3% from other races. The median household income was $37,500, and the median family income was $45,000. Pekin is a popular tourist destination, and is home to several large employers, including the Pekin Community School Corporation, the Pekin Hospital, and the Pekin Public Library.
Common Questions
What is Per Capita Income in New Pekin?
Per Capita income in New Pekin is $25,262.
What is the Median Family Income in New Pekin?
Median Family Income in New Pekin is $61,719.
What is the Median Household income in New Pekin?
Median Household Income in New Pekin is $49,444.
What is Income or Wage Gap in New Pekin?
Income or Wage Gap in New Pekin is 15.3%.
Women in New Pekin earn 84.7 cents for every dollar earned by a man.
What is Inequality or Gini Index in New Pekin?
Inequality or Gini Index in New Pekin is 0.44.
What is the Total Population of New Pekin?
Total Population of New Pekin is 1,224.
What is the Total Male Population of New Pekin?
Total Male Population of New Pekin is 569.
What is the Total Female Population of New Pekin?
Total Female Population of New Pekin is 655.
What is the Ratio of Males per 100 Females in New Pekin?
There are 86.87 Males per 100 Females in New Pekin.
What is the Ratio of Females per 100 Males in New Pekin?
There are 115.11 Females per 100 Males in New Pekin.
What is the Median Population Age in New Pekin?
Median Population Age in New Pekin is 40.5 Years.
What is the Average Family Size in New Pekin
Average Family Size in New Pekin is 3.0 People.
What is the Average Household Size in New Pekin
Average Household Size in New Pekin is 2.4 People.
How Large is the Labor Force in New Pekin?
There are 557 People in the Labor Forcein in New Pekin.
What is the Percentage of People in the Labor Force in New Pekin?
56.7% of People are in the Labor Force in New Pekin.
What is the Unemployment Rate in New Pekin?
Unemployment Rate in New Pekin is 4.5%.