West Haven, CT Map & Demographics
West Haven Map
West Haven Overview
$34,740
PER CAPITA INCOME
$91,047
AVG FAMILY INCOME
$72,827
AVG HOUSEHOLD INCOME
27.2%
WAGE / INCOME GAP [ % ]
72.8¢/ $1
WAGE / INCOME GAP [ $ ]
$8,700
FAMILY INCOME DEFICIT
0.44
INEQUALITY / GINI INDEX
55,336
TOTAL POPULATION
27,144
MALE POPULATION
28,192
FEMALE POPULATION
96.28
MALES / 100 FEMALES
103.86
FEMALES / 100 MALES
36.1
MEDIAN AGE
3.1
AVG FAMILY SIZE
2.5
AVG HOUSEHOLD SIZE
29,537
LABOR FORCE [ PEOPLE ]
65.1%
PERCENT IN LABOR FORCE
7.9%
UNEMPLOYMENT RATE
West Haven Zip Codes
West Haven Area Codes
Income in West Haven
Income Overview in West Haven
Per Capita Income in West Haven is $34,740, while median incomes of families and households are $91,047 and $72,827 respectively.
| Characteristic | Number | Measure |
| Per Capita Income | 55,336 | $34,740 |
| Median Family Income | 12,956 | $91,047 |
| Mean Family Income | 12,956 | $109,722 |
| Median Household Income | 20,405 | $72,827 |
| Mean Household Income | 20,405 | $92,458 |
| Income Deficit | 12,956 | $8,700 |
| Wage / Income Gap (%) | 55,336 | 27.20% |
| Wage / Income Gap ($) | 55,336 | 72.80¢ per $1 |
| Gini / Inequality Index | 55,336 | 0.44 |
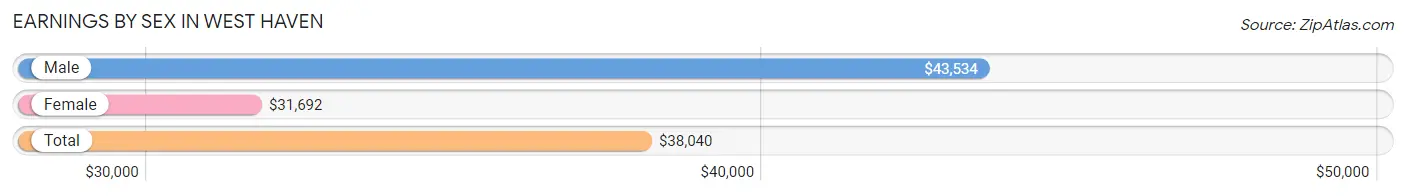
Earnings by Sex in West Haven
Average Earnings in West Haven are $38,040, $43,534 for men and $31,692 for women, a difference of 27.2%.
| Sex | Number | Average Earnings |
| Male | 16,720 (52.4%) | $43,534 |
| Female | 15,172 (47.6%) | $31,692 |
| Total | 31,892 (100.0%) | $38,040 |
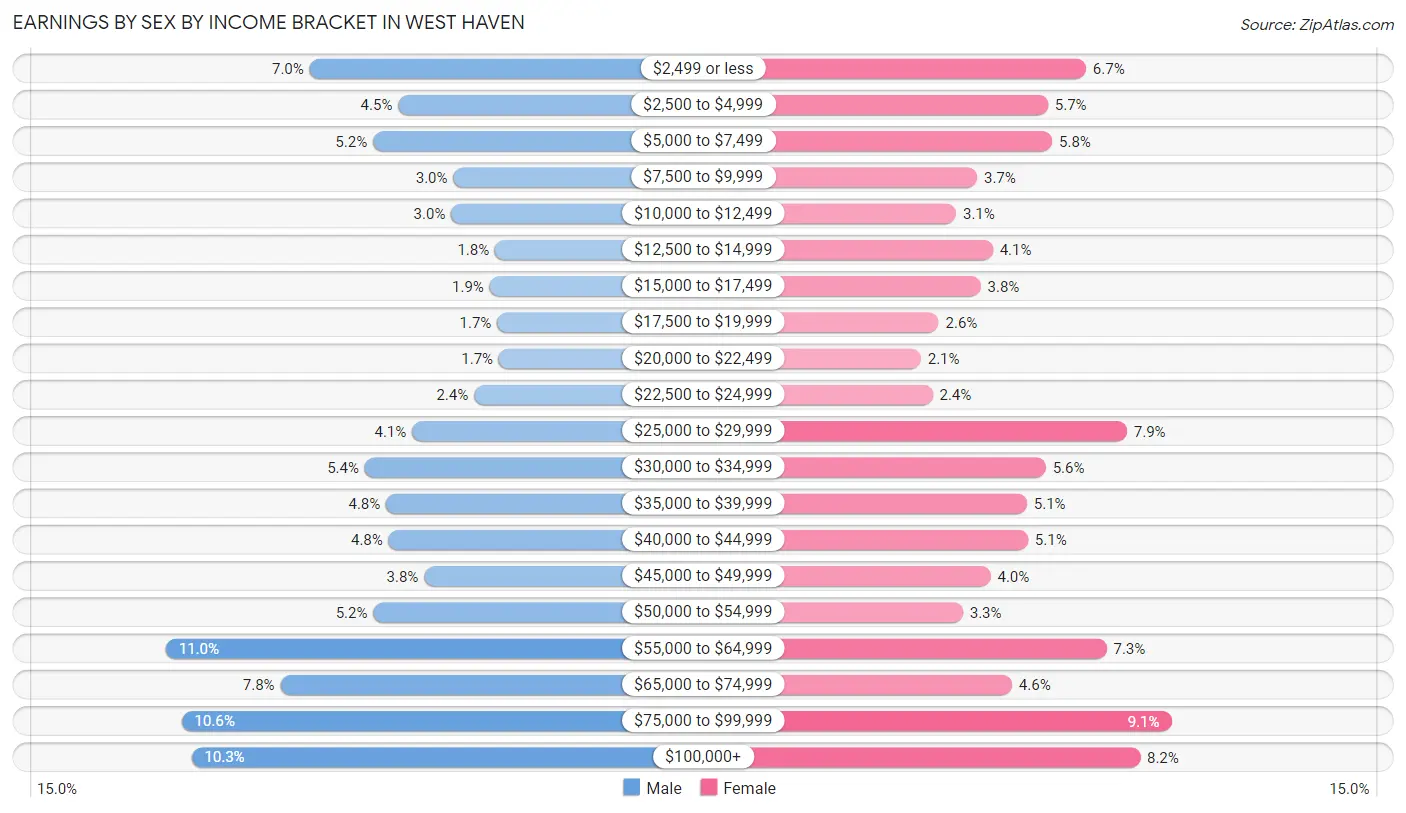
Earnings by Sex by Income Bracket in West Haven
The most common earnings brackets in West Haven are $55,000 to $64,999 for men (1,844 | 11.0%) and $75,000 to $99,999 for women (1,383 | 9.1%).
| Income | Male | Female |
| $2,499 or less | 1,169 (7.0%) | 1,019 (6.7%) |
| $2,500 to $4,999 | 752 (4.5%) | 857 (5.7%) |
| $5,000 to $7,499 | 871 (5.2%) | 876 (5.8%) |
| $7,500 to $9,999 | 494 (2.9%) | 556 (3.7%) |
| $10,000 to $12,499 | 504 (3.0%) | 466 (3.1%) |
| $12,500 to $14,999 | 297 (1.8%) | 622 (4.1%) |
| $15,000 to $17,499 | 322 (1.9%) | 571 (3.8%) |
| $17,500 to $19,999 | 287 (1.7%) | 391 (2.6%) |
| $20,000 to $22,499 | 280 (1.7%) | 315 (2.1%) |
| $22,500 to $24,999 | 397 (2.4%) | 365 (2.4%) |
| $25,000 to $29,999 | 688 (4.1%) | 1,194 (7.9%) |
| $30,000 to $34,999 | 909 (5.4%) | 848 (5.6%) |
| $35,000 to $39,999 | 810 (4.8%) | 768 (5.1%) |
| $40,000 to $44,999 | 797 (4.8%) | 773 (5.1%) |
| $45,000 to $49,999 | 630 (3.8%) | 613 (4.0%) |
| $50,000 to $54,999 | 869 (5.2%) | 494 (3.3%) |
| $55,000 to $64,999 | 1,844 (11.0%) | 1,107 (7.3%) |
| $65,000 to $74,999 | 1,305 (7.8%) | 704 (4.6%) |
| $75,000 to $99,999 | 1,771 (10.6%) | 1,383 (9.1%) |
| $100,000+ | 1,724 (10.3%) | 1,250 (8.2%) |
| Total | 16,720 (100.0%) | 15,172 (100.0%) |
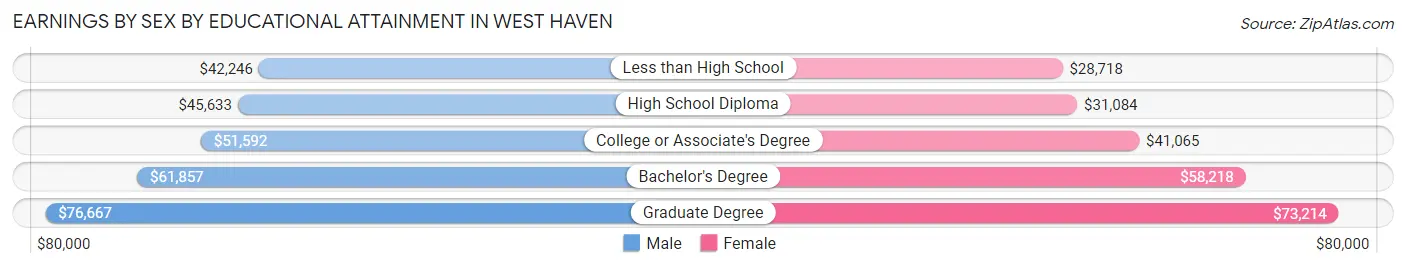
Earnings by Sex by Educational Attainment in West Haven
Average earnings in West Haven are $53,760 for men and $41,682 for women, a difference of 22.5%. Men with an educational attainment of graduate degree enjoy the highest average annual earnings of $76,667, while those with less than high school education earn the least with $42,246. Women with an educational attainment of graduate degree earn the most with the average annual earnings of $73,214, while those with less than high school education have the smallest earnings of $28,718.
| Educational Attainment | Male Income | Female Income |
| Less than High School | $42,246 | $28,718 |
| High School Diploma | $45,633 | $31,084 |
| College or Associate's Degree | $51,592 | $41,065 |
| Bachelor's Degree | $61,857 | $58,218 |
| Graduate Degree | $76,667 | $73,214 |
| Total | $53,760 | $41,682 |
Family Income in West Haven
Family Income Brackets in West Haven
According to the West Haven family income data, there are 2,734 families falling into the $100,000 to $149,999 income range, which is the most common income bracket and makes up 21.1% of all families. Conversely, the less than $10,000 income bracket is the least frequent group with only 181 families (1.4%) belonging to this category.
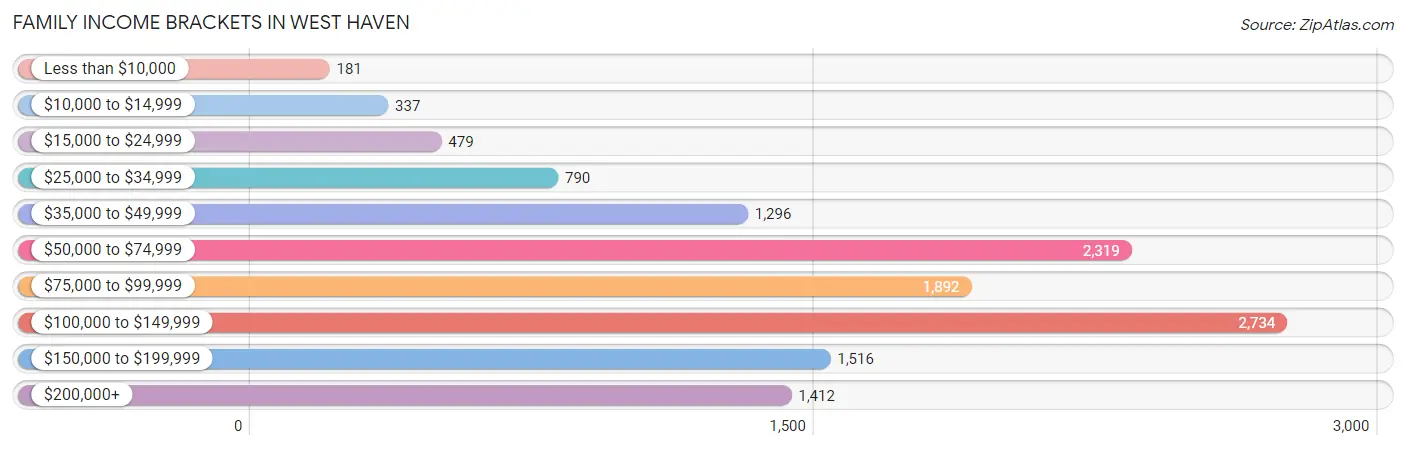
| Income Bracket | # Families | % Families |
| Less than $10,000 | 181 | 1.4% |
| $10,000 to $14,999 | 337 | 2.6% |
| $15,000 to $24,999 | 479 | 3.7% |
| $25,000 to $34,999 | 790 | 6.1% |
| $35,000 to $49,999 | 1,296 | 10.0% |
| $50,000 to $74,999 | 2,319 | 17.9% |
| $75,000 to $99,999 | 1,892 | 14.6% |
| $100,000 to $149,999 | 2,734 | 21.1% |
| $150,000 to $199,999 | 1,516 | 11.7% |
| $200,000+ | 1,412 | 10.9% |
Family Income by Famaliy Size in West Haven
7+ person families (189 | 1.5%) account for the highest median family income in West Haven with $139,327 per family, while 2-person families (5,387 | 41.6%) have the highest median income of $45,998 per family member.
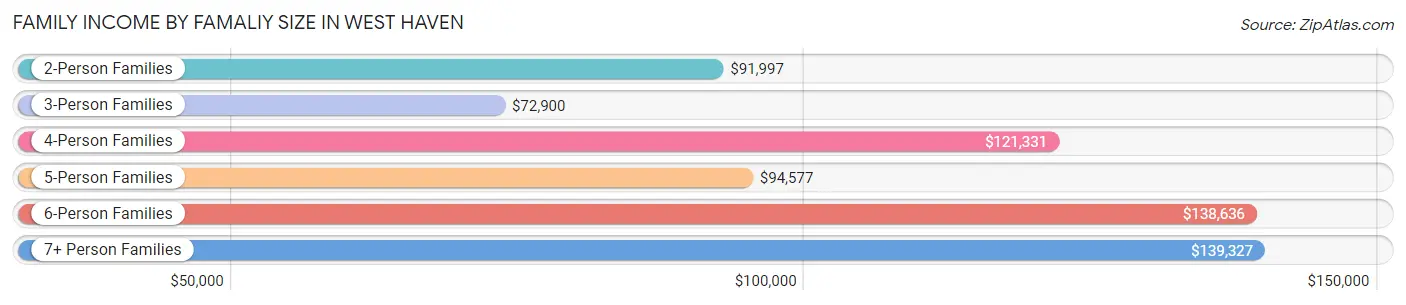
| Income Bracket | # Families | Median Income |
| 2-Person Families | 5,387 (41.6%) | $91,997 |
| 3-Person Families | 3,403 (26.3%) | $72,900 |
| 4-Person Families | 2,348 (18.1%) | $121,331 |
| 5-Person Families | 1,183 (9.1%) | $94,577 |
| 6-Person Families | 446 (3.4%) | $138,636 |
| 7+ Person Families | 189 (1.5%) | $139,327 |
| Total | 12,956 (100.0%) | $91,047 |
Family Income by Number of Earners in West Haven
The median family income in West Haven is $91,047, with families comprising 3+ earners (1,938) having the highest median family income of $145,200, while families with no earners (1,288) have the lowest median family income of $55,625, accounting for 15.0% and 9.9% of families, respectively.
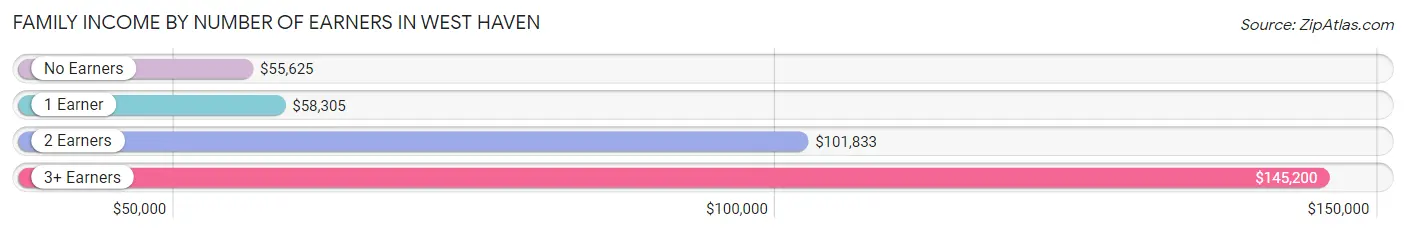
| Number of Earners | # Families | Median Income |
| No Earners | 1,288 (9.9%) | $55,625 |
| 1 Earner | 4,052 (31.3%) | $58,305 |
| 2 Earners | 5,678 (43.8%) | $101,833 |
| 3+ Earners | 1,938 (15.0%) | $145,200 |
| Total | 12,956 (100.0%) | $91,047 |
Household Income in West Haven
Household Income Brackets in West Haven
With 3,652 households falling in the category, the $50,000 to $74,999 income range is the most frequent in West Haven, accounting for 17.9% of all households. In contrast, only 857 households (4.2%) fall into the $10,000 to $14,999 income bracket, making it the least populous group.
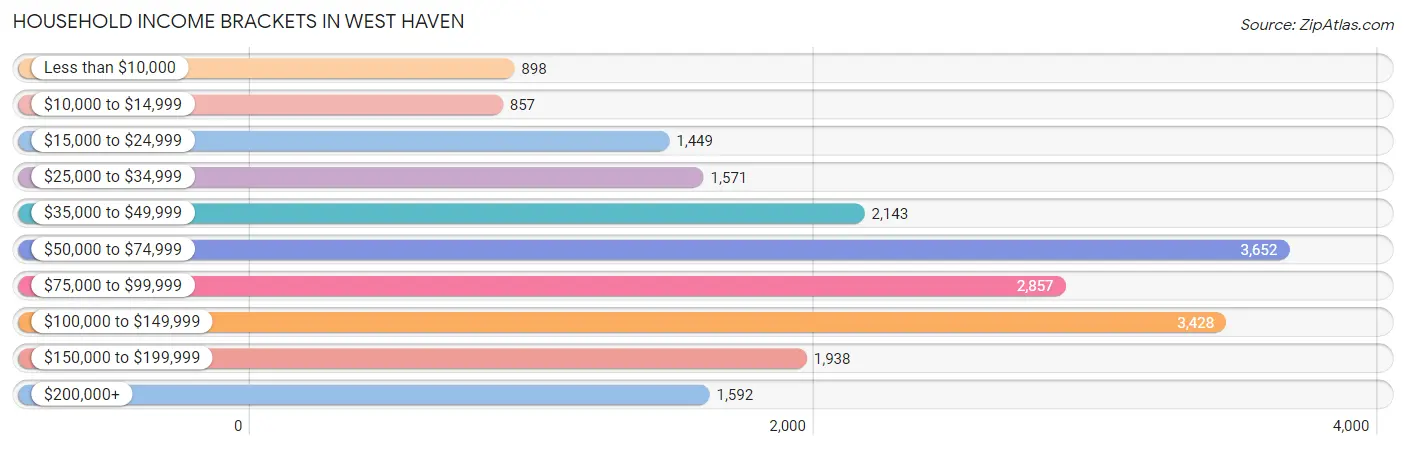
| Income Bracket | # Households | % Households |
| Less than $10,000 | 898 | 4.4% |
| $10,000 to $14,999 | 857 | 4.2% |
| $15,000 to $24,999 | 1,449 | 7.1% |
| $25,000 to $34,999 | 1,571 | 7.7% |
| $35,000 to $49,999 | 2,143 | 10.5% |
| $50,000 to $74,999 | 3,652 | 17.9% |
| $75,000 to $99,999 | 2,857 | 14.0% |
| $100,000 to $149,999 | 3,428 | 16.8% |
| $150,000 to $199,999 | 1,938 | 9.5% |
| $200,000+ | 1,592 | 7.8% |
Household Income by Householder Age in West Haven
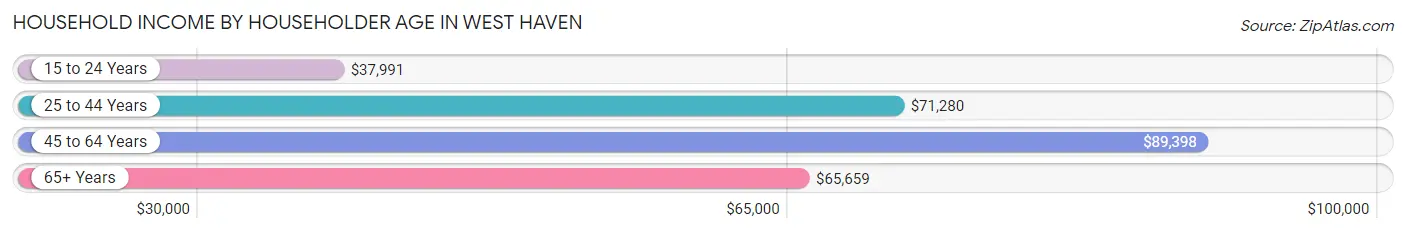
The median household income in West Haven is $72,827, with the highest median household income of $89,398 found in the 45 to 64 years age bracket for the primary householder. A total of 8,508 households (41.7%) fall into this category. Meanwhile, the 15 to 24 years age bracket for the primary householder has the lowest median household income of $37,991, with 607 households (3.0%) in this group.
| Income Bracket | # Households | Median Income |
| 15 to 24 Years | 607 (3.0%) | $37,991 |
| 25 to 44 Years | 6,896 (33.8%) | $71,280 |
| 45 to 64 Years | 8,508 (41.7%) | $89,398 |
| 65+ Years | 4,394 (21.5%) | $65,659 |
| Total | 20,405 (100.0%) | $72,827 |
Poverty in West Haven
Income Below Poverty by Sex and Age in West Haven
With 11.4% poverty level for males and 11.1% for females among the residents of West Haven, 18 to 24 year old males and 18 to 24 year old females are the most vulnerable to poverty, with 680 males (26.0%) and 538 females (22.6%) in their respective age groups living below the poverty level.
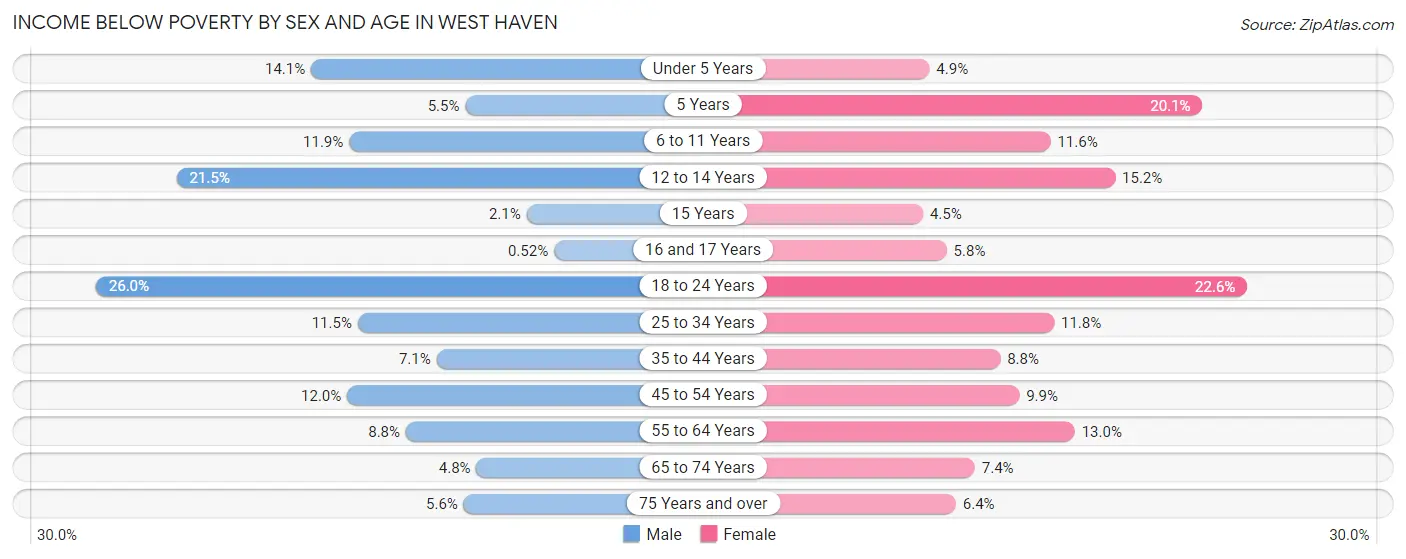
| Age Bracket | Male | Female |
| Under 5 Years | 162 (14.1%) | 73 (4.9%) |
| 5 Years | 20 (5.5%) | 53 (20.1%) |
| 6 to 11 Years | 214 (11.9%) | 238 (11.6%) |
| 12 to 14 Years | 240 (21.5%) | 158 (15.2%) |
| 15 Years | 5 (2.1%) | 17 (4.5%) |
| 16 and 17 Years | 3 (0.5%) | 32 (5.8%) |
| 18 to 24 Years | 680 (26.0%) | 538 (22.6%) |
| 25 to 34 Years | 494 (11.5%) | 382 (11.8%) |
| 35 to 44 Years | 216 (7.1%) | 297 (8.8%) |
| 45 to 54 Years | 401 (12.0%) | 331 (9.9%) |
| 55 to 64 Years | 292 (8.8%) | 480 (13.0%) |
| 65 to 74 Years | 115 (4.8%) | 203 (7.4%) |
| 75 Years and over | 69 (5.6%) | 99 (6.4%) |
| Total | 2,911 (11.4%) | 2,901 (11.1%) |
Income Above Poverty by Sex and Age in West Haven
According to the poverty statistics in West Haven, males aged 16 and 17 years and females aged 15 years are the age groups that are most secure financially, with 99.5% of males and 95.5% of females in these age groups living above the poverty line.
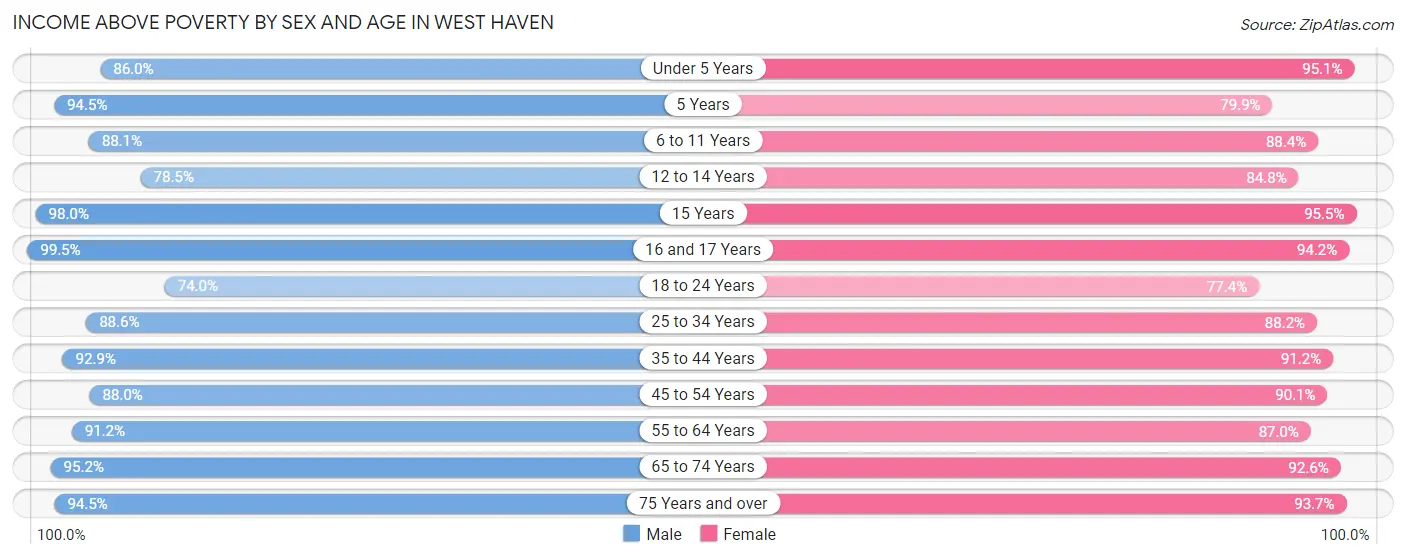
| Age Bracket | Male | Female |
| Under 5 Years | 991 (86.0%) | 1,424 (95.1%) |
| 5 Years | 346 (94.5%) | 211 (79.9%) |
| 6 to 11 Years | 1,580 (88.1%) | 1,811 (88.4%) |
| 12 to 14 Years | 874 (78.5%) | 880 (84.8%) |
| 15 Years | 239 (98.0%) | 359 (95.5%) |
| 16 and 17 Years | 571 (99.5%) | 516 (94.2%) |
| 18 to 24 Years | 1,932 (74.0%) | 1,846 (77.4%) |
| 25 to 34 Years | 3,819 (88.5%) | 2,851 (88.2%) |
| 35 to 44 Years | 2,844 (92.9%) | 3,072 (91.2%) |
| 45 to 54 Years | 2,929 (88.0%) | 3,019 (90.1%) |
| 55 to 64 Years | 3,039 (91.2%) | 3,221 (87.0%) |
| 65 to 74 Years | 2,259 (95.2%) | 2,535 (92.6%) |
| 75 Years and over | 1,174 (94.5%) | 1,460 (93.6%) |
| Total | 22,597 (88.6%) | 23,205 (88.9%) |
Income Below Poverty Among Married-Couple Families in West Haven
The poverty statistics for married-couple families in West Haven show that 5.2% or 452 of the total 8,637 families live below the poverty line. Families with 5 or more children have the highest poverty rate of 100.0%, comprising of 3 families. On the other hand, families with no children have the lowest poverty rate of 2.9%, which includes 139 families.
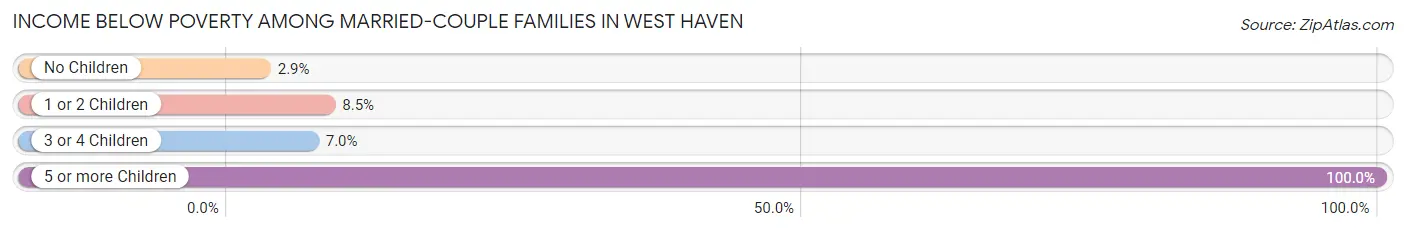
| Children | Above Poverty | Below Poverty |
| No Children | 4,739 (97.2%) | 139 (2.9%) |
| 1 or 2 Children | 2,930 (91.5%) | 271 (8.5%) |
| 3 or 4 Children | 516 (93.0%) | 39 (7.0%) |
| 5 or more Children | 0 (0.0%) | 3 (100.0%) |
| Total | 8,185 (94.8%) | 452 (5.2%) |
Income Below Poverty Among Single-Parent Households in West Haven
According to the poverty data in West Haven, 18.9% or 241 single-father households and 10.7% or 325 single-mother households are living below the poverty line. Among single-father households, those with 1 or 2 children have the highest poverty rate, with 215 households (34.7%) experiencing poverty. Likewise, among single-mother households, those with 5 or more children have the highest poverty rate, with 17 households (100.0%) falling below the poverty line.
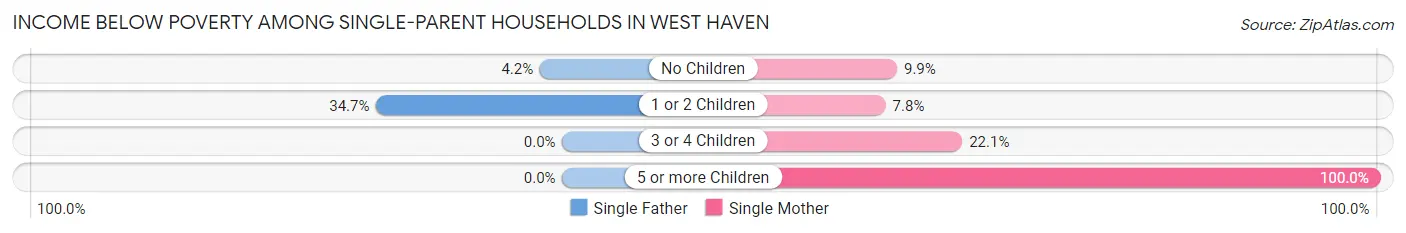
| Children | Single Father | Single Mother |
| No Children | 26 (4.2%) | 129 (9.9%) |
| 1 or 2 Children | 215 (34.7%) | 111 (7.8%) |
| 3 or 4 Children | 0 (0.0%) | 68 (22.1%) |
| 5 or more Children | 0 (0.0%) | 17 (100.0%) |
| Total | 241 (18.9%) | 325 (10.7%) |
Income Below Poverty Among Married-Couple vs Single-Parent Households in West Haven
The poverty data for West Haven shows that 452 of the married-couple family households (5.2%) and 566 of the single-parent households (13.1%) are living below the poverty level. Within the married-couple family households, those with 5 or more children have the highest poverty rate, with 3 households (100.0%) falling below the poverty line. Among the single-parent households, those with 5 or more children have the highest poverty rate, with 17 household (100.0%) living below poverty.
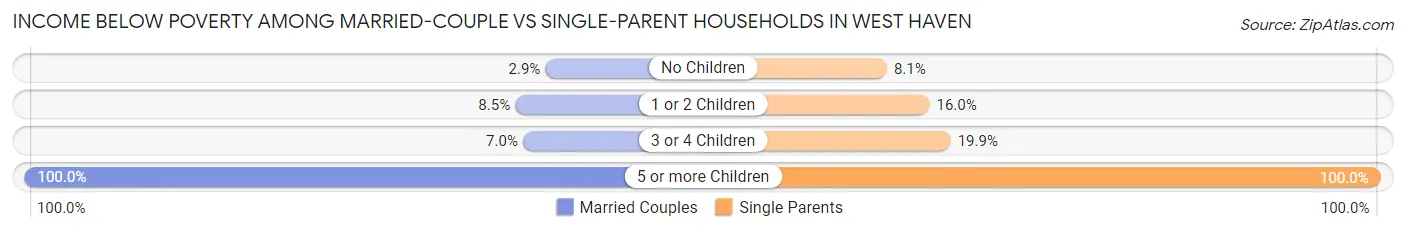
| Children | Married-Couple Families | Single-Parent Households |
| No Children | 139 (2.9%) | 155 (8.1%) |
| 1 or 2 Children | 271 (8.5%) | 326 (16.0%) |
| 3 or 4 Children | 39 (7.0%) | 68 (19.9%) |
| 5 or more Children | 3 (100.0%) | 17 (100.0%) |
| Total | 452 (5.2%) | 566 (13.1%) |
Race in West Haven
The most populous races in West Haven are White / Caucasian (31,247 | 56.5%), Hispanic or Latino (14,801 | 26.8%), and Black / African American (9,822 | 17.7%).
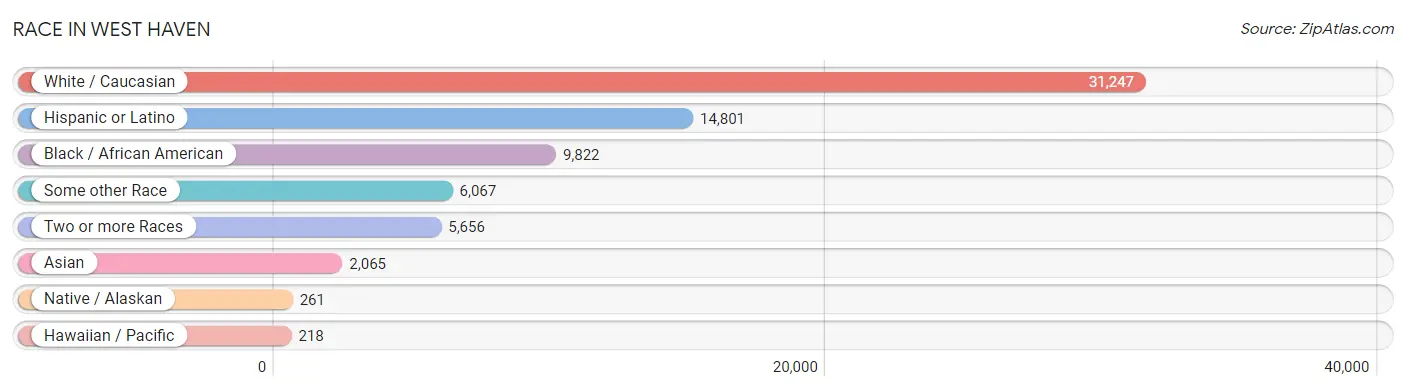
| Race | # Population | % Population |
| Asian | 2,065 | 3.7% |
| Black / African American | 9,822 | 17.7% |
| Hawaiian / Pacific | 218 | 0.4% |
| Hispanic or Latino | 14,801 | 26.8% |
| Native / Alaskan | 261 | 0.5% |
| White / Caucasian | 31,247 | 56.5% |
| Two or more Races | 5,656 | 10.2% |
| Some other Race | 6,067 | 11.0% |
| Total | 55,336 | 100.0% |
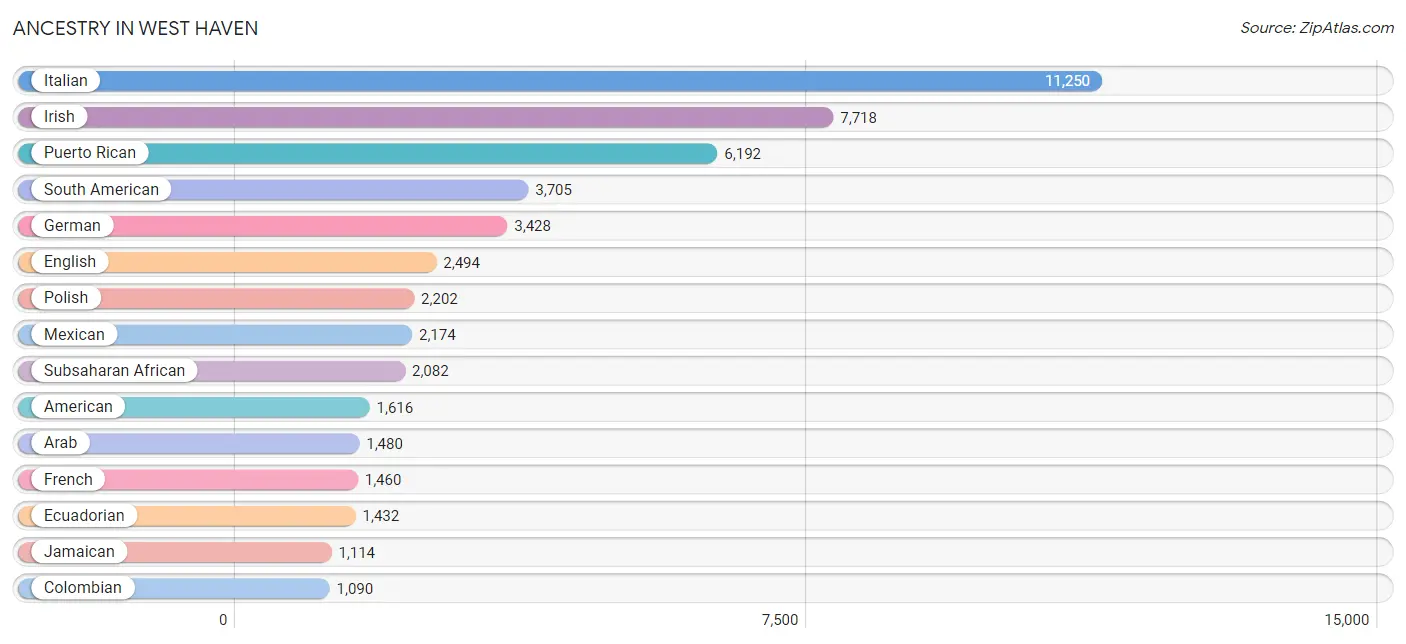
Ancestry in West Haven
The most populous ancestries reported in West Haven are Italian (11,250 | 20.3%), Irish (7,718 | 14.0%), Puerto Rican (6,192 | 11.2%), South American (3,705 | 6.7%), and German (3,428 | 6.2%), together accounting for 58.4% of all West Haven residents.
| Ancestry | # Population | % Population |
| Afghan | 137 | 0.3% |
| African | 650 | 1.2% |
| American | 1,616 | 2.9% |
| Arab | 1,480 | 2.7% |
| Argentinean | 184 | 0.3% |
| Armenian | 38 | 0.1% |
| Australian | 58 | 0.1% |
| Austrian | 86 | 0.2% |
| Barbadian | 18 | 0.0% |
| Belgian | 11 | 0.0% |
| Bhutanese | 34 | 0.1% |
| Blackfeet | 15 | 0.0% |
| Brazilian | 271 | 0.5% |
| British | 158 | 0.3% |
| British West Indian | 39 | 0.1% |
| Burmese | 166 | 0.3% |
| Canadian | 292 | 0.5% |
| Cape Verdean | 288 | 0.5% |
| Carpatho Rusyn | 18 | 0.0% |
| Central American | 1,031 | 1.9% |
| Central American Indian | 7 | 0.0% |
| Cherokee | 295 | 0.5% |
| Cheyenne | 39 | 0.1% |
| Chilean | 67 | 0.1% |
| Chippewa | 23 | 0.0% |
| Colombian | 1,090 | 2.0% |
| Costa Rican | 55 | 0.1% |
| Croatian | 151 | 0.3% |
| Cuban | 302 | 0.5% |
| Czech | 52 | 0.1% |
| Czechoslovakian | 79 | 0.1% |
| Danish | 73 | 0.1% |
| Dominican | 733 | 1.3% |
| Dutch | 140 | 0.3% |
| Eastern European | 190 | 0.3% |
| Ecuadorian | 1,432 | 2.6% |
| Egyptian | 115 | 0.2% |
| English | 2,494 | 4.5% |
| Ethiopian | 164 | 0.3% |
| European | 179 | 0.3% |
| Fijian | 6 | 0.0% |
| Filipino | 22 | 0.0% |
| Finnish | 128 | 0.2% |
| French | 1,460 | 2.6% |
| French American Indian | 12 | 0.0% |
| French Canadian | 338 | 0.6% |
| German | 3,428 | 6.2% |
| Ghanaian | 408 | 0.7% |
| Greek | 317 | 0.6% |
| Guamanian / Chamorro | 9 | 0.0% |
| Guatemalan | 625 | 1.1% |
| Guyanese | 49 | 0.1% |
| Haitian | 201 | 0.4% |
| Honduran | 1 | 0.0% |
| Hungarian | 286 | 0.5% |
| Indian (Asian) | 651 | 1.2% |
| Inupiat | 7 | 0.0% |
| Iranian | 11 | 0.0% |
| Irish | 7,718 | 14.0% |
| Iroquois | 5 | 0.0% |
| Italian | 11,250 | 20.3% |
| Jamaican | 1,114 | 2.0% |
| Kenyan | 6 | 0.0% |
| Korean | 573 | 1.0% |
| Lebanese | 133 | 0.2% |
| Liberian | 5 | 0.0% |
| Lithuanian | 242 | 0.4% |
| Malaysian | 24 | 0.0% |
| Mexican | 2,174 | 3.9% |
| Mexican American Indian | 148 | 0.3% |
| Moroccan | 649 | 1.2% |
| Native Hawaiian | 212 | 0.4% |
| Navajo | 123 | 0.2% |
| New Zealander | 15 | 0.0% |
| Nigerian | 113 | 0.2% |
| Northern European | 72 | 0.1% |
| Norwegian | 75 | 0.1% |
| Pakistani | 7 | 0.0% |
| Palestinian | 249 | 0.4% |
| Panamanian | 11 | 0.0% |
| Peruvian | 531 | 1.0% |
| Polish | 2,202 | 4.0% |
| Portuguese | 775 | 1.4% |
| Puerto Rican | 6,192 | 11.2% |
| Romanian | 289 | 0.5% |
| Russian | 349 | 0.6% |
| Salvadoran | 339 | 0.6% |
| Scandinavian | 12 | 0.0% |
| Scotch-Irish | 117 | 0.2% |
| Scottish | 154 | 0.3% |
| Seminole | 19 | 0.0% |
| Senegalese | 347 | 0.6% |
| Serbian | 21 | 0.0% |
| Slavic | 111 | 0.2% |
| Slovak | 274 | 0.5% |
| South African | 2 | 0.0% |
| South American | 3,705 | 6.7% |
| Spaniard | 89 | 0.2% |
| Spanish | 65 | 0.1% |
| Sri Lankan | 26 | 0.1% |
| Subsaharan African | 2,082 | 3.8% |
| Sudanese | 130 | 0.2% |
| Swedish | 276 | 0.5% |
| Swiss | 35 | 0.1% |
| Syrian | 7 | 0.0% |
| Thai | 667 | 1.2% |
| Trinidadian and Tobagonian | 117 | 0.2% |
| Turkish | 40 | 0.1% |
| Ukrainian | 195 | 0.4% |
| Uruguayan | 17 | 0.0% |
| Venezuelan | 384 | 0.7% |
| Vietnamese | 22 | 0.0% |
| Welsh | 124 | 0.2% |
| West Indian | 20 | 0.0% |
| Yugoslavian | 17 | 0.0% | View All 115 Rows |
Immigrants in West Haven
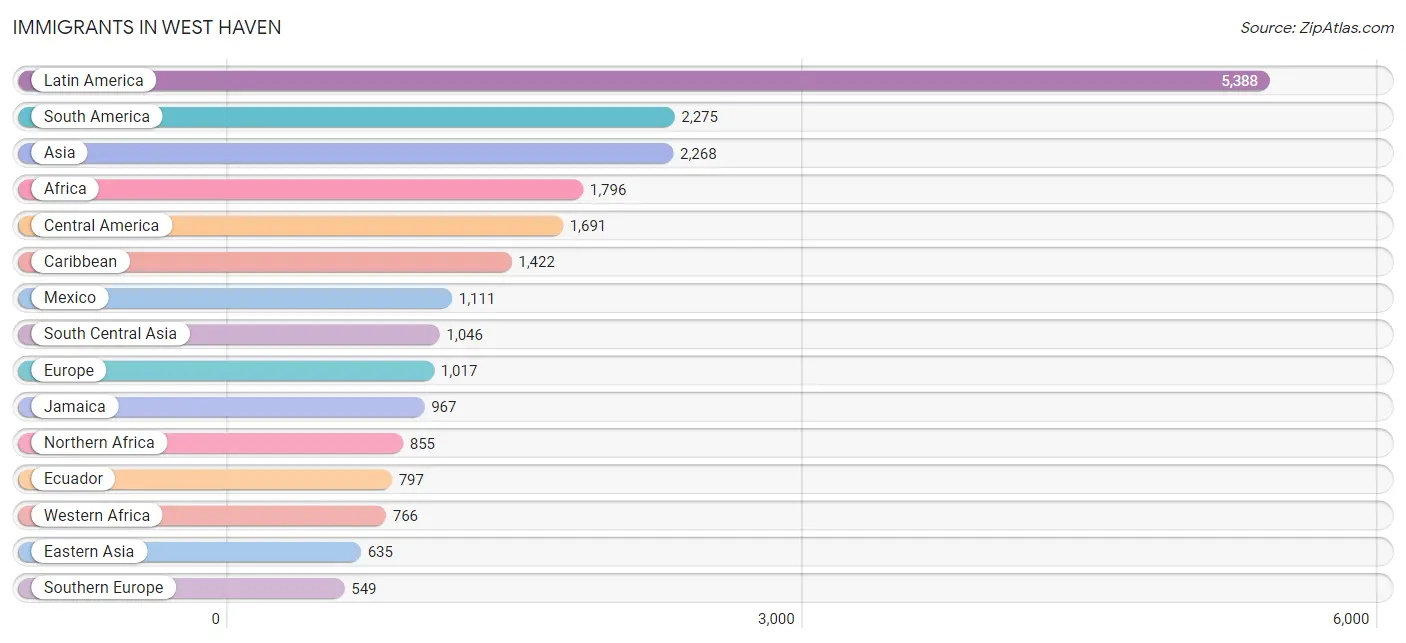
The most numerous immigrant groups reported in West Haven came from Latin America (5,388 | 9.7%), South America (2,275 | 4.1%), Asia (2,268 | 4.1%), Africa (1,796 | 3.3%), and Central America (1,691 | 3.1%), together accounting for 24.3% of all West Haven residents.
| Immigration Origin | # Population | % Population |
| Afghanistan | 130 | 0.2% |
| Africa | 1,796 | 3.3% |
| Asia | 2,268 | 4.1% |
| Austria | 27 | 0.1% |
| Azores | 8 | 0.0% |
| Bangladesh | 22 | 0.0% |
| Belgium | 21 | 0.0% |
| Bosnia and Herzegovina | 15 | 0.0% |
| Brazil | 286 | 0.5% |
| Canada | 49 | 0.1% |
| Caribbean | 1,422 | 2.6% |
| Central America | 1,691 | 3.1% |
| Chile | 67 | 0.1% |
| China | 544 | 1.0% |
| Colombia | 544 | 1.0% |
| Costa Rica | 29 | 0.1% |
| Cuba | 103 | 0.2% |
| Dominica | 8 | 0.0% |
| Dominican Republic | 302 | 0.5% |
| Eastern Africa | 139 | 0.3% |
| Eastern Asia | 635 | 1.1% |
| Eastern Europe | 311 | 0.6% |
| Ecuador | 797 | 1.4% |
| Egypt | 133 | 0.2% |
| El Salvador | 160 | 0.3% |
| England | 21 | 0.0% |
| Ethiopia | 133 | 0.2% |
| Europe | 1,017 | 1.8% |
| France | 7 | 0.0% |
| Germany | 7 | 0.0% |
| Ghana | 484 | 0.9% |
| Greece | 40 | 0.1% |
| Guatemala | 379 | 0.7% |
| Guyana | 48 | 0.1% |
| Haiti | 27 | 0.1% |
| Honduras | 1 | 0.0% |
| Hong Kong | 9 | 0.0% |
| Hungary | 93 | 0.2% |
| India | 518 | 0.9% |
| Iraq | 35 | 0.1% |
| Israel | 7 | 0.0% |
| Italy | 218 | 0.4% |
| Jamaica | 967 | 1.8% |
| Japan | 12 | 0.0% |
| Jordan | 41 | 0.1% |
| Kenya | 6 | 0.0% |
| Korea | 79 | 0.1% |
| Laos | 8 | 0.0% |
| Latin America | 5,388 | 9.7% |
| Liberia | 5 | 0.0% |
| Lithuania | 8 | 0.0% |
| Mexico | 1,111 | 2.0% |
| Morocco | 531 | 1.0% |
| Nepal | 26 | 0.1% |
| Nigeria | 12 | 0.0% |
| Northern Africa | 855 | 1.5% |
| Northern Europe | 95 | 0.2% |
| Oceania | 53 | 0.1% |
| Pakistan | 350 | 0.6% |
| Panama | 11 | 0.0% |
| Peru | 300 | 0.5% |
| Philippines | 383 | 0.7% |
| Poland | 82 | 0.2% |
| Portugal | 285 | 0.5% |
| Romania | 40 | 0.1% |
| Russia | 33 | 0.1% |
| Saudi Arabia | 13 | 0.0% |
| Senegal | 158 | 0.3% |
| Serbia | 40 | 0.1% |
| South Africa | 17 | 0.0% |
| South America | 2,275 | 4.1% |
| South Central Asia | 1,046 | 1.9% |
| South Eastern Asia | 404 | 0.7% |
| Southern Europe | 549 | 1.0% |
| Spain | 6 | 0.0% |
| Sudan | 183 | 0.3% |
| Sweden | 23 | 0.0% |
| Taiwan | 53 | 0.1% |
| Thailand | 2 | 0.0% |
| Turkey | 44 | 0.1% |
| Uruguay | 17 | 0.0% |
| Venezuela | 216 | 0.4% |
| Vietnam | 11 | 0.0% |
| Western Africa | 766 | 1.4% |
| Western Asia | 140 | 0.3% |
| Western Europe | 62 | 0.1% | View All 86 Rows |
Sex and Age in West Haven
Sex and Age in West Haven
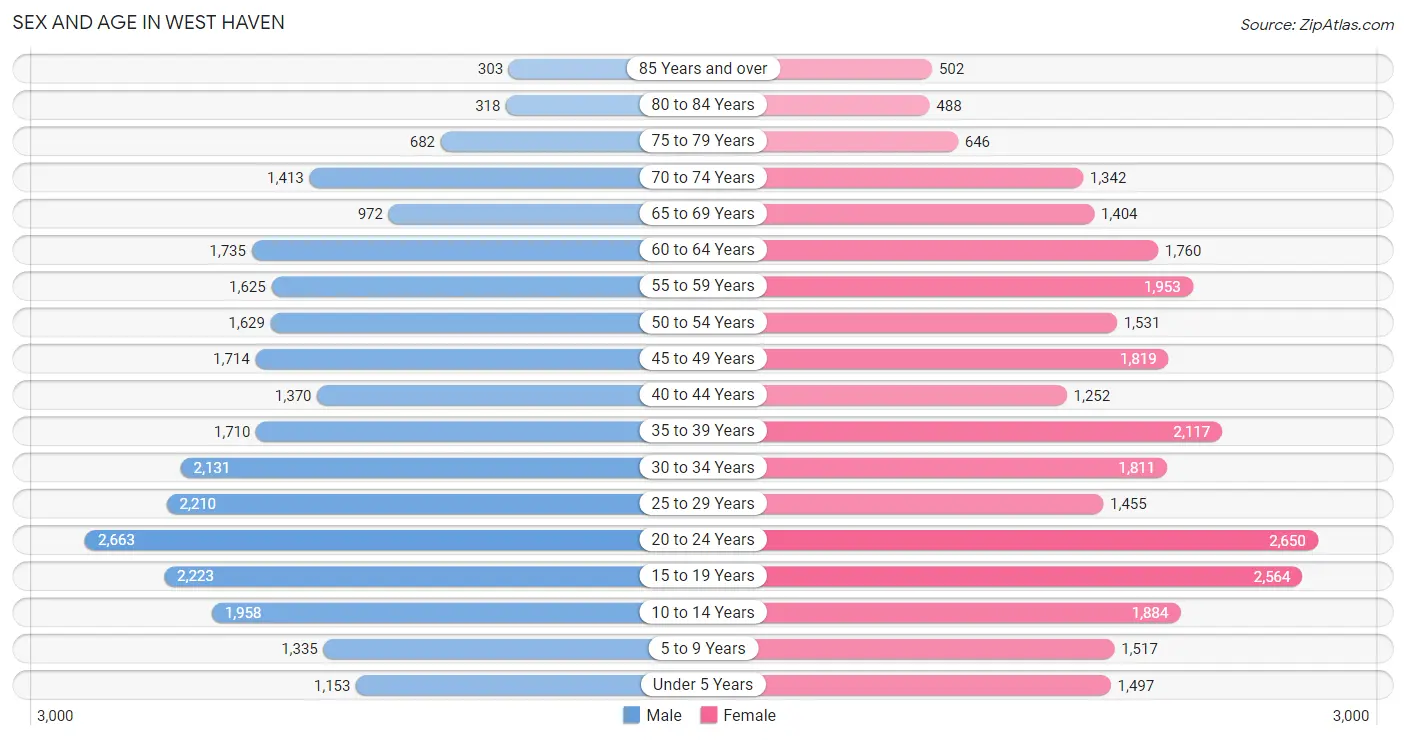
The most populous age groups in West Haven are 20 to 24 Years (2,663 | 9.8%) for men and 20 to 24 Years (2,650 | 9.4%) for women.
| Age Bracket | Male | Female |
| Under 5 Years | 1,153 (4.3%) | 1,497 (5.3%) |
| 5 to 9 Years | 1,335 (4.9%) | 1,517 (5.4%) |
| 10 to 14 Years | 1,958 (7.2%) | 1,884 (6.7%) |
| 15 to 19 Years | 2,223 (8.2%) | 2,564 (9.1%) |
| 20 to 24 Years | 2,663 (9.8%) | 2,650 (9.4%) |
| 25 to 29 Years | 2,210 (8.1%) | 1,455 (5.2%) |
| 30 to 34 Years | 2,131 (7.9%) | 1,811 (6.4%) |
| 35 to 39 Years | 1,710 (6.3%) | 2,117 (7.5%) |
| 40 to 44 Years | 1,370 (5.1%) | 1,252 (4.4%) |
| 45 to 49 Years | 1,714 (6.3%) | 1,819 (6.5%) |
| 50 to 54 Years | 1,629 (6.0%) | 1,531 (5.4%) |
| 55 to 59 Years | 1,625 (6.0%) | 1,953 (6.9%) |
| 60 to 64 Years | 1,735 (6.4%) | 1,760 (6.2%) |
| 65 to 69 Years | 972 (3.6%) | 1,404 (5.0%) |
| 70 to 74 Years | 1,413 (5.2%) | 1,342 (4.8%) |
| 75 to 79 Years | 682 (2.5%) | 646 (2.3%) |
| 80 to 84 Years | 318 (1.2%) | 488 (1.7%) |
| 85 Years and over | 303 (1.1%) | 502 (1.8%) |
| Total | 27,144 (100.0%) | 28,192 (100.0%) |
Families and Households in West Haven
Median Family Size in West Haven
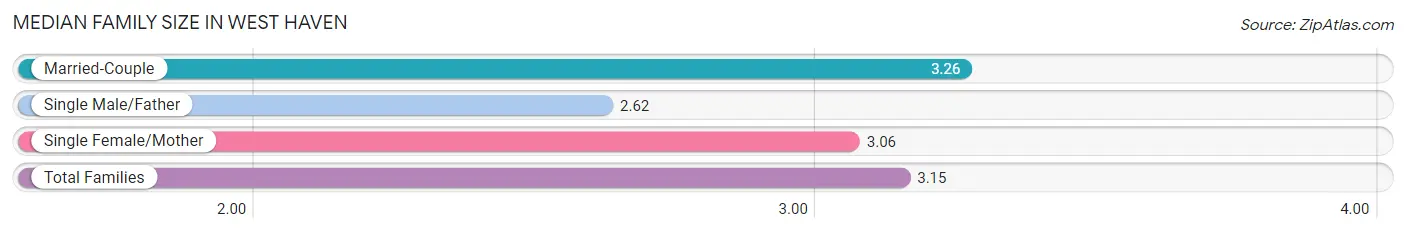
The median family size in West Haven is 3.15 persons per family, with married-couple families (8,637 | 66.7%) accounting for the largest median family size of 3.26 persons per family. On the other hand, single male/father families (1,277 | 9.9%) represent the smallest median family size with 2.62 persons per family.
| Family Type | # Families | Family Size |
| Married-Couple | 8,637 (66.7%) | 3.26 |
| Single Male/Father | 1,277 (9.9%) | 2.62 |
| Single Female/Mother | 3,042 (23.5%) | 3.06 |
| Total Families | 12,956 (100.0%) | 3.15 |
Median Household Size in West Haven
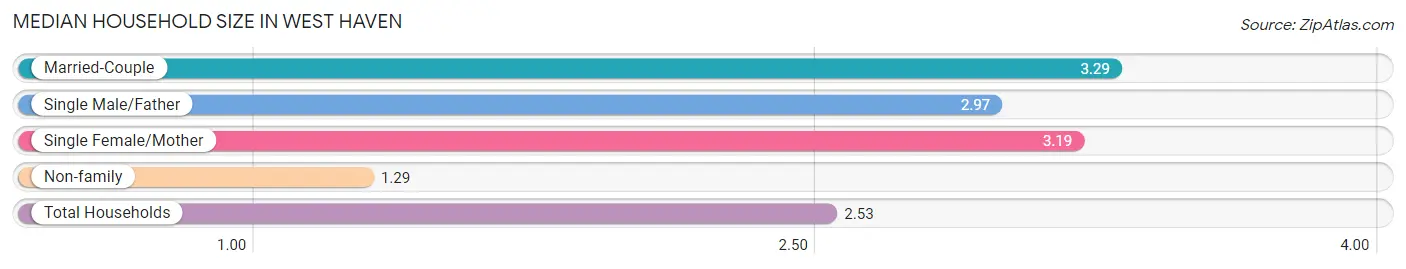
The median household size in West Haven is 2.53 persons per household, with married-couple households (8,637 | 42.3%) accounting for the largest median household size of 3.29 persons per household. non-family households (7,449 | 36.5%) represent the smallest median household size with 1.29 persons per household.
| Household Type | # Households | Household Size |
| Married-Couple | 8,637 (42.3%) | 3.29 |
| Single Male/Father | 1,277 (6.3%) | 2.97 |
| Single Female/Mother | 3,042 (14.9%) | 3.19 |
| Non-family | 7,449 (36.5%) | 1.29 |
| Total Households | 20,405 (100.0%) | 2.53 |
Household Size by Marriage Status in West Haven
Out of a total of 20,405 households in West Haven, 12,956 (63.5%) are family households, while 7,449 (36.5%) are nonfamily households. The most numerous type of family households are 2-person households, comprising 4,984, and the most common type of nonfamily households are 1-person households, comprising 5,939.
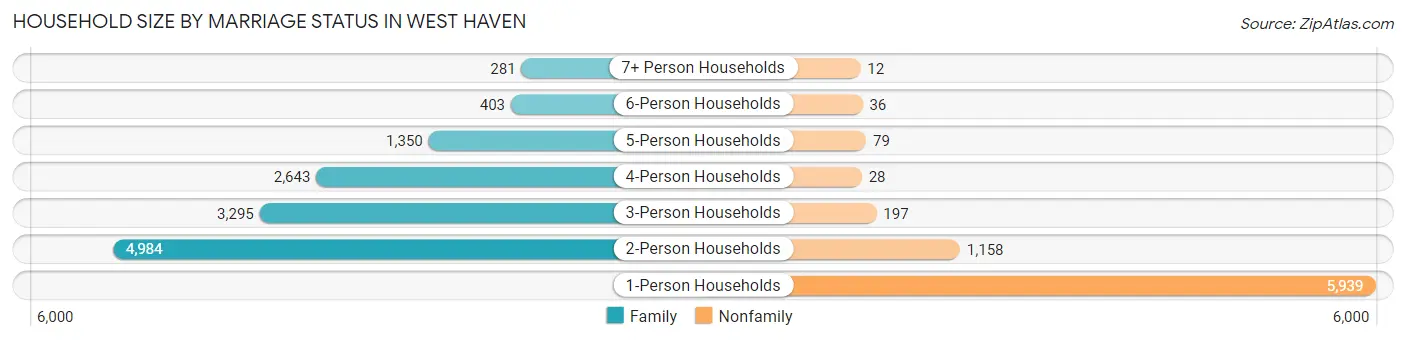
| Household Size | Family Households | Nonfamily Households |
| 1-Person Households | - | 5,939 (29.1%) |
| 2-Person Households | 4,984 (24.4%) | 1,158 (5.7%) |
| 3-Person Households | 3,295 (16.2%) | 197 (1.0%) |
| 4-Person Households | 2,643 (13.0%) | 28 (0.1%) |
| 5-Person Households | 1,350 (6.6%) | 79 (0.4%) |
| 6-Person Households | 403 (2.0%) | 36 (0.2%) |
| 7+ Person Households | 281 (1.4%) | 12 (0.1%) |
| Total | 12,956 (63.5%) | 7,449 (36.5%) |
Female Fertility in West Haven
Fertility by Age in West Haven
Average fertility rate in West Haven is 29.0 births per 1,000 women. Women in the age bracket of 20 to 34 years have the highest fertility rate with 42.0 births per 1,000 women. Women in the age bracket of 20 to 34 years acount for 62.9% of all women with births.
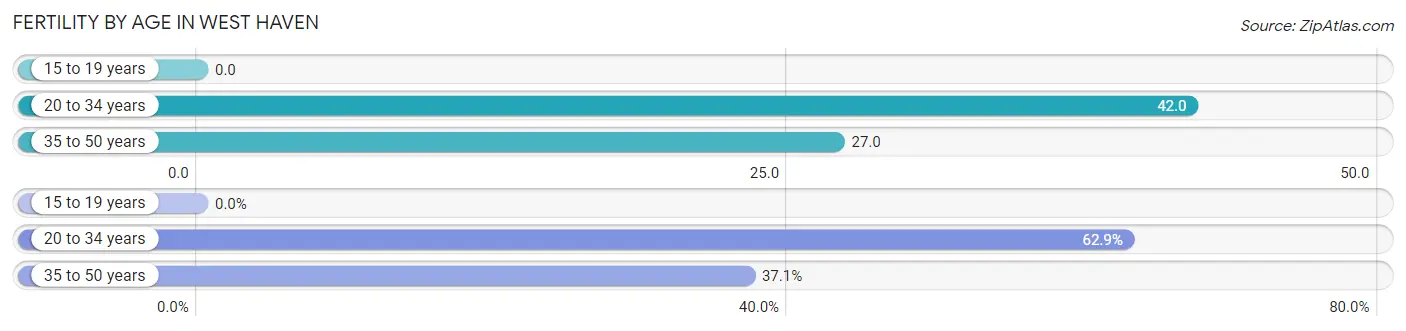
| Age Bracket | Women with Births | Births / 1,000 Women |
| 15 to 19 years | 0 (0.0%) | 0.0 |
| 20 to 34 years | 249 (62.9%) | 42.0 |
| 35 to 50 years | 147 (37.1%) | 27.0 |
| Total | 396 (100.0%) | 29.0 |
Fertility by Age by Marriage Status in West Haven
57.1% of women with births (396) in West Haven are married. The highest percentage of unmarried women with births falls into 20 to 34 years age bracket with 58.6% of them unmarried at the time of birth, while the lowest percentage of unmarried women with births belong to 35 to 50 years age bracket with 16.3% of them unmarried.
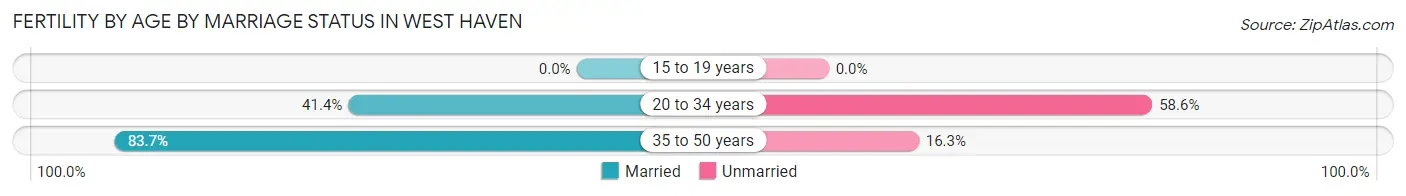
| Age Bracket | Married | Unmarried |
| 15 to 19 years | 0 (0.0%) | 0 (0.0%) |
| 20 to 34 years | 103 (41.4%) | 146 (58.6%) |
| 35 to 50 years | 123 (83.7%) | 24 (16.3%) |
| Total | 226 (57.1%) | 170 (42.9%) |
Fertility by Education in West Haven
Average fertility rate in West Haven is 29.0 births per 1,000 women. Women with the education attainment of high school diploma have the highest fertility rate of 43.0 births per 1,000 women, while women with the education attainment of college or associate's degree have the lowest fertility at 10.0 births per 1,000 women. Women with the education attainment of high school diploma represent 38.4% of all women with births.
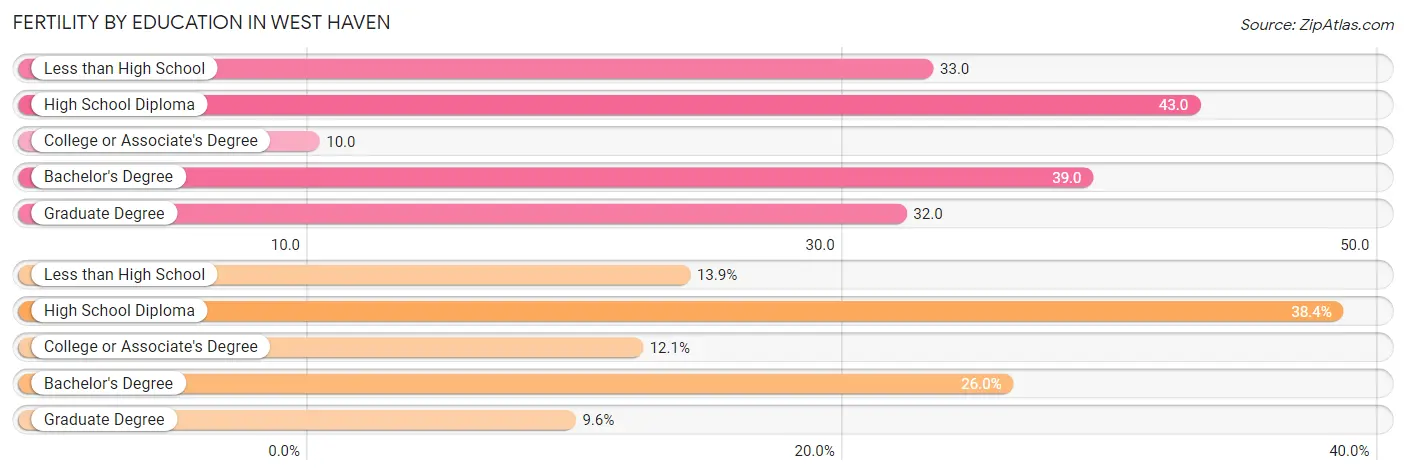
| Educational Attainment | Women with Births | Births / 1,000 Women |
| Less than High School | 55 (13.9%) | 33.0 |
| High School Diploma | 152 (38.4%) | 43.0 |
| College or Associate's Degree | 48 (12.1%) | 10.0 |
| Bachelor's Degree | 103 (26.0%) | 39.0 |
| Graduate Degree | 38 (9.6%) | 32.0 |
| Total | 396 (100.0%) | 29.0 |
Fertility by Education by Marriage Status in West Haven
42.9% of women with births in West Haven are unmarried. Women with the educational attainment of less than high school are most likely to be married with 100.0% of them married at childbirth, while women with the educational attainment of bachelor's degree are least likely to be married with 62.1% of them unmarried at childbirth.
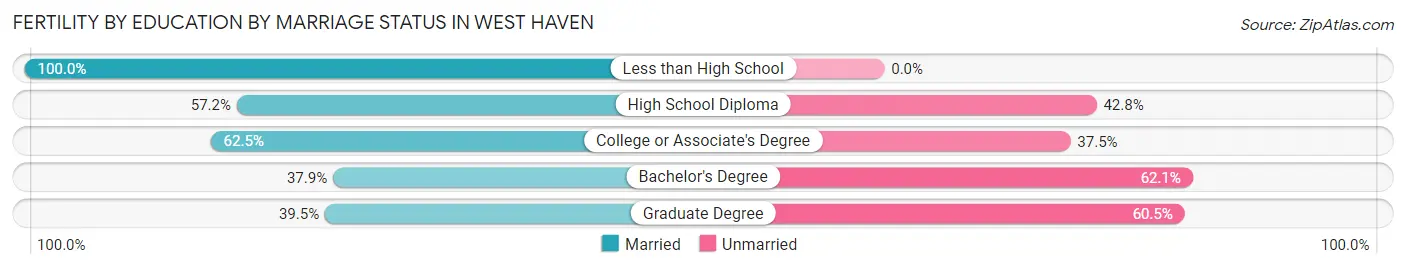
| Educational Attainment | Married | Unmarried |
| Less than High School | 55 (100.0%) | 0 (0.0%) |
| High School Diploma | 87 (57.2%) | 65 (42.8%) |
| College or Associate's Degree | 30 (62.5%) | 18 (37.5%) |
| Bachelor's Degree | 39 (37.9%) | 64 (62.1%) |
| Graduate Degree | 15 (39.5%) | 23 (60.5%) |
| Total | 226 (57.1%) | 170 (42.9%) |
Employment Characteristics in West Haven
Employment by Class of Employer in West Haven
Among the 26,403 employed individuals in West Haven, private company employees (18,232 | 69.1%), not-for-profit organizations (3,619 | 13.7%), and local government employees (1,581 | 6.0%) make up the most common classes of employment.
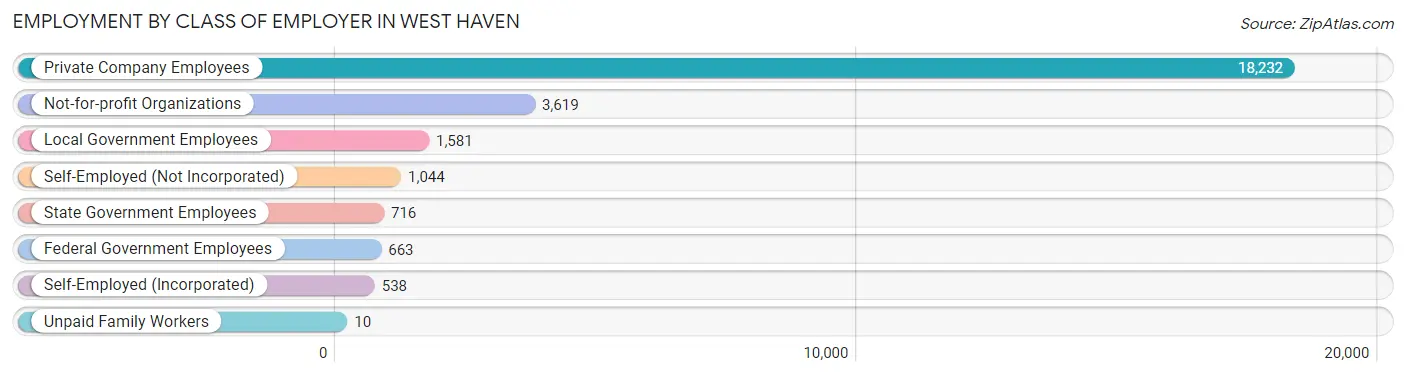
| Employer Class | # Employees | % Employees |
| Private Company Employees | 18,232 | 69.1% |
| Self-Employed (Incorporated) | 538 | 2.0% |
| Self-Employed (Not Incorporated) | 1,044 | 4.0% |
| Not-for-profit Organizations | 3,619 | 13.7% |
| Local Government Employees | 1,581 | 6.0% |
| State Government Employees | 716 | 2.7% |
| Federal Government Employees | 663 | 2.5% |
| Unpaid Family Workers | 10 | 0.0% |
| Total | 26,403 | 100.0% |
Employment Status by Age in West Haven
According to the labor force statistics for West Haven, out of the total population over 16 years of age (45,372), 65.1% or 29,537 individuals are in the labor force, with 7.9% or 2,333 of them unemployed. The age group with the highest labor force participation rate is 45 to 54 years, with 87.7% or 5,870 individuals in the labor force. Within the labor force, the 55 to 59 years age range has the highest percentage of unemployed individuals, with 11.0% or 311 of them being unemployed.
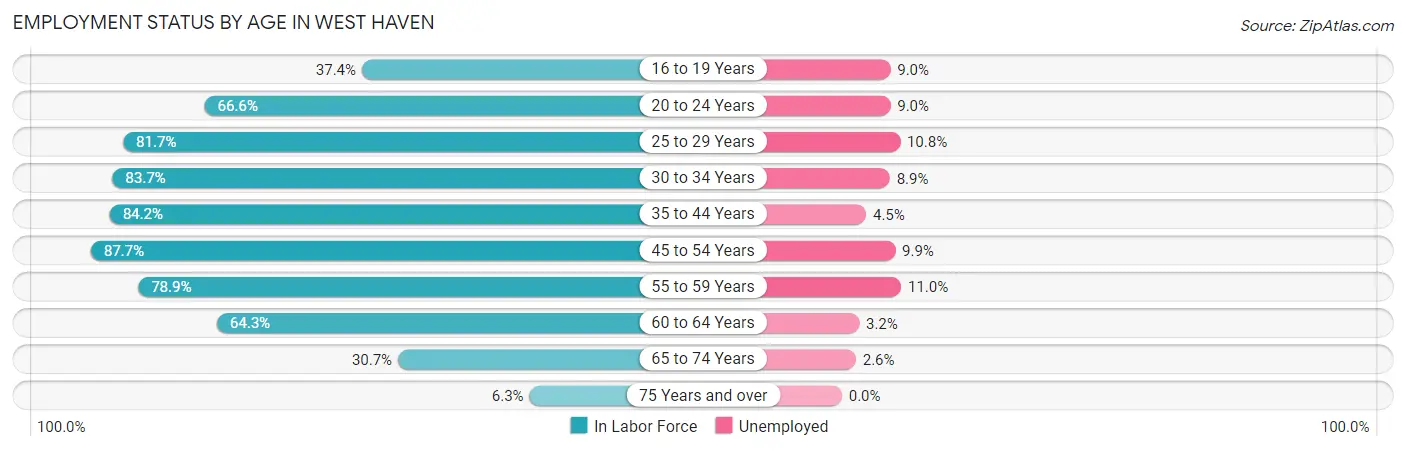
| Age Bracket | In Labor Force | Unemployed |
| 16 to 19 Years | 1,558 (37.4%) | 140 (9.0%) |
| 20 to 24 Years | 3,538 (66.6%) | 318 (9.0%) |
| 25 to 29 Years | 2,994 (81.7%) | 323 (10.8%) |
| 30 to 34 Years | 3,299 (83.7%) | 294 (8.9%) |
| 35 to 44 Years | 5,430 (84.2%) | 244 (4.5%) |
| 45 to 54 Years | 5,870 (87.7%) | 581 (9.9%) |
| 55 to 59 Years | 2,823 (78.9%) | 311 (11.0%) |
| 60 to 64 Years | 2,247 (64.3%) | 72 (3.2%) |
| 65 to 74 Years | 1,575 (30.7%) | 41 (2.6%) |
| 75 Years and over | 185 (6.3%) | 0 (0.0%) |
| Total | 29,537 (65.1%) | 2,333 (7.9%) |
Employment Status by Educational Attainment in West Haven
According to labor force statistics for West Haven, 81.4% of individuals (22,647) out of the total population between 25 and 64 years of age (27,822) are in the labor force, with 8.0% or 1,812 of them being unemployed. The group with the highest labor force participation rate are those with the educational attainment of bachelor's degree or higher, with 88.3% or 7,080 individuals in the labor force. Within the labor force, individuals with less than high school education have the highest percentage of unemployment, with 13.4% or 290 of them being unemployed.
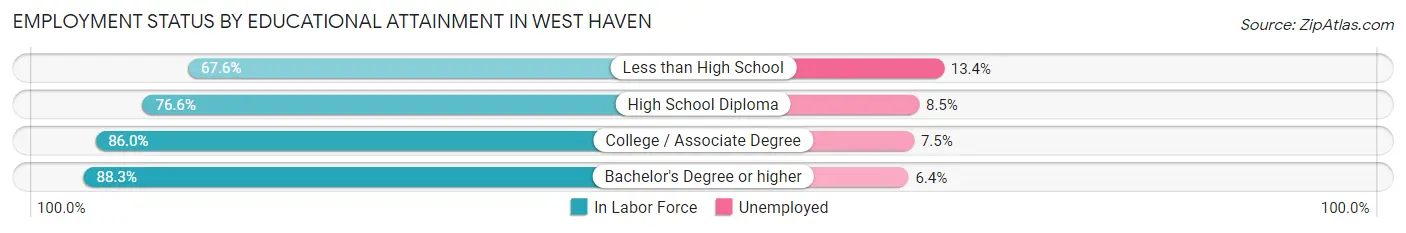
| Educational Attainment | In Labor Force | Unemployed |
| Less than High School | 2,163 (67.6%) | 429 (13.4%) |
| High School Diploma | 6,987 (76.6%) | 775 (8.5%) |
| College / Associate Degree | 6,435 (86.0%) | 561 (7.5%) |
| Bachelor's Degree or higher | 7,080 (88.3%) | 513 (6.4%) |
| Total | 22,647 (81.4%) | 2,226 (8.0%) |
Employment Occupations by Sex in West Haven
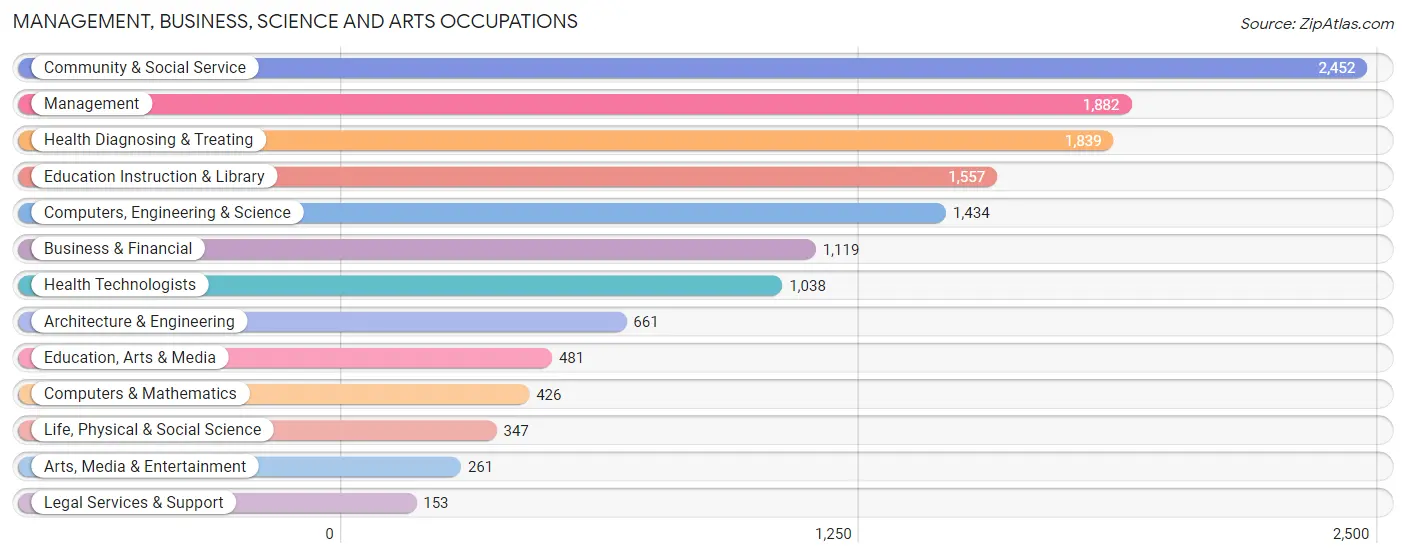
Management, Business, Science and Arts Occupations
The most common Management, Business, Science and Arts occupations in West Haven are Community & Social Service (2,452 | 9.0%), Management (1,882 | 6.9%), Health Diagnosing & Treating (1,839 | 6.8%), Education Instruction & Library (1,557 | 5.7%), and Computers, Engineering & Science (1,434 | 5.3%).
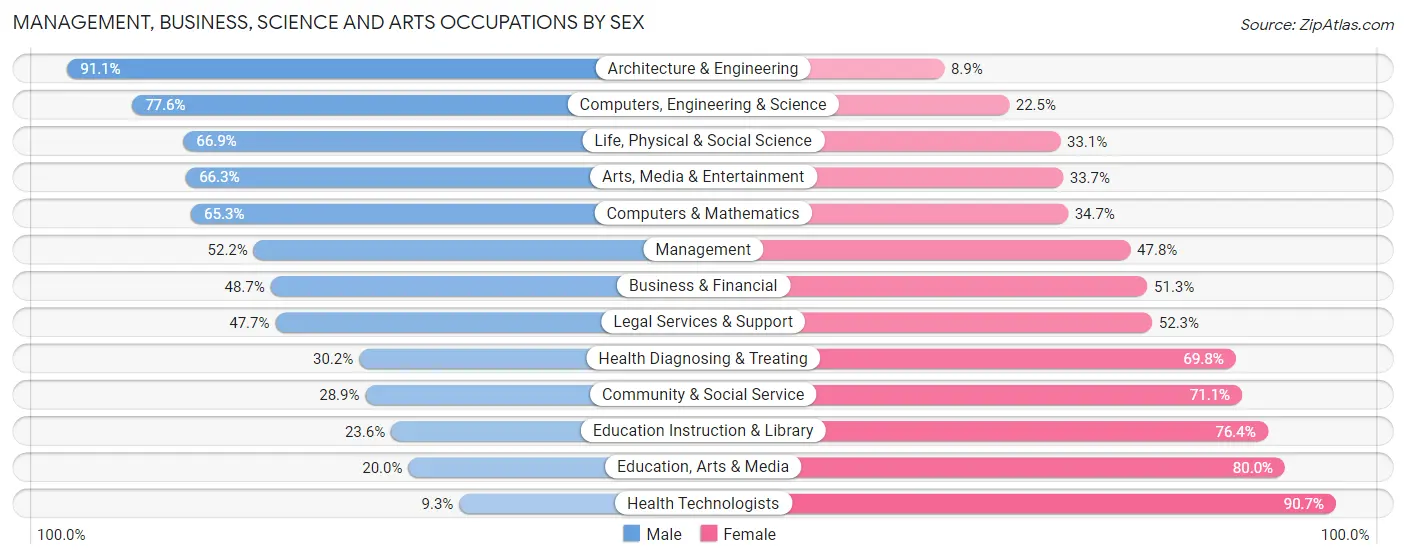
Management, Business, Science and Arts Occupations by Sex
Within the Management, Business, Science and Arts occupations in West Haven, the most male-oriented occupations are Architecture & Engineering (91.1%), Computers, Engineering & Science (77.5%), and Life, Physical & Social Science (66.9%), while the most female-oriented occupations are Health Technologists (90.7%), Education, Arts & Media (80.0%), and Education Instruction & Library (76.4%).
| Occupation | Male | Female |
| Management | 983 (52.2%) | 899 (47.8%) |
| Business & Financial | 545 (48.7%) | 574 (51.3%) |
| Computers, Engineering & Science | 1,112 (77.5%) | 322 (22.5%) |
| Computers & Mathematics | 278 (65.3%) | 148 (34.7%) |
| Architecture & Engineering | 602 (91.1%) | 59 (8.9%) |
| Life, Physical & Social Science | 232 (66.9%) | 115 (33.1%) |
| Community & Social Service | 709 (28.9%) | 1,743 (71.1%) |
| Education, Arts & Media | 96 (20.0%) | 385 (80.0%) |
| Legal Services & Support | 73 (47.7%) | 80 (52.3%) |
| Education Instruction & Library | 367 (23.6%) | 1,190 (76.4%) |
| Arts, Media & Entertainment | 173 (66.3%) | 88 (33.7%) |
| Health Diagnosing & Treating | 556 (30.2%) | 1,283 (69.8%) |
| Health Technologists | 97 (9.3%) | 941 (90.7%) |
| Total (Category) | 3,905 (44.8%) | 4,821 (55.2%) |
| Total (Overall) | 14,255 (52.4%) | 12,940 (47.6%) |
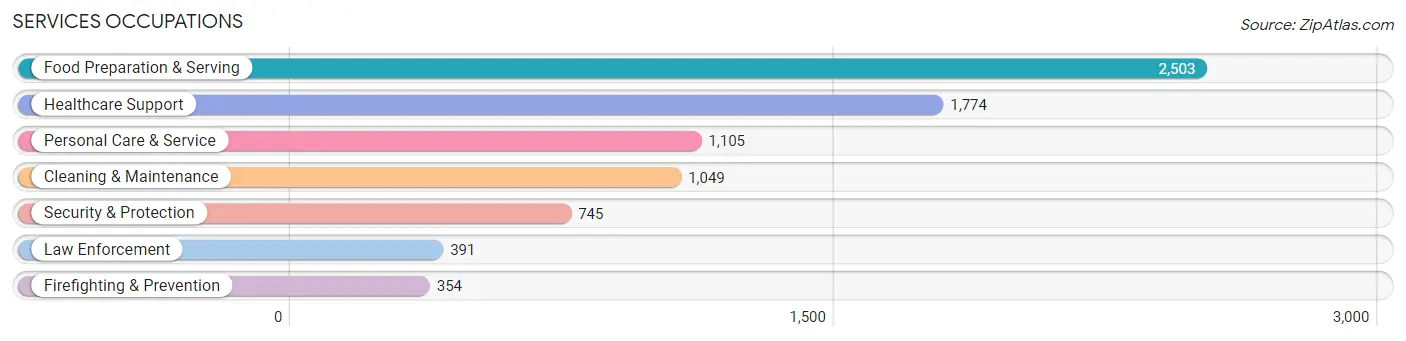
Services Occupations
The most common Services occupations in West Haven are Food Preparation & Serving (2,503 | 9.2%), Healthcare Support (1,774 | 6.5%), Personal Care & Service (1,105 | 4.1%), Cleaning & Maintenance (1,049 | 3.9%), and Security & Protection (745 | 2.7%).
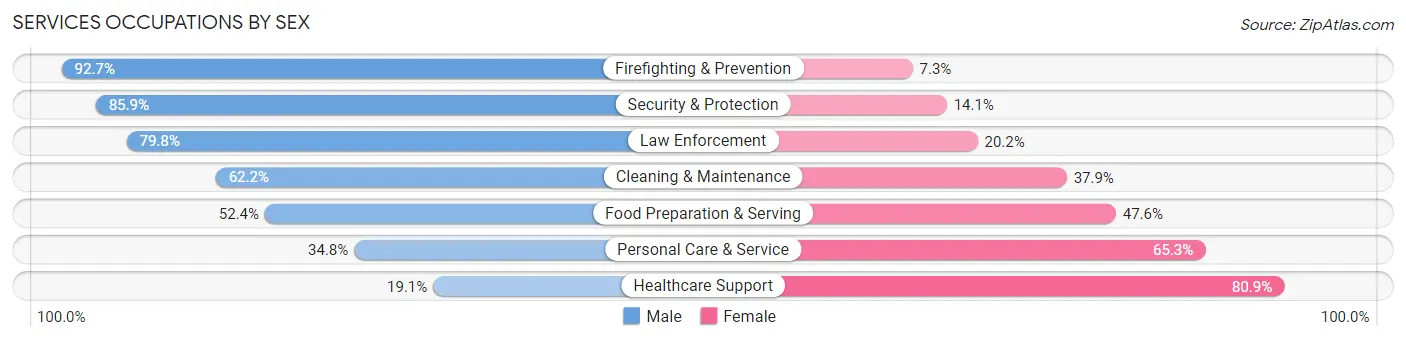
Services Occupations by Sex
Within the Services occupations in West Haven, the most male-oriented occupations are Firefighting & Prevention (92.7%), Security & Protection (85.9%), and Law Enforcement (79.8%), while the most female-oriented occupations are Healthcare Support (80.9%), Personal Care & Service (65.2%), and Food Preparation & Serving (47.6%).
| Occupation | Male | Female |
| Healthcare Support | 339 (19.1%) | 1,435 (80.9%) |
| Security & Protection | 640 (85.9%) | 105 (14.1%) |
| Firefighting & Prevention | 328 (92.7%) | 26 (7.3%) |
| Law Enforcement | 312 (79.8%) | 79 (20.2%) |
| Food Preparation & Serving | 1,312 (52.4%) | 1,191 (47.6%) |
| Cleaning & Maintenance | 652 (62.2%) | 397 (37.9%) |
| Personal Care & Service | 384 (34.7%) | 721 (65.2%) |
| Total (Category) | 3,327 (46.4%) | 3,849 (53.6%) |
| Total (Overall) | 14,255 (52.4%) | 12,940 (47.6%) |
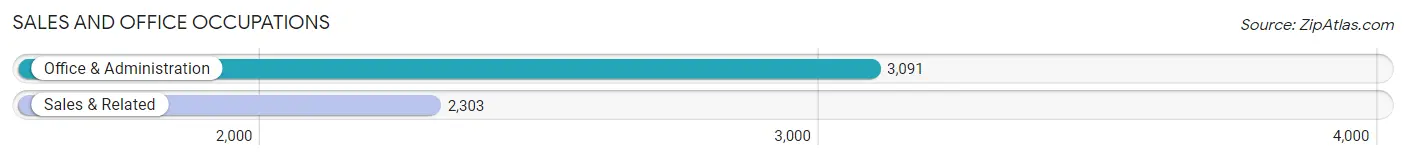
Sales and Office Occupations
The most common Sales and Office occupations in West Haven are Office & Administration (3,091 | 11.4%), and Sales & Related (2,303 | 8.5%).
Sales and Office Occupations by Sex
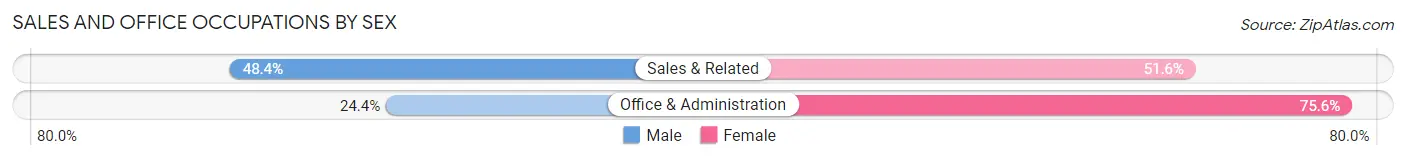
| Occupation | Male | Female |
| Sales & Related | 1,115 (48.4%) | 1,188 (51.6%) |
| Office & Administration | 754 (24.4%) | 2,337 (75.6%) |
| Total (Category) | 1,869 (34.6%) | 3,525 (65.3%) |
| Total (Overall) | 14,255 (52.4%) | 12,940 (47.6%) |
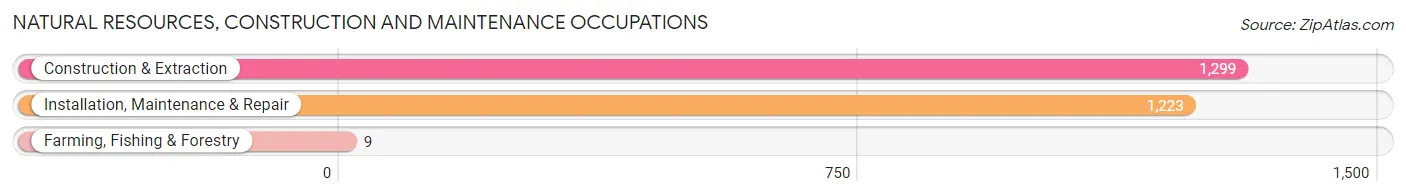
Natural Resources, Construction and Maintenance Occupations
The most common Natural Resources, Construction and Maintenance occupations in West Haven are Construction & Extraction (1,299 | 4.8%), Installation, Maintenance & Repair (1,223 | 4.5%), and Farming, Fishing & Forestry (9 | 0.0%).
Natural Resources, Construction and Maintenance Occupations by Sex
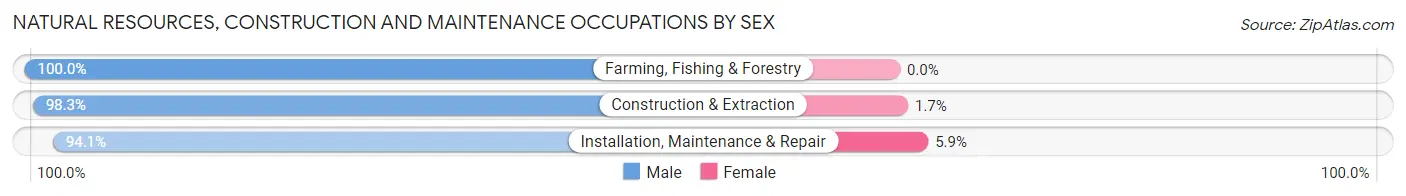
| Occupation | Male | Female |
| Farming, Fishing & Forestry | 9 (100.0%) | 0 (0.0%) |
| Construction & Extraction | 1,277 (98.3%) | 22 (1.7%) |
| Installation, Maintenance & Repair | 1,151 (94.1%) | 72 (5.9%) |
| Total (Category) | 2,437 (96.3%) | 94 (3.7%) |
| Total (Overall) | 14,255 (52.4%) | 12,940 (47.6%) |
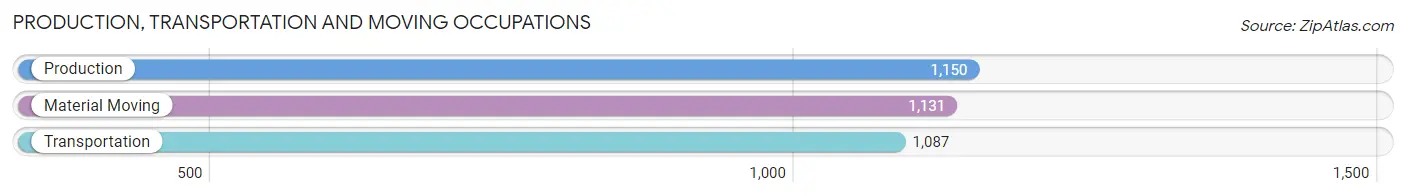
Production, Transportation and Moving Occupations
The most common Production, Transportation and Moving occupations in West Haven are Production (1,150 | 4.2%), Material Moving (1,131 | 4.2%), and Transportation (1,087 | 4.0%).
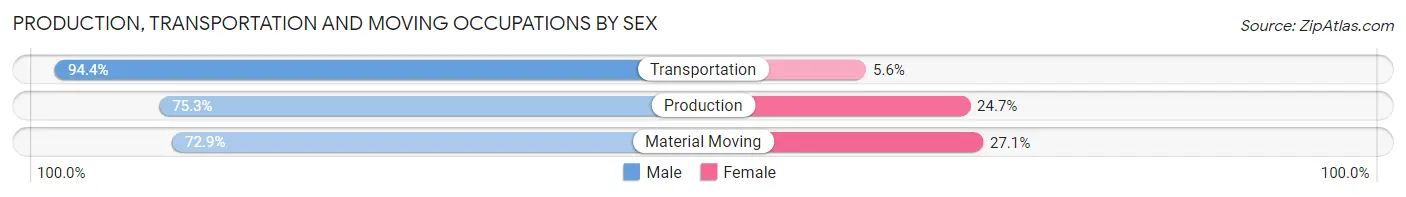
Production, Transportation and Moving Occupations by Sex
| Occupation | Male | Female |
| Production | 866 (75.3%) | 284 (24.7%) |
| Transportation | 1,026 (94.4%) | 61 (5.6%) |
| Material Moving | 825 (72.9%) | 306 (27.1%) |
| Total (Category) | 2,717 (80.7%) | 651 (19.3%) |
| Total (Overall) | 14,255 (52.4%) | 12,940 (47.6%) |
Employment Industries by Sex in West Haven
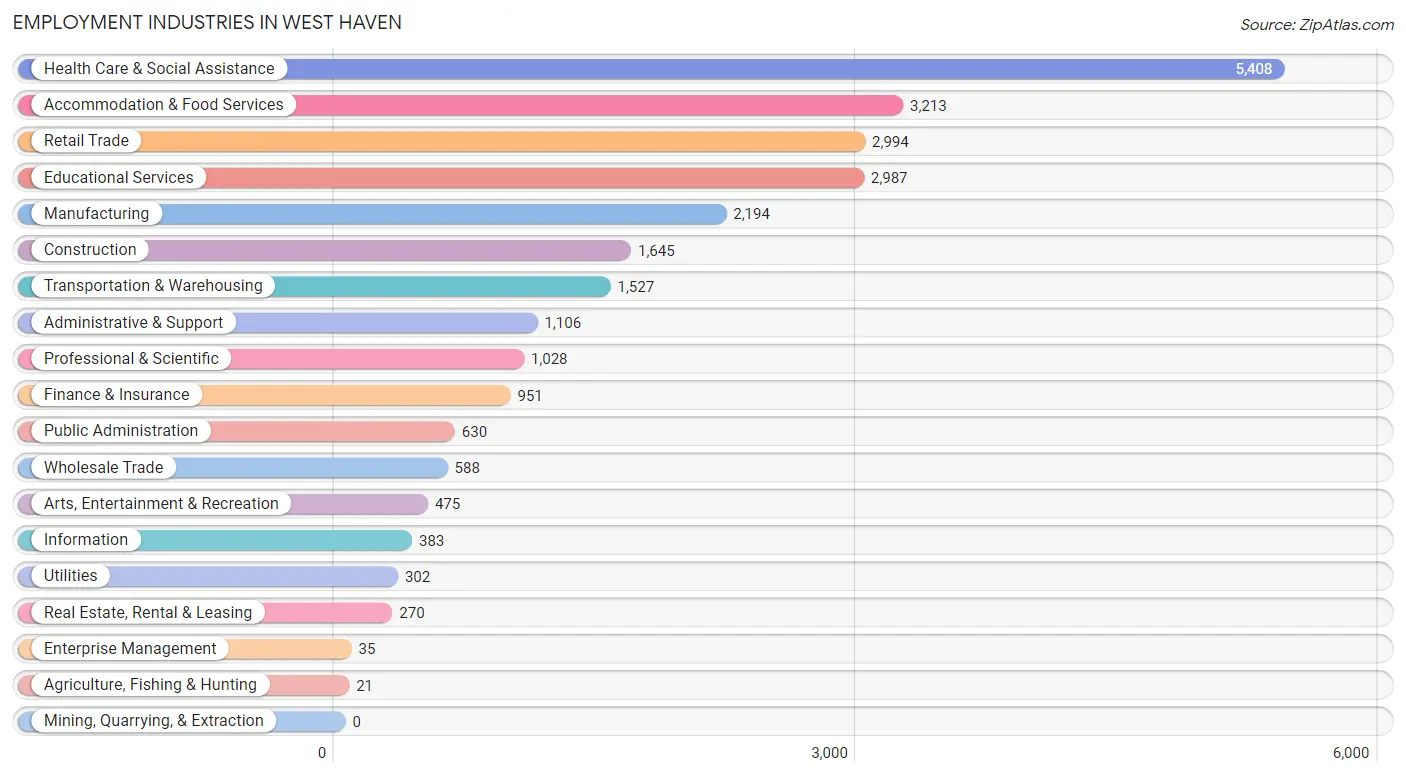
Employment Industries in West Haven
The major employment industries in West Haven include Health Care & Social Assistance (5,408 | 19.9%), Accommodation & Food Services (3,213 | 11.8%), Retail Trade (2,994 | 11.0%), Educational Services (2,987 | 11.0%), and Manufacturing (2,194 | 8.1%).
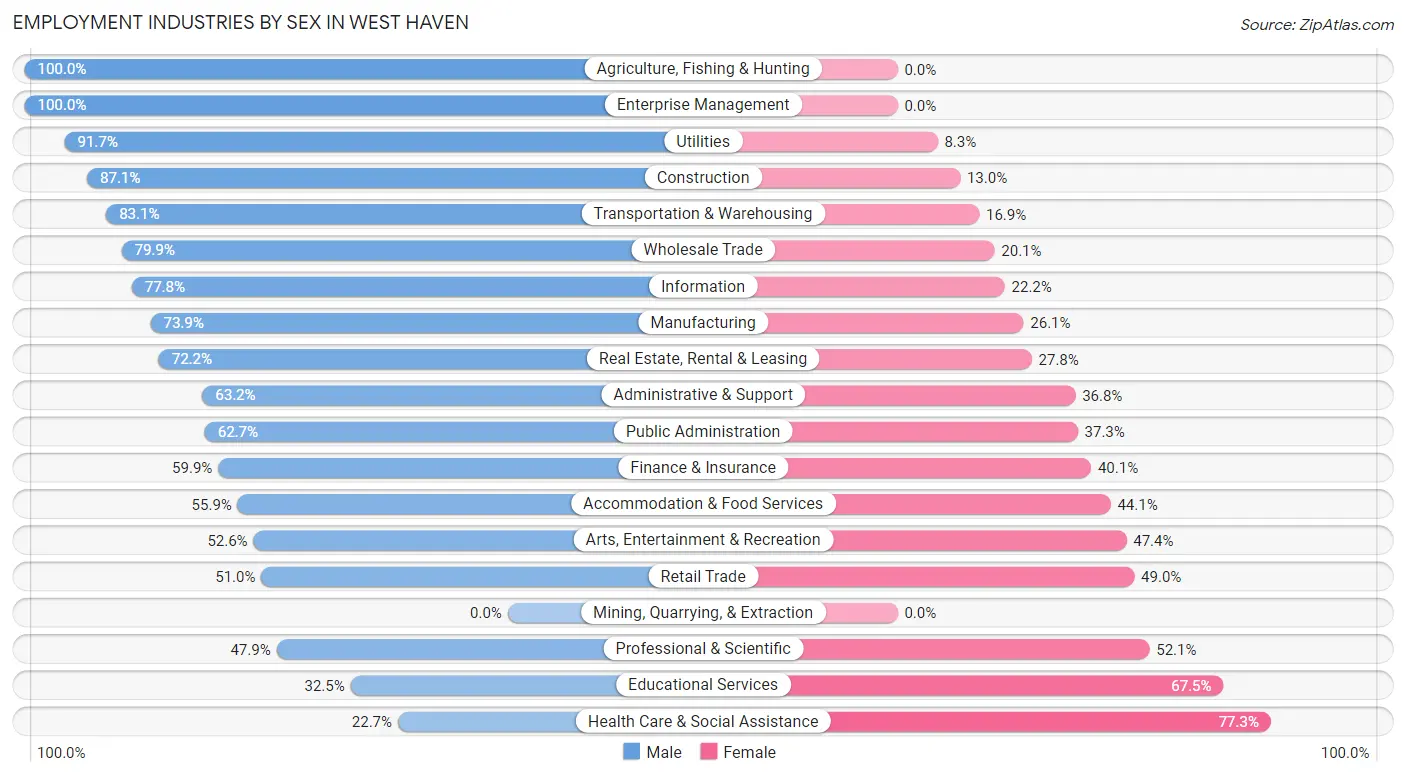
Employment Industries by Sex in West Haven
The West Haven industries that see more men than women are Agriculture, Fishing & Hunting (100.0%), Enterprise Management (100.0%), and Utilities (91.7%), whereas the industries that tend to have a higher number of women are Health Care & Social Assistance (77.3%), Educational Services (67.5%), and Professional & Scientific (52.1%).
| Industry | Male | Female |
| Agriculture, Fishing & Hunting | 21 (100.0%) | 0 (0.0%) |
| Mining, Quarrying, & Extraction | 0 (0.0%) | 0 (0.0%) |
| Construction | 1,432 (87.1%) | 213 (13.0%) |
| Manufacturing | 1,622 (73.9%) | 572 (26.1%) |
| Wholesale Trade | 470 (79.9%) | 118 (20.1%) |
| Retail Trade | 1,527 (51.0%) | 1,467 (49.0%) |
| Transportation & Warehousing | 1,269 (83.1%) | 258 (16.9%) |
| Utilities | 277 (91.7%) | 25 (8.3%) |
| Information | 298 (77.8%) | 85 (22.2%) |
| Finance & Insurance | 570 (59.9%) | 381 (40.1%) |
| Real Estate, Rental & Leasing | 195 (72.2%) | 75 (27.8%) |
| Professional & Scientific | 492 (47.9%) | 536 (52.1%) |
| Enterprise Management | 35 (100.0%) | 0 (0.0%) |
| Administrative & Support | 699 (63.2%) | 407 (36.8%) |
| Educational Services | 972 (32.5%) | 2,015 (67.5%) |
| Health Care & Social Assistance | 1,230 (22.7%) | 4,178 (77.3%) |
| Arts, Entertainment & Recreation | 250 (52.6%) | 225 (47.4%) |
| Accommodation & Food Services | 1,796 (55.9%) | 1,417 (44.1%) |
| Public Administration | 395 (62.7%) | 235 (37.3%) |
| Total | 14,255 (52.4%) | 12,940 (47.6%) |
Education in West Haven
School Enrollment in West Haven
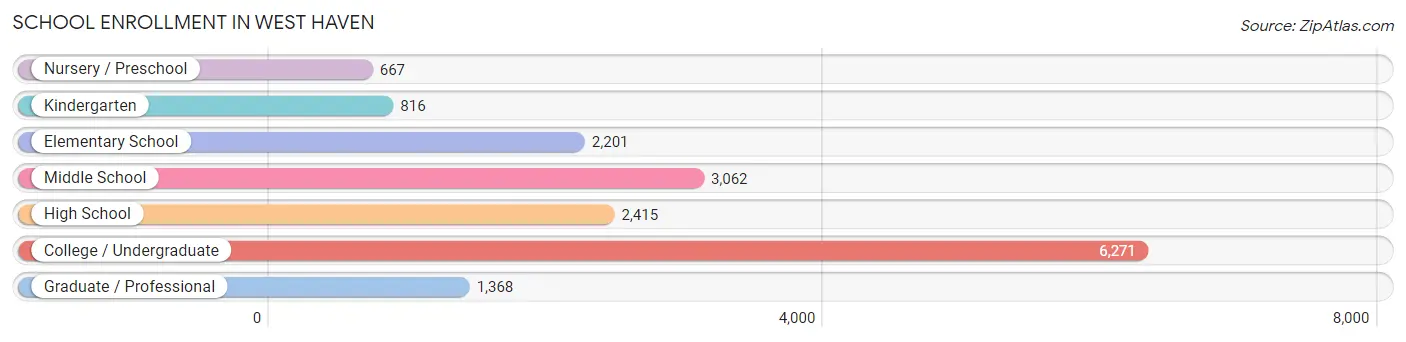
The most common levels of schooling among the 16,800 students in West Haven are college / undergraduate (6,271 | 37.3%), middle school (3,062 | 18.2%), and high school (2,415 | 14.4%).
| School Level | # Students | % Students |
| Nursery / Preschool | 667 | 4.0% |
| Kindergarten | 816 | 4.9% |
| Elementary School | 2,201 | 13.1% |
| Middle School | 3,062 | 18.2% |
| High School | 2,415 | 14.4% |
| College / Undergraduate | 6,271 | 37.3% |
| Graduate / Professional | 1,368 | 8.1% |
| Total | 16,800 | 100.0% |
School Enrollment by Age by Funding Source in West Haven
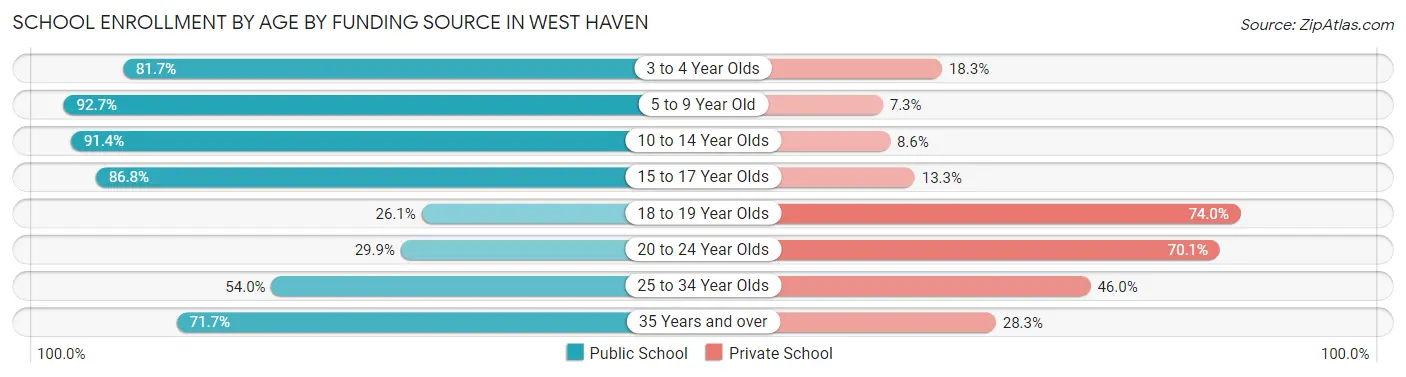
Out of a total of 16,800 students who are enrolled in schools in West Haven, 5,930 (35.3%) attend a private institution, while the remaining 10,870 (64.7%) are enrolled in public schools. The age group of 18 to 19 year olds has the highest likelihood of being enrolled in private schools, with 1,882 (74.0% in the age bracket) enrolled. Conversely, the age group of 5 to 9 year old has the lowest likelihood of being enrolled in a private school, with 2,623 (92.7% in the age bracket) attending a public institution.
| Age Bracket | Public School | Private School |
| 3 to 4 Year Olds | 464 (81.7%) | 104 (18.3%) |
| 5 to 9 Year Old | 2,623 (92.7%) | 206 (7.3%) |
| 10 to 14 Year Olds | 3,415 (91.4%) | 322 (8.6%) |
| 15 to 17 Year Olds | 1,467 (86.8%) | 224 (13.3%) |
| 18 to 19 Year Olds | 663 (26.1%) | 1,882 (74.0%) |
| 20 to 24 Year Olds | 1,080 (29.9%) | 2,527 (70.1%) |
| 25 to 34 Year Olds | 449 (54.0%) | 382 (46.0%) |
| 35 Years and over | 711 (71.7%) | 281 (28.3%) |
| Total | 10,870 (64.7%) | 5,930 (35.3%) |
Educational Attainment by Field of Study in West Haven
Business (2,020 | 19.8%), science & technology (1,269 | 12.5%), arts & humanities (970 | 9.5%), education (860 | 8.5%), and social sciences (797 | 7.8%) are the most common fields of study among 10,181 individuals in West Haven who have obtained a bachelor's degree or higher.
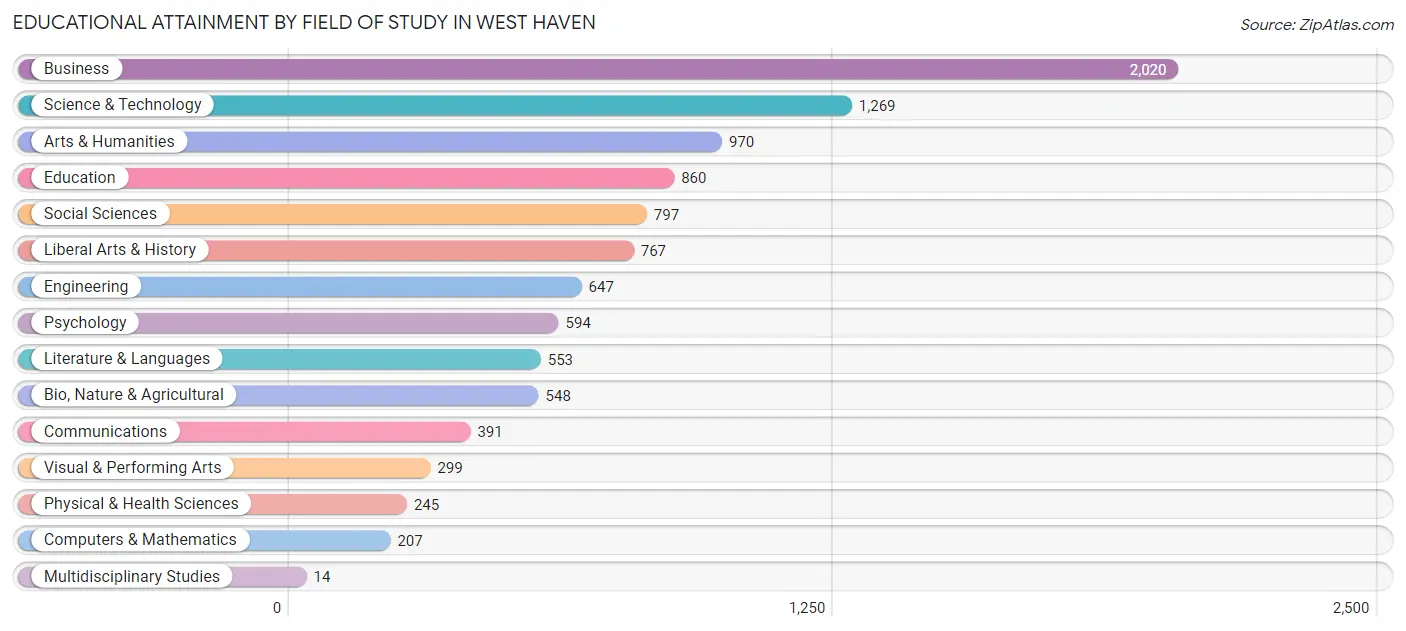
| Field of Study | # Graduates | % Graduates |
| Computers & Mathematics | 207 | 2.0% |
| Bio, Nature & Agricultural | 548 | 5.4% |
| Physical & Health Sciences | 245 | 2.4% |
| Psychology | 594 | 5.8% |
| Social Sciences | 797 | 7.8% |
| Engineering | 647 | 6.4% |
| Multidisciplinary Studies | 14 | 0.1% |
| Science & Technology | 1,269 | 12.5% |
| Business | 2,020 | 19.8% |
| Education | 860 | 8.5% |
| Literature & Languages | 553 | 5.4% |
| Liberal Arts & History | 767 | 7.5% |
| Visual & Performing Arts | 299 | 2.9% |
| Communications | 391 | 3.8% |
| Arts & Humanities | 970 | 9.5% |
| Total | 10,181 | 100.0% |
Transportation & Commute in West Haven
Vehicle Availability by Sex in West Haven
The most prevalent vehicle ownership categories in West Haven are males with 2 vehicles (5,840, accounting for 43.2%) and females with 2 vehicles (4,471, making up 49.4%).
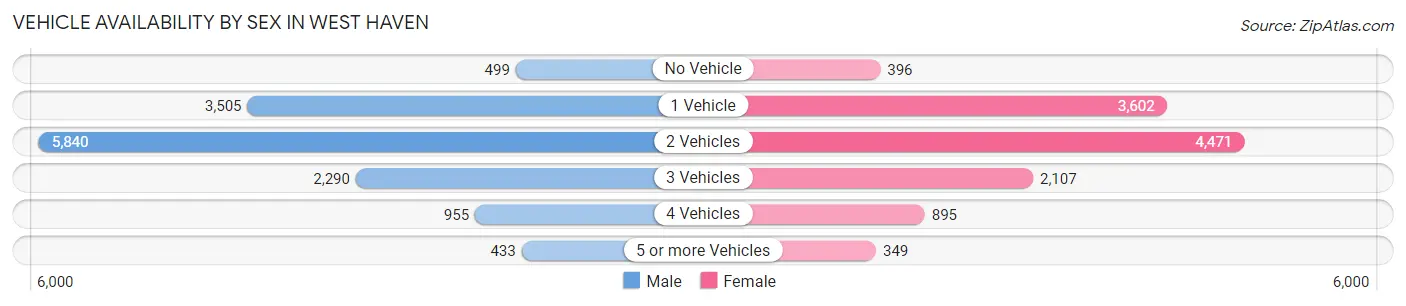
| Vehicles Available | Male | Female |
| No Vehicle | 499 (3.7%) | 396 (3.4%) |
| 1 Vehicle | 3,505 (25.9%) | 3,602 (30.5%) |
| 2 Vehicles | 5,840 (43.2%) | 4,471 (37.8%) |
| 3 Vehicles | 2,290 (16.9%) | 2,107 (17.8%) |
| 4 Vehicles | 955 (7.1%) | 895 (7.6%) |
| 5 or more Vehicles | 433 (3.2%) | 349 (2.9%) |
| Total | 13,522 (100.0%) | 11,820 (100.0%) |
Commute Time in West Haven
The most frequently occuring commute durations in West Haven are 15 to 19 minutes (4,614 commuters, 18.7%), 10 to 14 minutes (4,092 commuters, 16.6%), and 20 to 24 minutes (3,945 commuters, 16.0%).
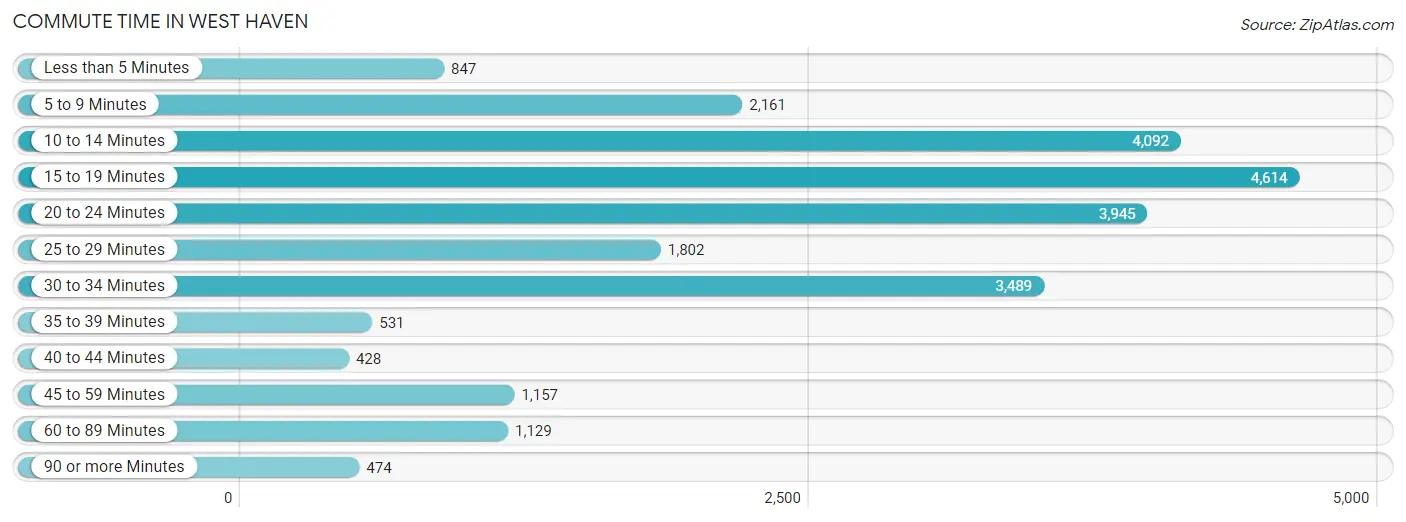
| Commute Time | # Commuters | % Commuters |
| Less than 5 Minutes | 847 | 3.4% |
| 5 to 9 Minutes | 2,161 | 8.8% |
| 10 to 14 Minutes | 4,092 | 16.6% |
| 15 to 19 Minutes | 4,614 | 18.7% |
| 20 to 24 Minutes | 3,945 | 16.0% |
| 25 to 29 Minutes | 1,802 | 7.3% |
| 30 to 34 Minutes | 3,489 | 14.1% |
| 35 to 39 Minutes | 531 | 2.1% |
| 40 to 44 Minutes | 428 | 1.7% |
| 45 to 59 Minutes | 1,157 | 4.7% |
| 60 to 89 Minutes | 1,129 | 4.6% |
| 90 or more Minutes | 474 | 1.9% |
Commute Time by Sex in West Haven
The most common commute times in West Haven are 15 to 19 minutes (2,611 commuters, 19.6%) for males and 20 to 24 minutes (2,027 commuters, 17.8%) for females.
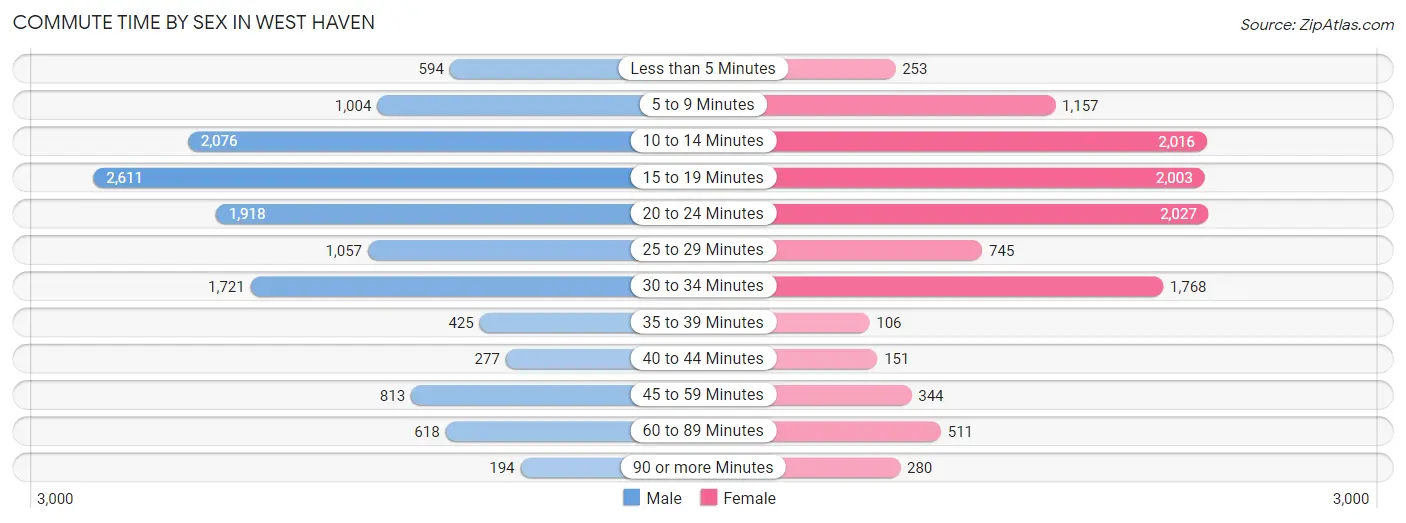
| Commute Time | Male | Female |
| Less than 5 Minutes | 594 (4.5%) | 253 (2.2%) |
| 5 to 9 Minutes | 1,004 (7.5%) | 1,157 (10.2%) |
| 10 to 14 Minutes | 2,076 (15.6%) | 2,016 (17.7%) |
| 15 to 19 Minutes | 2,611 (19.6%) | 2,003 (17.6%) |
| 20 to 24 Minutes | 1,918 (14.4%) | 2,027 (17.8%) |
| 25 to 29 Minutes | 1,057 (7.9%) | 745 (6.6%) |
| 30 to 34 Minutes | 1,721 (12.9%) | 1,768 (15.6%) |
| 35 to 39 Minutes | 425 (3.2%) | 106 (0.9%) |
| 40 to 44 Minutes | 277 (2.1%) | 151 (1.3%) |
| 45 to 59 Minutes | 813 (6.1%) | 344 (3.0%) |
| 60 to 89 Minutes | 618 (4.6%) | 511 (4.5%) |
| 90 or more Minutes | 194 (1.5%) | 280 (2.5%) |
Time of Departure to Work by Sex in West Haven
The most frequent times of departure to work in West Haven are 6:30 AM to 6:59 AM (1,941, 14.6%) for males and 7:30 AM to 7:59 AM (1,917, 16.9%) for females.
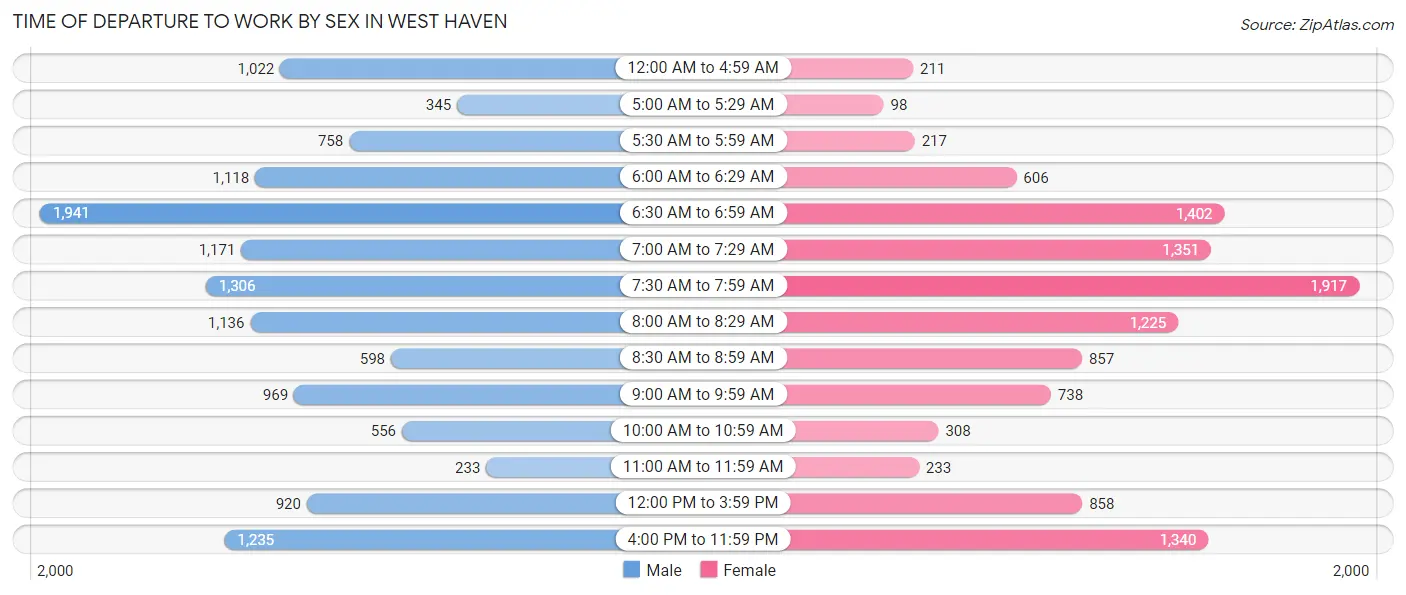
| Time of Departure | Male | Female |
| 12:00 AM to 4:59 AM | 1,022 (7.7%) | 211 (1.9%) |
| 5:00 AM to 5:29 AM | 345 (2.6%) | 98 (0.9%) |
| 5:30 AM to 5:59 AM | 758 (5.7%) | 217 (1.9%) |
| 6:00 AM to 6:29 AM | 1,118 (8.4%) | 606 (5.3%) |
| 6:30 AM to 6:59 AM | 1,941 (14.6%) | 1,402 (12.3%) |
| 7:00 AM to 7:29 AM | 1,171 (8.8%) | 1,351 (11.9%) |
| 7:30 AM to 7:59 AM | 1,306 (9.8%) | 1,917 (16.9%) |
| 8:00 AM to 8:29 AM | 1,136 (8.5%) | 1,225 (10.8%) |
| 8:30 AM to 8:59 AM | 598 (4.5%) | 857 (7.5%) |
| 9:00 AM to 9:59 AM | 969 (7.3%) | 738 (6.5%) |
| 10:00 AM to 10:59 AM | 556 (4.2%) | 308 (2.7%) |
| 11:00 AM to 11:59 AM | 233 (1.8%) | 233 (2.1%) |
| 12:00 PM to 3:59 PM | 920 (6.9%) | 858 (7.5%) |
| 4:00 PM to 11:59 PM | 1,235 (9.3%) | 1,340 (11.8%) |
| Total | 13,308 (100.0%) | 11,361 (100.0%) |
Housing Occupancy in West Haven
Occupancy by Ownership in West Haven
Of the total 20,405 dwellings in West Haven, owner-occupied units account for 10,625 (52.1%), while renter-occupied units make up 9,780 (47.9%).
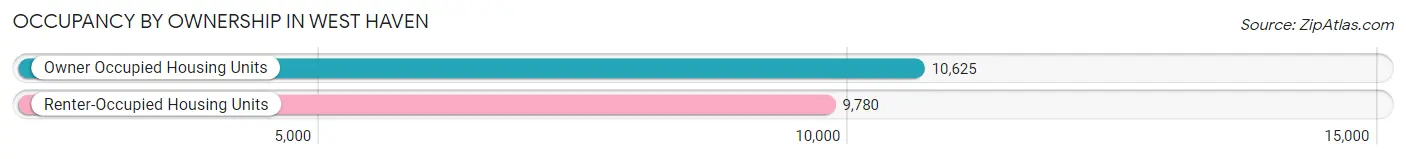
| Occupancy | # Housing Units | % Housing Units |
| Owner Occupied Housing Units | 10,625 | 52.1% |
| Renter-Occupied Housing Units | 9,780 | 47.9% |
| Total Occupied Housing Units | 20,405 | 100.0% |
Occupancy by Household Size in West Haven
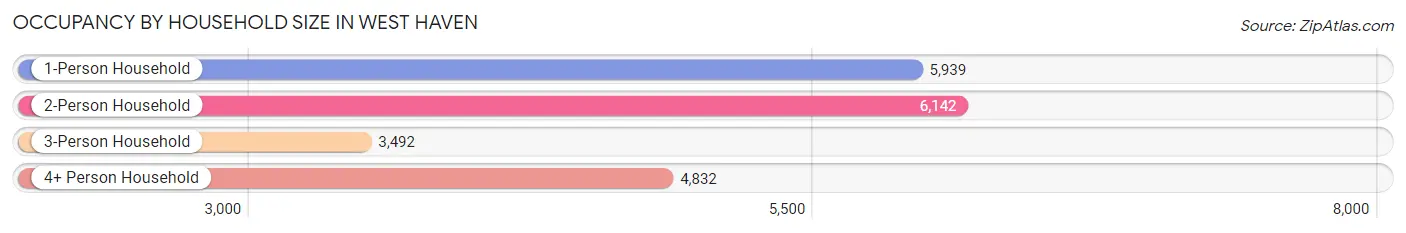
| Household Size | # Housing Units | % Housing Units |
| 1-Person Household | 5,939 | 29.1% |
| 2-Person Household | 6,142 | 30.1% |
| 3-Person Household | 3,492 | 17.1% |
| 4+ Person Household | 4,832 | 23.7% |
| Total Housing Units | 20,405 | 100.0% |
Occupancy by Ownership by Household Size in West Haven
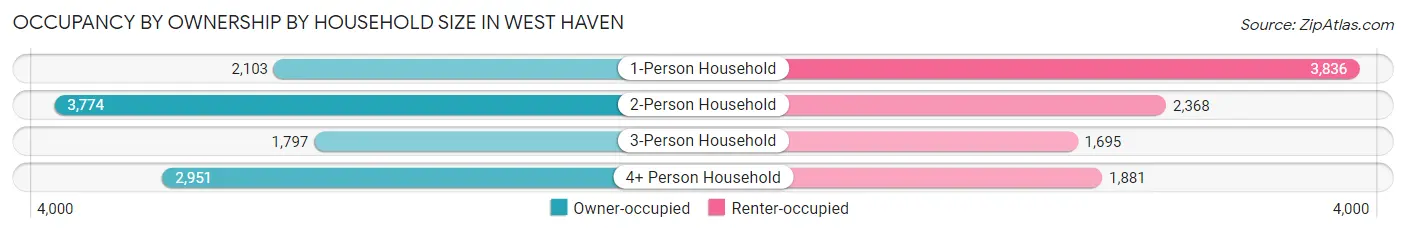
| Household Size | Owner-occupied | Renter-occupied |
| 1-Person Household | 2,103 (35.4%) | 3,836 (64.6%) |
| 2-Person Household | 3,774 (61.5%) | 2,368 (38.6%) |
| 3-Person Household | 1,797 (51.5%) | 1,695 (48.5%) |
| 4+ Person Household | 2,951 (61.1%) | 1,881 (38.9%) |
| Total Housing Units | 10,625 (52.1%) | 9,780 (47.9%) |
Occupancy by Educational Attainment in West Haven
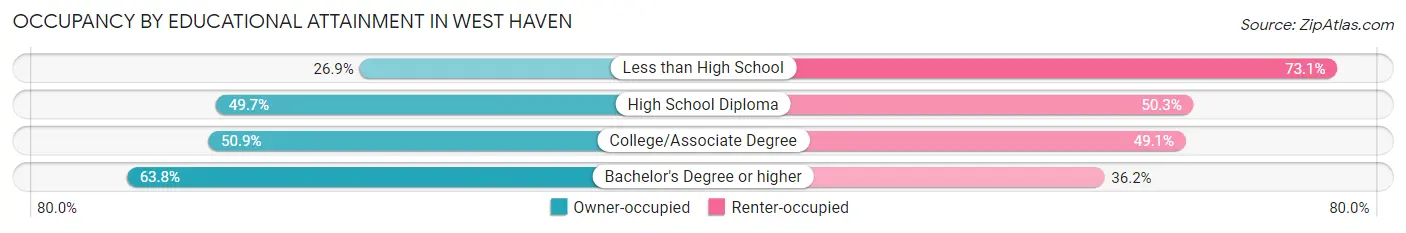
| Household Size | Owner-occupied | Renter-occupied |
| Less than High School | 521 (26.9%) | 1,419 (73.1%) |
| High School Diploma | 3,222 (49.7%) | 3,266 (50.3%) |
| College/Associate Degree | 2,989 (50.9%) | 2,886 (49.1%) |
| Bachelor's Degree or higher | 3,893 (63.8%) | 2,209 (36.2%) |
Occupancy by Age of Householder in West Haven
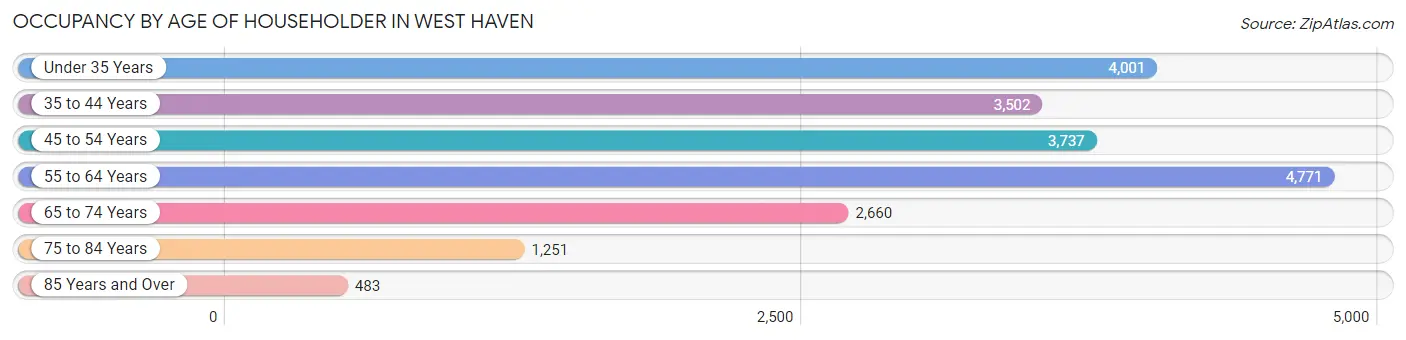
| Age Bracket | # Households | % Households |
| Under 35 Years | 4,001 | 19.6% |
| 35 to 44 Years | 3,502 | 17.2% |
| 45 to 54 Years | 3,737 | 18.3% |
| 55 to 64 Years | 4,771 | 23.4% |
| 65 to 74 Years | 2,660 | 13.0% |
| 75 to 84 Years | 1,251 | 6.1% |
| 85 Years and Over | 483 | 2.4% |
| Total | 20,405 | 100.0% |
Housing Finances in West Haven
Median Income by Occupancy in West Haven
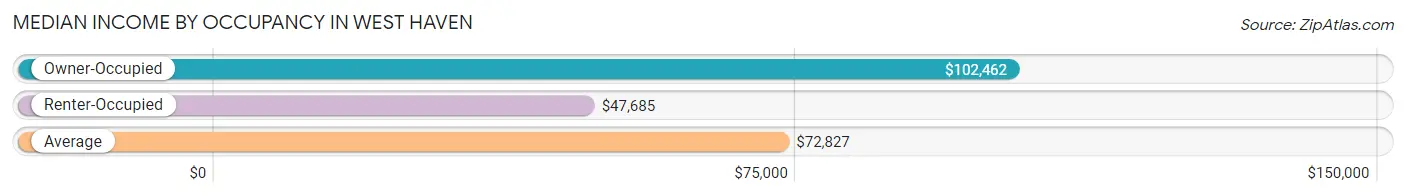
| Occupancy Type | # Households | Median Income |
| Owner-Occupied | 10,625 (52.1%) | $102,462 |
| Renter-Occupied | 9,780 (47.9%) | $47,685 |
| Average | 20,405 (100.0%) | $72,827 |
Occupancy by Householder Income Bracket in West Haven
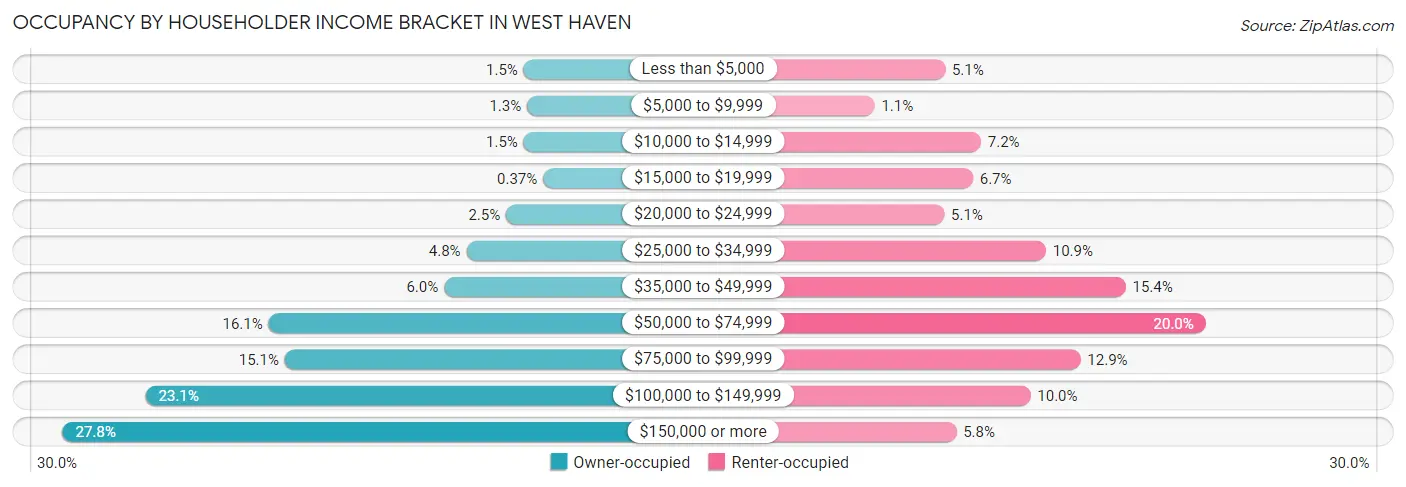
| Income Bracket | Owner-occupied | Renter-occupied |
| Less than $5,000 | 157 (1.5%) | 500 (5.1%) |
| $5,000 to $9,999 | 137 (1.3%) | 106 (1.1%) |
| $10,000 to $14,999 | 157 (1.5%) | 700 (7.2%) |
| $15,000 to $19,999 | 39 (0.4%) | 655 (6.7%) |
| $20,000 to $24,999 | 265 (2.5%) | 495 (5.1%) |
| $25,000 to $34,999 | 505 (4.8%) | 1,063 (10.9%) |
| $35,000 to $49,999 | 641 (6.0%) | 1,509 (15.4%) |
| $50,000 to $74,999 | 1,706 (16.1%) | 1,956 (20.0%) |
| $75,000 to $99,999 | 1,608 (15.1%) | 1,257 (12.9%) |
| $100,000 to $149,999 | 2,453 (23.1%) | 977 (10.0%) |
| $150,000 or more | 2,957 (27.8%) | 562 (5.8%) |
| Total | 10,625 (100.0%) | 9,780 (100.0%) |
Monthly Housing Cost Tiers in West Haven
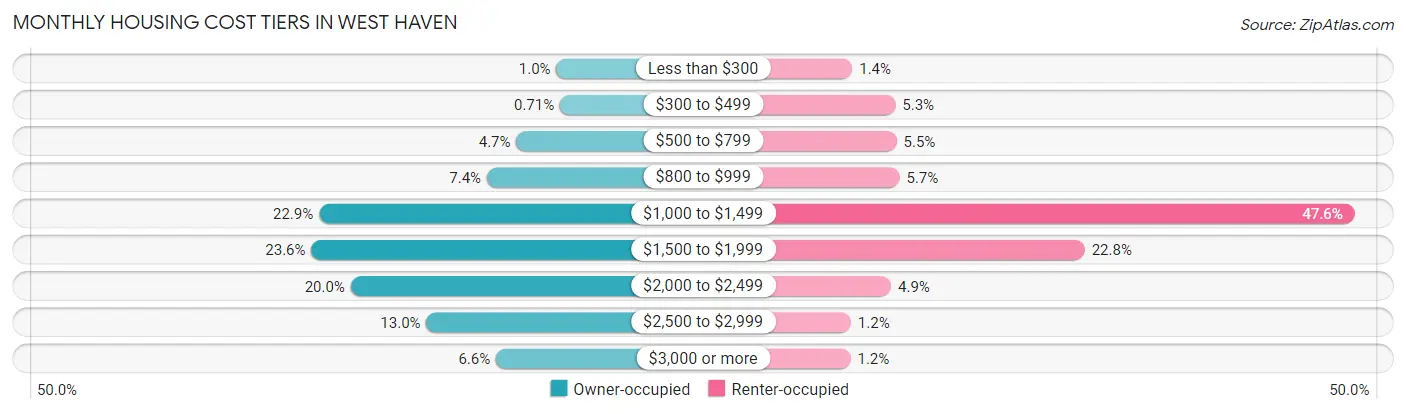
| Monthly Cost | Owner-occupied | Renter-occupied |
| Less than $300 | 111 (1.0%) | 134 (1.4%) |
| $300 to $499 | 75 (0.7%) | 521 (5.3%) |
| $500 to $799 | 503 (4.7%) | 533 (5.4%) |
| $800 to $999 | 791 (7.4%) | 559 (5.7%) |
| $1,000 to $1,499 | 2,432 (22.9%) | 4,656 (47.6%) |
| $1,500 to $1,999 | 2,507 (23.6%) | 2,227 (22.8%) |
| $2,000 to $2,499 | 2,123 (20.0%) | 483 (4.9%) |
| $2,500 to $2,999 | 1,382 (13.0%) | 121 (1.2%) |
| $3,000 or more | 701 (6.6%) | 118 (1.2%) |
| Total | 10,625 (100.0%) | 9,780 (100.0%) |
Physical Housing Characteristics in West Haven
Housing Structures in West Haven
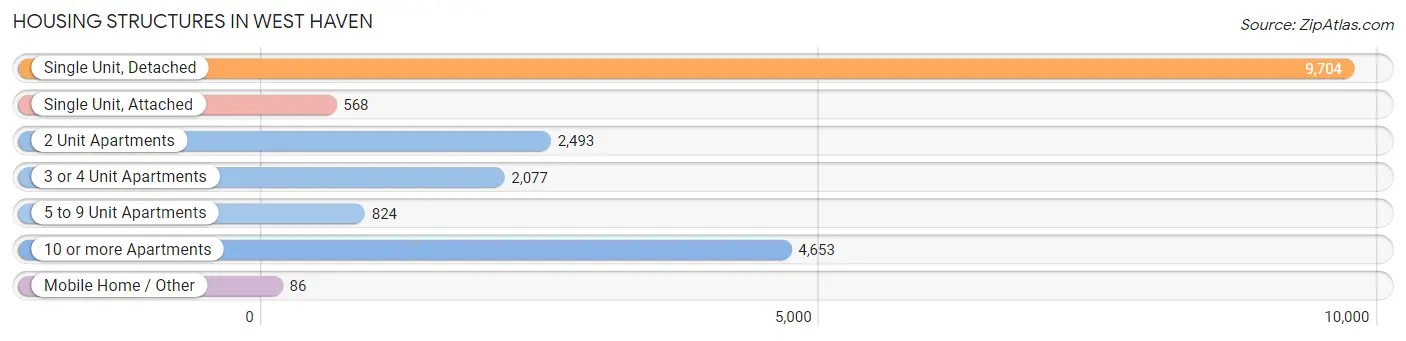
| Structure Type | # Housing Units | % Housing Units |
| Single Unit, Detached | 9,704 | 47.6% |
| Single Unit, Attached | 568 | 2.8% |
| 2 Unit Apartments | 2,493 | 12.2% |
| 3 or 4 Unit Apartments | 2,077 | 10.2% |
| 5 to 9 Unit Apartments | 824 | 4.0% |
| 10 or more Apartments | 4,653 | 22.8% |
| Mobile Home / Other | 86 | 0.4% |
| Total | 20,405 | 100.0% |
Housing Structures by Occupancy in West Haven
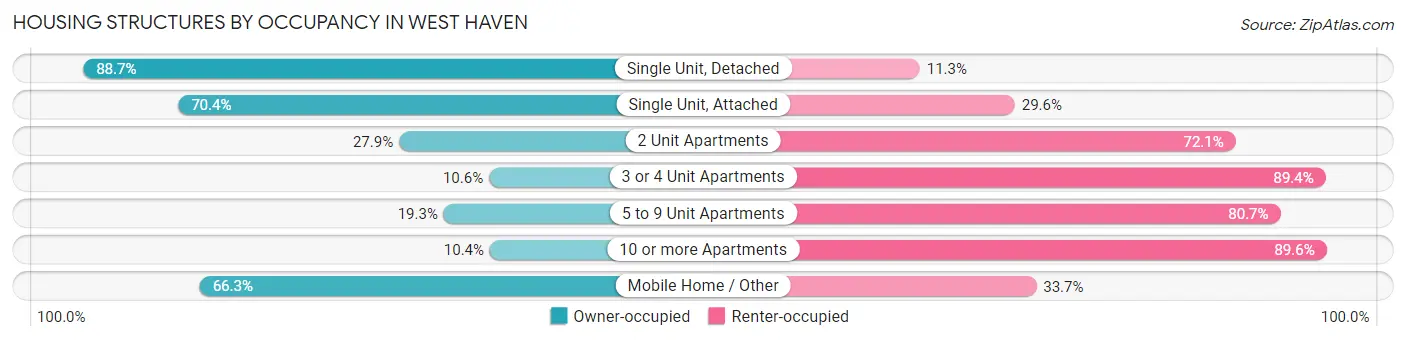
| Structure Type | Owner-occupied | Renter-occupied |
| Single Unit, Detached | 8,608 (88.7%) | 1,096 (11.3%) |
| Single Unit, Attached | 400 (70.4%) | 168 (29.6%) |
| 2 Unit Apartments | 696 (27.9%) | 1,797 (72.1%) |
| 3 or 4 Unit Apartments | 220 (10.6%) | 1,857 (89.4%) |
| 5 to 9 Unit Apartments | 159 (19.3%) | 665 (80.7%) |
| 10 or more Apartments | 485 (10.4%) | 4,168 (89.6%) |
| Mobile Home / Other | 57 (66.3%) | 29 (33.7%) |
| Total | 10,625 (52.1%) | 9,780 (47.9%) |
Housing Structures by Number of Rooms in West Haven
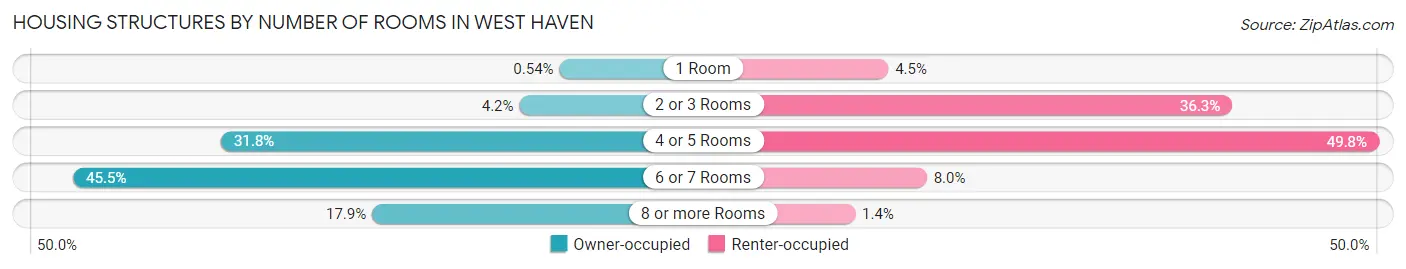
| Number of Rooms | Owner-occupied | Renter-occupied |
| 1 Room | 57 (0.5%) | 437 (4.5%) |
| 2 or 3 Rooms | 450 (4.2%) | 3,547 (36.3%) |
| 4 or 5 Rooms | 3,383 (31.8%) | 4,874 (49.8%) |
| 6 or 7 Rooms | 4,836 (45.5%) | 785 (8.0%) |
| 8 or more Rooms | 1,899 (17.9%) | 137 (1.4%) |
| Total | 10,625 (100.0%) | 9,780 (100.0%) |
Housing Structure by Heating Type in West Haven
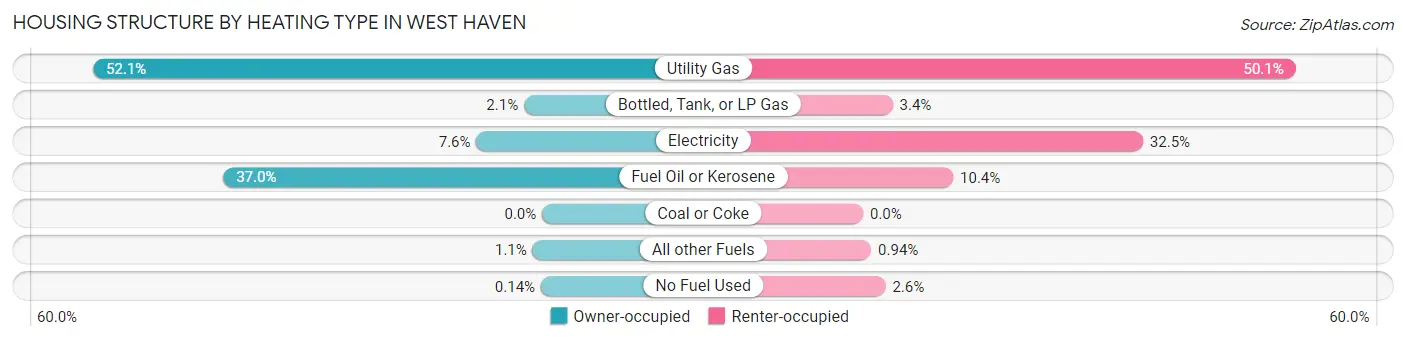
| Heating Type | Owner-occupied | Renter-occupied |
| Utility Gas | 5,532 (52.1%) | 4,904 (50.1%) |
| Bottled, Tank, or LP Gas | 223 (2.1%) | 335 (3.4%) |
| Electricity | 810 (7.6%) | 3,174 (32.5%) |
| Fuel Oil or Kerosene | 3,928 (37.0%) | 1,021 (10.4%) |
| Coal or Coke | 0 (0.0%) | 0 (0.0%) |
| All other Fuels | 117 (1.1%) | 92 (0.9%) |
| No Fuel Used | 15 (0.1%) | 254 (2.6%) |
| Total | 10,625 (100.0%) | 9,780 (100.0%) |
Household Vehicle Usage in West Haven
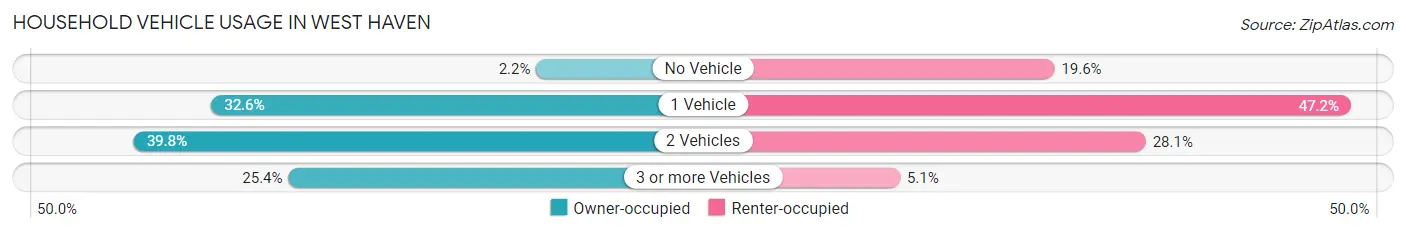
| Vehicles per Household | Owner-occupied | Renter-occupied |
| No Vehicle | 237 (2.2%) | 1,913 (19.6%) |
| 1 Vehicle | 3,461 (32.6%) | 4,618 (47.2%) |
| 2 Vehicles | 4,230 (39.8%) | 2,746 (28.1%) |
| 3 or more Vehicles | 2,697 (25.4%) | 503 (5.1%) |
| Total | 10,625 (100.0%) | 9,780 (100.0%) |
Real Estate & Mortgages in West Haven
Real Estate and Mortgage Overview in West Haven
| Characteristic | Without Mortgage | With Mortgage |
| Housing Units | 3,301 | 7,324 |
| Median Property Value | $236,500 | $252,000 |
| Median Household Income | $74,873 | $2,292 |
| Monthly Housing Costs | $1,073 | $701 |
| Real Estate Taxes | $6,556 | $51 |
Property Value by Mortgage Status in West Haven
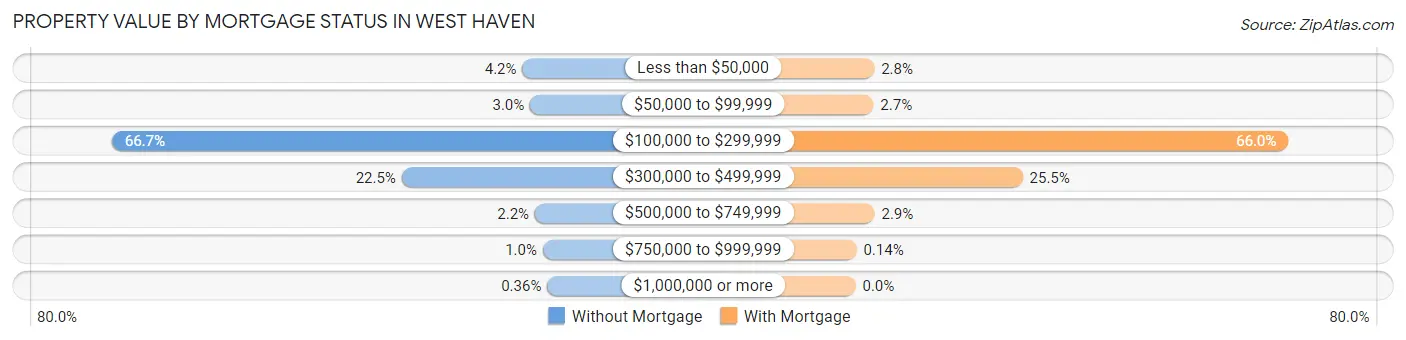
| Property Value | Without Mortgage | With Mortgage |
| Less than $50,000 | 137 (4.2%) | 208 (2.8%) |
| $50,000 to $99,999 | 98 (3.0%) | 199 (2.7%) |
| $100,000 to $299,999 | 2,202 (66.7%) | 4,830 (65.9%) |
| $300,000 to $499,999 | 744 (22.5%) | 1,865 (25.5%) |
| $500,000 to $749,999 | 74 (2.2%) | 212 (2.9%) |
| $750,000 to $999,999 | 34 (1.0%) | 10 (0.1%) |
| $1,000,000 or more | 12 (0.4%) | 0 (0.0%) |
| Total | 3,301 (100.0%) | 7,324 (100.0%) |
Household Income by Mortgage Status in West Haven
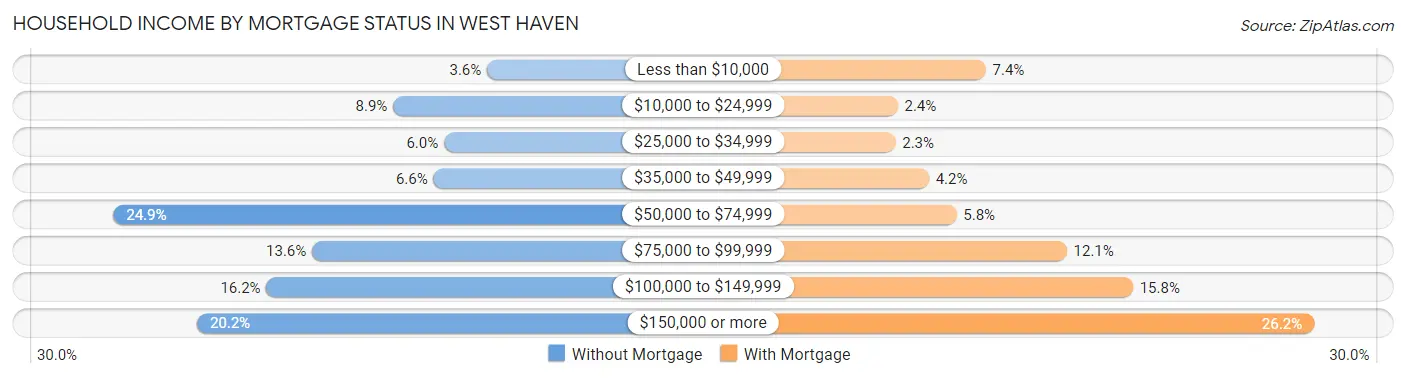
| Household Income | Without Mortgage | With Mortgage |
| Less than $10,000 | 118 (3.6%) | 544 (7.4%) |
| $10,000 to $24,999 | 295 (8.9%) | 176 (2.4%) |
| $25,000 to $34,999 | 199 (6.0%) | 166 (2.3%) |
| $35,000 to $49,999 | 219 (6.6%) | 306 (4.2%) |
| $50,000 to $74,999 | 823 (24.9%) | 422 (5.8%) |
| $75,000 to $99,999 | 448 (13.6%) | 883 (12.1%) |
| $100,000 to $149,999 | 534 (16.2%) | 1,160 (15.8%) |
| $150,000 or more | 665 (20.2%) | 1,919 (26.2%) |
| Total | 3,301 (100.0%) | 7,324 (100.0%) |
Property Value to Household Income Ratio in West Haven
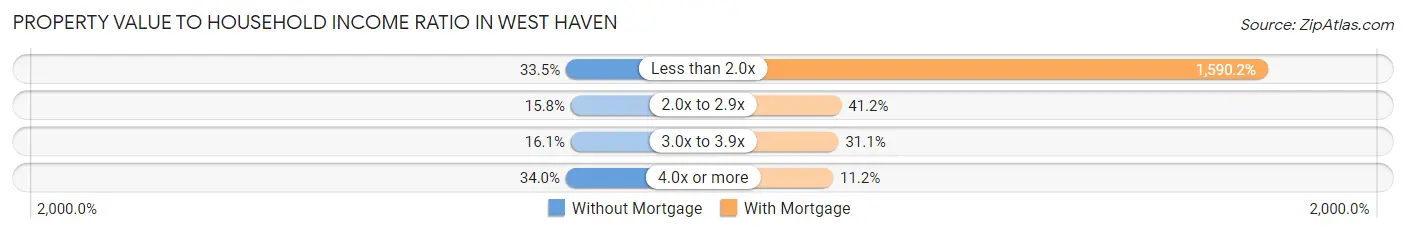
| Value-to-Income Ratio | Without Mortgage | With Mortgage |
| Less than 2.0x | 1,106 (33.5%) | 116,469 (1,590.2%) |
| 2.0x to 2.9x | 520 (15.8%) | 3,014 (41.1%) |
| 3.0x to 3.9x | 532 (16.1%) | 2,274 (31.0%) |
| 4.0x or more | 1,121 (34.0%) | 823 (11.2%) |
| Total | 3,301 (100.0%) | 7,324 (100.0%) |
Real Estate Taxes by Mortgage Status in West Haven
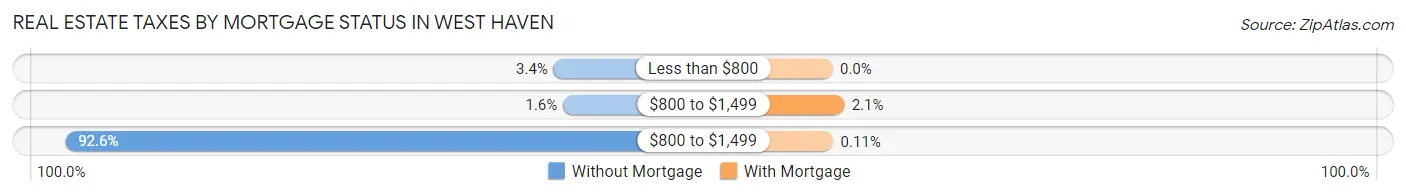
| Property Taxes | Without Mortgage | With Mortgage |
| Less than $800 | 111 (3.4%) | 0 (0.0%) |
| $800 to $1,499 | 54 (1.6%) | 157 (2.1%) |
| $800 to $1,499 | 3,056 (92.6%) | 8 (0.1%) |
| Total | 3,301 (100.0%) | 7,324 (100.0%) |
Health & Disability in West Haven
Health Insurance Coverage by Age in West Haven
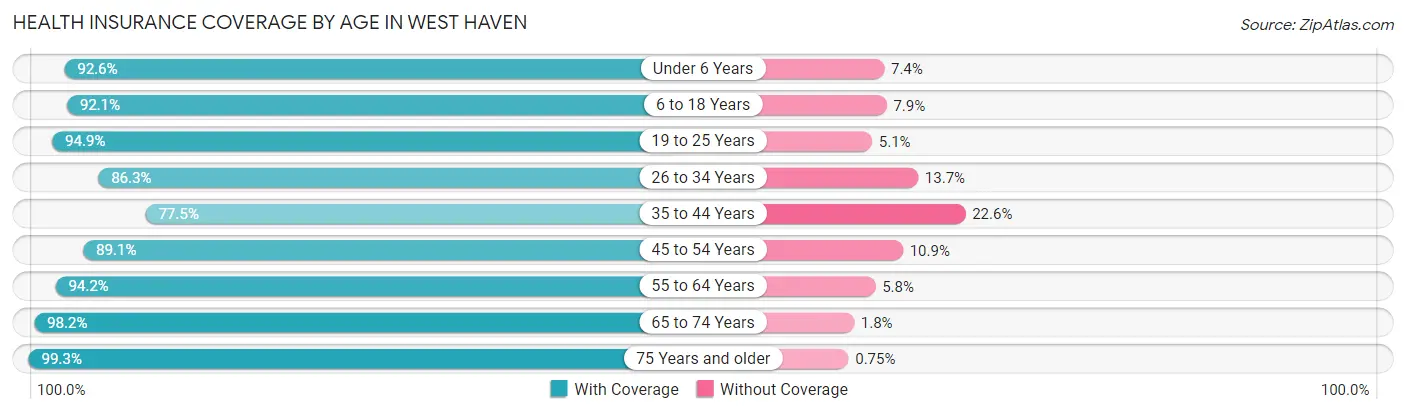
| Age Bracket | With Coverage | Without Coverage |
| Under 6 Years | 3,037 (92.6%) | 243 (7.4%) |
| 6 to 18 Years | 8,588 (92.1%) | 734 (7.9%) |
| 19 to 25 Years | 7,212 (94.9%) | 391 (5.1%) |
| 26 to 34 Years | 5,895 (86.3%) | 938 (13.7%) |
| 35 to 44 Years | 4,979 (77.4%) | 1,450 (22.6%) |
| 45 to 54 Years | 5,952 (89.1%) | 728 (10.9%) |
| 55 to 64 Years | 6,627 (94.2%) | 405 (5.8%) |
| 65 to 74 Years | 5,021 (98.2%) | 91 (1.8%) |
| 75 Years and older | 2,781 (99.3%) | 21 (0.7%) |
| Total | 50,092 (90.9%) | 5,001 (9.1%) |
Health Insurance Coverage by Citizenship Status in West Haven
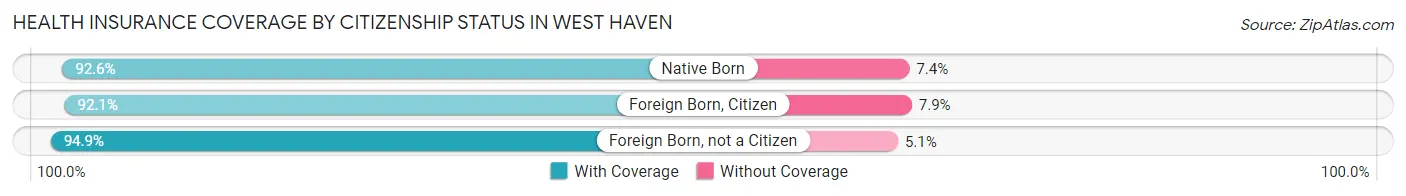
| Citizenship Status | With Coverage | Without Coverage |
| Native Born | 3,037 (92.6%) | 243 (7.4%) |
| Foreign Born, Citizen | 8,588 (92.1%) | 734 (7.9%) |
| Foreign Born, not a Citizen | 7,212 (94.9%) | 391 (5.1%) |
Health Insurance Coverage by Household Income in West Haven
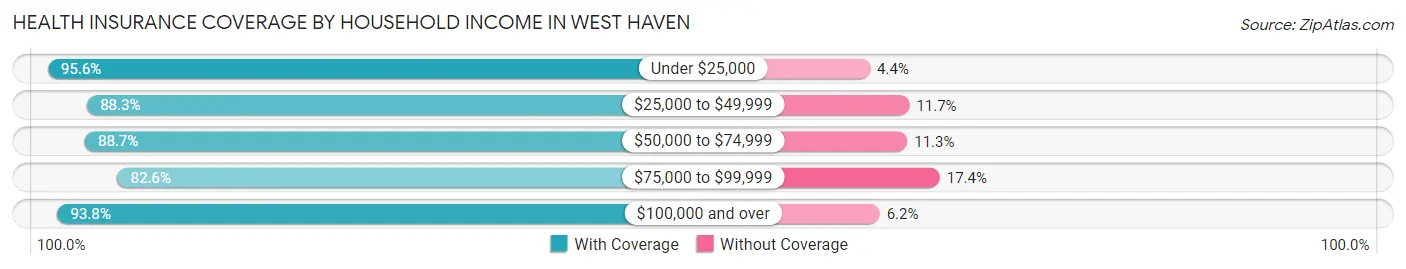
| Household Income | With Coverage | Without Coverage |
| Under $25,000 | 4,792 (95.6%) | 219 (4.4%) |
| $25,000 to $49,999 | 6,899 (88.3%) | 918 (11.7%) |
| $50,000 to $74,999 | 8,297 (88.7%) | 1,061 (11.3%) |
| $75,000 to $99,999 | 6,214 (82.6%) | 1,312 (17.4%) |
| $100,000 and over | 20,470 (93.8%) | 1,347 (6.2%) |
Public vs Private Health Insurance Coverage by Age in West Haven
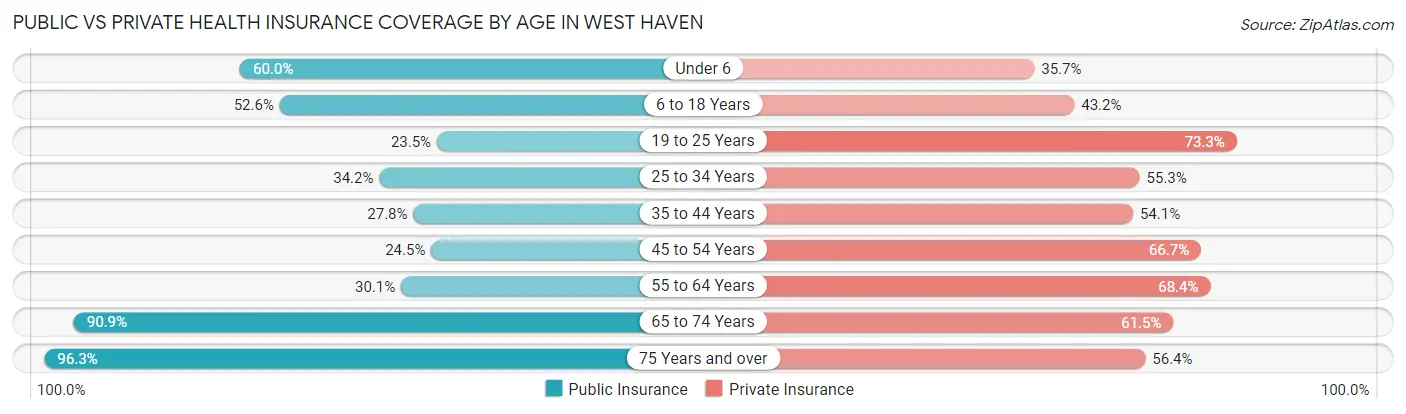
| Age Bracket | Public Insurance | Private Insurance |
| Under 6 | 1,968 (60.0%) | 1,172 (35.7%) |
| 6 to 18 Years | 4,907 (52.6%) | 4,022 (43.1%) |
| 19 to 25 Years | 1,784 (23.5%) | 5,572 (73.3%) |
| 25 to 34 Years | 2,334 (34.2%) | 3,777 (55.3%) |
| 35 to 44 Years | 1,790 (27.8%) | 3,475 (54.0%) |
| 45 to 54 Years | 1,638 (24.5%) | 4,454 (66.7%) |
| 55 to 64 Years | 2,117 (30.1%) | 4,809 (68.4%) |
| 65 to 74 Years | 4,645 (90.9%) | 3,145 (61.5%) |
| 75 Years and over | 2,699 (96.3%) | 1,579 (56.4%) |
| Total | 23,882 (43.3%) | 32,005 (58.1%) |
Disability Status by Sex by Age in West Haven
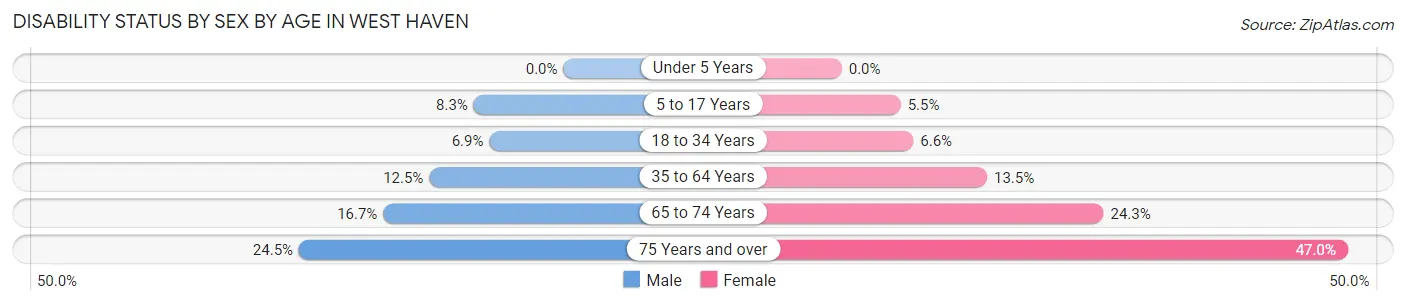
| Age Bracket | Male | Female |
| Under 5 Years | 0 (0.0%) | 0 (0.0%) |
| 5 to 17 Years | 343 (8.3%) | 237 (5.5%) |
| 18 to 34 Years | 576 (6.9%) | 501 (6.6%) |
| 35 to 64 Years | 1,210 (12.4%) | 1,405 (13.5%) |
| 65 to 74 Years | 397 (16.7%) | 665 (24.3%) |
| 75 Years and over | 305 (24.5%) | 732 (46.9%) |
Disability Class by Sex by Age in West Haven
Disability Class: Hearing Difficulty
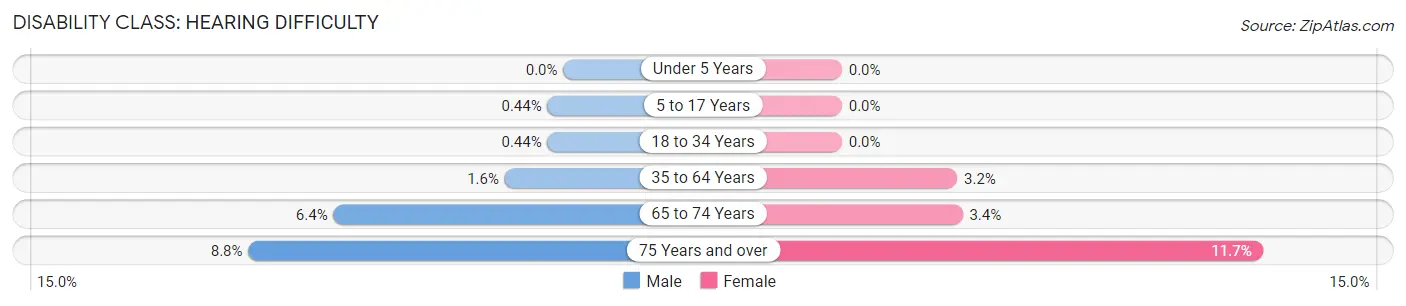
| Age Bracket | Male | Female |
| Under 5 Years | 0 (0.0%) | 0 (0.0%) |
| 5 to 17 Years | 18 (0.4%) | 0 (0.0%) |
| 18 to 34 Years | 37 (0.4%) | 0 (0.0%) |
| 35 to 64 Years | 158 (1.6%) | 335 (3.2%) |
| 65 to 74 Years | 152 (6.4%) | 92 (3.4%) |
| 75 Years and over | 109 (8.8%) | 183 (11.7%) |
Disability Class: Vision Difficulty
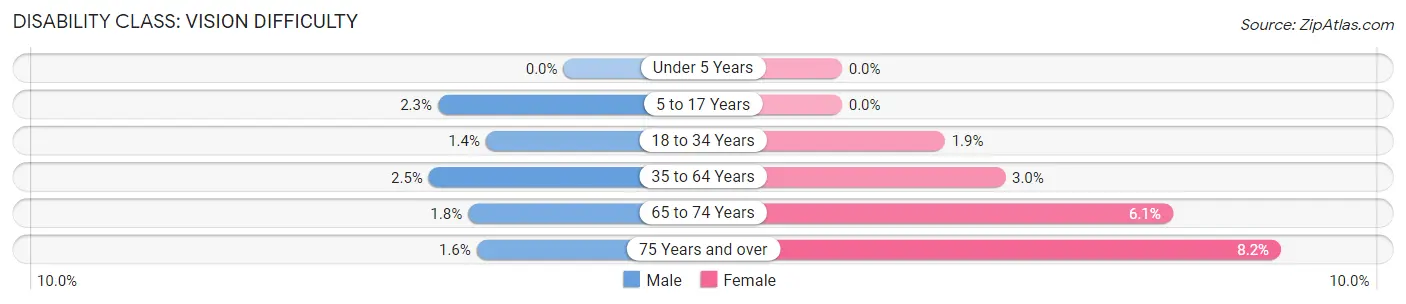
| Age Bracket | Male | Female |
| Under 5 Years | 0 (0.0%) | 0 (0.0%) |
| 5 to 17 Years | 96 (2.3%) | 0 (0.0%) |
| 18 to 34 Years | 121 (1.4%) | 144 (1.9%) |
| 35 to 64 Years | 243 (2.5%) | 316 (3.0%) |
| 65 to 74 Years | 42 (1.8%) | 168 (6.1%) |
| 75 Years and over | 20 (1.6%) | 127 (8.2%) |
Disability Class: Cognitive Difficulty
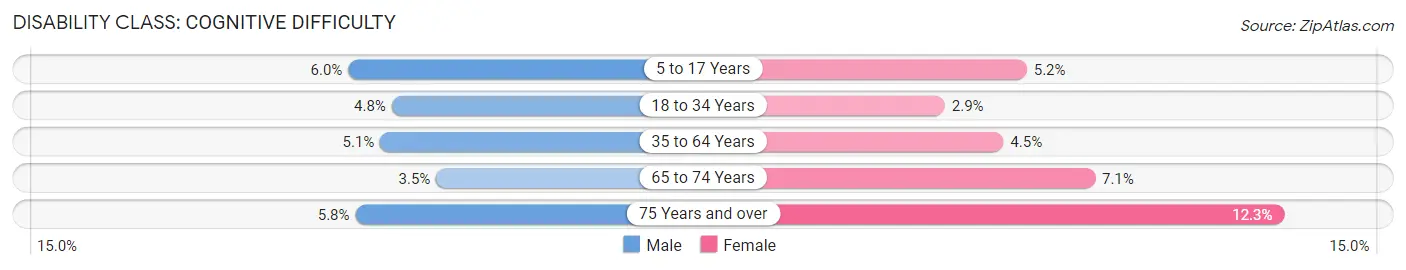
| Age Bracket | Male | Female |
| 5 to 17 Years | 247 (6.0%) | 223 (5.1%) |
| 18 to 34 Years | 401 (4.8%) | 217 (2.9%) |
| 35 to 64 Years | 496 (5.1%) | 469 (4.5%) |
| 65 to 74 Years | 84 (3.5%) | 193 (7.0%) |
| 75 Years and over | 72 (5.8%) | 192 (12.3%) |
Disability Class: Ambulatory Difficulty
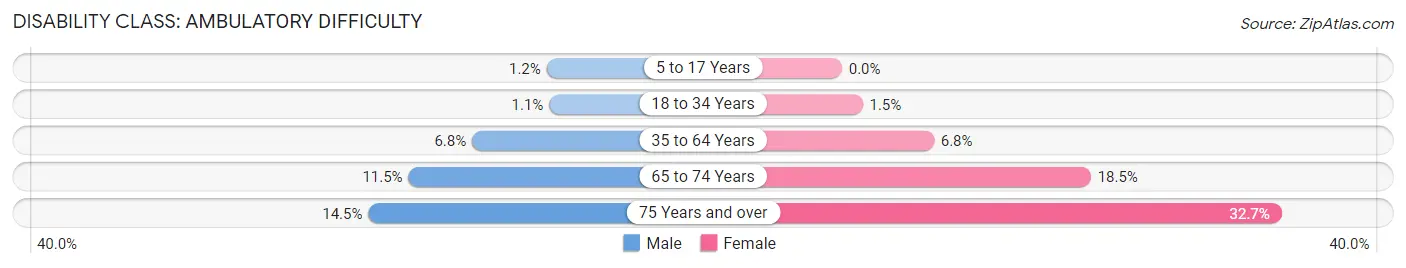
| Age Bracket | Male | Female |
| 5 to 17 Years | 51 (1.2%) | 0 (0.0%) |
| 18 to 34 Years | 88 (1.1%) | 116 (1.5%) |
| 35 to 64 Years | 659 (6.8%) | 712 (6.8%) |
| 65 to 74 Years | 273 (11.5%) | 506 (18.5%) |
| 75 Years and over | 180 (14.5%) | 509 (32.7%) |
Disability Class: Self-Care Difficulty
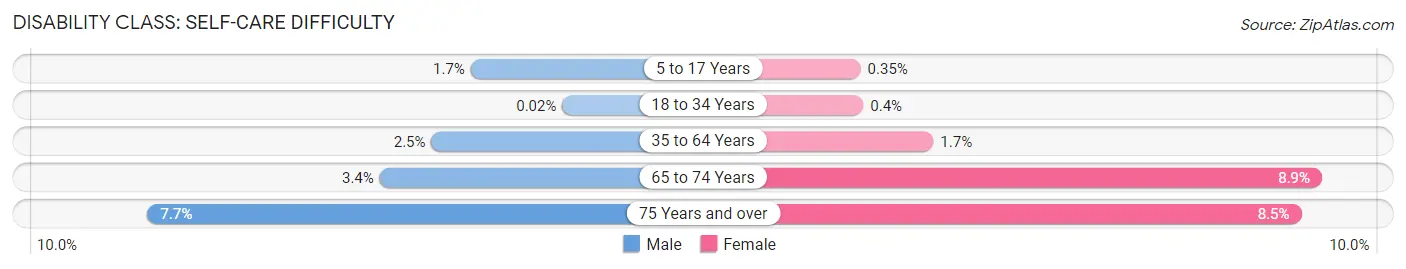
| Age Bracket | Male | Female |
| 5 to 17 Years | 71 (1.7%) | 15 (0.4%) |
| 18 to 34 Years | 2 (0.0%) | 30 (0.4%) |
| 35 to 64 Years | 238 (2.5%) | 177 (1.7%) |
| 65 to 74 Years | 81 (3.4%) | 244 (8.9%) |
| 75 Years and over | 96 (7.7%) | 133 (8.5%) |
Technology Access in West Haven
Computing Device Access in West Haven
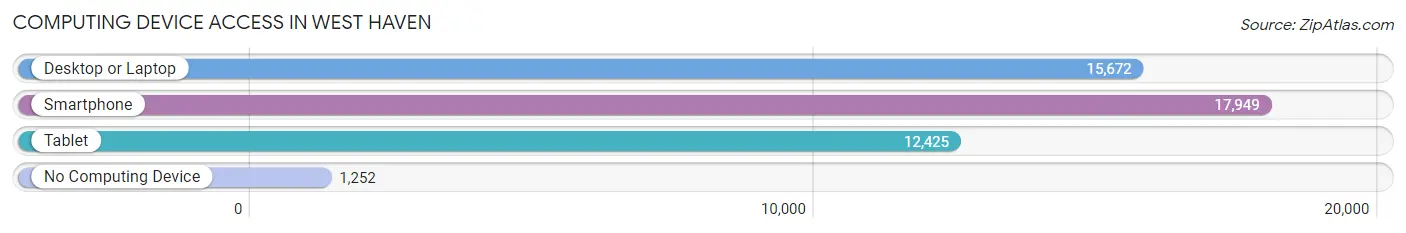
| Device Type | # Households | % Households |
| Desktop or Laptop | 15,672 | 76.8% |
| Smartphone | 17,949 | 88.0% |
| Tablet | 12,425 | 60.9% |
| No Computing Device | 1,252 | 6.1% |
| Total | 20,405 | 100.0% |
Internet Access in West Haven
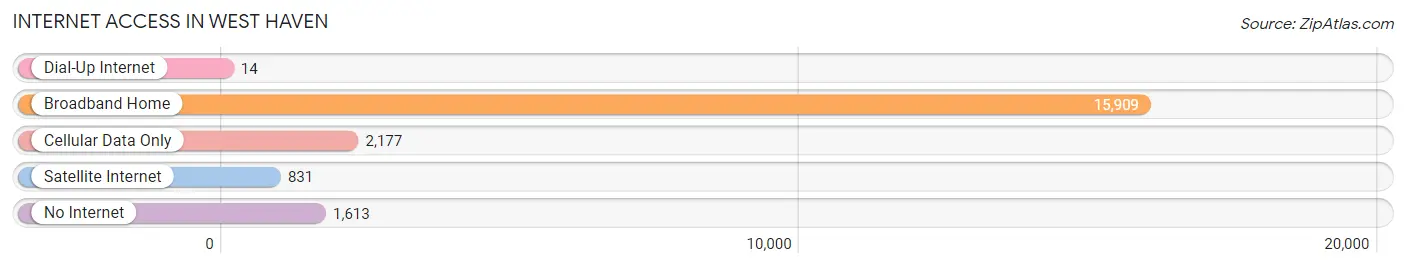
| Internet Type | # Households | % Households |
| Dial-Up Internet | 14 | 0.1% |
| Broadband Home | 15,909 | 78.0% |
| Cellular Data Only | 2,177 | 10.7% |
| Satellite Internet | 831 | 4.1% |
| No Internet | 1,613 | 7.9% |
| Total | 20,405 | 100.0% |
West Haven Summary
History
West Haven, Connecticut is a city located in New Haven County, Connecticut. It is situated on the Long Island Sound, and is part of the Greater New Haven area. The city was first settled in 1648 by English Puritans, and was originally known as West Farms. The city was incorporated in 1921, and has since grown to a population of over 55,000 people.
West Haven has a long and rich history, and has been home to many notable figures throughout its history. The city was the birthplace of the first governor of Connecticut, John Winthrop, and was also the home of the first African-American mayor of a major city in the United States, William L. Clay. West Haven has also been home to many famous athletes, including baseball Hall of Famer Lou Gehrig, and NFL Hall of Famer Tom Brady.
Geography
West Haven is located in New Haven County, Connecticut, and is situated on the Long Island Sound. The city is bordered by the cities of New Haven and Milford, and is located approximately 10 miles from the city of Hartford. The city covers an area of approximately 11.5 square miles, and has a population density of 4,845 people per square mile.
The city is divided into several distinct neighborhoods, including Allingtown, West Shore, and Westville. The city is also home to several parks and recreational areas, including Sandy Point Beach, West Haven Green, and the West Haven Historical Society.
Economy
West Haven has a diverse economy, with a variety of industries represented in the city. The city is home to several large employers, including the University of New Haven, Yale-New Haven Hospital, and the West Haven VA Medical Center. The city is also home to several smaller businesses, including restaurants, retail stores, and professional services.
The city has a median household income of $60,845, and a poverty rate of 11.3%. The city has a strong job market, with an unemployment rate of 4.2%. The city is also home to several major employers, including the University of New Haven, Yale-New Haven Hospital, and the West Haven VA Medical Center.
Demographics
West Haven has a population of over 55,000 people, and is home to a diverse population. The city has a median age of 38.7 years, and a gender ratio of 49.7% male and 50.3% female. The city is also home to a variety of ethnic and racial groups, including White (63.2%), Hispanic or Latino (19.2%), African American (13.2%), and Asian (3.3%).
The city has a median household income of $60,845, and a poverty rate of 11.3%. The city has a strong job market, with an unemployment rate of 4.2%. The city is also home to several major employers, including the University of New Haven, Yale-New Haven Hospital, and the West Haven VA Medical Center.
Common Questions
What is Per Capita Income in West Haven?
Per Capita income in West Haven is $34,740.
What is the Median Family Income in West Haven?
Median Family Income in West Haven is $91,047.
What is the Median Household income in West Haven?
Median Household Income in West Haven is $72,827.
What is Income or Wage Gap in West Haven?
Income or Wage Gap in West Haven is 27.2%.
Women in West Haven earn 72.8 cents for every dollar earned by a man.
What is Family Income Deficit in West Haven?
Family Income Deficit in West Haven is $8,700.
Families that are below poverty line in West Haven earn $8,700 less on average than the poverty threshold level.
What is Inequality or Gini Index in West Haven?
Inequality or Gini Index in West Haven is 0.44.
What is the Total Population of West Haven?
Total Population of West Haven is 55,336.
What is the Total Male Population of West Haven?
Total Male Population of West Haven is 27,144.
What is the Total Female Population of West Haven?
Total Female Population of West Haven is 28,192.
What is the Ratio of Males per 100 Females in West Haven?
There are 96.28 Males per 100 Females in West Haven.
What is the Ratio of Females per 100 Males in West Haven?
There are 103.86 Females per 100 Males in West Haven.
What is the Median Population Age in West Haven?
Median Population Age in West Haven is 36.1 Years.
What is the Average Family Size in West Haven
Average Family Size in West Haven is 3.1 People.
What is the Average Household Size in West Haven
Average Household Size in West Haven is 2.5 People.
How Large is the Labor Force in West Haven?
There are 29,537 People in the Labor Forcein in West Haven.
What is the Percentage of People in the Labor Force in West Haven?
65.1% of People are in the Labor Force in West Haven.
What is the Unemployment Rate in West Haven?
Unemployment Rate in West Haven is 7.9%.