Clarksville, TN Map & Demographics
Clarksville Map
Clarksville Overview
$29,481
PER CAPITA INCOME
$73,333
AVG FAMILY INCOME
$62,688
AVG HOUSEHOLD INCOME
36.1%
WAGE / INCOME GAP [ % ]
63.9¢/ $1
WAGE / INCOME GAP [ $ ]
$11,968
FAMILY INCOME DEFICIT
0.39
INEQUALITY / GINI INDEX
167,882
TOTAL POPULATION
84,724
MALE POPULATION
83,158
FEMALE POPULATION
101.88
MALES / 100 FEMALES
98.15
FEMALES / 100 MALES
30.1
MEDIAN AGE
3.2
AVG FAMILY SIZE
2.6
AVG HOUSEHOLD SIZE
85,567
LABOR FORCE [ PEOPLE ]
67.4%
PERCENT IN LABOR FORCE
6.5%
UNEMPLOYMENT RATE
Income in Clarksville
Income Overview in Clarksville
Per Capita Income in Clarksville is $29,481, while median incomes of families and households are $73,333 and $62,688 respectively.
| Characteristic | Number | Measure |
| Per Capita Income | 167,882 | $29,481 |
| Median Family Income | 42,040 | $73,333 |
| Mean Family Income | 42,040 | $85,269 |
| Median Household Income | 62,115 | $62,688 |
| Mean Household Income | 62,115 | $75,723 |
| Income Deficit | 42,040 | $11,968 |
| Wage / Income Gap (%) | 167,882 | 36.07% |
| Wage / Income Gap ($) | 167,882 | 63.93¢ per $1 |
| Gini / Inequality Index | 167,882 | 0.39 |
Earnings by Sex in Clarksville
Average Earnings in Clarksville are $36,819, $44,833 for men and $28,662 for women, a difference of 36.1%.
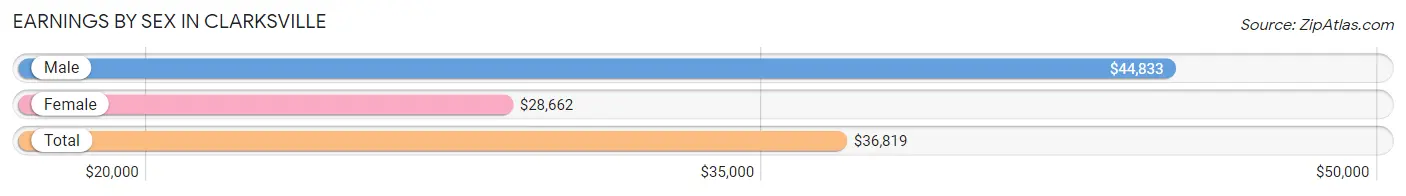
| Sex | Number | Average Earnings |
| Male | 47,500 (53.5%) | $44,833 |
| Female | 41,238 (46.5%) | $28,662 |
| Total | 88,738 (100.0%) | $36,819 |
Earnings by Sex by Income Bracket in Clarksville
The most common earnings brackets in Clarksville are $55,000 to $64,999 for men (4,377 | 9.2%) and $25,000 to $29,999 for women (4,010 | 9.7%).
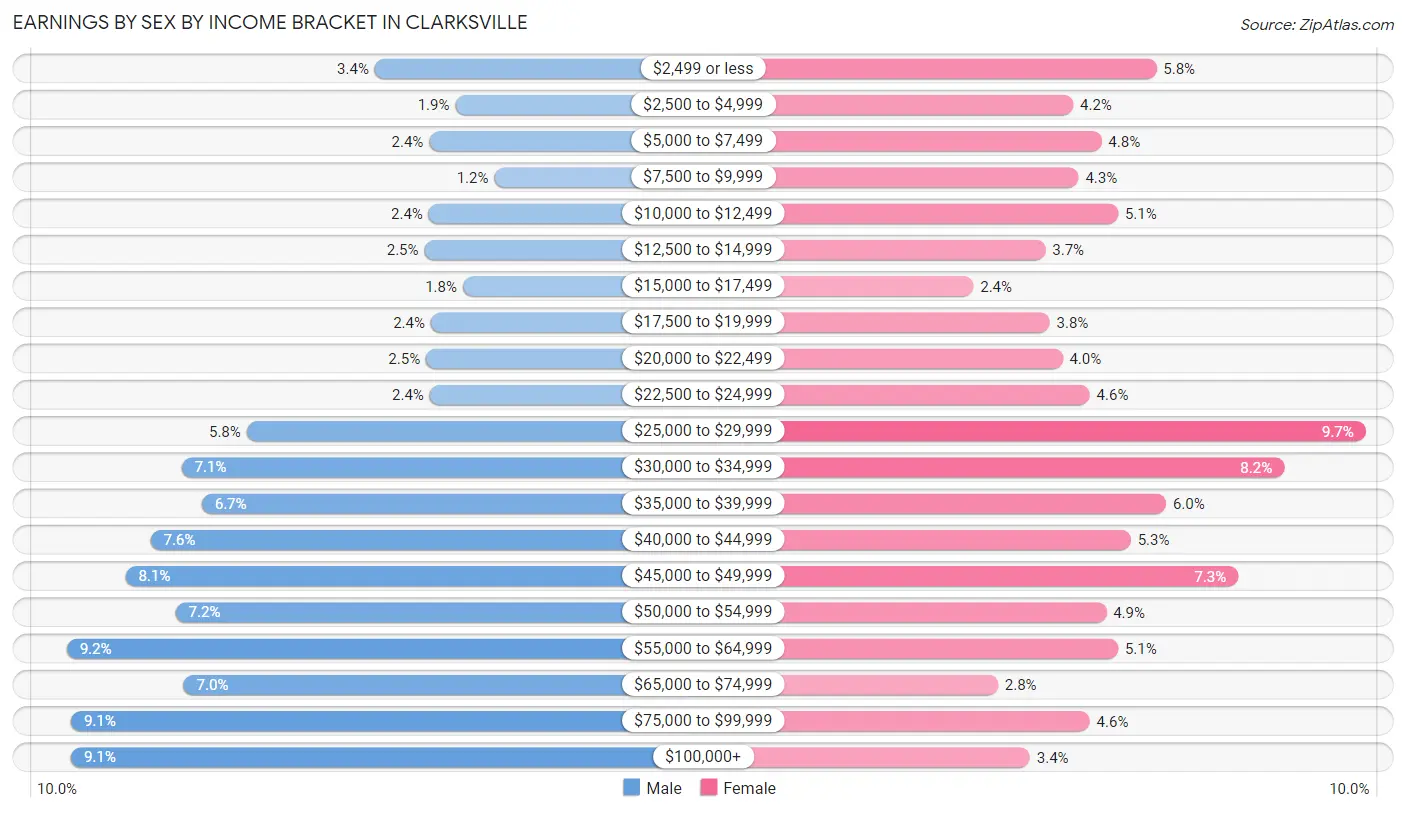
| Income | Male | Female |
| $2,499 or less | 1,636 (3.4%) | 2,390 (5.8%) |
| $2,500 to $4,999 | 918 (1.9%) | 1,748 (4.2%) |
| $5,000 to $7,499 | 1,150 (2.4%) | 1,967 (4.8%) |
| $7,500 to $9,999 | 571 (1.2%) | 1,788 (4.3%) |
| $10,000 to $12,499 | 1,155 (2.4%) | 2,095 (5.1%) |
| $12,500 to $14,999 | 1,190 (2.5%) | 1,533 (3.7%) |
| $15,000 to $17,499 | 851 (1.8%) | 978 (2.4%) |
| $17,500 to $19,999 | 1,133 (2.4%) | 1,566 (3.8%) |
| $20,000 to $22,499 | 1,180 (2.5%) | 1,667 (4.0%) |
| $22,500 to $24,999 | 1,147 (2.4%) | 1,876 (4.5%) |
| $25,000 to $29,999 | 2,774 (5.8%) | 4,010 (9.7%) |
| $30,000 to $34,999 | 3,354 (7.1%) | 3,379 (8.2%) |
| $35,000 to $39,999 | 3,173 (6.7%) | 2,467 (6.0%) |
| $40,000 to $44,999 | 3,631 (7.6%) | 2,195 (5.3%) |
| $45,000 to $49,999 | 3,852 (8.1%) | 3,023 (7.3%) |
| $50,000 to $54,999 | 3,404 (7.2%) | 2,005 (4.9%) |
| $55,000 to $64,999 | 4,377 (9.2%) | 2,094 (5.1%) |
| $65,000 to $74,999 | 3,333 (7.0%) | 1,166 (2.8%) |
| $75,000 to $99,999 | 4,335 (9.1%) | 1,875 (4.5%) |
| $100,000+ | 4,336 (9.1%) | 1,416 (3.4%) |
| Total | 47,500 (100.0%) | 41,238 (100.0%) |
Earnings by Sex by Educational Attainment in Clarksville
Average earnings in Clarksville are $49,160 for men and $33,707 for women, a difference of 31.4%. Men with an educational attainment of graduate degree enjoy the highest average annual earnings of $79,892, while those with less than high school education earn the least with $34,700. Women with an educational attainment of graduate degree earn the most with the average annual earnings of $50,100, while those with less than high school education have the smallest earnings of $19,208.
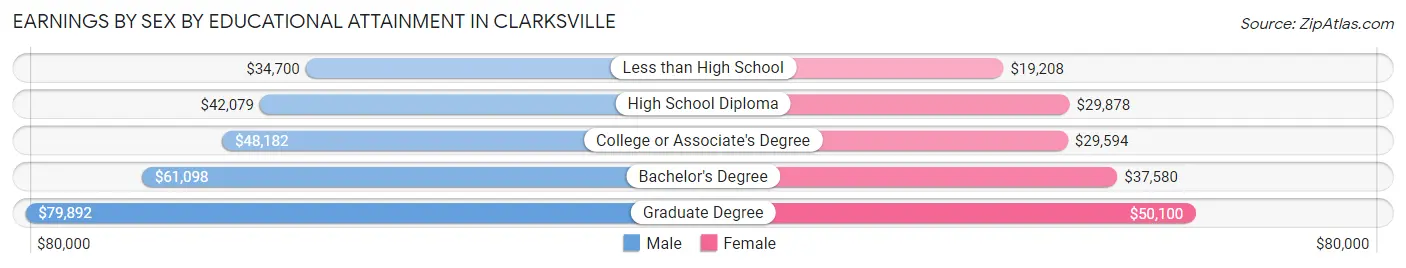
| Educational Attainment | Male Income | Female Income |
| Less than High School | $34,700 | $19,208 |
| High School Diploma | $42,079 | $29,878 |
| College or Associate's Degree | $48,182 | $29,594 |
| Bachelor's Degree | $61,098 | $37,580 |
| Graduate Degree | $79,892 | $50,100 |
| Total | $49,160 | $33,707 |
Family Income in Clarksville
Family Income Brackets in Clarksville
According to the Clarksville family income data, there are 8,660 families falling into the $100,000 to $149,999 income range, which is the most common income bracket and makes up 20.6% of all families. Conversely, the $10,000 to $14,999 income bracket is the least frequent group with only 673 families (1.6%) belonging to this category.
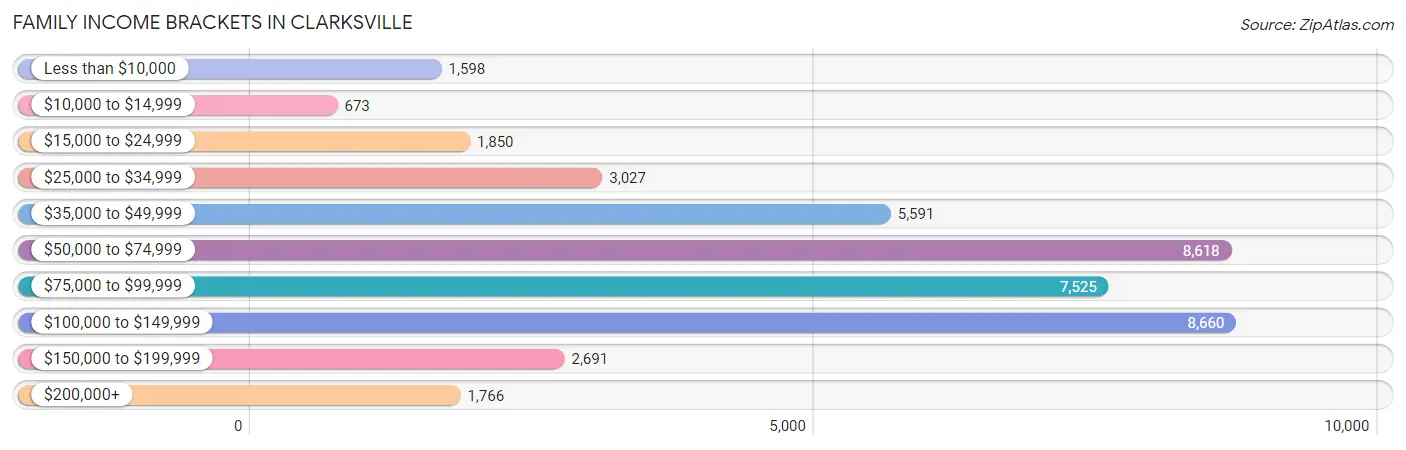
| Income Bracket | # Families | % Families |
| Less than $10,000 | 1,598 | 3.8% |
| $10,000 to $14,999 | 673 | 1.6% |
| $15,000 to $24,999 | 1,850 | 4.4% |
| $25,000 to $34,999 | 3,027 | 7.2% |
| $35,000 to $49,999 | 5,591 | 13.3% |
| $50,000 to $74,999 | 8,618 | 20.5% |
| $75,000 to $99,999 | 7,525 | 17.9% |
| $100,000 to $149,999 | 8,660 | 20.6% |
| $150,000 to $199,999 | 2,691 | 6.4% |
| $200,000+ | 1,766 | 4.2% |
Family Income by Famaliy Size in Clarksville
7+ person families (856 | 2.0%) account for the highest median family income in Clarksville with $89,333 per family, while 2-person families (18,524 | 44.1%) have the highest median income of $33,794 per family member.
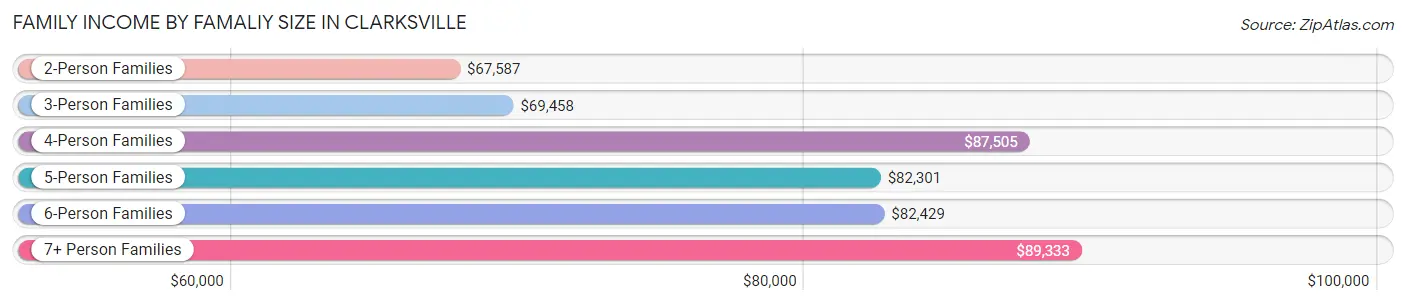
| Income Bracket | # Families | Median Income |
| 2-Person Families | 18,524 (44.1%) | $67,587 |
| 3-Person Families | 9,970 (23.7%) | $69,458 |
| 4-Person Families | 7,999 (19.0%) | $87,505 |
| 5-Person Families | 3,323 (7.9%) | $82,301 |
| 6-Person Families | 1,368 (3.3%) | $82,429 |
| 7+ Person Families | 856 (2.0%) | $89,333 |
| Total | 42,040 (100.0%) | $73,333 |
Family Income by Number of Earners in Clarksville
The median family income in Clarksville is $73,333, with families comprising 3+ earners (3,001) having the highest median family income of $117,744, while families with no earners (4,814) have the lowest median family income of $47,015, accounting for 7.1% and 11.5% of families, respectively.
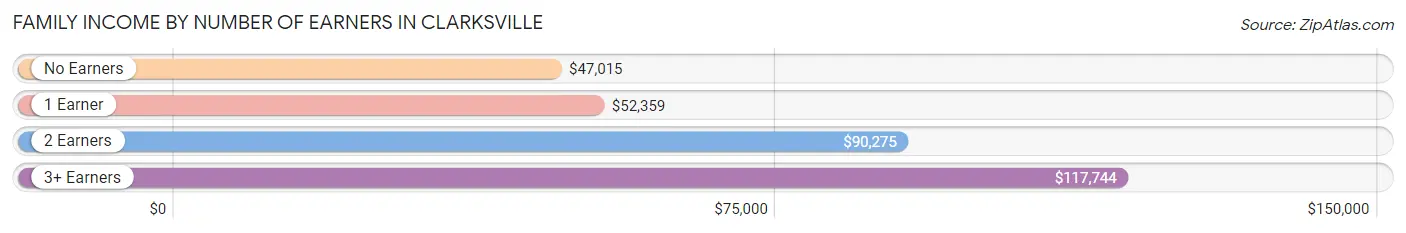
| Number of Earners | # Families | Median Income |
| No Earners | 4,814 (11.5%) | $47,015 |
| 1 Earner | 16,619 (39.5%) | $52,359 |
| 2 Earners | 17,606 (41.9%) | $90,275 |
| 3+ Earners | 3,001 (7.1%) | $117,744 |
| Total | 42,040 (100.0%) | $73,333 |
Household Income in Clarksville
Household Income Brackets in Clarksville
With 12,547 households falling in the category, the $50,000 to $74,999 income range is the most frequent in Clarksville, accounting for 20.2% of all households. In contrast, only 1,863 households (3.0%) fall into the $10,000 to $14,999 income bracket, making it the least populous group.
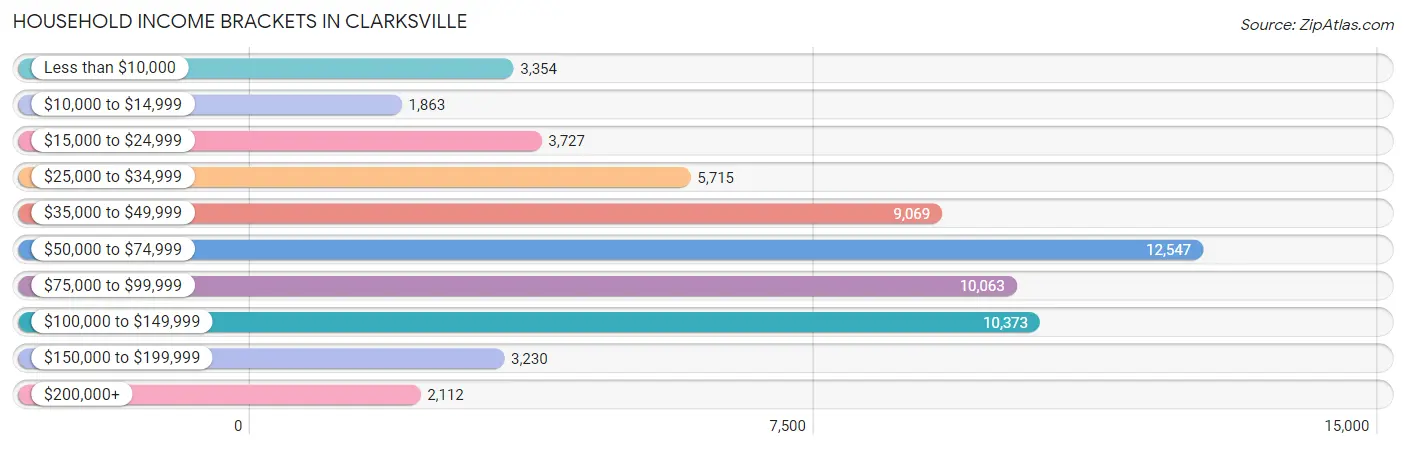
| Income Bracket | # Households | % Households |
| Less than $10,000 | 3,354 | 5.4% |
| $10,000 to $14,999 | 1,863 | 3.0% |
| $15,000 to $24,999 | 3,727 | 6.0% |
| $25,000 to $34,999 | 5,715 | 9.2% |
| $35,000 to $49,999 | 9,069 | 14.6% |
| $50,000 to $74,999 | 12,547 | 20.2% |
| $75,000 to $99,999 | 10,063 | 16.2% |
| $100,000 to $149,999 | 10,373 | 16.7% |
| $150,000 to $199,999 | 3,230 | 5.2% |
| $200,000+ | 2,112 | 3.4% |
Household Income by Householder Age in Clarksville
The median household income in Clarksville is $62,688, with the highest median household income of $77,823 found in the 45 to 64 years age bracket for the primary householder. A total of 18,139 households (29.2%) fall into this category. Meanwhile, the 15 to 24 years age bracket for the primary householder has the lowest median household income of $46,032, with 5,249 households (8.5%) in this group.
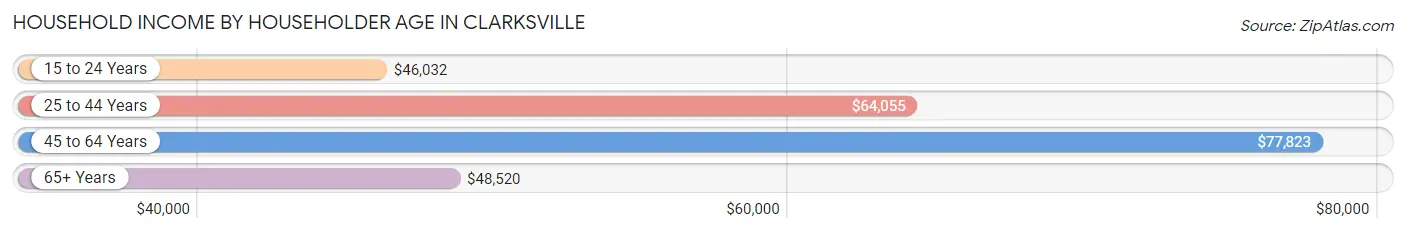
| Income Bracket | # Households | Median Income |
| 15 to 24 Years | 5,249 (8.5%) | $46,032 |
| 25 to 44 Years | 29,445 (47.4%) | $64,055 |
| 45 to 64 Years | 18,139 (29.2%) | $77,823 |
| 65+ Years | 9,282 (14.9%) | $48,520 |
| Total | 62,115 (100.0%) | $62,688 |
Poverty in Clarksville
Income Below Poverty by Sex and Age in Clarksville
With 11.4% poverty level for males and 14.4% for females among the residents of Clarksville, 15 year old males and 6 to 11 year old females are the most vulnerable to poverty, with 356 males (34.8%) and 1,439 females (20.6%) in their respective age groups living below the poverty level.
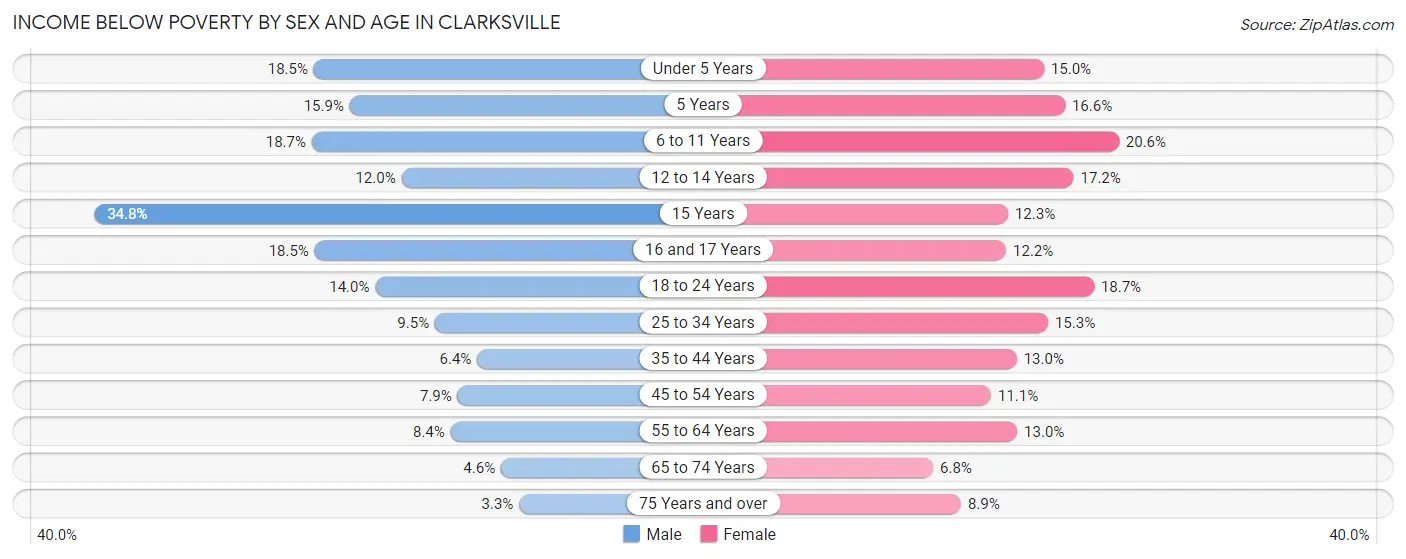
| Age Bracket | Male | Female |
| Under 5 Years | 1,377 (18.5%) | 1,010 (15.0%) |
| 5 Years | 229 (15.9%) | 180 (16.6%) |
| 6 to 11 Years | 1,468 (18.7%) | 1,439 (20.6%) |
| 12 to 14 Years | 339 (12.0%) | 639 (17.2%) |
| 15 Years | 356 (34.8%) | 126 (12.3%) |
| 16 and 17 Years | 428 (18.5%) | 237 (12.2%) |
| 18 to 24 Years | 1,330 (14.0%) | 1,683 (18.7%) |
| 25 to 34 Years | 1,630 (9.5%) | 2,444 (15.3%) |
| 35 to 44 Years | 742 (6.4%) | 1,458 (13.0%) |
| 45 to 54 Years | 608 (7.9%) | 914 (11.1%) |
| 55 to 64 Years | 583 (8.4%) | 1,007 (13.0%) |
| 65 to 74 Years | 193 (4.6%) | 356 (6.8%) |
| 75 Years and over | 71 (3.3%) | 242 (8.8%) |
| Total | 9,354 (11.4%) | 11,735 (14.4%) |
Income Above Poverty by Sex and Age in Clarksville
According to the poverty statistics in Clarksville, males aged 75 years and over and females aged 65 to 74 years are the age groups that are most secure financially, with 96.7% of males and 93.2% of females in these age groups living above the poverty line.
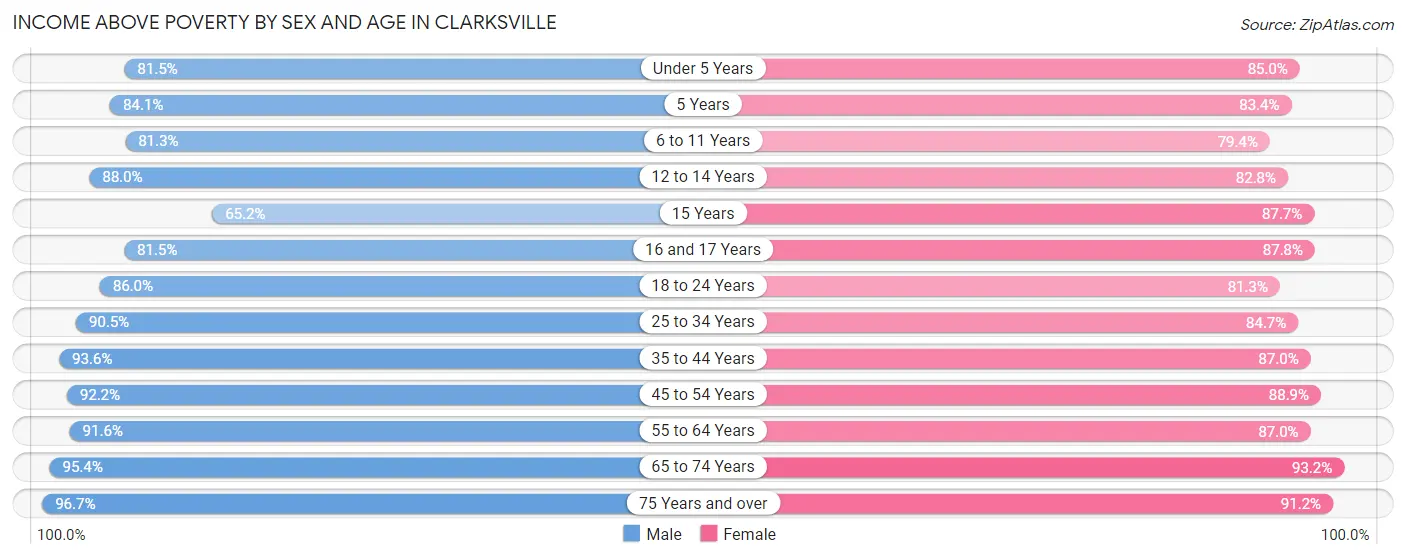
| Age Bracket | Male | Female |
| Under 5 Years | 6,056 (81.5%) | 5,717 (85.0%) |
| 5 Years | 1,215 (84.1%) | 906 (83.4%) |
| 6 to 11 Years | 6,389 (81.3%) | 5,556 (79.4%) |
| 12 to 14 Years | 2,482 (88.0%) | 3,073 (82.8%) |
| 15 Years | 666 (65.2%) | 895 (87.7%) |
| 16 and 17 Years | 1,891 (81.5%) | 1,706 (87.8%) |
| 18 to 24 Years | 8,196 (86.0%) | 7,307 (81.3%) |
| 25 to 34 Years | 15,477 (90.5%) | 13,517 (84.7%) |
| 35 to 44 Years | 10,843 (93.6%) | 9,768 (87.0%) |
| 45 to 54 Years | 7,136 (92.1%) | 7,332 (88.9%) |
| 55 to 64 Years | 6,385 (91.6%) | 6,730 (87.0%) |
| 65 to 74 Years | 3,977 (95.4%) | 4,892 (93.2%) |
| 75 Years and over | 2,095 (96.7%) | 2,492 (91.1%) |
| Total | 72,808 (88.6%) | 69,891 (85.6%) |
Income Below Poverty Among Married-Couple Families in Clarksville
The poverty statistics for married-couple families in Clarksville show that 4.3% or 1,243 of the total 29,164 families live below the poverty line. Families with 5 or more children have the highest poverty rate of 23.7%, comprising of 70 families. On the other hand, families with 1 or 2 children have the lowest poverty rate of 3.0%, which includes 333 families.
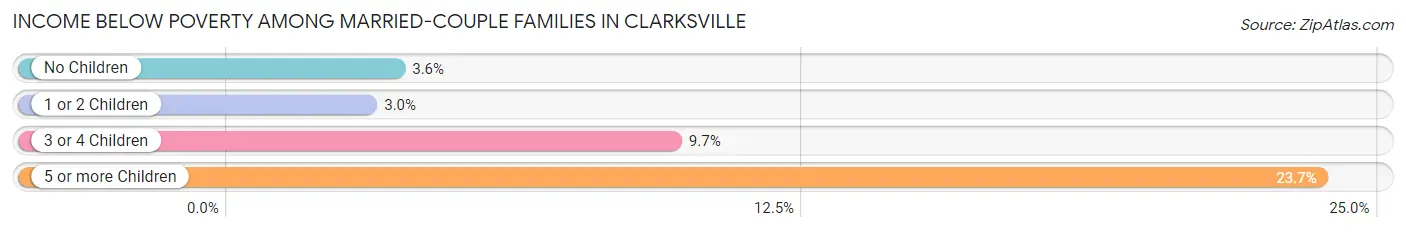
| Children | Above Poverty | Below Poverty |
| No Children | 14,230 (96.4%) | 538 (3.6%) |
| 1 or 2 Children | 10,641 (97.0%) | 333 (3.0%) |
| 3 or 4 Children | 2,825 (90.3%) | 302 (9.7%) |
| 5 or more Children | 225 (76.3%) | 70 (23.7%) |
| Total | 27,921 (95.7%) | 1,243 (4.3%) |
Income Below Poverty Among Single-Parent Households in Clarksville
According to the poverty data in Clarksville, 5.1% or 174 single-father households and 28.1% or 2,654 single-mother households are living below the poverty line. Among single-father households, those with 3 or 4 children have the highest poverty rate, with 30 households (12.3%) experiencing poverty. Likewise, among single-mother households, those with 5 or more children have the highest poverty rate, with 245 households (94.6%) falling below the poverty line.
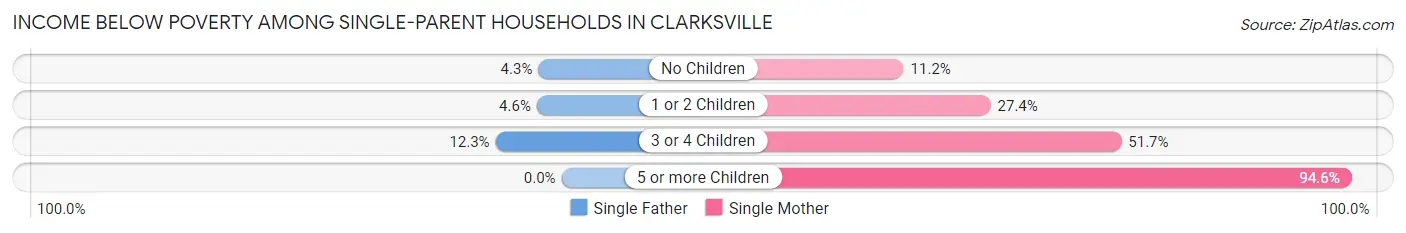
| Children | Single Father | Single Mother |
| No Children | 51 (4.3%) | 310 (11.2%) |
| 1 or 2 Children | 93 (4.6%) | 1,363 (27.4%) |
| 3 or 4 Children | 30 (12.3%) | 736 (51.7%) |
| 5 or more Children | 0 (0.0%) | 245 (94.6%) |
| Total | 174 (5.1%) | 2,654 (28.1%) |
Income Below Poverty Among Married-Couple vs Single-Parent Households in Clarksville
The poverty data for Clarksville shows that 1,243 of the married-couple family households (4.3%) and 2,828 of the single-parent households (22.0%) are living below the poverty level. Within the married-couple family households, those with 5 or more children have the highest poverty rate, with 70 households (23.7%) falling below the poverty line. Among the single-parent households, those with 5 or more children have the highest poverty rate, with 245 household (94.6%) living below poverty.
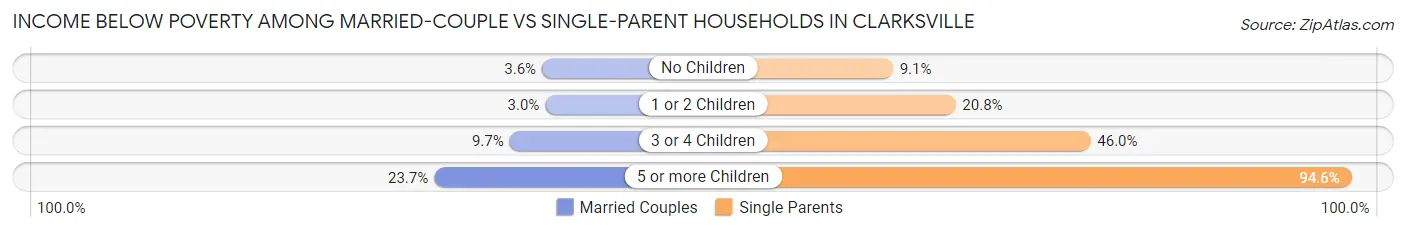
| Children | Married-Couple Families | Single-Parent Households |
| No Children | 538 (3.6%) | 361 (9.1%) |
| 1 or 2 Children | 333 (3.0%) | 1,456 (20.8%) |
| 3 or 4 Children | 302 (9.7%) | 766 (46.0%) |
| 5 or more Children | 70 (23.7%) | 245 (94.6%) |
| Total | 1,243 (4.3%) | 2,828 (22.0%) |
Race in Clarksville
The most populous races in Clarksville are White / Caucasian (101,413 | 60.4%), Black / African American (39,418 | 23.5%), and Hispanic or Latino (19,946 | 11.9%).
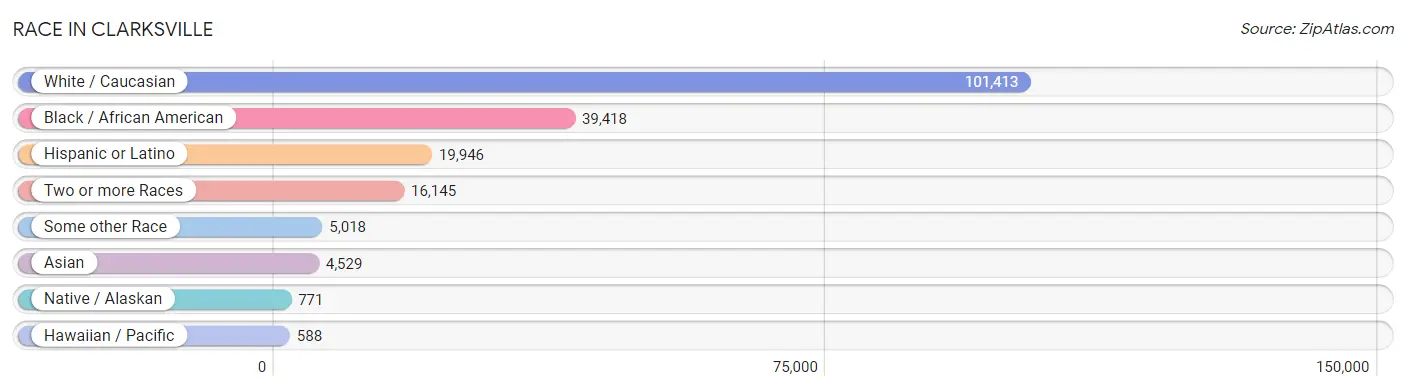
| Race | # Population | % Population |
| Asian | 4,529 | 2.7% |
| Black / African American | 39,418 | 23.5% |
| Hawaiian / Pacific | 588 | 0.4% |
| Hispanic or Latino | 19,946 | 11.9% |
| Native / Alaskan | 771 | 0.5% |
| White / Caucasian | 101,413 | 60.4% |
| Two or more Races | 16,145 | 9.6% |
| Some other Race | 5,018 | 3.0% |
| Total | 167,882 | 100.0% |
Ancestry in Clarksville
The most populous ancestries reported in Clarksville are German (21,098 | 12.6%), Irish (14,857 | 8.8%), English (13,518 | 8.1%), American (9,810 | 5.8%), and Mexican (9,468 | 5.6%), together accounting for 41.0% of all Clarksville residents.
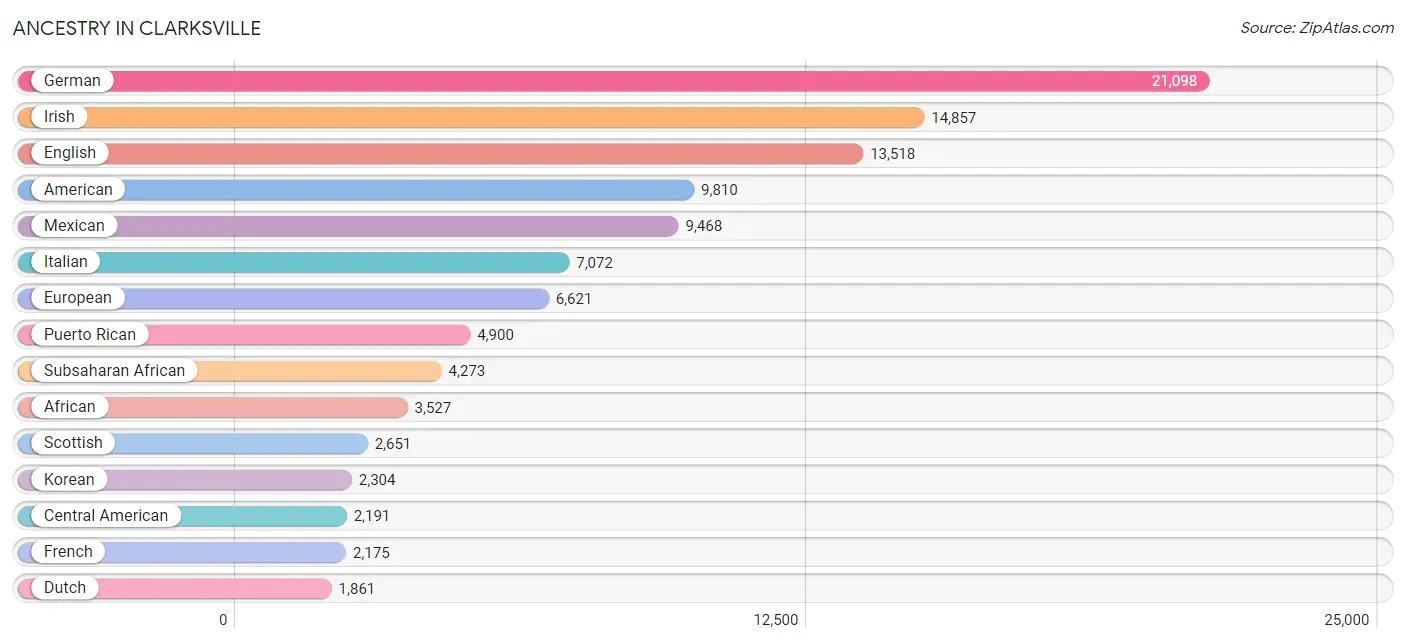
| Ancestry | # Population | % Population |
| African | 3,527 | 2.1% |
| Alaska Native | 17 | 0.0% |
| Alaskan Athabascan | 22 | 0.0% |
| Albanian | 96 | 0.1% |
| American | 9,810 | 5.8% |
| Apache | 52 | 0.0% |
| Arab | 1,115 | 0.7% |
| Argentinean | 101 | 0.1% |
| Armenian | 19 | 0.0% |
| Australian | 22 | 0.0% |
| Austrian | 79 | 0.1% |
| Bangladeshi | 237 | 0.1% |
| Basque | 76 | 0.1% |
| Belgian | 53 | 0.0% |
| Belizean | 66 | 0.0% |
| Bhutanese | 424 | 0.3% |
| Blackfeet | 116 | 0.1% |
| Bolivian | 22 | 0.0% |
| Brazilian | 147 | 0.1% |
| British | 819 | 0.5% |
| British West Indian | 45 | 0.0% |
| Burmese | 1,824 | 1.1% |
| Cajun | 40 | 0.0% |
| Canadian | 105 | 0.1% |
| Celtic | 97 | 0.1% |
| Central American | 2,191 | 1.3% |
| Central American Indian | 59 | 0.0% |
| Cherokee | 1,075 | 0.6% |
| Cheyenne | 52 | 0.0% |
| Chickasaw | 69 | 0.0% |
| Chilean | 183 | 0.1% |
| Chippewa | 36 | 0.0% |
| Choctaw | 151 | 0.1% |
| Colombian | 229 | 0.1% |
| Creek | 198 | 0.1% |
| Croatian | 141 | 0.1% |
| Crow | 7 | 0.0% |
| Cuban | 582 | 0.4% |
| Czech | 69 | 0.0% |
| Czechoslovakian | 55 | 0.0% |
| Danish | 546 | 0.3% |
| Delaware | 2 | 0.0% |
| Dominican | 558 | 0.3% |
| Dutch | 1,861 | 1.1% |
| Dutch West Indian | 14 | 0.0% |
| Eastern European | 253 | 0.2% |
| Ecuadorian | 120 | 0.1% |
| Egyptian | 77 | 0.1% |
| English | 13,518 | 8.1% |
| Ethiopian | 103 | 0.1% |
| European | 6,621 | 3.9% |
| Fijian | 12 | 0.0% |
| Filipino | 25 | 0.0% |
| Finnish | 247 | 0.2% |
| French | 2,175 | 1.3% |
| French Canadian | 722 | 0.4% |
| German | 21,098 | 12.6% |
| Greek | 747 | 0.4% |
| Guamanian / Chamorro | 307 | 0.2% |
| Guatemalan | 413 | 0.3% |
| Guyanese | 113 | 0.1% |
| Haitian | 178 | 0.1% |
| Honduran | 420 | 0.3% |
| Hungarian | 346 | 0.2% |
| Icelander | 1 | 0.0% |
| Indian (Asian) | 754 | 0.4% |
| Inupiat | 10 | 0.0% |
| Iranian | 46 | 0.0% |
| Iraqi | 49 | 0.0% |
| Irish | 14,857 | 8.8% |
| Italian | 7,072 | 4.2% |
| Jamaican | 455 | 0.3% |
| Japanese | 143 | 0.1% |
| Jordanian | 32 | 0.0% |
| Kenyan | 38 | 0.0% |
| Korean | 2,304 | 1.4% |
| Latvian | 39 | 0.0% |
| Lebanese | 170 | 0.1% |
| Liberian | 47 | 0.0% |
| Lithuanian | 90 | 0.1% |
| Lumbee | 9 | 0.0% |
| Malaysian | 30 | 0.0% |
| Mexican | 9,468 | 5.6% |
| Mexican American Indian | 133 | 0.1% |
| Moroccan | 61 | 0.0% |
| Native Hawaiian | 105 | 0.1% |
| Navajo | 101 | 0.1% |
| New Zealander | 5 | 0.0% |
| Nigerian | 141 | 0.1% |
| Northern European | 56 | 0.0% |
| Norwegian | 660 | 0.4% |
| Pakistani | 184 | 0.1% |
| Palestinian | 221 | 0.1% |
| Panamanian | 479 | 0.3% |
| Pennsylvania German | 45 | 0.0% |
| Peruvian | 129 | 0.1% |
| Polish | 1,659 | 1.0% |
| Portuguese | 305 | 0.2% |
| Potawatomi | 268 | 0.2% |
| Puerto Rican | 4,900 | 2.9% |
| Romanian | 36 | 0.0% |
| Russian | 296 | 0.2% |
| Salvadoran | 768 | 0.5% |
| Samoan | 657 | 0.4% |
| Scandinavian | 301 | 0.2% |
| Scotch-Irish | 1,741 | 1.0% |
| Scottish | 2,651 | 1.6% |
| Seminole | 171 | 0.1% |
| Serbian | 61 | 0.0% |
| Sioux | 9 | 0.0% |
| Slavic | 447 | 0.3% |
| Slovak | 46 | 0.0% |
| Slovene | 415 | 0.3% |
| Somali | 8 | 0.0% |
| South American | 857 | 0.5% |
| Spaniard | 250 | 0.2% |
| Spanish | 343 | 0.2% |
| Spanish American | 207 | 0.1% |
| Sri Lankan | 306 | 0.2% |
| Subsaharan African | 4,273 | 2.5% |
| Sudanese | 16 | 0.0% |
| Swedish | 673 | 0.4% |
| Swiss | 437 | 0.3% |
| Syrian | 197 | 0.1% |
| Thai | 940 | 0.6% |
| Tongan | 10 | 0.0% |
| Trinidadian and Tobagonian | 107 | 0.1% |
| Turkish | 10 | 0.0% |
| U.S. Virgin Islander | 23 | 0.0% |
| Ukrainian | 85 | 0.1% |
| Venezuelan | 73 | 0.0% |
| Welsh | 834 | 0.5% |
| West Indian | 103 | 0.1% |
| Yaqui | 75 | 0.0% |
| Yugoslavian | 254 | 0.2% |
| Yup'ik | 11 | 0.0% | View All 136 Rows |
Immigrants in Clarksville
The most numerous immigrant groups reported in Clarksville came from Latin America (4,752 | 2.8%), Asia (3,287 | 2.0%), Central America (3,015 | 1.8%), Mexico (2,087 | 1.2%), and Europe (1,427 | 0.9%), together accounting for 8.7% of all Clarksville residents.
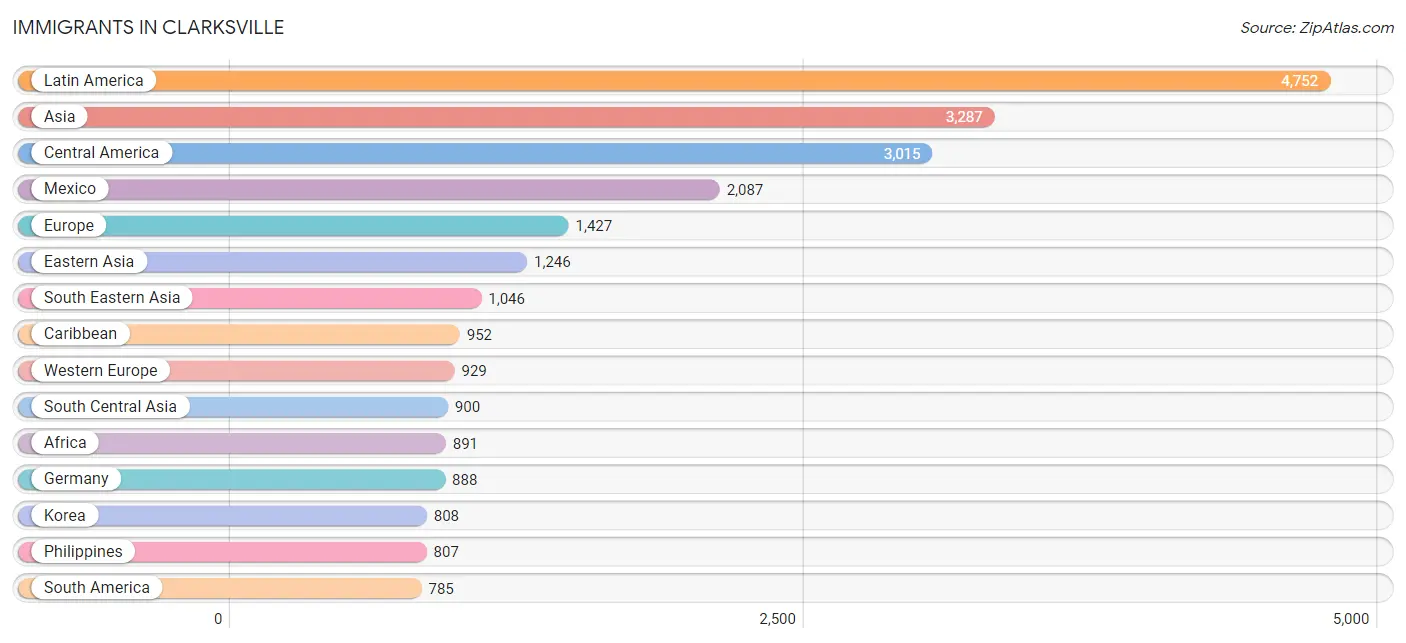
| Immigration Origin | # Population | % Population |
| Africa | 891 | 0.5% |
| Albania | 65 | 0.0% |
| Argentina | 150 | 0.1% |
| Asia | 3,287 | 2.0% |
| Australia | 3 | 0.0% |
| Austria | 23 | 0.0% |
| Bangladesh | 24 | 0.0% |
| Belgium | 13 | 0.0% |
| Bolivia | 22 | 0.0% |
| Bosnia and Herzegovina | 83 | 0.1% |
| Brazil | 127 | 0.1% |
| Cambodia | 26 | 0.0% |
| Cameroon | 5 | 0.0% |
| Canada | 412 | 0.3% |
| Caribbean | 952 | 0.6% |
| Central America | 3,015 | 1.8% |
| Chile | 141 | 0.1% |
| China | 315 | 0.2% |
| Colombia | 96 | 0.1% |
| Congo | 50 | 0.0% |
| Cuba | 58 | 0.0% |
| Czechoslovakia | 2 | 0.0% |
| Dominican Republic | 304 | 0.2% |
| Eastern Africa | 341 | 0.2% |
| Eastern Asia | 1,246 | 0.7% |
| Eastern Europe | 353 | 0.2% |
| Ecuador | 47 | 0.0% |
| Egypt | 53 | 0.0% |
| El Salvador | 370 | 0.2% |
| England | 13 | 0.0% |
| Eritrea | 34 | 0.0% |
| Ethiopia | 30 | 0.0% |
| Europe | 1,427 | 0.9% |
| France | 5 | 0.0% |
| Germany | 888 | 0.5% |
| Guatemala | 177 | 0.1% |
| Guyana | 81 | 0.1% |
| Haiti | 84 | 0.1% |
| Honduras | 149 | 0.1% |
| Hong Kong | 1 | 0.0% |
| Hungary | 119 | 0.1% |
| India | 413 | 0.3% |
| Iran | 79 | 0.1% |
| Iraq | 49 | 0.0% |
| Ireland | 11 | 0.0% |
| Jamaica | 245 | 0.2% |
| Japan | 123 | 0.1% |
| Kenya | 26 | 0.0% |
| Korea | 808 | 0.5% |
| Laos | 47 | 0.0% |
| Latin America | 4,752 | 2.8% |
| Latvia | 28 | 0.0% |
| Liberia | 11 | 0.0% |
| Mexico | 2,087 | 1.2% |
| Micronesia | 169 | 0.1% |
| Middle Africa | 55 | 0.0% |
| Morocco | 61 | 0.0% |
| Nepal | 267 | 0.2% |
| Nigeria | 171 | 0.1% |
| Northern Africa | 260 | 0.2% |
| Northern Europe | 114 | 0.1% |
| Oceania | 262 | 0.2% |
| Pakistan | 114 | 0.1% |
| Panama | 232 | 0.1% |
| Peru | 88 | 0.1% |
| Philippines | 807 | 0.5% |
| Poland | 7 | 0.0% |
| Portugal | 15 | 0.0% |
| Saudi Arabia | 46 | 0.0% |
| Scotland | 8 | 0.0% |
| Somalia | 65 | 0.0% |
| South America | 785 | 0.5% |
| South Central Asia | 900 | 0.5% |
| South Eastern Asia | 1,046 | 0.6% |
| Southern Europe | 31 | 0.0% |
| Spain | 16 | 0.0% |
| Sudan | 140 | 0.1% |
| Taiwan | 44 | 0.0% |
| Thailand | 115 | 0.1% |
| Trinidad and Tobago | 132 | 0.1% |
| Uganda | 16 | 0.0% |
| Ukraine | 33 | 0.0% |
| Venezuela | 33 | 0.0% |
| Vietnam | 51 | 0.0% |
| Western Africa | 182 | 0.1% |
| Western Asia | 95 | 0.1% |
| Western Europe | 929 | 0.5% | View All 87 Rows |
Sex and Age in Clarksville
Sex and Age in Clarksville
The most populous age groups in Clarksville are 25 to 29 Years (9,372 | 11.1%) for men and 25 to 29 Years (8,705 | 10.5%) for women.
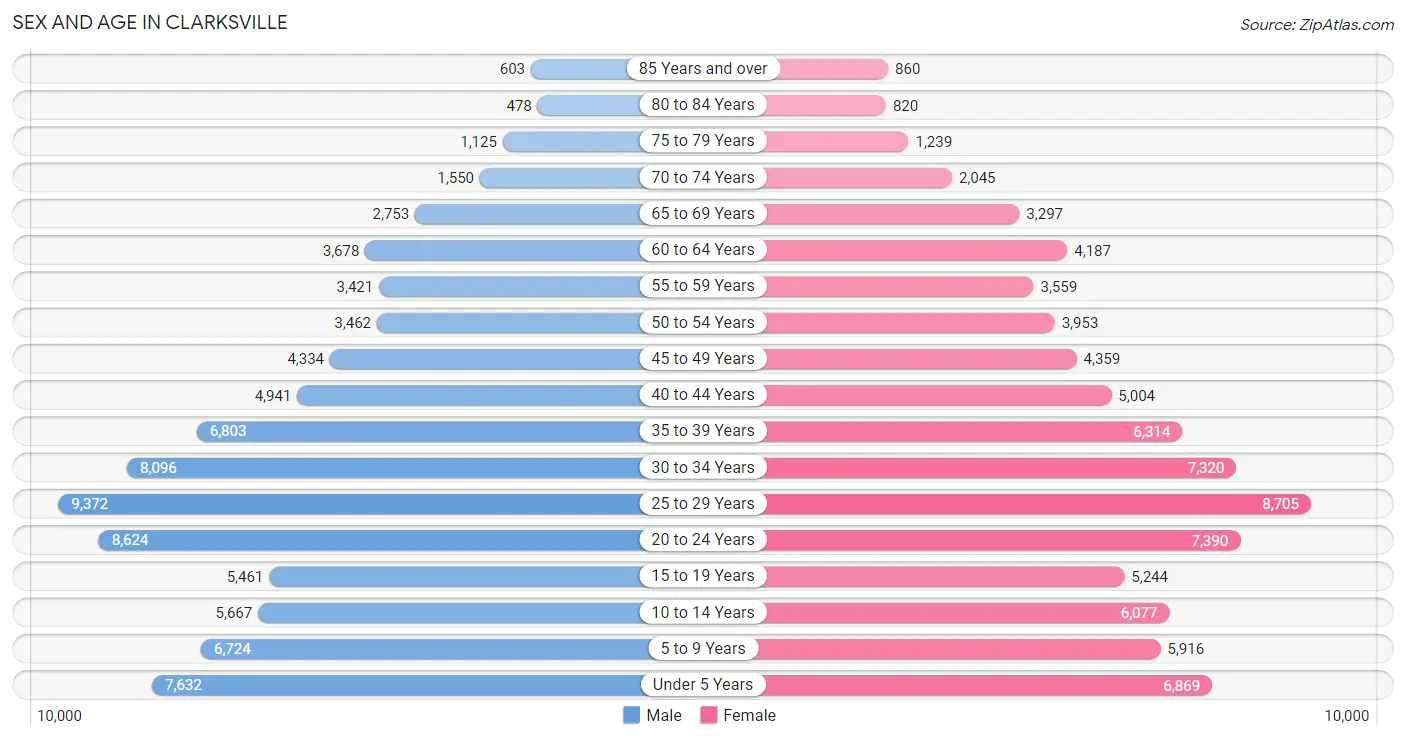
| Age Bracket | Male | Female |
| Under 5 Years | 7,632 (9.0%) | 6,869 (8.3%) |
| 5 to 9 Years | 6,724 (7.9%) | 5,916 (7.1%) |
| 10 to 14 Years | 5,667 (6.7%) | 6,077 (7.3%) |
| 15 to 19 Years | 5,461 (6.5%) | 5,244 (6.3%) |
| 20 to 24 Years | 8,624 (10.2%) | 7,390 (8.9%) |
| 25 to 29 Years | 9,372 (11.1%) | 8,705 (10.5%) |
| 30 to 34 Years | 8,096 (9.6%) | 7,320 (8.8%) |
| 35 to 39 Years | 6,803 (8.0%) | 6,314 (7.6%) |
| 40 to 44 Years | 4,941 (5.8%) | 5,004 (6.0%) |
| 45 to 49 Years | 4,334 (5.1%) | 4,359 (5.2%) |
| 50 to 54 Years | 3,462 (4.1%) | 3,953 (4.8%) |
| 55 to 59 Years | 3,421 (4.0%) | 3,559 (4.3%) |
| 60 to 64 Years | 3,678 (4.3%) | 4,187 (5.0%) |
| 65 to 69 Years | 2,753 (3.3%) | 3,297 (4.0%) |
| 70 to 74 Years | 1,550 (1.8%) | 2,045 (2.5%) |
| 75 to 79 Years | 1,125 (1.3%) | 1,239 (1.5%) |
| 80 to 84 Years | 478 (0.6%) | 820 (1.0%) |
| 85 Years and over | 603 (0.7%) | 860 (1.0%) |
| Total | 84,724 (100.0%) | 83,158 (100.0%) |
Families and Households in Clarksville
Median Family Size in Clarksville
The median family size in Clarksville is 3.18 persons per family, with single female/mother families (9,436 | 22.5%) accounting for the largest median family size of 3.23 persons per family. On the other hand, single male/father families (3,440 | 8.2%) represent the smallest median family size with 2.72 persons per family.
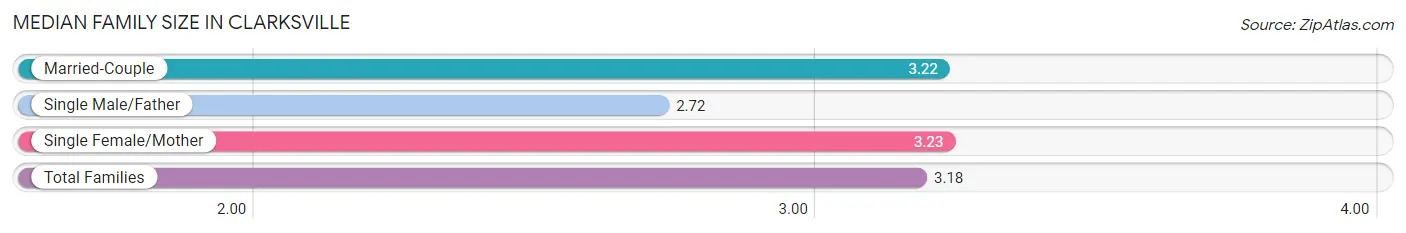
| Family Type | # Families | Family Size |
| Married-Couple | 29,164 (69.4%) | 3.22 |
| Single Male/Father | 3,440 (8.2%) | 2.72 |
| Single Female/Mother | 9,436 (22.5%) | 3.23 |
| Total Families | 42,040 (100.0%) | 3.18 |
Median Household Size in Clarksville
The median household size in Clarksville is 2.65 persons per household, with single female/mother households (9,436 | 15.2%) accounting for the largest median household size of 3.47 persons per household. non-family households (20,075 | 32.3%) represent the smallest median household size with 1.29 persons per household.
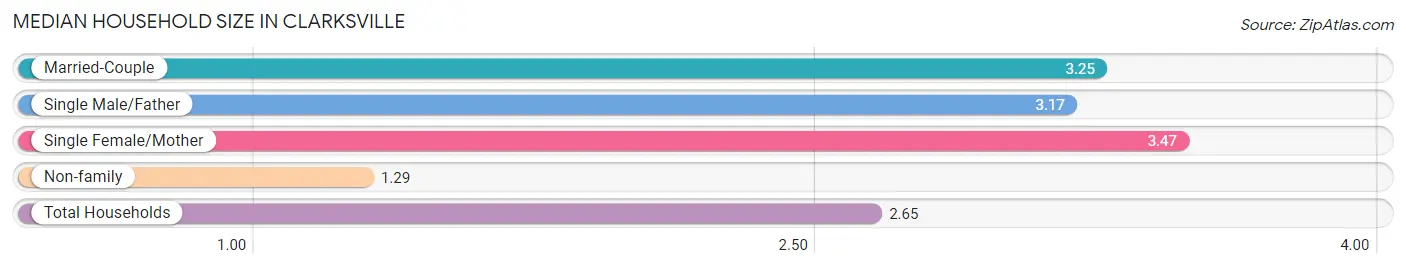
| Household Type | # Households | Household Size |
| Married-Couple | 29,164 (46.9%) | 3.25 |
| Single Male/Father | 3,440 (5.5%) | 3.17 |
| Single Female/Mother | 9,436 (15.2%) | 3.47 |
| Non-family | 20,075 (32.3%) | 1.29 |
| Total Households | 62,115 (100.0%) | 2.65 |
Household Size by Marriage Status in Clarksville
Out of a total of 62,115 households in Clarksville, 42,040 (67.7%) are family households, while 20,075 (32.3%) are nonfamily households. The most numerous type of family households are 2-person households, comprising 16,990, and the most common type of nonfamily households are 1-person households, comprising 16,111.
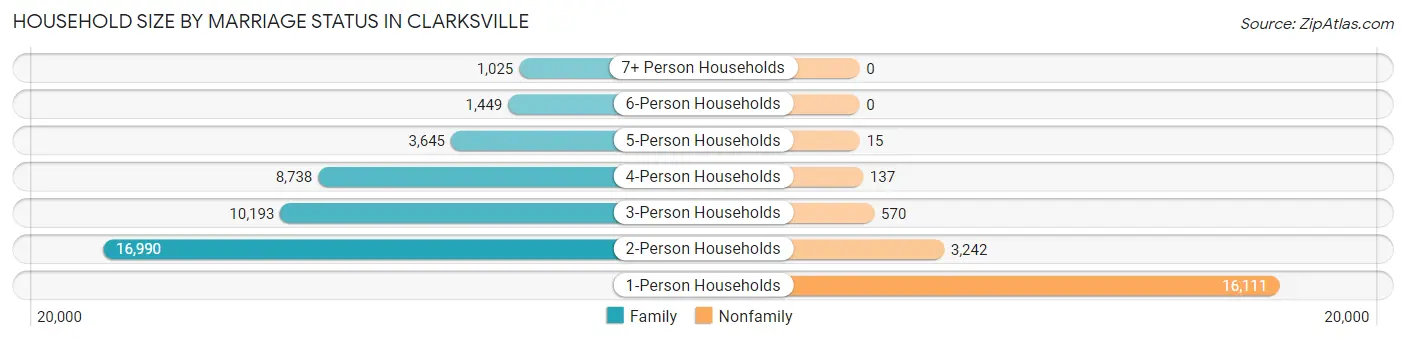
| Household Size | Family Households | Nonfamily Households |
| 1-Person Households | - | 16,111 (25.9%) |
| 2-Person Households | 16,990 (27.4%) | 3,242 (5.2%) |
| 3-Person Households | 10,193 (16.4%) | 570 (0.9%) |
| 4-Person Households | 8,738 (14.1%) | 137 (0.2%) |
| 5-Person Households | 3,645 (5.9%) | 15 (0.0%) |
| 6-Person Households | 1,449 (2.3%) | 0 (0.0%) |
| 7+ Person Households | 1,025 (1.7%) | 0 (0.0%) |
| Total | 42,040 (67.7%) | 20,075 (32.3%) |
Female Fertility in Clarksville
Fertility by Age in Clarksville
Average fertility rate in Clarksville is 74.0 births per 1,000 women. Women in the age bracket of 20 to 34 years have the highest fertility rate with 123.0 births per 1,000 women. Women in the age bracket of 20 to 34 years acount for 86.1% of all women with births.
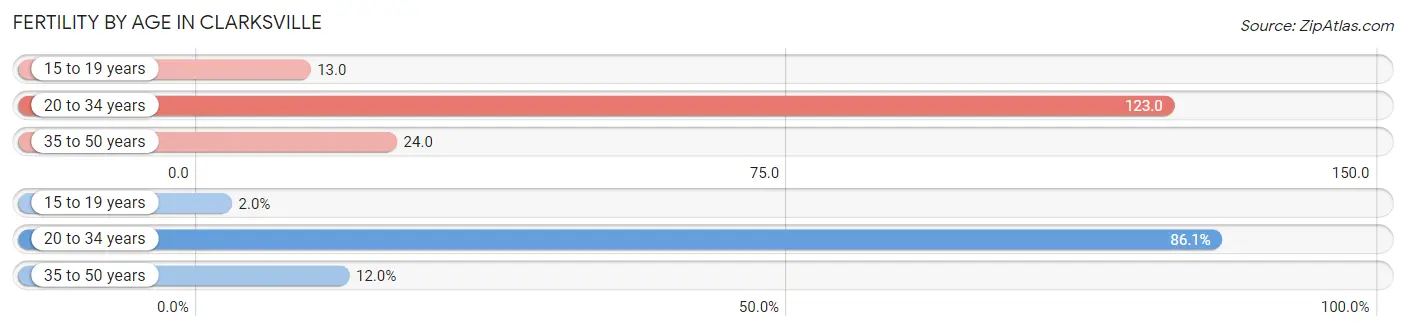
| Age Bracket | Women with Births | Births / 1,000 Women |
| 15 to 19 years | 67 (2.0%) | 13.0 |
| 20 to 34 years | 2,886 (86.1%) | 123.0 |
| 35 to 50 years | 401 (12.0%) | 24.0 |
| Total | 3,354 (100.0%) | 74.0 |
Fertility by Age by Marriage Status in Clarksville
72.2% of women with births (3,354) in Clarksville are married. The highest percentage of unmarried women with births falls into 15 to 19 years age bracket with 59.7% of them unmarried at the time of birth, while the lowest percentage of unmarried women with births belong to 20 to 34 years age bracket with 26.0% of them unmarried.
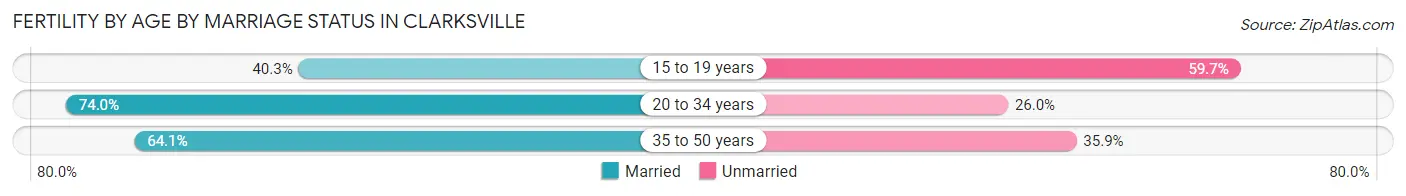
| Age Bracket | Married | Unmarried |
| 15 to 19 years | 27 (40.3%) | 40 (59.7%) |
| 20 to 34 years | 2,136 (74.0%) | 750 (26.0%) |
| 35 to 50 years | 257 (64.1%) | 144 (35.9%) |
| Total | 2,422 (72.2%) | 932 (27.8%) |
Fertility by Education in Clarksville
Average fertility rate in Clarksville is 74.0 births per 1,000 women. Women with the education attainment of bachelor's degree have the highest fertility rate of 104.0 births per 1,000 women, while women with the education attainment of graduate degree have the lowest fertility at 37.0 births per 1,000 women. Women with the education attainment of college or associate's degree represent 43.8% of all women with births.
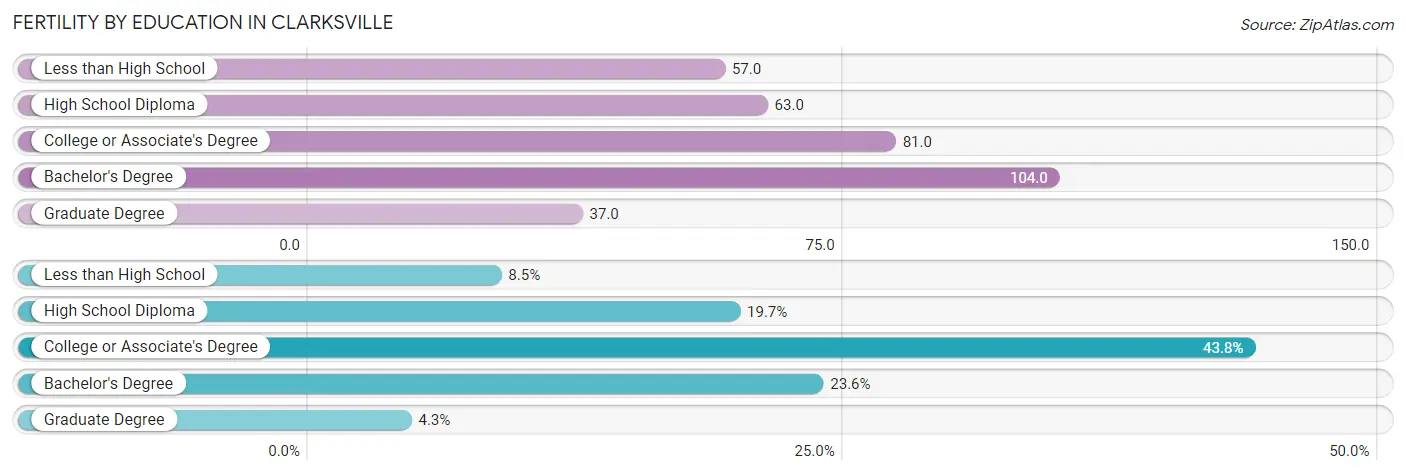
| Educational Attainment | Women with Births | Births / 1,000 Women |
| Less than High School | 286 (8.5%) | 57.0 |
| High School Diploma | 661 (19.7%) | 63.0 |
| College or Associate's Degree | 1,470 (43.8%) | 81.0 |
| Bachelor's Degree | 792 (23.6%) | 104.0 |
| Graduate Degree | 145 (4.3%) | 37.0 |
| Total | 3,354 (100.0%) | 74.0 |
Fertility by Education by Marriage Status in Clarksville
27.8% of women with births in Clarksville are unmarried. Women with the educational attainment of bachelor's degree are most likely to be married with 89.4% of them married at childbirth, while women with the educational attainment of less than high school are least likely to be married with 54.2% of them unmarried at childbirth.
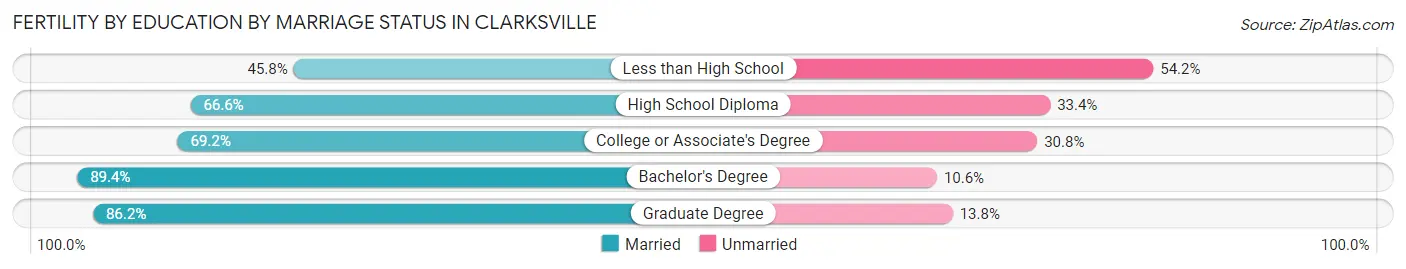
| Educational Attainment | Married | Unmarried |
| Less than High School | 131 (45.8%) | 155 (54.2%) |
| High School Diploma | 440 (66.6%) | 221 (33.4%) |
| College or Associate's Degree | 1,017 (69.2%) | 453 (30.8%) |
| Bachelor's Degree | 708 (89.4%) | 84 (10.6%) |
| Graduate Degree | 125 (86.2%) | 20 (13.8%) |
| Total | 2,422 (72.2%) | 932 (27.8%) |
Employment Characteristics in Clarksville
Employment by Class of Employer in Clarksville
Among the 78,393 employed individuals in Clarksville, private company employees (45,337 | 57.8%), federal government employees (16,386 | 20.9%), and local government employees (5,710 | 7.3%) make up the most common classes of employment.
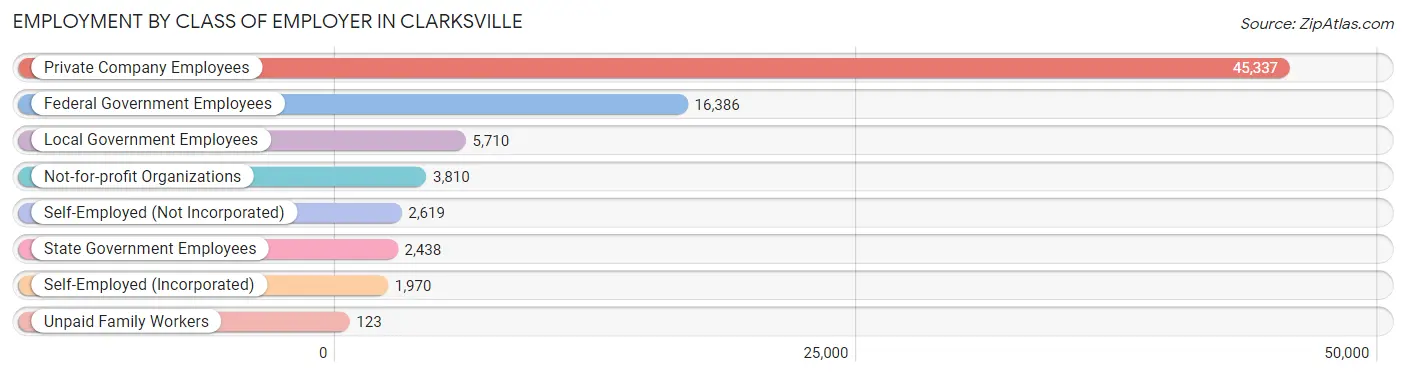
| Employer Class | # Employees | % Employees |
| Private Company Employees | 45,337 | 57.8% |
| Self-Employed (Incorporated) | 1,970 | 2.5% |
| Self-Employed (Not Incorporated) | 2,619 | 3.3% |
| Not-for-profit Organizations | 3,810 | 4.9% |
| Local Government Employees | 5,710 | 7.3% |
| State Government Employees | 2,438 | 3.1% |
| Federal Government Employees | 16,386 | 20.9% |
| Unpaid Family Workers | 123 | 0.2% |
| Total | 78,393 | 100.0% |
Employment Status by Age in Clarksville
According to the labor force statistics for Clarksville, out of the total population over 16 years of age (126,954), 67.4% or 85,567 individuals are in the labor force, with 6.5% or 5,562 of them unemployed. The age group with the highest labor force participation rate is 25 to 29 years, with 82.4% or 14,895 individuals in the labor force. Within the labor force, the 16 to 19 years age range has the highest percentage of unemployed individuals, with 15.6% or 562 of them being unemployed.
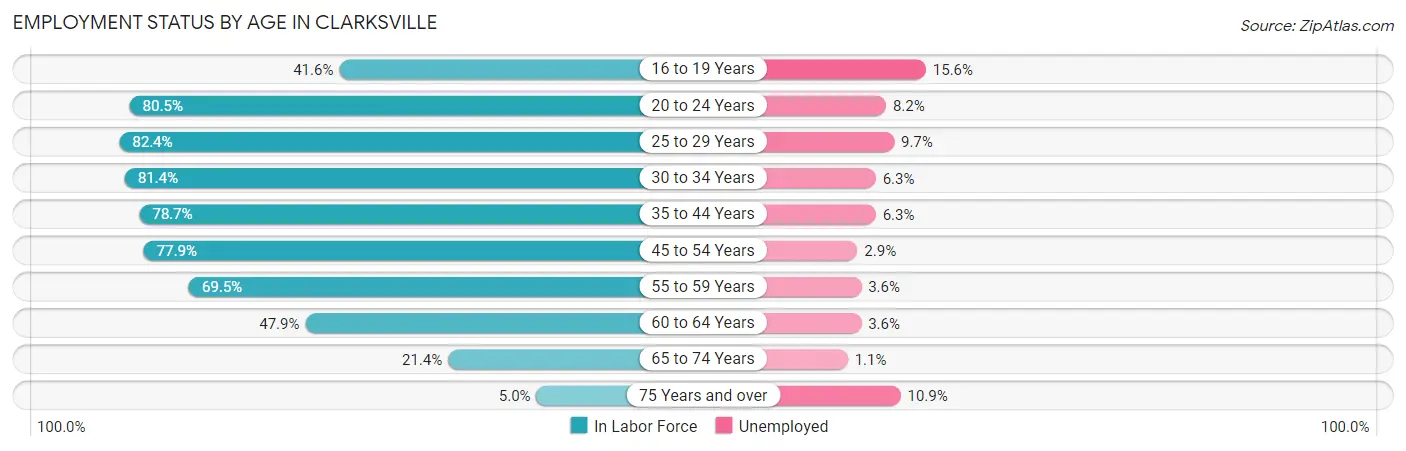
| Age Bracket | In Labor Force | Unemployed |
| 16 to 19 Years | 3,603 (41.6%) | 562 (15.6%) |
| 20 to 24 Years | 12,891 (80.5%) | 1,057 (8.2%) |
| 25 to 29 Years | 14,895 (82.4%) | 1,445 (9.7%) |
| 30 to 34 Years | 12,549 (81.4%) | 791 (6.3%) |
| 35 to 44 Years | 18,150 (78.7%) | 1,143 (6.3%) |
| 45 to 54 Years | 12,548 (77.9%) | 364 (2.9%) |
| 55 to 59 Years | 4,851 (69.5%) | 175 (3.6%) |
| 60 to 64 Years | 3,767 (47.9%) | 136 (3.6%) |
| 65 to 74 Years | 2,064 (21.4%) | 23 (1.1%) |
| 75 Years and over | 256 (5.0%) | 28 (10.9%) |
| Total | 85,567 (67.4%) | 5,562 (6.5%) |
Employment Status by Educational Attainment in Clarksville
According to labor force statistics for Clarksville, 76.3% of individuals (66,769) out of the total population between 25 and 64 years of age (87,508) are in the labor force, with 5.9% or 3,939 of them being unemployed. The group with the highest labor force participation rate are those with the educational attainment of bachelor's degree or higher, with 82.5% or 20,863 individuals in the labor force. Within the labor force, individuals with less than high school education have the highest percentage of unemployment, with 16.5% or 456 of them being unemployed.
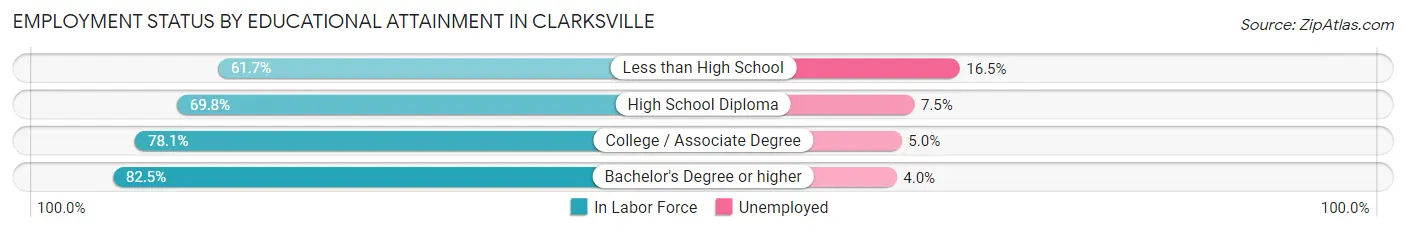
| Educational Attainment | In Labor Force | Unemployed |
| Less than High School | 2,763 (61.7%) | 739 (16.5%) |
| High School Diploma | 16,655 (69.8%) | 1,790 (7.5%) |
| College / Associate Degree | 26,461 (78.1%) | 1,694 (5.0%) |
| Bachelor's Degree or higher | 20,863 (82.5%) | 1,012 (4.0%) |
| Total | 66,769 (76.3%) | 5,163 (5.9%) |
Employment Occupations by Sex in Clarksville
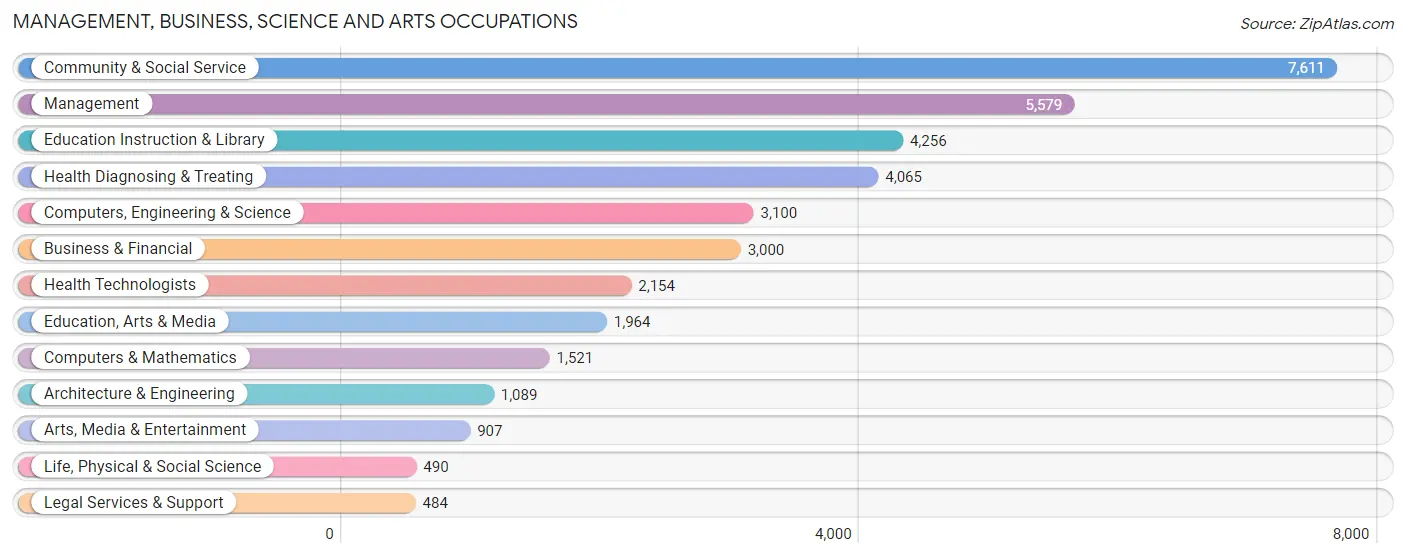
Management, Business, Science and Arts Occupations
The most common Management, Business, Science and Arts occupations in Clarksville are Community & Social Service (7,611 | 10.9%), Management (5,579 | 8.0%), Education Instruction & Library (4,256 | 6.1%), Health Diagnosing & Treating (4,065 | 5.8%), and Computers, Engineering & Science (3,100 | 4.4%).
Management, Business, Science and Arts Occupations by Sex
Within the Management, Business, Science and Arts occupations in Clarksville, the most male-oriented occupations are Architecture & Engineering (80.9%), Computers & Mathematics (77.0%), and Computers, Engineering & Science (74.3%), while the most female-oriented occupations are Health Technologists (81.2%), Health Diagnosing & Treating (79.6%), and Education, Arts & Media (79.5%).
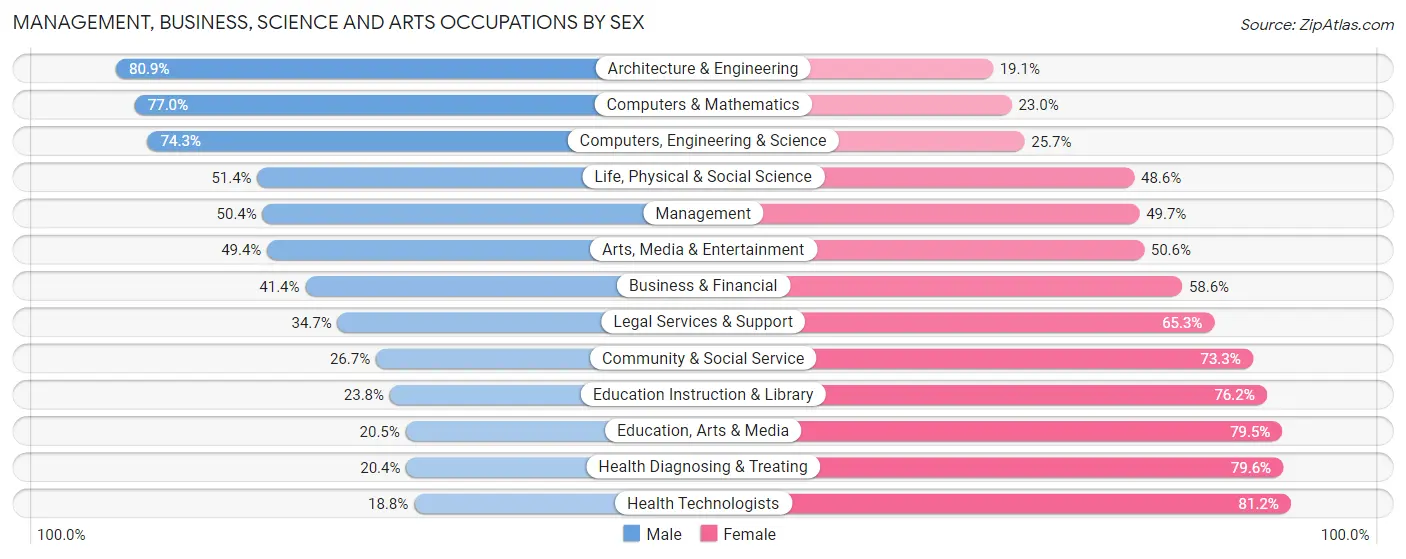
| Occupation | Male | Female |
| Management | 2,809 (50.3%) | 2,770 (49.6%) |
| Business & Financial | 1,243 (41.4%) | 1,757 (58.6%) |
| Computers, Engineering & Science | 2,304 (74.3%) | 796 (25.7%) |
| Computers & Mathematics | 1,171 (77.0%) | 350 (23.0%) |
| Architecture & Engineering | 881 (80.9%) | 208 (19.1%) |
| Life, Physical & Social Science | 252 (51.4%) | 238 (48.6%) |
| Community & Social Service | 2,032 (26.7%) | 5,579 (73.3%) |
| Education, Arts & Media | 403 (20.5%) | 1,561 (79.5%) |
| Legal Services & Support | 168 (34.7%) | 316 (65.3%) |
| Education Instruction & Library | 1,013 (23.8%) | 3,243 (76.2%) |
| Arts, Media & Entertainment | 448 (49.4%) | 459 (50.6%) |
| Health Diagnosing & Treating | 828 (20.4%) | 3,237 (79.6%) |
| Health Technologists | 404 (18.8%) | 1,750 (81.2%) |
| Total (Category) | 9,216 (39.5%) | 14,139 (60.5%) |
| Total (Overall) | 34,303 (49.0%) | 35,633 (50.9%) |
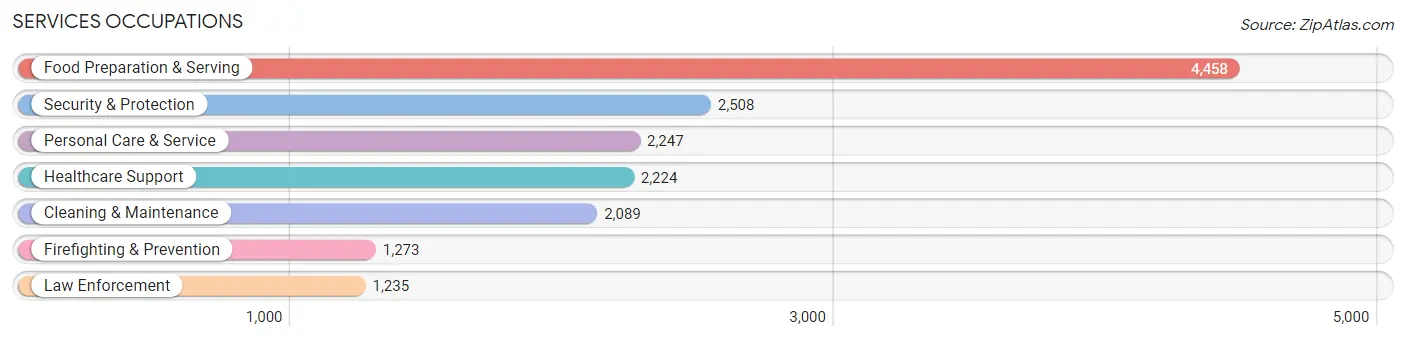
Services Occupations
The most common Services occupations in Clarksville are Food Preparation & Serving (4,458 | 6.4%), Security & Protection (2,508 | 3.6%), Personal Care & Service (2,247 | 3.2%), Healthcare Support (2,224 | 3.2%), and Cleaning & Maintenance (2,089 | 3.0%).
Services Occupations by Sex
Within the Services occupations in Clarksville, the most male-oriented occupations are Law Enforcement (76.7%), Security & Protection (71.2%), and Firefighting & Prevention (65.9%), while the most female-oriented occupations are Healthcare Support (92.6%), Personal Care & Service (83.6%), and Food Preparation & Serving (67.3%).
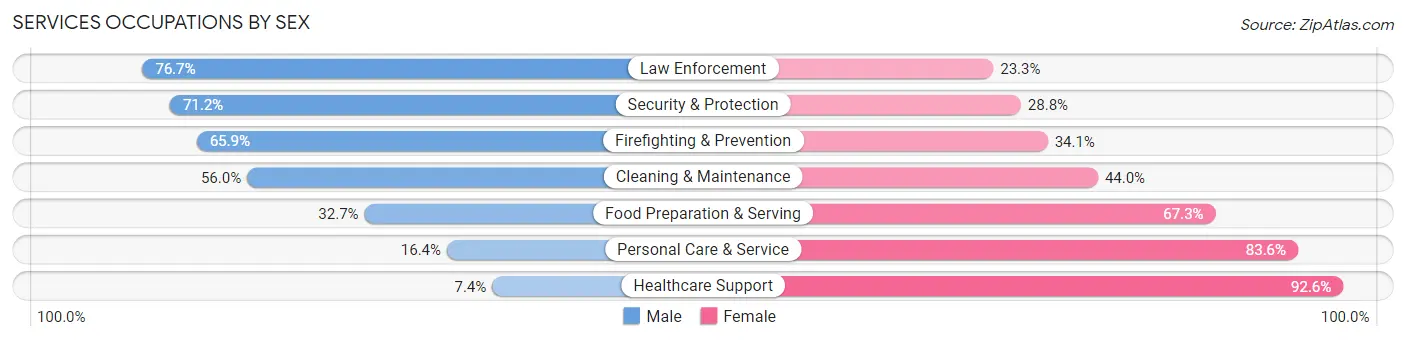
| Occupation | Male | Female |
| Healthcare Support | 165 (7.4%) | 2,059 (92.6%) |
| Security & Protection | 1,786 (71.2%) | 722 (28.8%) |
| Firefighting & Prevention | 839 (65.9%) | 434 (34.1%) |
| Law Enforcement | 947 (76.7%) | 288 (23.3%) |
| Food Preparation & Serving | 1,458 (32.7%) | 3,000 (67.3%) |
| Cleaning & Maintenance | 1,169 (56.0%) | 920 (44.0%) |
| Personal Care & Service | 368 (16.4%) | 1,879 (83.6%) |
| Total (Category) | 4,946 (36.6%) | 8,580 (63.4%) |
| Total (Overall) | 34,303 (49.0%) | 35,633 (50.9%) |
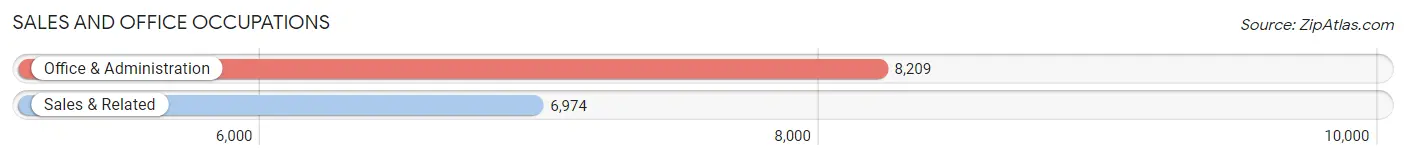
Sales and Office Occupations
The most common Sales and Office occupations in Clarksville are Office & Administration (8,209 | 11.7%), and Sales & Related (6,974 | 10.0%).
Sales and Office Occupations by Sex
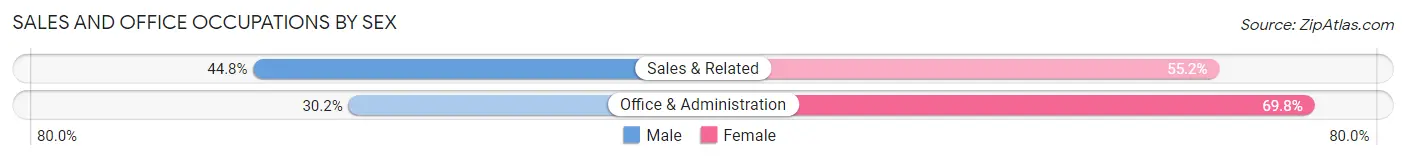
| Occupation | Male | Female |
| Sales & Related | 3,125 (44.8%) | 3,849 (55.2%) |
| Office & Administration | 2,477 (30.2%) | 5,732 (69.8%) |
| Total (Category) | 5,602 (36.9%) | 9,581 (63.1%) |
| Total (Overall) | 34,303 (49.0%) | 35,633 (50.9%) |
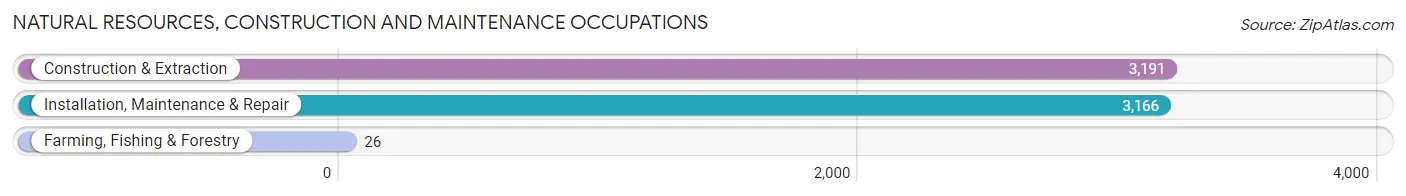
Natural Resources, Construction and Maintenance Occupations
The most common Natural Resources, Construction and Maintenance occupations in Clarksville are Construction & Extraction (3,191 | 4.6%), Installation, Maintenance & Repair (3,166 | 4.5%), and Farming, Fishing & Forestry (26 | 0.0%).
Natural Resources, Construction and Maintenance Occupations by Sex
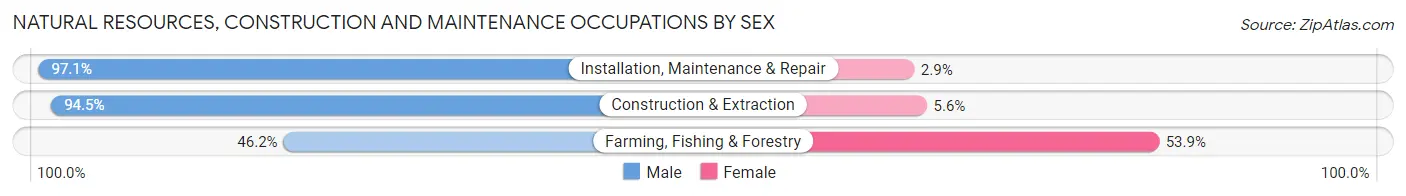
| Occupation | Male | Female |
| Farming, Fishing & Forestry | 12 (46.2%) | 14 (53.8%) |
| Construction & Extraction | 3,014 (94.5%) | 177 (5.6%) |
| Installation, Maintenance & Repair | 3,074 (97.1%) | 92 (2.9%) |
| Total (Category) | 6,100 (95.6%) | 283 (4.4%) |
| Total (Overall) | 34,303 (49.0%) | 35,633 (50.9%) |
Production, Transportation and Moving Occupations
The most common Production, Transportation and Moving occupations in Clarksville are Production (5,444 | 7.8%), Material Moving (3,203 | 4.6%), and Transportation (2,842 | 4.1%).
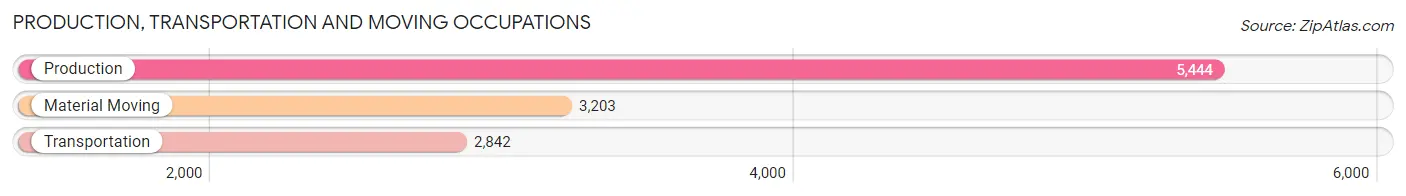
Production, Transportation and Moving Occupations by Sex
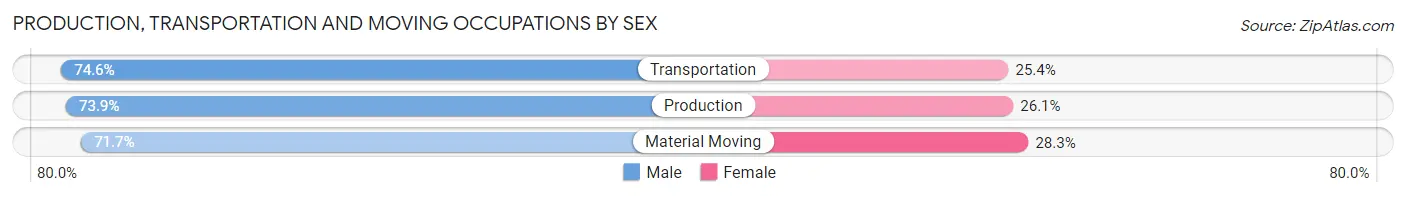
| Occupation | Male | Female |
| Production | 4,023 (73.9%) | 1,421 (26.1%) |
| Transportation | 2,120 (74.6%) | 722 (25.4%) |
| Material Moving | 2,296 (71.7%) | 907 (28.3%) |
| Total (Category) | 8,439 (73.5%) | 3,050 (26.6%) |
| Total (Overall) | 34,303 (49.0%) | 35,633 (50.9%) |
Employment Industries by Sex in Clarksville
Employment Industries in Clarksville
The major employment industries in Clarksville include Health Care & Social Assistance (10,125 | 14.5%), Manufacturing (8,842 | 12.6%), Retail Trade (8,168 | 11.7%), Accommodation & Food Services (6,878 | 9.8%), and Educational Services (5,718 | 8.2%).
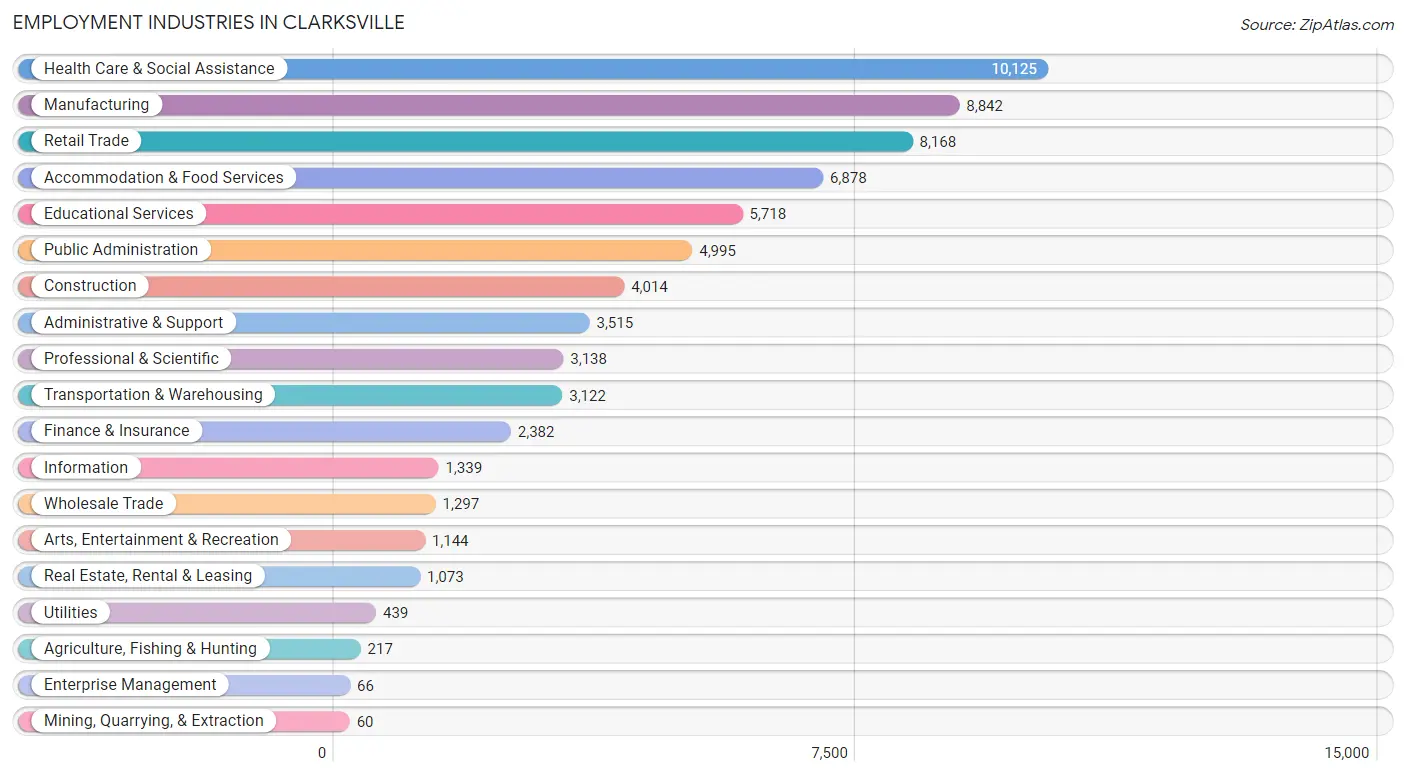
Employment Industries by Sex in Clarksville
The Clarksville industries that see more men than women are Mining, Quarrying, & Extraction (100.0%), Construction (92.4%), and Wholesale Trade (83.8%), whereas the industries that tend to have a higher number of women are Agriculture, Fishing & Hunting (96.8%), Health Care & Social Assistance (83.5%), and Educational Services (76.4%).
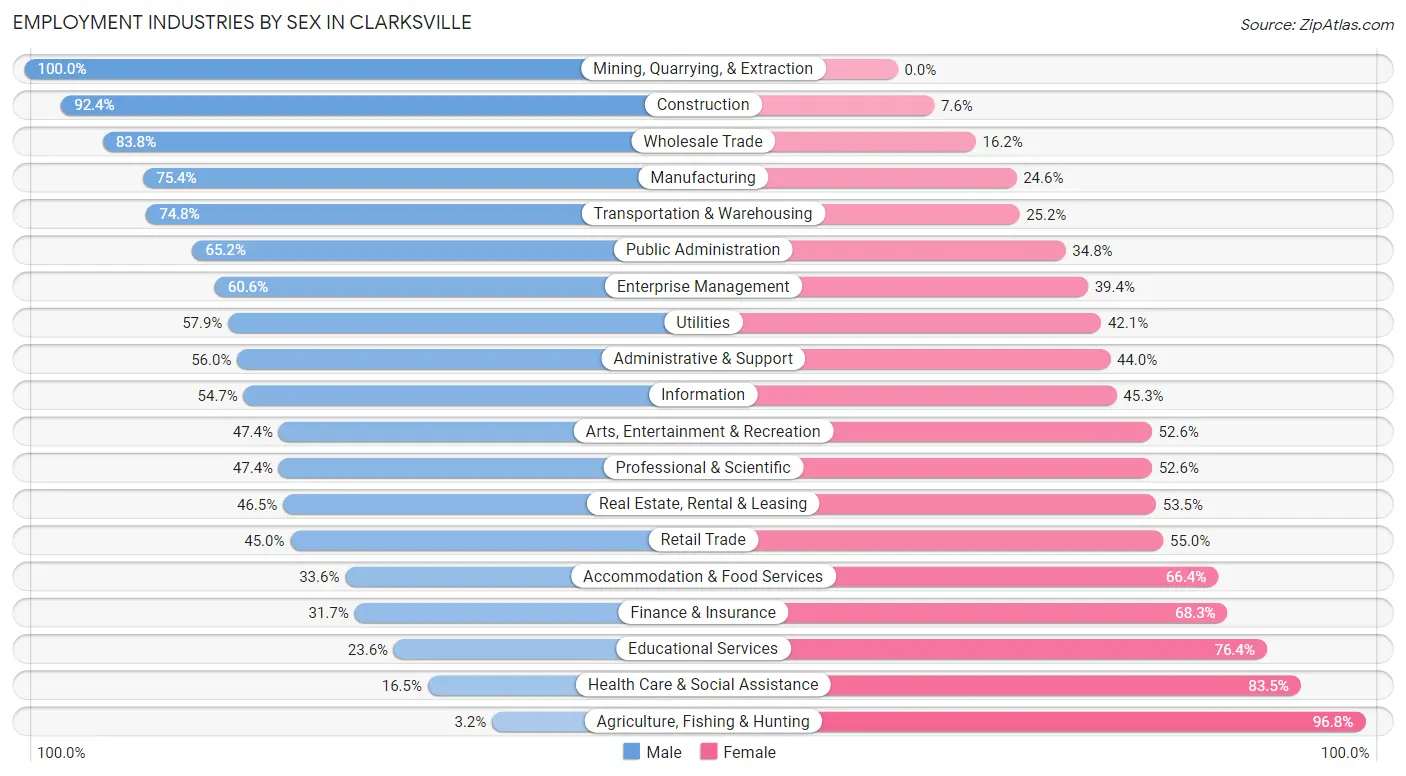
| Industry | Male | Female |
| Agriculture, Fishing & Hunting | 7 (3.2%) | 210 (96.8%) |
| Mining, Quarrying, & Extraction | 60 (100.0%) | 0 (0.0%) |
| Construction | 3,709 (92.4%) | 305 (7.6%) |
| Manufacturing | 6,668 (75.4%) | 2,174 (24.6%) |
| Wholesale Trade | 1,087 (83.8%) | 210 (16.2%) |
| Retail Trade | 3,676 (45.0%) | 4,492 (55.0%) |
| Transportation & Warehousing | 2,335 (74.8%) | 787 (25.2%) |
| Utilities | 254 (57.9%) | 185 (42.1%) |
| Information | 732 (54.7%) | 607 (45.3%) |
| Finance & Insurance | 755 (31.7%) | 1,627 (68.3%) |
| Real Estate, Rental & Leasing | 499 (46.5%) | 574 (53.5%) |
| Professional & Scientific | 1,486 (47.4%) | 1,652 (52.6%) |
| Enterprise Management | 40 (60.6%) | 26 (39.4%) |
| Administrative & Support | 1,968 (56.0%) | 1,547 (44.0%) |
| Educational Services | 1,347 (23.6%) | 4,371 (76.4%) |
| Health Care & Social Assistance | 1,675 (16.5%) | 8,450 (83.5%) |
| Arts, Entertainment & Recreation | 542 (47.4%) | 602 (52.6%) |
| Accommodation & Food Services | 2,313 (33.6%) | 4,565 (66.4%) |
| Public Administration | 3,258 (65.2%) | 1,737 (34.8%) |
| Total | 34,303 (49.0%) | 35,633 (50.9%) |
Education in Clarksville
School Enrollment in Clarksville
The most common levels of schooling among the 45,576 students in Clarksville are college / undergraduate (11,138 | 24.4%), elementary school (9,799 | 21.5%), and middle school (9,405 | 20.6%).
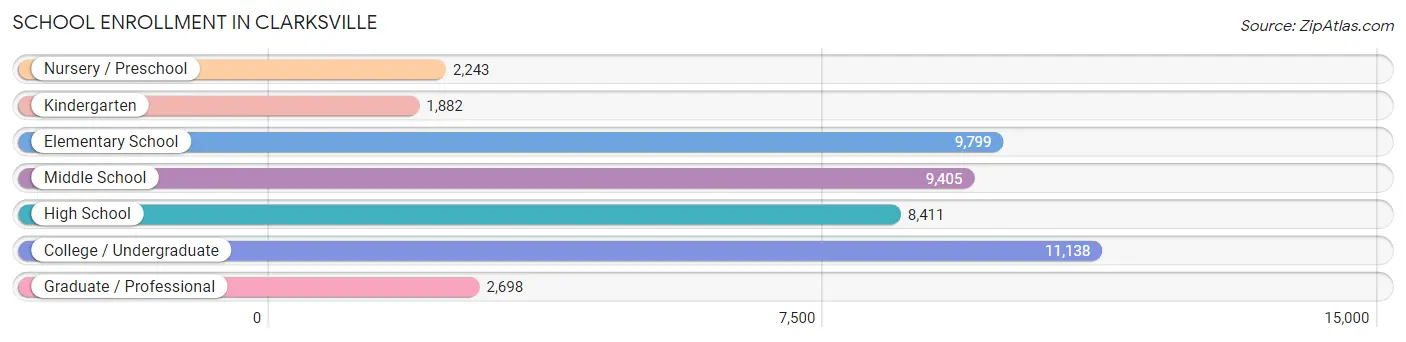
| School Level | # Students | % Students |
| Nursery / Preschool | 2,243 | 4.9% |
| Kindergarten | 1,882 | 4.1% |
| Elementary School | 9,799 | 21.5% |
| Middle School | 9,405 | 20.6% |
| High School | 8,411 | 18.4% |
| College / Undergraduate | 11,138 | 24.4% |
| Graduate / Professional | 2,698 | 5.9% |
| Total | 45,576 | 100.0% |
School Enrollment by Age by Funding Source in Clarksville
Out of a total of 45,576 students who are enrolled in schools in Clarksville, 5,879 (12.9%) attend a private institution, while the remaining 39,697 (87.1%) are enrolled in public schools. The age group of 3 to 4 year olds has the highest likelihood of being enrolled in private schools, with 538 (29.8% in the age bracket) enrolled. Conversely, the age group of 10 to 14 year olds has the lowest likelihood of being enrolled in a private school, with 10,502 (91.6% in the age bracket) attending a public institution.
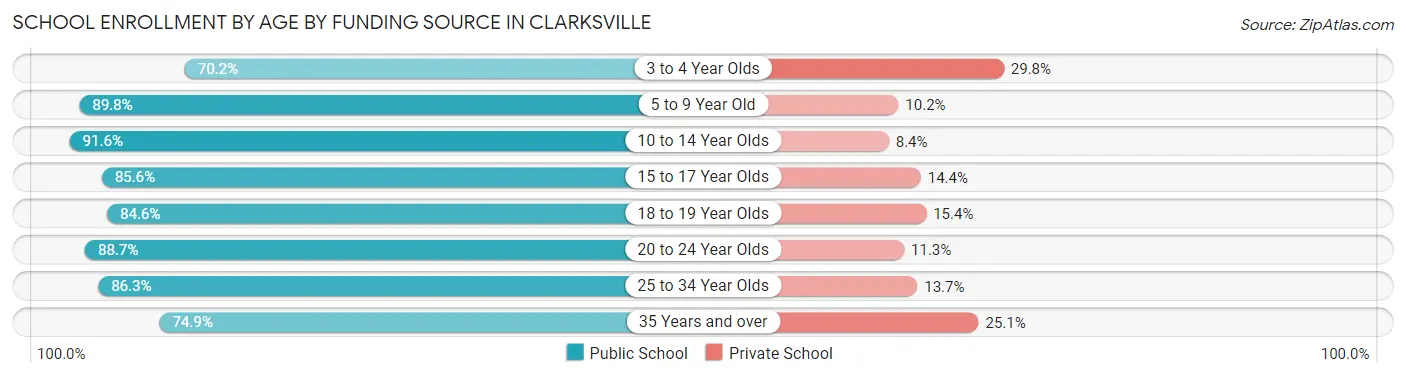
| Age Bracket | Public School | Private School |
| 3 to 4 Year Olds | 1,265 (70.2%) | 538 (29.8%) |
| 5 to 9 Year Old | 9,974 (89.8%) | 1,132 (10.2%) |
| 10 to 14 Year Olds | 10,502 (91.6%) | 963 (8.4%) |
| 15 to 17 Year Olds | 4,975 (85.6%) | 835 (14.4%) |
| 18 to 19 Year Olds | 2,299 (84.6%) | 418 (15.4%) |
| 20 to 24 Year Olds | 4,042 (88.7%) | 513 (11.3%) |
| 25 to 34 Year Olds | 4,366 (86.3%) | 694 (13.7%) |
| 35 Years and over | 2,291 (74.9%) | 769 (25.1%) |
| Total | 39,697 (87.1%) | 5,879 (12.9%) |
Educational Attainment by Field of Study in Clarksville
Business (6,536 | 20.3%), arts & humanities (4,448 | 13.8%), science & technology (3,969 | 12.3%), education (3,403 | 10.6%), and social sciences (2,084 | 6.5%) are the most common fields of study among 32,236 individuals in Clarksville who have obtained a bachelor's degree or higher.
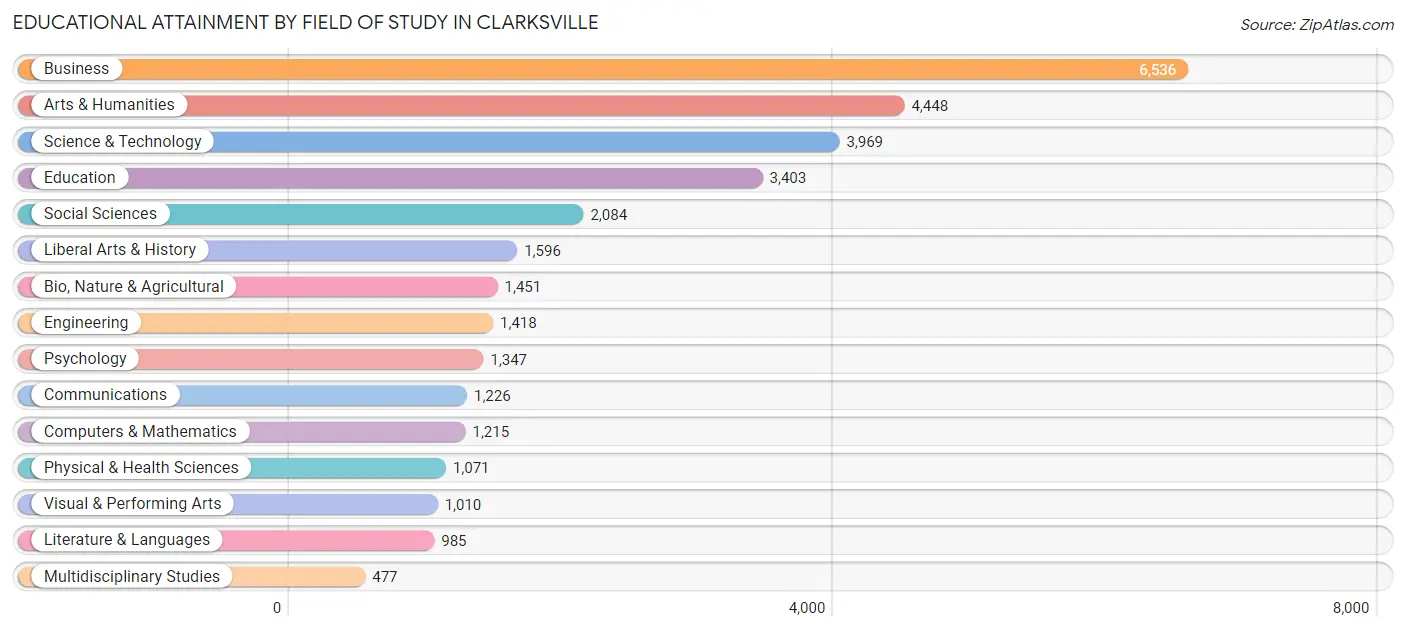
| Field of Study | # Graduates | % Graduates |
| Computers & Mathematics | 1,215 | 3.8% |
| Bio, Nature & Agricultural | 1,451 | 4.5% |
| Physical & Health Sciences | 1,071 | 3.3% |
| Psychology | 1,347 | 4.2% |
| Social Sciences | 2,084 | 6.5% |
| Engineering | 1,418 | 4.4% |
| Multidisciplinary Studies | 477 | 1.5% |
| Science & Technology | 3,969 | 12.3% |
| Business | 6,536 | 20.3% |
| Education | 3,403 | 10.6% |
| Literature & Languages | 985 | 3.1% |
| Liberal Arts & History | 1,596 | 5.0% |
| Visual & Performing Arts | 1,010 | 3.1% |
| Communications | 1,226 | 3.8% |
| Arts & Humanities | 4,448 | 13.8% |
| Total | 32,236 | 100.0% |
Transportation & Commute in Clarksville
Vehicle Availability by Sex in Clarksville
The most prevalent vehicle ownership categories in Clarksville are males with 2 vehicles (18,840, accounting for 45.0%) and females with 2 vehicles (13,717, making up 53.6%).
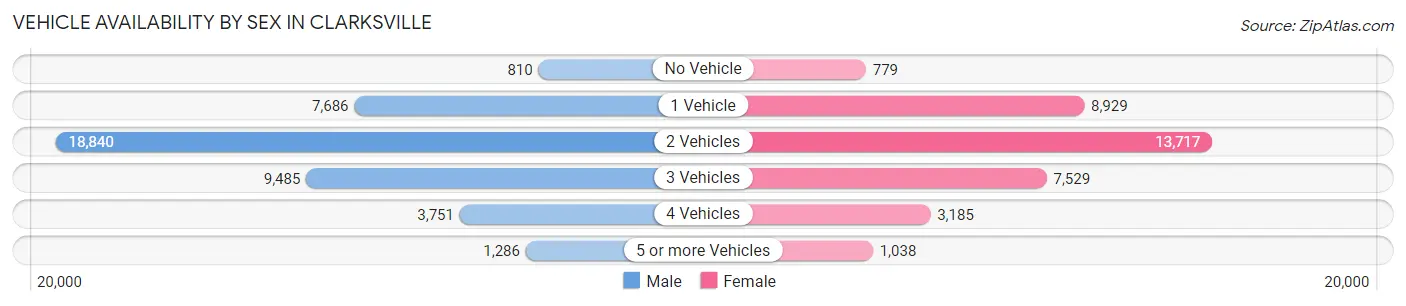
| Vehicles Available | Male | Female |
| No Vehicle | 810 (1.9%) | 779 (2.2%) |
| 1 Vehicle | 7,686 (18.4%) | 8,929 (25.4%) |
| 2 Vehicles | 18,840 (45.0%) | 13,717 (39.0%) |
| 3 Vehicles | 9,485 (22.7%) | 7,529 (21.4%) |
| 4 Vehicles | 3,751 (9.0%) | 3,185 (9.0%) |
| 5 or more Vehicles | 1,286 (3.1%) | 1,038 (2.9%) |
| Total | 41,858 (100.0%) | 35,177 (100.0%) |
Commute Time in Clarksville
The most frequently occuring commute durations in Clarksville are 15 to 19 minutes (14,096 commuters, 19.2%), 20 to 24 minutes (13,636 commuters, 18.5%), and 10 to 14 minutes (10,105 commuters, 13.7%).
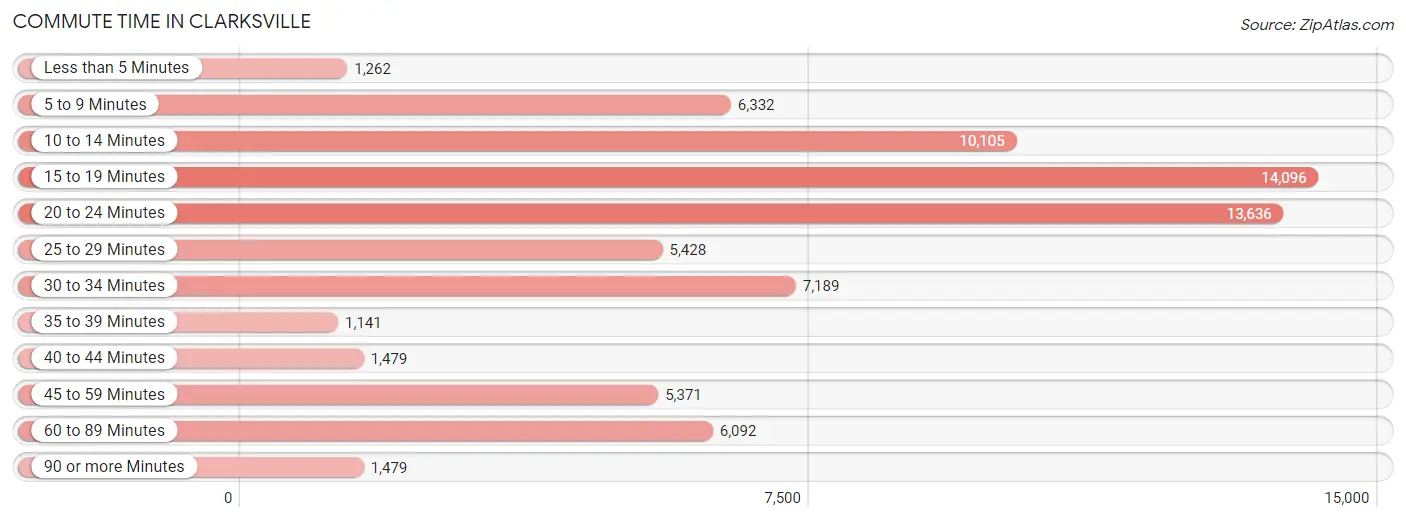
| Commute Time | # Commuters | % Commuters |
| Less than 5 Minutes | 1,262 | 1.7% |
| 5 to 9 Minutes | 6,332 | 8.6% |
| 10 to 14 Minutes | 10,105 | 13.7% |
| 15 to 19 Minutes | 14,096 | 19.2% |
| 20 to 24 Minutes | 13,636 | 18.5% |
| 25 to 29 Minutes | 5,428 | 7.4% |
| 30 to 34 Minutes | 7,189 | 9.8% |
| 35 to 39 Minutes | 1,141 | 1.5% |
| 40 to 44 Minutes | 1,479 | 2.0% |
| 45 to 59 Minutes | 5,371 | 7.3% |
| 60 to 89 Minutes | 6,092 | 8.3% |
| 90 or more Minutes | 1,479 | 2.0% |
Commute Time by Sex in Clarksville
The most common commute times in Clarksville are 20 to 24 minutes (8,075 commuters, 19.6%) for males and 15 to 19 minutes (6,451 commuters, 20.0%) for females.
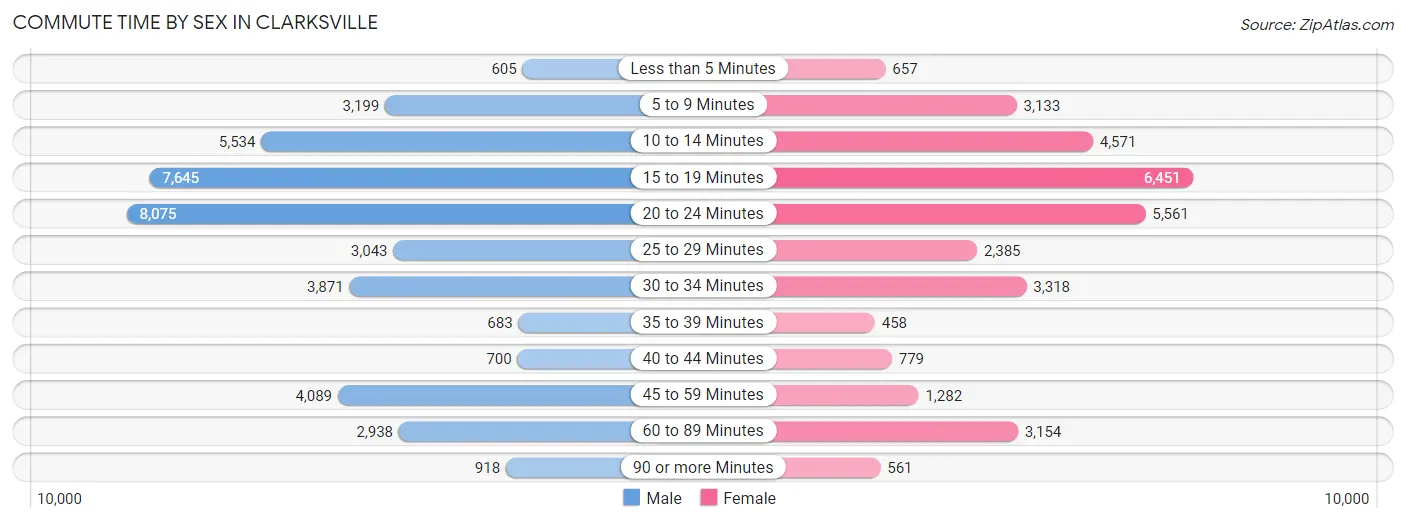
| Commute Time | Male | Female |
| Less than 5 Minutes | 605 (1.5%) | 657 (2.0%) |
| 5 to 9 Minutes | 3,199 (7.7%) | 3,133 (9.7%) |
| 10 to 14 Minutes | 5,534 (13.4%) | 4,571 (14.1%) |
| 15 to 19 Minutes | 7,645 (18.5%) | 6,451 (20.0%) |
| 20 to 24 Minutes | 8,075 (19.6%) | 5,561 (17.2%) |
| 25 to 29 Minutes | 3,043 (7.4%) | 2,385 (7.4%) |
| 30 to 34 Minutes | 3,871 (9.4%) | 3,318 (10.3%) |
| 35 to 39 Minutes | 683 (1.7%) | 458 (1.4%) |
| 40 to 44 Minutes | 700 (1.7%) | 779 (2.4%) |
| 45 to 59 Minutes | 4,089 (9.9%) | 1,282 (4.0%) |
| 60 to 89 Minutes | 2,938 (7.1%) | 3,154 (9.8%) |
| 90 or more Minutes | 918 (2.2%) | 561 (1.7%) |
Time of Departure to Work by Sex in Clarksville
The most frequent times of departure to work in Clarksville are 5:30 AM to 5:59 AM (5,565, 13.5%) for males and 7:30 AM to 7:59 AM (3,458, 10.7%) for females.
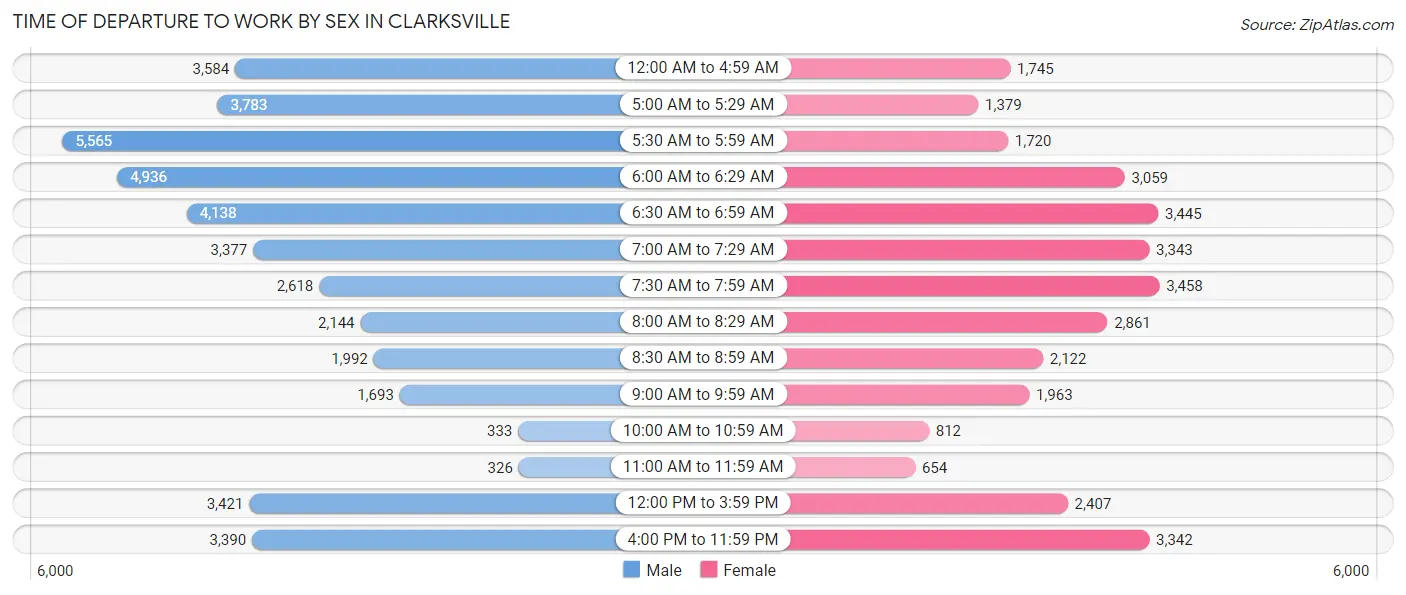
| Time of Departure | Male | Female |
| 12:00 AM to 4:59 AM | 3,584 (8.7%) | 1,745 (5.4%) |
| 5:00 AM to 5:29 AM | 3,783 (9.2%) | 1,379 (4.3%) |
| 5:30 AM to 5:59 AM | 5,565 (13.5%) | 1,720 (5.3%) |
| 6:00 AM to 6:29 AM | 4,936 (11.9%) | 3,059 (9.5%) |
| 6:30 AM to 6:59 AM | 4,138 (10.0%) | 3,445 (10.7%) |
| 7:00 AM to 7:29 AM | 3,377 (8.2%) | 3,343 (10.3%) |
| 7:30 AM to 7:59 AM | 2,618 (6.3%) | 3,458 (10.7%) |
| 8:00 AM to 8:29 AM | 2,144 (5.2%) | 2,861 (8.8%) |
| 8:30 AM to 8:59 AM | 1,992 (4.8%) | 2,122 (6.6%) |
| 9:00 AM to 9:59 AM | 1,693 (4.1%) | 1,963 (6.1%) |
| 10:00 AM to 10:59 AM | 333 (0.8%) | 812 (2.5%) |
| 11:00 AM to 11:59 AM | 326 (0.8%) | 654 (2.0%) |
| 12:00 PM to 3:59 PM | 3,421 (8.3%) | 2,407 (7.4%) |
| 4:00 PM to 11:59 PM | 3,390 (8.2%) | 3,342 (10.3%) |
| Total | 41,300 (100.0%) | 32,310 (100.0%) |
Housing Occupancy in Clarksville
Occupancy by Ownership in Clarksville
Of the total 62,115 dwellings in Clarksville, owner-occupied units account for 34,762 (56.0%), while renter-occupied units make up 27,353 (44.0%).
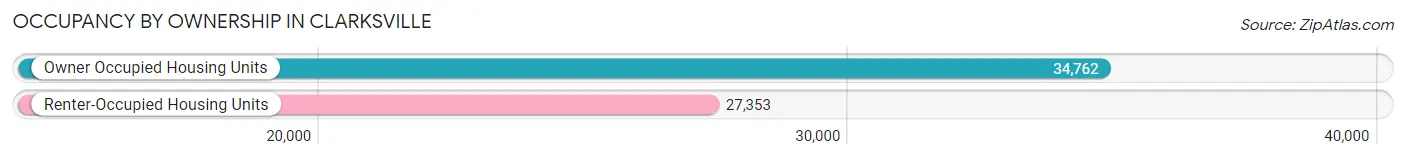
| Occupancy | # Housing Units | % Housing Units |
| Owner Occupied Housing Units | 34,762 | 56.0% |
| Renter-Occupied Housing Units | 27,353 | 44.0% |
| Total Occupied Housing Units | 62,115 | 100.0% |
Occupancy by Household Size in Clarksville
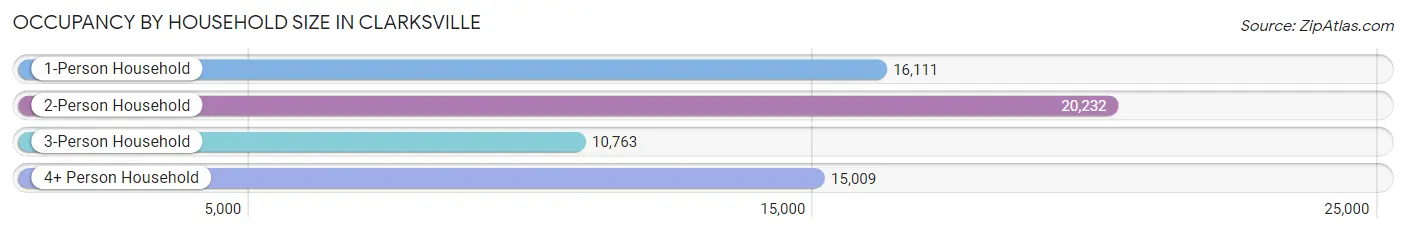
| Household Size | # Housing Units | % Housing Units |
| 1-Person Household | 16,111 | 25.9% |
| 2-Person Household | 20,232 | 32.6% |
| 3-Person Household | 10,763 | 17.3% |
| 4+ Person Household | 15,009 | 24.2% |
| Total Housing Units | 62,115 | 100.0% |
Occupancy by Ownership by Household Size in Clarksville
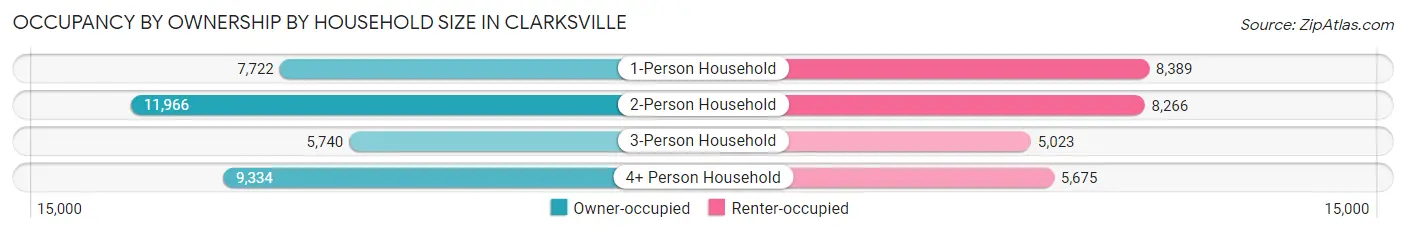
| Household Size | Owner-occupied | Renter-occupied |
| 1-Person Household | 7,722 (47.9%) | 8,389 (52.1%) |
| 2-Person Household | 11,966 (59.1%) | 8,266 (40.9%) |
| 3-Person Household | 5,740 (53.3%) | 5,023 (46.7%) |
| 4+ Person Household | 9,334 (62.2%) | 5,675 (37.8%) |
| Total Housing Units | 34,762 (56.0%) | 27,353 (44.0%) |
Occupancy by Educational Attainment in Clarksville
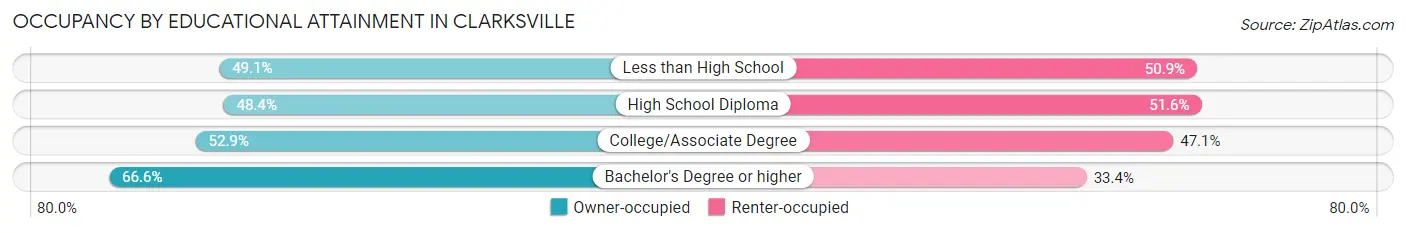
| Household Size | Owner-occupied | Renter-occupied |
| Less than High School | 1,162 (49.1%) | 1,203 (50.9%) |
| High School Diploma | 7,322 (48.4%) | 7,795 (51.6%) |
| College/Associate Degree | 13,274 (52.9%) | 11,833 (47.1%) |
| Bachelor's Degree or higher | 13,004 (66.6%) | 6,522 (33.4%) |
Occupancy by Age of Householder in Clarksville

| Age Bracket | # Households | % Households |
| Under 35 Years | 22,136 | 35.6% |
| 35 to 44 Years | 12,558 | 20.2% |
| 45 to 54 Years | 9,483 | 15.3% |
| 55 to 64 Years | 8,656 | 13.9% |
| 65 to 74 Years | 5,707 | 9.2% |
| 75 to 84 Years | 2,447 | 3.9% |
| 85 Years and Over | 1,128 | 1.8% |
| Total | 62,115 | 100.0% |
Housing Finances in Clarksville
Median Income by Occupancy in Clarksville
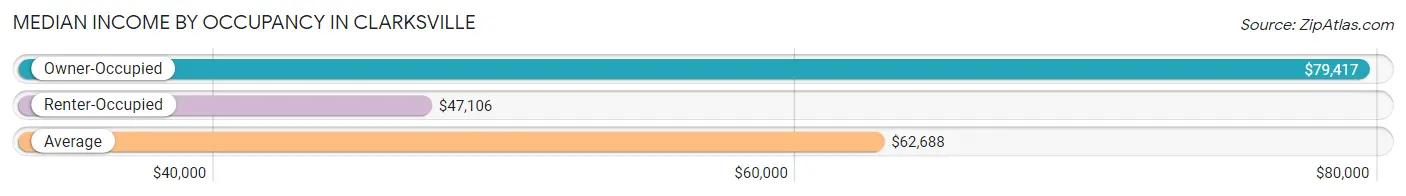
| Occupancy Type | # Households | Median Income |
| Owner-Occupied | 34,762 (56.0%) | $79,417 |
| Renter-Occupied | 27,353 (44.0%) | $47,106 |
| Average | 62,115 (100.0%) | $62,688 |
Occupancy by Householder Income Bracket in Clarksville
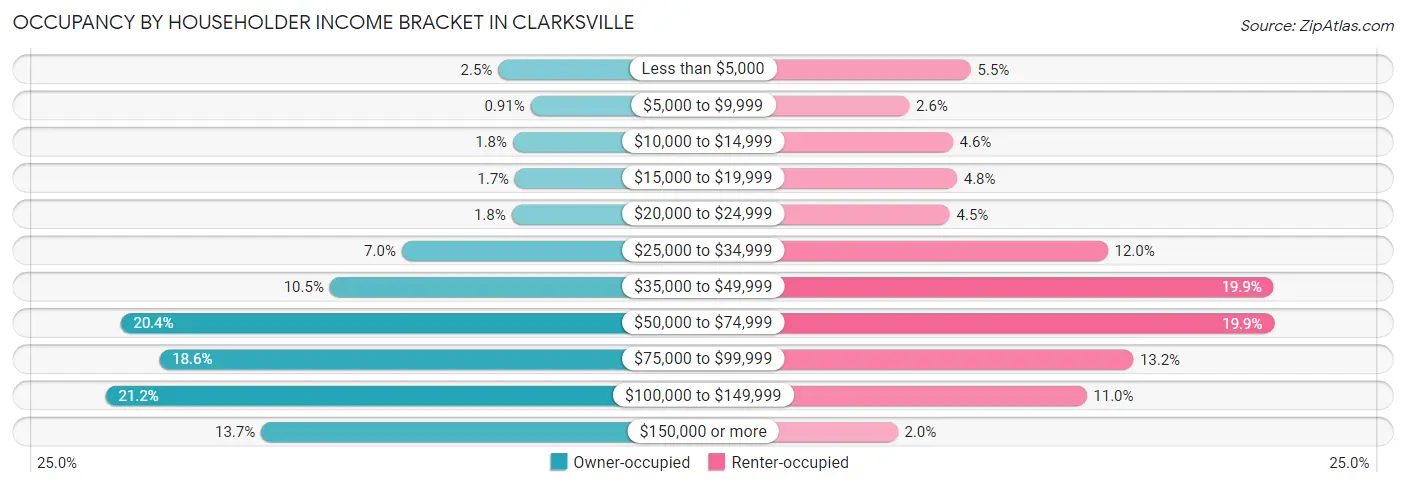
| Income Bracket | Owner-occupied | Renter-occupied |
| Less than $5,000 | 851 (2.5%) | 1,499 (5.5%) |
| $5,000 to $9,999 | 318 (0.9%) | 697 (2.5%) |
| $10,000 to $14,999 | 609 (1.8%) | 1,265 (4.6%) |
| $15,000 to $19,999 | 573 (1.7%) | 1,319 (4.8%) |
| $20,000 to $24,999 | 628 (1.8%) | 1,225 (4.5%) |
| $25,000 to $34,999 | 2,448 (7.0%) | 3,282 (12.0%) |
| $35,000 to $49,999 | 3,639 (10.5%) | 5,446 (19.9%) |
| $50,000 to $74,999 | 7,104 (20.4%) | 5,455 (19.9%) |
| $75,000 to $99,999 | 6,462 (18.6%) | 3,612 (13.2%) |
| $100,000 to $149,999 | 7,353 (21.1%) | 3,006 (11.0%) |
| $150,000 or more | 4,777 (13.7%) | 547 (2.0%) |
| Total | 34,762 (100.0%) | 27,353 (100.0%) |
Monthly Housing Cost Tiers in Clarksville
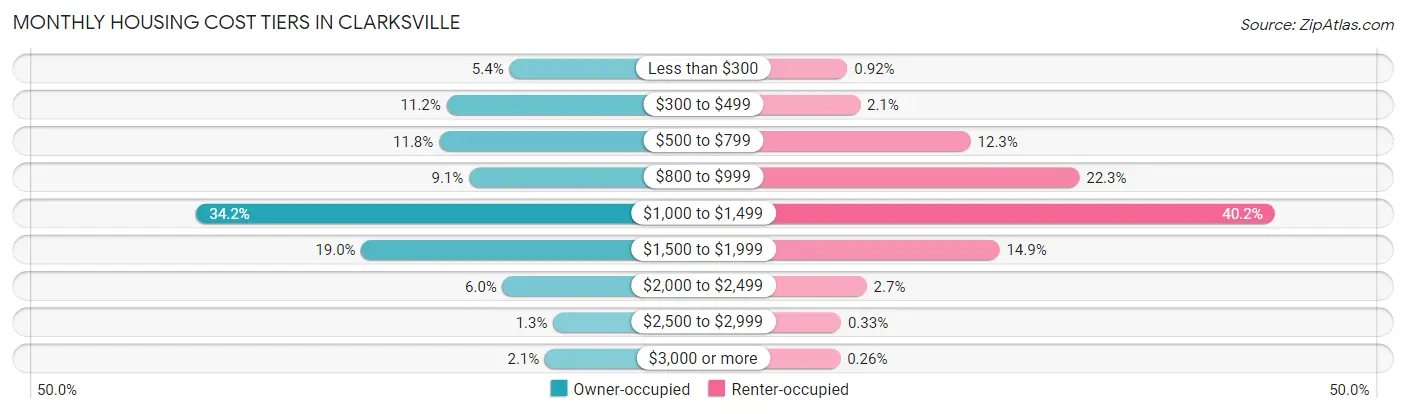
| Monthly Cost | Owner-occupied | Renter-occupied |
| Less than $300 | 1,863 (5.4%) | 253 (0.9%) |
| $300 to $499 | 3,875 (11.2%) | 569 (2.1%) |
| $500 to $799 | 4,115 (11.8%) | 3,354 (12.3%) |
| $800 to $999 | 3,155 (9.1%) | 6,091 (22.3%) |
| $1,000 to $1,499 | 11,883 (34.2%) | 11,008 (40.2%) |
| $1,500 to $1,999 | 6,602 (19.0%) | 4,082 (14.9%) |
| $2,000 to $2,499 | 2,081 (6.0%) | 737 (2.7%) |
| $2,500 to $2,999 | 464 (1.3%) | 90 (0.3%) |
| $3,000 or more | 724 (2.1%) | 72 (0.3%) |
| Total | 34,762 (100.0%) | 27,353 (100.0%) |
Physical Housing Characteristics in Clarksville
Housing Structures in Clarksville
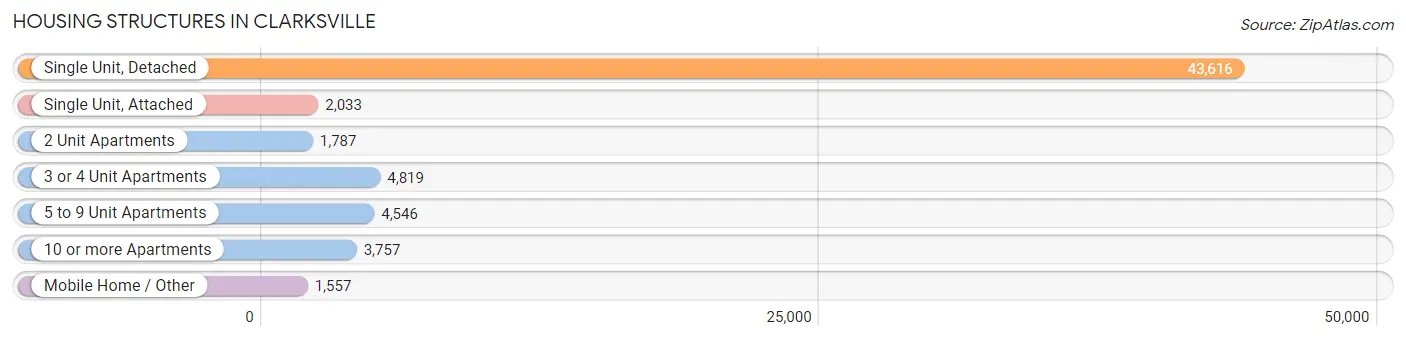
| Structure Type | # Housing Units | % Housing Units |
| Single Unit, Detached | 43,616 | 70.2% |
| Single Unit, Attached | 2,033 | 3.3% |
| 2 Unit Apartments | 1,787 | 2.9% |
| 3 or 4 Unit Apartments | 4,819 | 7.8% |
| 5 to 9 Unit Apartments | 4,546 | 7.3% |
| 10 or more Apartments | 3,757 | 6.0% |
| Mobile Home / Other | 1,557 | 2.5% |
| Total | 62,115 | 100.0% |
Housing Structures by Occupancy in Clarksville
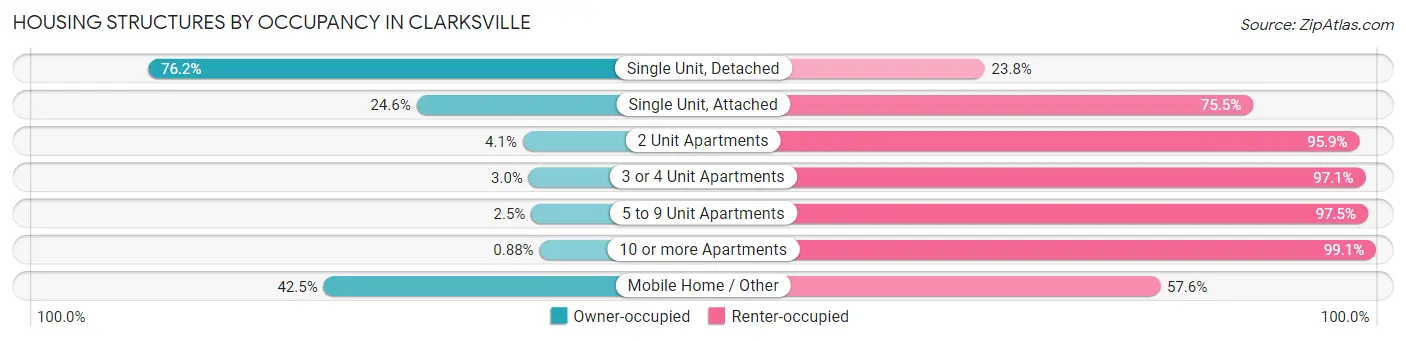
| Structure Type | Owner-occupied | Renter-occupied |
| Single Unit, Detached | 33,242 (76.2%) | 10,374 (23.8%) |
| Single Unit, Attached | 499 (24.5%) | 1,534 (75.4%) |
| 2 Unit Apartments | 73 (4.1%) | 1,714 (95.9%) |
| 3 or 4 Unit Apartments | 142 (2.9%) | 4,677 (97.1%) |
| 5 to 9 Unit Apartments | 112 (2.5%) | 4,434 (97.5%) |
| 10 or more Apartments | 33 (0.9%) | 3,724 (99.1%) |
| Mobile Home / Other | 661 (42.4%) | 896 (57.6%) |
| Total | 34,762 (56.0%) | 27,353 (44.0%) |
Housing Structures by Number of Rooms in Clarksville
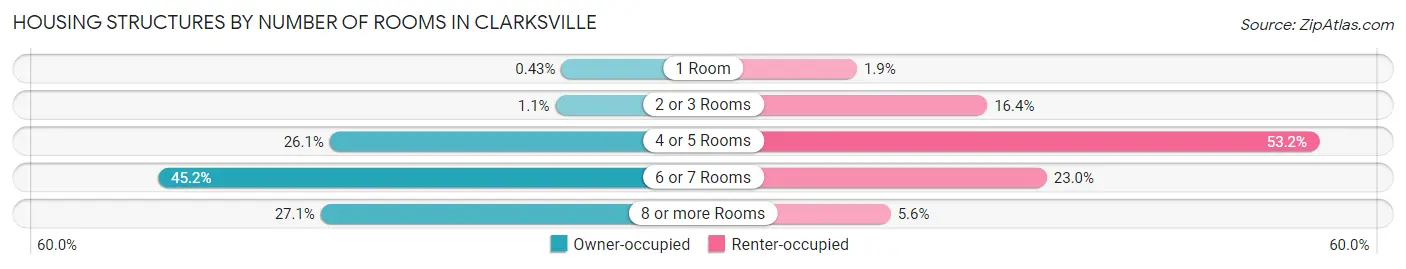
| Number of Rooms | Owner-occupied | Renter-occupied |
| 1 Room | 149 (0.4%) | 518 (1.9%) |
| 2 or 3 Rooms | 380 (1.1%) | 4,471 (16.4%) |
| 4 or 5 Rooms | 9,088 (26.1%) | 14,538 (53.1%) |
| 6 or 7 Rooms | 15,709 (45.2%) | 6,282 (23.0%) |
| 8 or more Rooms | 9,436 (27.1%) | 1,544 (5.6%) |
| Total | 34,762 (100.0%) | 27,353 (100.0%) |
Housing Structure by Heating Type in Clarksville
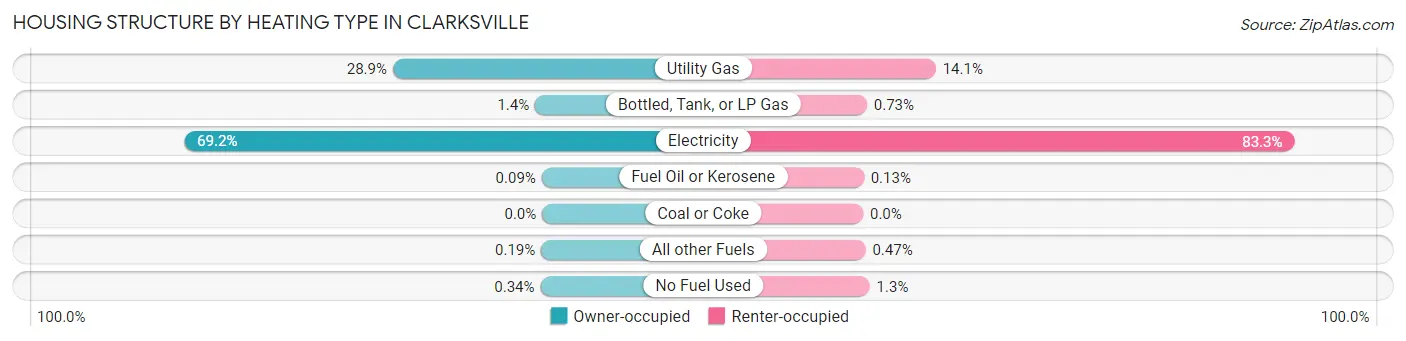
| Heating Type | Owner-occupied | Renter-occupied |
| Utility Gas | 10,029 (28.8%) | 3,844 (14.1%) |
| Bottled, Tank, or LP Gas | 476 (1.4%) | 200 (0.7%) |
| Electricity | 24,041 (69.2%) | 22,794 (83.3%) |
| Fuel Oil or Kerosene | 30 (0.1%) | 36 (0.1%) |
| Coal or Coke | 0 (0.0%) | 0 (0.0%) |
| All other Fuels | 67 (0.2%) | 128 (0.5%) |
| No Fuel Used | 119 (0.3%) | 351 (1.3%) |
| Total | 34,762 (100.0%) | 27,353 (100.0%) |
Household Vehicle Usage in Clarksville
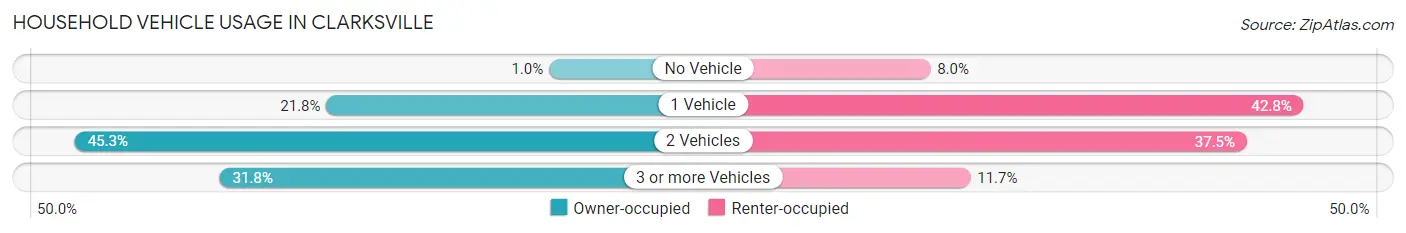
| Vehicles per Household | Owner-occupied | Renter-occupied |
| No Vehicle | 362 (1.0%) | 2,178 (8.0%) |
| 1 Vehicle | 7,589 (21.8%) | 11,713 (42.8%) |
| 2 Vehicles | 15,755 (45.3%) | 10,262 (37.5%) |
| 3 or more Vehicles | 11,056 (31.8%) | 3,200 (11.7%) |
| Total | 34,762 (100.0%) | 27,353 (100.0%) |
Real Estate & Mortgages in Clarksville
Real Estate and Mortgage Overview in Clarksville
| Characteristic | Without Mortgage | With Mortgage |
| Housing Units | 9,456 | 25,306 |
| Median Property Value | $189,200 | $219,300 |
| Median Household Income | $60,143 | $3,751 |
| Monthly Housing Costs | $458 | $713 |
| Real Estate Taxes | $1,467 | $902 |
Property Value by Mortgage Status in Clarksville
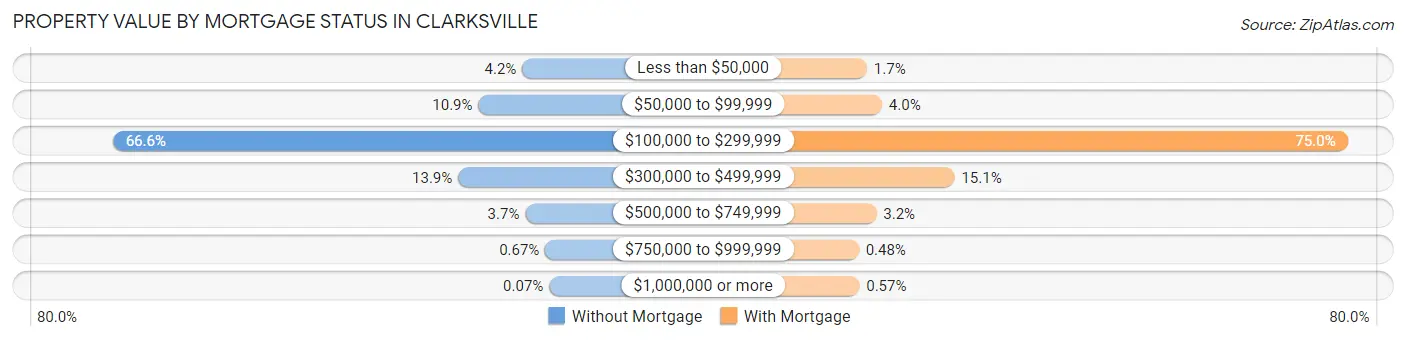
| Property Value | Without Mortgage | With Mortgage |
| Less than $50,000 | 395 (4.2%) | 437 (1.7%) |
| $50,000 to $99,999 | 1,027 (10.9%) | 1,017 (4.0%) |
| $100,000 to $299,999 | 6,295 (66.6%) | 18,969 (75.0%) |
| $300,000 to $499,999 | 1,318 (13.9%) | 3,817 (15.1%) |
| $500,000 to $749,999 | 351 (3.7%) | 801 (3.2%) |
| $750,000 to $999,999 | 63 (0.7%) | 122 (0.5%) |
| $1,000,000 or more | 7 (0.1%) | 143 (0.6%) |
| Total | 9,456 (100.0%) | 25,306 (100.0%) |
Household Income by Mortgage Status in Clarksville
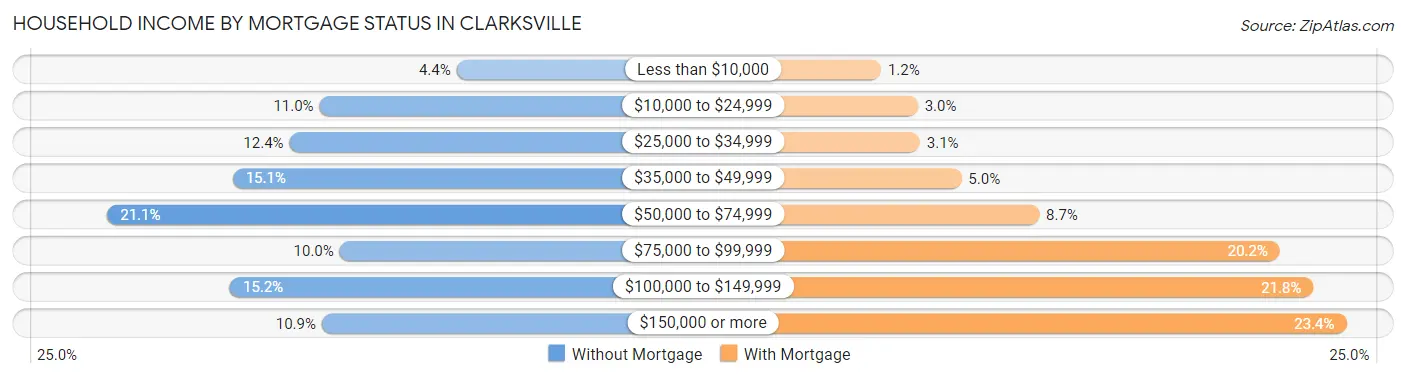
| Household Income | Without Mortgage | With Mortgage |
| Less than $10,000 | 419 (4.4%) | 305 (1.2%) |
| $10,000 to $24,999 | 1,036 (11.0%) | 750 (3.0%) |
| $25,000 to $34,999 | 1,172 (12.4%) | 774 (3.1%) |
| $35,000 to $49,999 | 1,427 (15.1%) | 1,276 (5.0%) |
| $50,000 to $74,999 | 1,991 (21.1%) | 2,212 (8.7%) |
| $75,000 to $99,999 | 946 (10.0%) | 5,113 (20.2%) |
| $100,000 to $149,999 | 1,439 (15.2%) | 5,516 (21.8%) |
| $150,000 or more | 1,026 (10.8%) | 5,914 (23.4%) |
| Total | 9,456 (100.0%) | 25,306 (100.0%) |
Property Value to Household Income Ratio in Clarksville
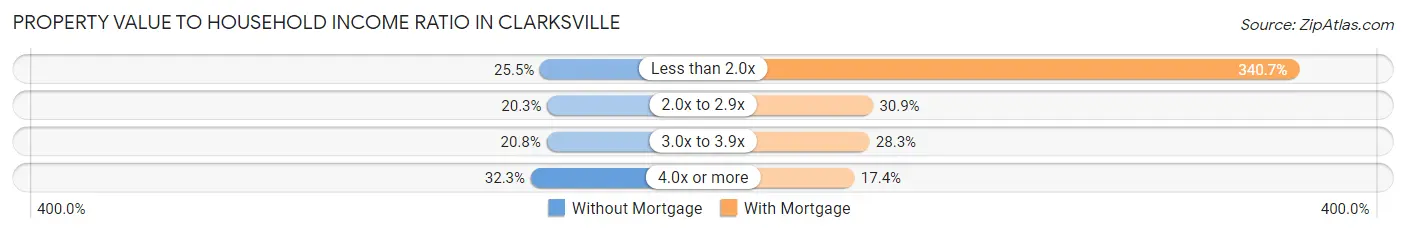
| Value-to-Income Ratio | Without Mortgage | With Mortgage |
| Less than 2.0x | 2,410 (25.5%) | 86,227 (340.7%) |
| 2.0x to 2.9x | 1,915 (20.3%) | 7,819 (30.9%) |
| 3.0x to 3.9x | 1,971 (20.8%) | 7,170 (28.3%) |
| 4.0x or more | 3,050 (32.3%) | 4,407 (17.4%) |
| Total | 9,456 (100.0%) | 25,306 (100.0%) |
Real Estate Taxes by Mortgage Status in Clarksville
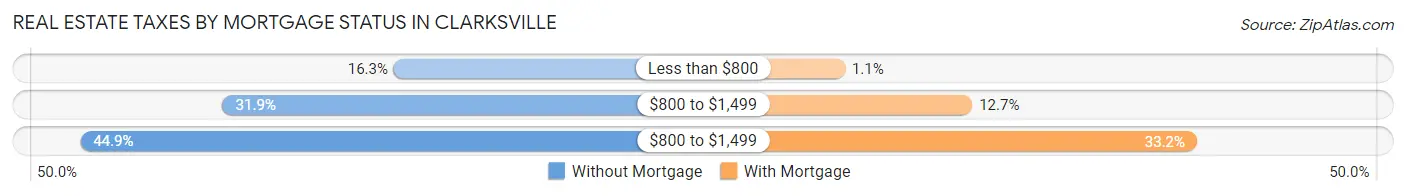
| Property Taxes | Without Mortgage | With Mortgage |
| Less than $800 | 1,539 (16.3%) | 277 (1.1%) |
| $800 to $1,499 | 3,017 (31.9%) | 3,216 (12.7%) |
| $800 to $1,499 | 4,248 (44.9%) | 8,406 (33.2%) |
| Total | 9,456 (100.0%) | 25,306 (100.0%) |
Health & Disability in Clarksville
Health Insurance Coverage by Age in Clarksville
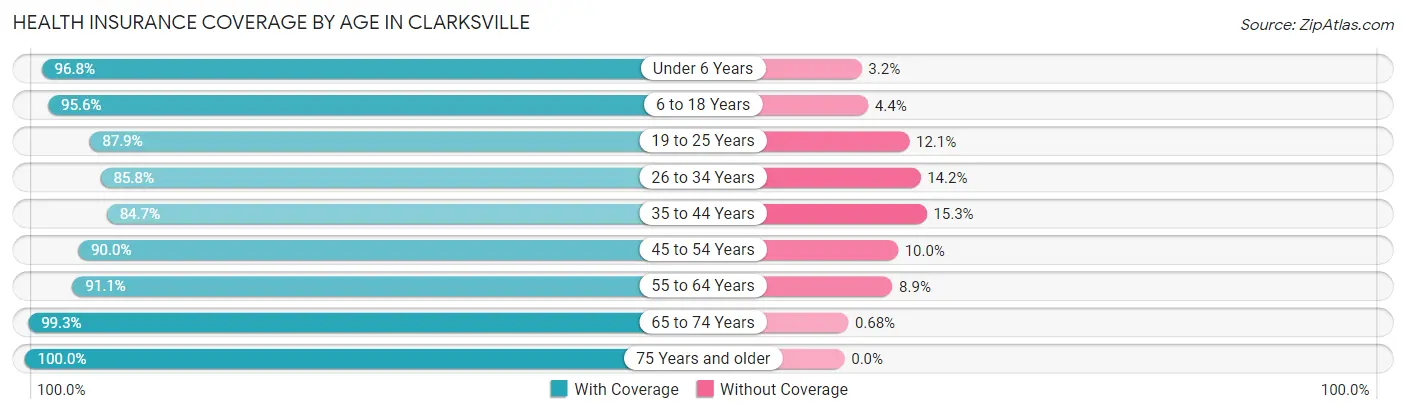
| Age Bracket | With Coverage | Without Coverage |
| Under 6 Years | 16,561 (96.8%) | 546 (3.2%) |
| 6 to 18 Years | 28,732 (95.6%) | 1,322 (4.4%) |
| 19 to 25 Years | 15,857 (87.9%) | 2,178 (12.1%) |
| 26 to 34 Years | 21,455 (85.8%) | 3,538 (14.2%) |
| 35 to 44 Years | 17,766 (84.7%) | 3,214 (15.3%) |
| 45 to 54 Years | 14,050 (90.0%) | 1,555 (10.0%) |
| 55 to 64 Years | 13,369 (91.1%) | 1,310 (8.9%) |
| 65 to 74 Years | 9,354 (99.3%) | 64 (0.7%) |
| 75 Years and older | 4,900 (100.0%) | 0 (0.0%) |
| Total | 142,044 (91.2%) | 13,727 (8.8%) |
Health Insurance Coverage by Citizenship Status in Clarksville
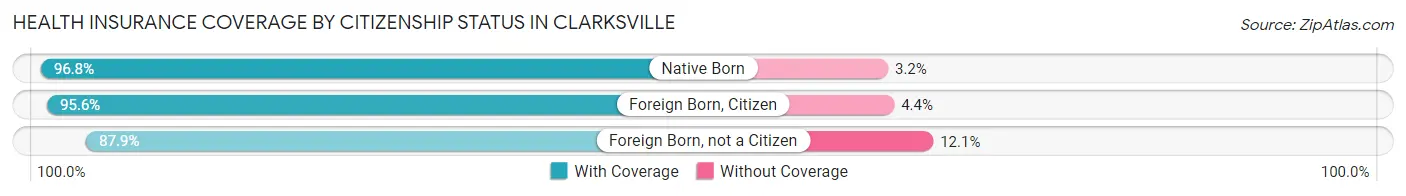
| Citizenship Status | With Coverage | Without Coverage |
| Native Born | 16,561 (96.8%) | 546 (3.2%) |
| Foreign Born, Citizen | 28,732 (95.6%) | 1,322 (4.4%) |
| Foreign Born, not a Citizen | 15,857 (87.9%) | 2,178 (12.1%) |
Health Insurance Coverage by Household Income in Clarksville
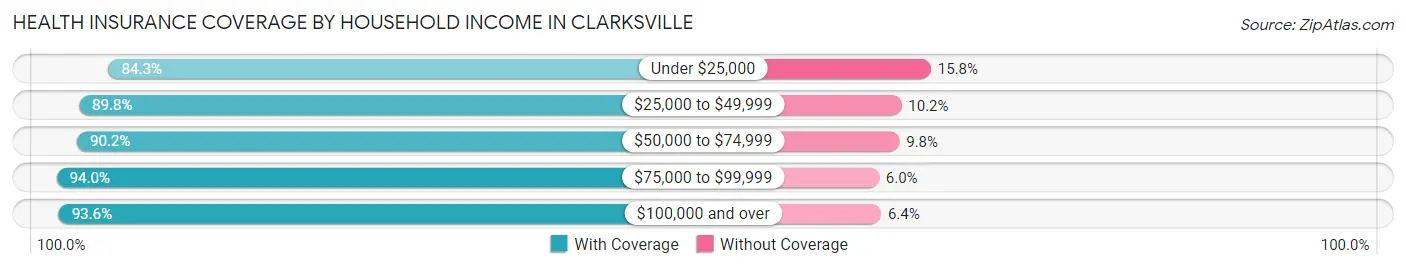
| Household Income | With Coverage | Without Coverage |
| Under $25,000 | 14,623 (84.3%) | 2,733 (15.8%) |
| $25,000 to $49,999 | 27,837 (89.8%) | 3,169 (10.2%) |
| $50,000 to $74,999 | 25,460 (90.2%) | 2,775 (9.8%) |
| $75,000 to $99,999 | 28,221 (94.0%) | 1,804 (6.0%) |
| $100,000 and over | 44,897 (93.6%) | 3,071 (6.4%) |
Public vs Private Health Insurance Coverage by Age in Clarksville
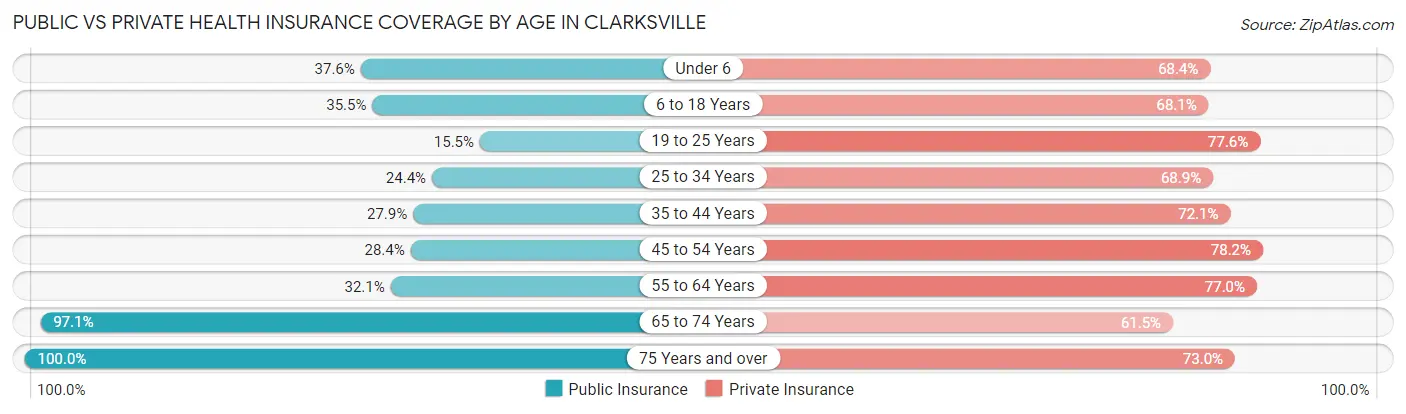
| Age Bracket | Public Insurance | Private Insurance |
| Under 6 | 6,438 (37.6%) | 11,696 (68.4%) |
| 6 to 18 Years | 10,656 (35.5%) | 20,463 (68.1%) |
| 19 to 25 Years | 2,795 (15.5%) | 14,003 (77.6%) |
| 25 to 34 Years | 6,099 (24.4%) | 17,217 (68.9%) |
| 35 to 44 Years | 5,854 (27.9%) | 15,126 (72.1%) |
| 45 to 54 Years | 4,425 (28.4%) | 12,196 (78.1%) |
| 55 to 64 Years | 4,707 (32.1%) | 11,308 (77.0%) |
| 65 to 74 Years | 9,144 (97.1%) | 5,788 (61.5%) |
| 75 Years and over | 4,900 (100.0%) | 3,575 (73.0%) |
| Total | 55,018 (35.3%) | 111,372 (71.5%) |
Disability Status by Sex by Age in Clarksville
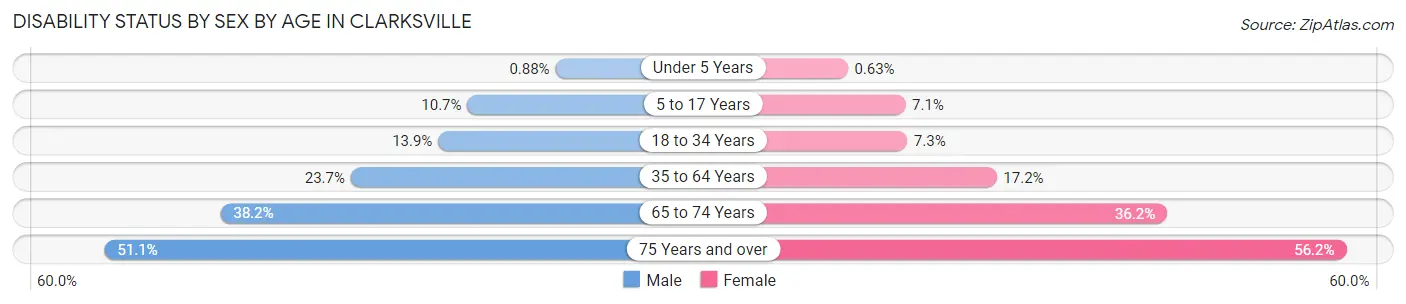
| Age Bracket | Male | Female |
| Under 5 Years | 67 (0.9%) | 43 (0.6%) |
| 5 to 17 Years | 1,681 (10.7%) | 1,055 (7.0%) |
| 18 to 34 Years | 2,848 (13.9%) | 1,782 (7.2%) |
| 35 to 64 Years | 5,742 (23.7%) | 4,649 (17.2%) |
| 65 to 74 Years | 1,593 (38.2%) | 1,901 (36.2%) |
| 75 Years and over | 1,107 (51.1%) | 1,536 (56.2%) |
Disability Class by Sex by Age in Clarksville
Disability Class: Hearing Difficulty
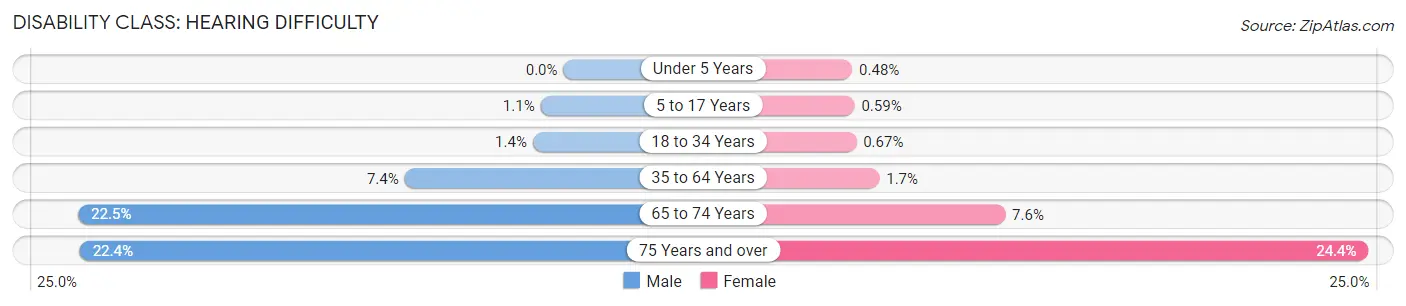
| Age Bracket | Male | Female |
| Under 5 Years | 0 (0.0%) | 33 (0.5%) |
| 5 to 17 Years | 167 (1.1%) | 88 (0.6%) |
| 18 to 34 Years | 291 (1.4%) | 164 (0.7%) |
| 35 to 64 Years | 1,788 (7.4%) | 471 (1.7%) |
| 65 to 74 Years | 939 (22.5%) | 398 (7.6%) |
| 75 Years and over | 486 (22.4%) | 668 (24.4%) |
Disability Class: Vision Difficulty
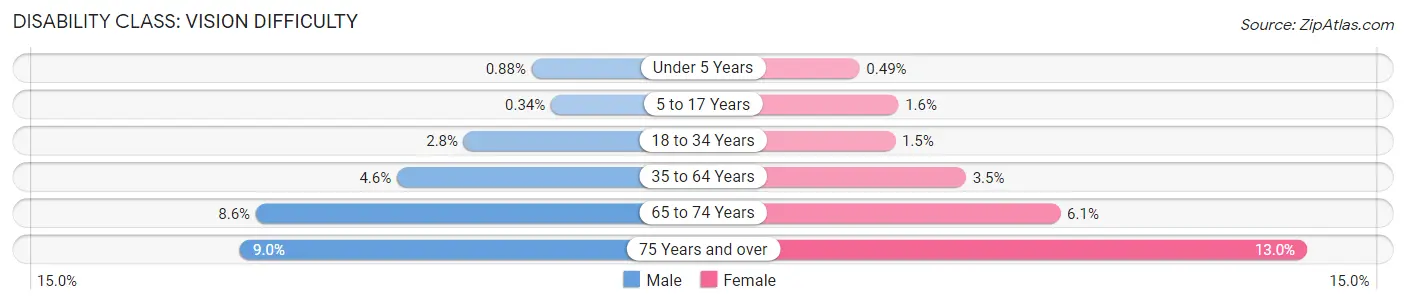
| Age Bracket | Male | Female |
| Under 5 Years | 67 (0.9%) | 34 (0.5%) |
| 5 to 17 Years | 53 (0.3%) | 235 (1.6%) |
| 18 to 34 Years | 566 (2.8%) | 363 (1.5%) |
| 35 to 64 Years | 1,122 (4.6%) | 931 (3.5%) |
| 65 to 74 Years | 357 (8.6%) | 319 (6.1%) |
| 75 Years and over | 195 (9.0%) | 354 (13.0%) |
Disability Class: Cognitive Difficulty
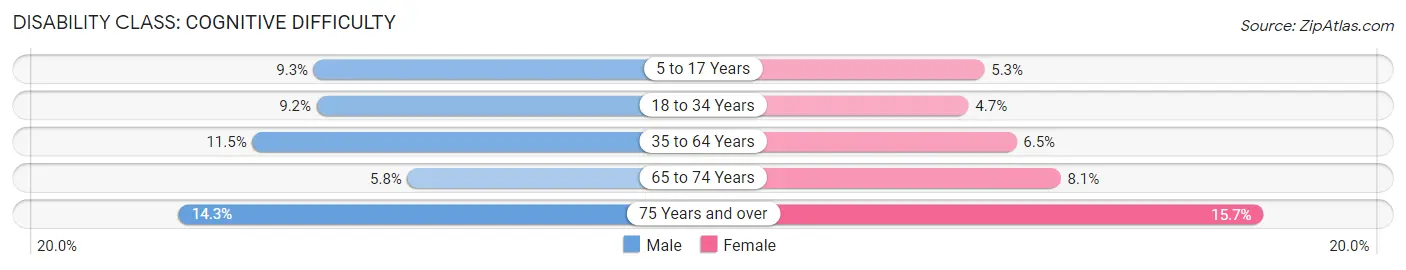
| Age Bracket | Male | Female |
| 5 to 17 Years | 1,457 (9.3%) | 791 (5.3%) |
| 18 to 34 Years | 1,869 (9.1%) | 1,156 (4.7%) |
| 35 to 64 Years | 2,800 (11.5%) | 1,750 (6.5%) |
| 65 to 74 Years | 241 (5.8%) | 426 (8.1%) |
| 75 Years and over | 309 (14.3%) | 428 (15.7%) |
Disability Class: Ambulatory Difficulty
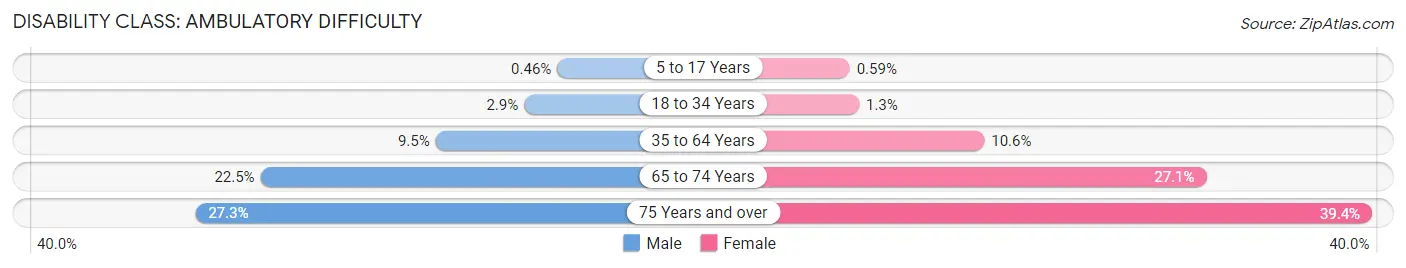
| Age Bracket | Male | Female |
| 5 to 17 Years | 72 (0.5%) | 88 (0.6%) |
| 18 to 34 Years | 596 (2.9%) | 314 (1.3%) |
| 35 to 64 Years | 2,301 (9.5%) | 2,857 (10.6%) |
| 65 to 74 Years | 938 (22.5%) | 1,420 (27.1%) |
| 75 Years and over | 592 (27.3%) | 1,076 (39.4%) |
Disability Class: Self-Care Difficulty
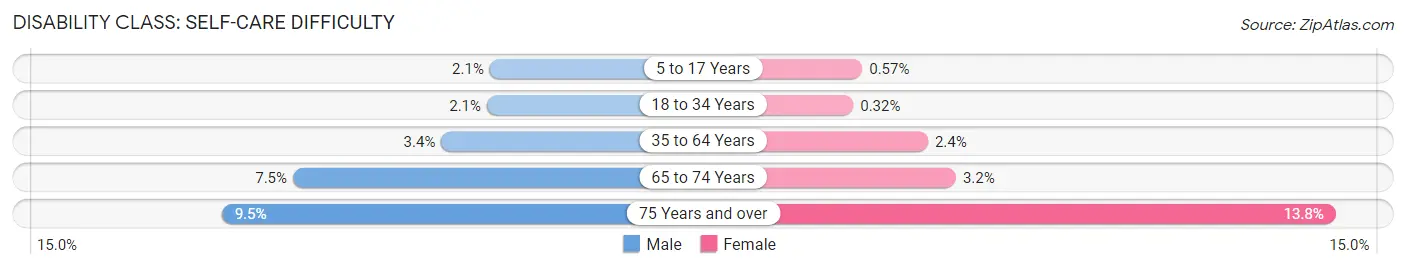
| Age Bracket | Male | Female |
| 5 to 17 Years | 322 (2.1%) | 85 (0.6%) |
| 18 to 34 Years | 435 (2.1%) | 78 (0.3%) |
| 35 to 64 Years | 824 (3.4%) | 649 (2.4%) |
| 65 to 74 Years | 314 (7.5%) | 167 (3.2%) |
| 75 Years and over | 206 (9.5%) | 376 (13.8%) |
Technology Access in Clarksville
Computing Device Access in Clarksville
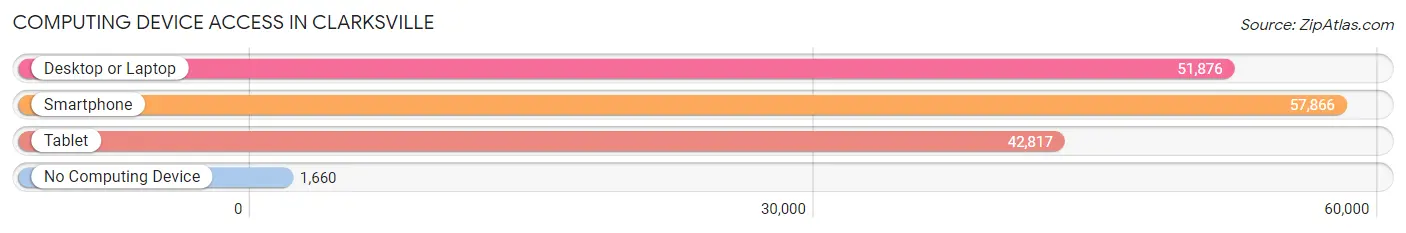
| Device Type | # Households | % Households |
| Desktop or Laptop | 51,876 | 83.5% |
| Smartphone | 57,866 | 93.2% |
| Tablet | 42,817 | 68.9% |
| No Computing Device | 1,660 | 2.7% |
| Total | 62,115 | 100.0% |
Internet Access in Clarksville
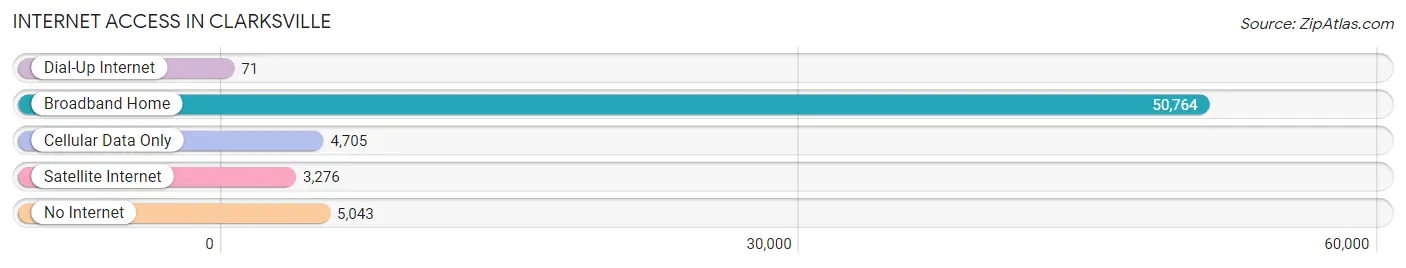
| Internet Type | # Households | % Households |
| Dial-Up Internet | 71 | 0.1% |
| Broadband Home | 50,764 | 81.7% |
| Cellular Data Only | 4,705 | 7.6% |
| Satellite Internet | 3,276 | 5.3% |
| No Internet | 5,043 | 8.1% |
| Total | 62,115 | 100.0% |
Clarksville Summary
Clarksville, Tennessee is a city located in Montgomery County, Tennessee, United States. It is the county seat of Montgomery County and the fifth-largest city in the state. The population of Clarksville was 132,929 according to the 2019 census, making it the largest city in the state outside of the Nashville metropolitan area.
History
Clarksville was founded in 1784 by General George Rogers Clark, a Revolutionary War hero. The city was named after him and was the first incorporated city in the state of Tennessee. The city was originally part of the Northwest Territory and was part of the state of Tennessee when it was admitted to the Union in 1796.
Clarksville was an important center of commerce during the 19th century. It was a major port on the Cumberland River and was the site of several important battles during the Civil War. The city was also the site of the first African-American college in the state, the Tennessee Normal and Industrial Institute, which was founded in 1876.
Geography
Clarksville is located in the northwest corner of Tennessee, near the Kentucky border. It is situated on the banks of the Cumberland River, which flows through the city. The city is located in a hilly region of the state, with the highest point being the summit of Dunbar Cave, which is located just outside of the city limits.
The city has a total area of 95.5 square miles, of which 94.7 square miles is land and 0.8 square miles is water. The city is located in the Central Time Zone and has a humid subtropical climate.
Economy
Clarksville is a major economic center in the region. The city is home to several large employers, including the U.S. Army's Fort Campbell, the Austin Peay State University, and the Clarksville-Montgomery County School System. The city is also home to several large manufacturing companies, including Bridgestone, Hankook Tire, and LG Electronics.
The city's economy is also supported by tourism, with the city being home to several attractions, including the Dunbar Cave State Park, the Customs House Museum and Cultural Center, and the Roxy Regional Theatre.
Demographics
As of the 2019 census, the population of Clarksville was 132,929, making it the fifth-largest city in the state. The city has a population density of 1,400 people per square mile. The median age of the population is 33.7 years, and the median household income is $50,945.
The racial makeup of the city is 73.2% White, 19.2% African American, 0.7% Native American, 2.3% Asian, 0.1% Pacific Islander, 1.7% from other races, and 2.9% from two or more races. The city is also home to a large Hispanic population, with 8.3% of the population being of Hispanic or Latino origin.
Conclusion
Clarksville, Tennessee is a city located in Montgomery County, Tennessee, United States. It is the county seat of Montgomery County and the fifth-largest city in the state. The city has a long and rich history, and is an important center of commerce in the region. The city has a population of 132,929, with a median age of 33.7 years and a median household income of $50,945. The city is home to several large employers, including the U.S. Army's Fort Campbell, the Austin Peay State University, and the Clarksville-Montgomery County School System. The city is also home to several attractions, including the Dunbar Cave State Park, the Customs House Museum and Cultural Center, and the Roxy Regional Theatre.
Common Questions
What is Per Capita Income in Clarksville?
Per Capita income in Clarksville is $29,481.
What is the Median Family Income in Clarksville?
Median Family Income in Clarksville is $73,333.
What is the Median Household income in Clarksville?
Median Household Income in Clarksville is $62,688.
What is Income or Wage Gap in Clarksville?
Income or Wage Gap in Clarksville is 36.1%.
Women in Clarksville earn 63.9 cents for every dollar earned by a man.
What is Family Income Deficit in Clarksville?
Family Income Deficit in Clarksville is $11,968.
Families that are below poverty line in Clarksville earn $11,968 less on average than the poverty threshold level.
What is Inequality or Gini Index in Clarksville?
Inequality or Gini Index in Clarksville is 0.39.
What is the Total Population of Clarksville?
Total Population of Clarksville is 167,882.
What is the Total Male Population of Clarksville?
Total Male Population of Clarksville is 84,724.
What is the Total Female Population of Clarksville?
Total Female Population of Clarksville is 83,158.
What is the Ratio of Males per 100 Females in Clarksville?
There are 101.88 Males per 100 Females in Clarksville.
What is the Ratio of Females per 100 Males in Clarksville?
There are 98.15 Females per 100 Males in Clarksville.
What is the Median Population Age in Clarksville?
Median Population Age in Clarksville is 30.1 Years.
What is the Average Family Size in Clarksville
Average Family Size in Clarksville is 3.2 People.
What is the Average Household Size in Clarksville
Average Household Size in Clarksville is 2.6 People.
How Large is the Labor Force in Clarksville?
There are 85,567 People in the Labor Forcein in Clarksville.
What is the Percentage of People in the Labor Force in Clarksville?
67.4% of People are in the Labor Force in Clarksville.
What is the Unemployment Rate in Clarksville?
Unemployment Rate in Clarksville is 6.5%.