Lake Havasu City, AZ Map & Demographics
Lake Havasu City Map
Lake Havasu City Overview
$40,951
PER CAPITA INCOME
$76,862
AVG FAMILY INCOME
$64,027
AVG HOUSEHOLD INCOME
21.3%
WAGE / INCOME GAP [ % ]
78.7¢/ $1
WAGE / INCOME GAP [ $ ]
$12,817
FAMILY INCOME DEFICIT
0.45
INEQUALITY / GINI INDEX
57,294
TOTAL POPULATION
28,682
MALE POPULATION
28,612
FEMALE POPULATION
100.24
MALES / 100 FEMALES
99.76
FEMALES / 100 MALES
54.3
MEDIAN AGE
2.6
AVG FAMILY SIZE
2.1
AVG HOUSEHOLD SIZE
22,832
LABOR FORCE [ PEOPLE ]
46.2%
PERCENT IN LABOR FORCE
5.9%
UNEMPLOYMENT RATE
Lake Havasu City Area Codes
Income in Lake Havasu City
Income Overview in Lake Havasu City
Per Capita Income in Lake Havasu City is $40,951, while median incomes of families and households are $76,862 and $64,027 respectively.
| Characteristic | Number | Measure |
| Per Capita Income | 57,294 | $40,951 |
| Median Family Income | 16,328 | $76,862 |
| Mean Family Income | 16,328 | $99,530 |
| Median Household Income | 26,711 | $64,027 |
| Mean Household Income | 26,711 | $85,514 |
| Income Deficit | 16,328 | $12,817 |
| Wage / Income Gap (%) | 57,294 | 21.26% |
| Wage / Income Gap ($) | 57,294 | 78.74¢ per $1 |
| Gini / Inequality Index | 57,294 | 0.45 |
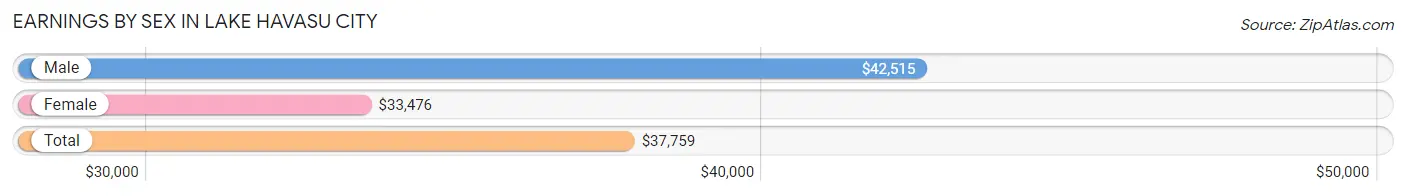
Earnings by Sex in Lake Havasu City
Average Earnings in Lake Havasu City are $37,759, $42,515 for men and $33,476 for women, a difference of 21.3%.
| Sex | Number | Average Earnings |
| Male | 12,805 (52.9%) | $42,515 |
| Female | 11,409 (47.1%) | $33,476 |
| Total | 24,214 (100.0%) | $37,759 |
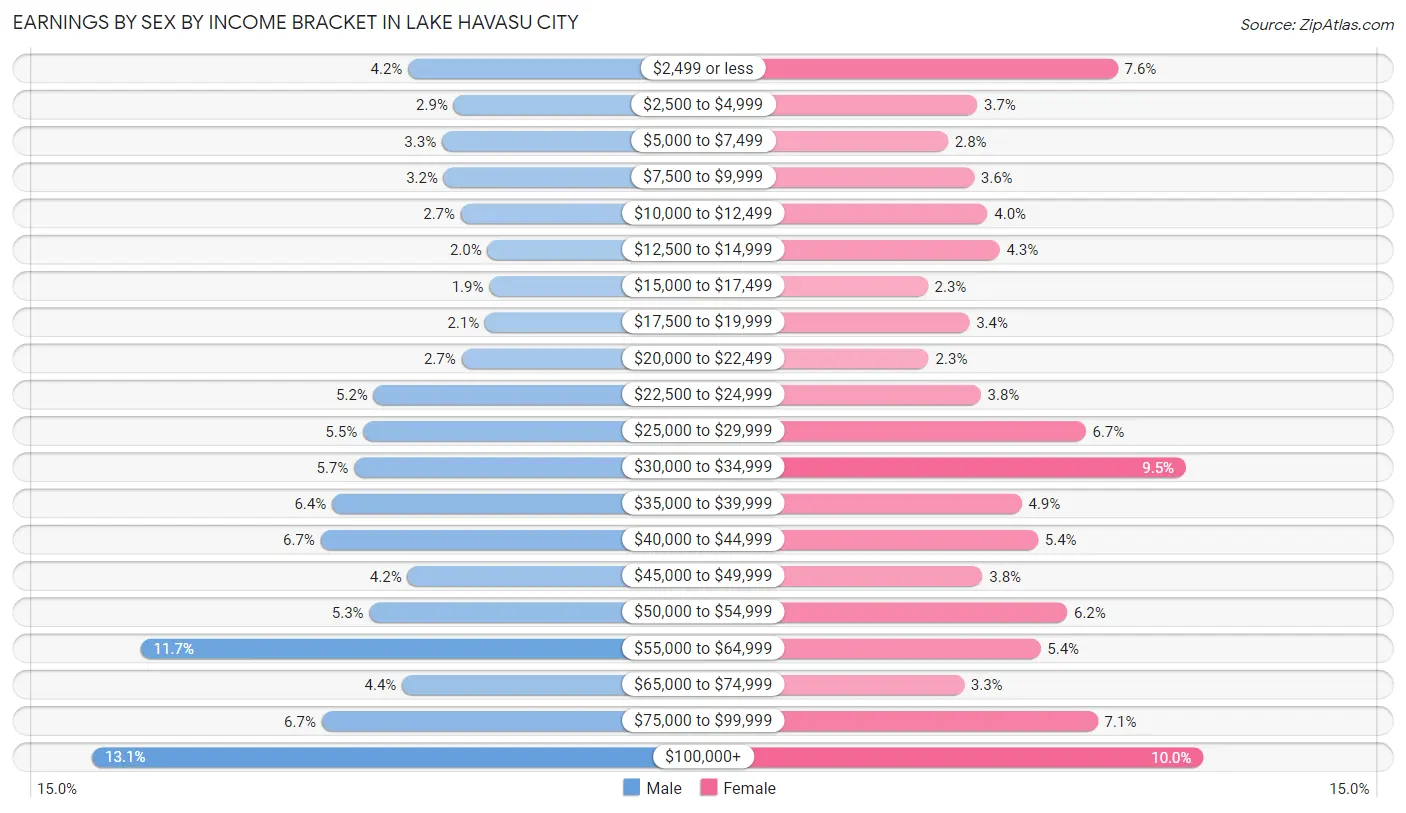
Earnings by Sex by Income Bracket in Lake Havasu City
The most common earnings brackets in Lake Havasu City are $100,000+ for men (1,678 | 13.1%) and $100,000+ for women (1,143 | 10.0%).
| Income | Male | Female |
| $2,499 or less | 541 (4.2%) | 868 (7.6%) |
| $2,500 to $4,999 | 376 (2.9%) | 418 (3.7%) |
| $5,000 to $7,499 | 419 (3.3%) | 324 (2.8%) |
| $7,500 to $9,999 | 412 (3.2%) | 407 (3.6%) |
| $10,000 to $12,499 | 351 (2.7%) | 451 (4.0%) |
| $12,500 to $14,999 | 255 (2.0%) | 490 (4.3%) |
| $15,000 to $17,499 | 249 (1.9%) | 259 (2.3%) |
| $17,500 to $19,999 | 264 (2.1%) | 392 (3.4%) |
| $20,000 to $22,499 | 348 (2.7%) | 262 (2.3%) |
| $22,500 to $24,999 | 665 (5.2%) | 429 (3.8%) |
| $25,000 to $29,999 | 703 (5.5%) | 765 (6.7%) |
| $30,000 to $34,999 | 735 (5.7%) | 1,087 (9.5%) |
| $35,000 to $39,999 | 814 (6.4%) | 560 (4.9%) |
| $40,000 to $44,999 | 855 (6.7%) | 613 (5.4%) |
| $45,000 to $49,999 | 543 (4.2%) | 435 (3.8%) |
| $50,000 to $54,999 | 680 (5.3%) | 706 (6.2%) |
| $55,000 to $64,999 | 1,503 (11.7%) | 621 (5.4%) |
| $65,000 to $74,999 | 562 (4.4%) | 375 (3.3%) |
| $75,000 to $99,999 | 852 (6.7%) | 804 (7.0%) |
| $100,000+ | 1,678 (13.1%) | 1,143 (10.0%) |
| Total | 12,805 (100.0%) | 11,409 (100.0%) |
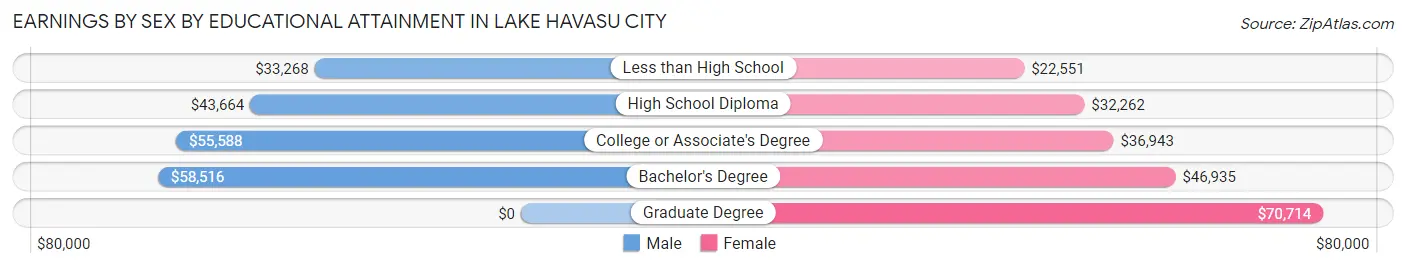
Earnings by Sex by Educational Attainment in Lake Havasu City
Average earnings in Lake Havasu City are $46,217 for men and $36,398 for women, a difference of 21.2%. Men with an educational attainment of bachelor's degree enjoy the highest average annual earnings of $58,516, while those with less than high school education earn the least with $33,268. Women with an educational attainment of graduate degree earn the most with the average annual earnings of $70,714, while those with less than high school education have the smallest earnings of $22,551.
| Educational Attainment | Male Income | Female Income |
| Less than High School | $33,268 | $22,551 |
| High School Diploma | $43,664 | $32,262 |
| College or Associate's Degree | $55,588 | $36,943 |
| Bachelor's Degree | $58,516 | $46,935 |
| Graduate Degree | - | - |
| Total | $46,217 | $36,398 |
Family Income in Lake Havasu City
Family Income Brackets in Lake Havasu City
According to the Lake Havasu City family income data, there are 3,217 families falling into the $75,000 to $99,999 income range, which is the most common income bracket and makes up 19.7% of all families. Conversely, the $10,000 to $14,999 income bracket is the least frequent group with only 278 families (1.7%) belonging to this category.
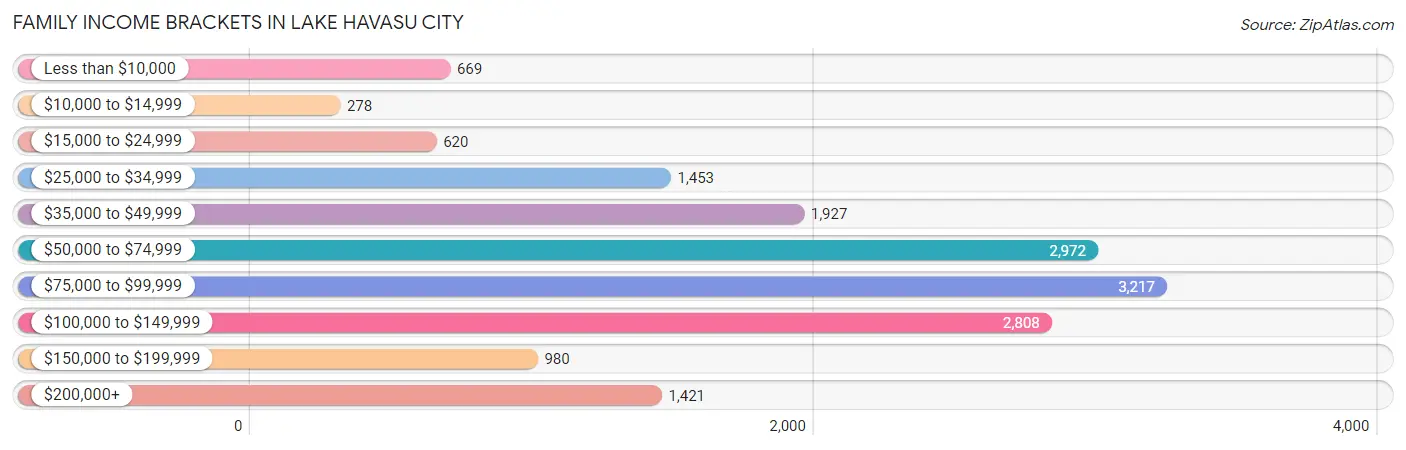
| Income Bracket | # Families | % Families |
| Less than $10,000 | 669 | 4.1% |
| $10,000 to $14,999 | 278 | 1.7% |
| $15,000 to $24,999 | 620 | 3.8% |
| $25,000 to $34,999 | 1,453 | 8.9% |
| $35,000 to $49,999 | 1,927 | 11.8% |
| $50,000 to $74,999 | 2,972 | 18.2% |
| $75,000 to $99,999 | 3,217 | 19.7% |
| $100,000 to $149,999 | 2,808 | 17.2% |
| $150,000 to $199,999 | 980 | 6.0% |
| $200,000+ | 1,421 | 8.7% |
Family Income by Famaliy Size in Lake Havasu City
6-person families (477 | 2.9%) account for the highest median family income in Lake Havasu City with $101,069 per family, while 2-person families (11,024 | 67.5%) have the highest median income of $36,339 per family member.
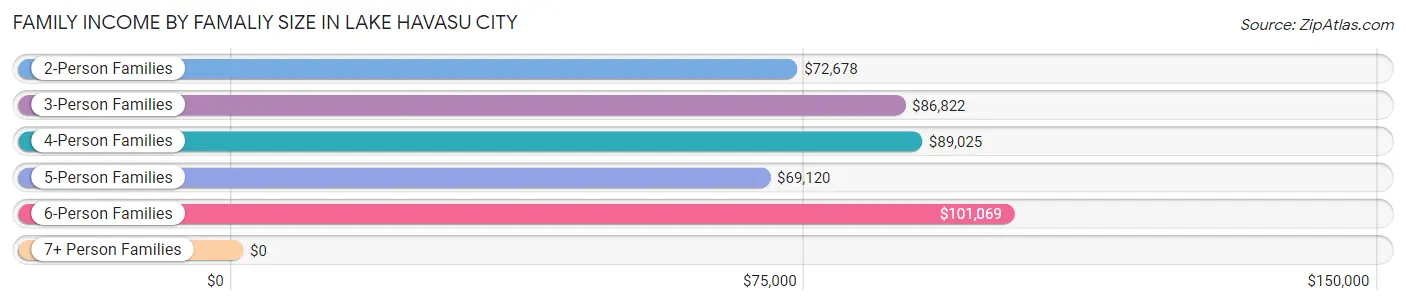
| Income Bracket | # Families | Median Income |
| 2-Person Families | 11,024 (67.5%) | $72,678 |
| 3-Person Families | 2,430 (14.9%) | $86,822 |
| 4-Person Families | 1,589 (9.7%) | $89,025 |
| 5-Person Families | 663 (4.1%) | $69,120 |
| 6-Person Families | 477 (2.9%) | $101,069 |
| 7+ Person Families | 145 (0.9%) | $0 |
| Total | 16,328 (100.0%) | $76,862 |
Family Income by Number of Earners in Lake Havasu City
The median family income in Lake Havasu City is $76,862, with families comprising 3+ earners (971) having the highest median family income of $116,033, while families with no earners (6,188) have the lowest median family income of $61,629, accounting for 5.9% and 37.9% of families, respectively.
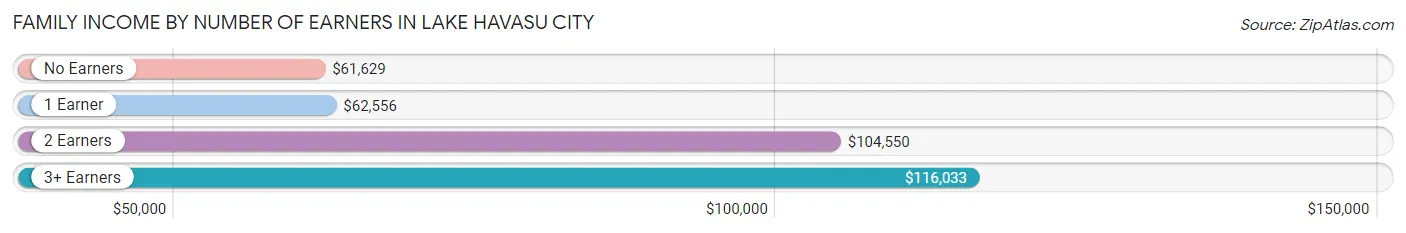
| Number of Earners | # Families | Median Income |
| No Earners | 6,188 (37.9%) | $61,629 |
| 1 Earner | 4,544 (27.8%) | $62,556 |
| 2 Earners | 4,625 (28.3%) | $104,550 |
| 3+ Earners | 971 (5.9%) | $116,033 |
| Total | 16,328 (100.0%) | $76,862 |
Household Income in Lake Havasu City
Household Income Brackets in Lake Havasu City
With 5,502 households falling in the category, the $50,000 to $74,999 income range is the most frequent in Lake Havasu City, accounting for 20.6% of all households. In contrast, only 828 households (3.1%) fall into the $10,000 to $14,999 income bracket, making it the least populous group.
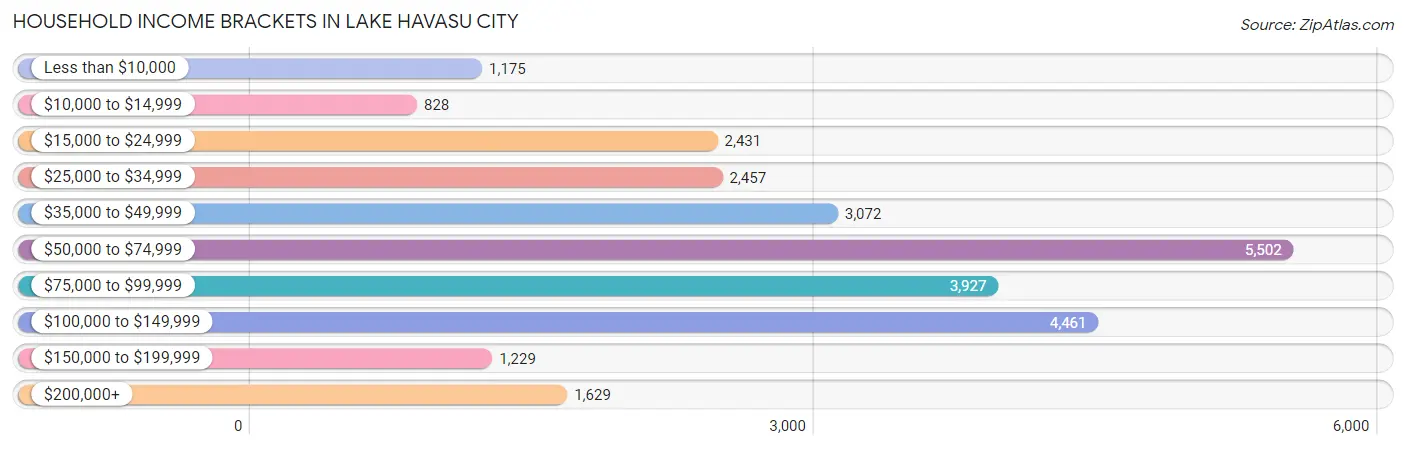
| Income Bracket | # Households | % Households |
| Less than $10,000 | 1,175 | 4.4% |
| $10,000 to $14,999 | 828 | 3.1% |
| $15,000 to $24,999 | 2,431 | 9.1% |
| $25,000 to $34,999 | 2,457 | 9.2% |
| $35,000 to $49,999 | 3,072 | 11.5% |
| $50,000 to $74,999 | 5,502 | 20.6% |
| $75,000 to $99,999 | 3,927 | 14.7% |
| $100,000 to $149,999 | 4,461 | 16.7% |
| $150,000 to $199,999 | 1,229 | 4.6% |
| $200,000+ | 1,629 | 6.1% |
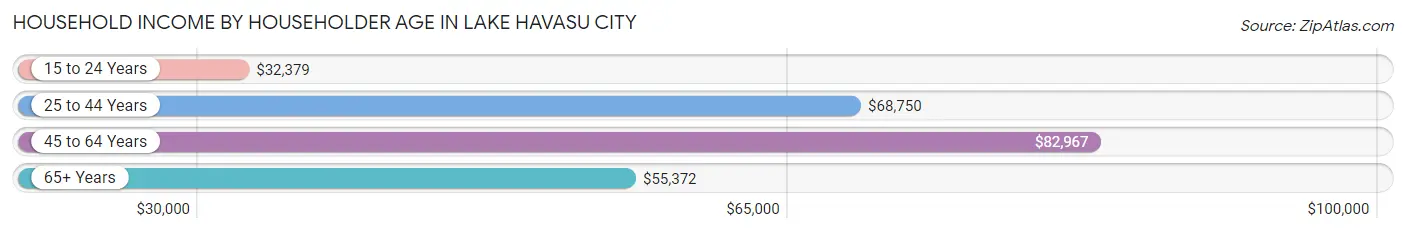
Household Income by Householder Age in Lake Havasu City
The median household income in Lake Havasu City is $64,027, with the highest median household income of $82,967 found in the 45 to 64 years age bracket for the primary householder. A total of 7,961 households (29.8%) fall into this category. Meanwhile, the 15 to 24 years age bracket for the primary householder has the lowest median household income of $32,379, with 686 households (2.6%) in this group.
| Income Bracket | # Households | Median Income |
| 15 to 24 Years | 686 (2.6%) | $32,379 |
| 25 to 44 Years | 5,489 (20.5%) | $68,750 |
| 45 to 64 Years | 7,961 (29.8%) | $82,967 |
| 65+ Years | 12,575 (47.1%) | $55,372 |
| Total | 26,711 (100.0%) | $64,027 |
Poverty in Lake Havasu City
Income Below Poverty by Sex and Age in Lake Havasu City
With 11.3% poverty level for males and 13.2% for females among the residents of Lake Havasu City, 5 year old males and 5 year old females are the most vulnerable to poverty, with 145 males (67.1%) and 135 females (43.8%) in their respective age groups living below the poverty level.
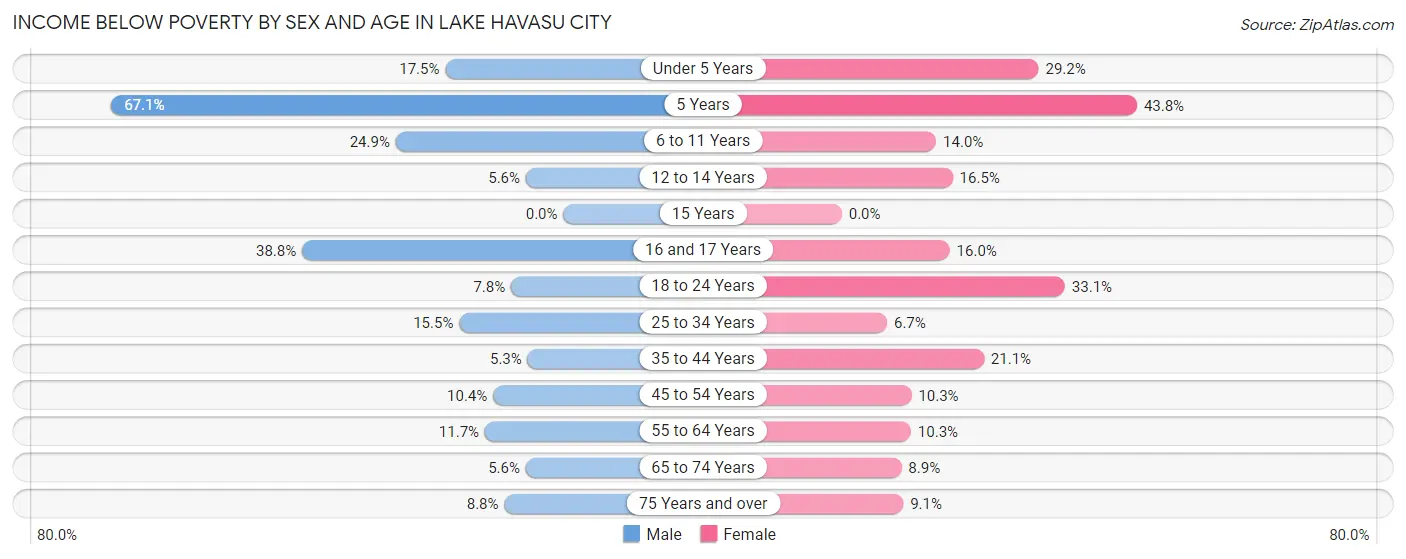
| Age Bracket | Male | Female |
| Under 5 Years | 199 (17.5%) | 251 (29.2%) |
| 5 Years | 145 (67.1%) | 135 (43.8%) |
| 6 to 11 Years | 456 (24.9%) | 209 (14.0%) |
| 12 to 14 Years | 30 (5.6%) | 133 (16.5%) |
| 15 Years | 0 (0.0%) | 0 (0.0%) |
| 16 and 17 Years | 168 (38.8%) | 108 (16.0%) |
| 18 to 24 Years | 128 (7.8%) | 554 (33.1%) |
| 25 to 34 Years | 508 (15.5%) | 182 (6.7%) |
| 35 to 44 Years | 122 (5.3%) | 554 (21.1%) |
| 45 to 54 Years | 302 (10.4%) | 301 (10.3%) |
| 55 to 64 Years | 479 (11.7%) | 431 (10.3%) |
| 65 to 74 Years | 309 (5.6%) | 518 (8.8%) |
| 75 Years and over | 382 (8.8%) | 360 (9.1%) |
| Total | 3,228 (11.3%) | 3,736 (13.2%) |
Income Above Poverty by Sex and Age in Lake Havasu City
According to the poverty statistics in Lake Havasu City, males aged 15 years and females aged 15 years are the age groups that are most secure financially, with 100.0% of males and 100.0% of females in these age groups living above the poverty line.
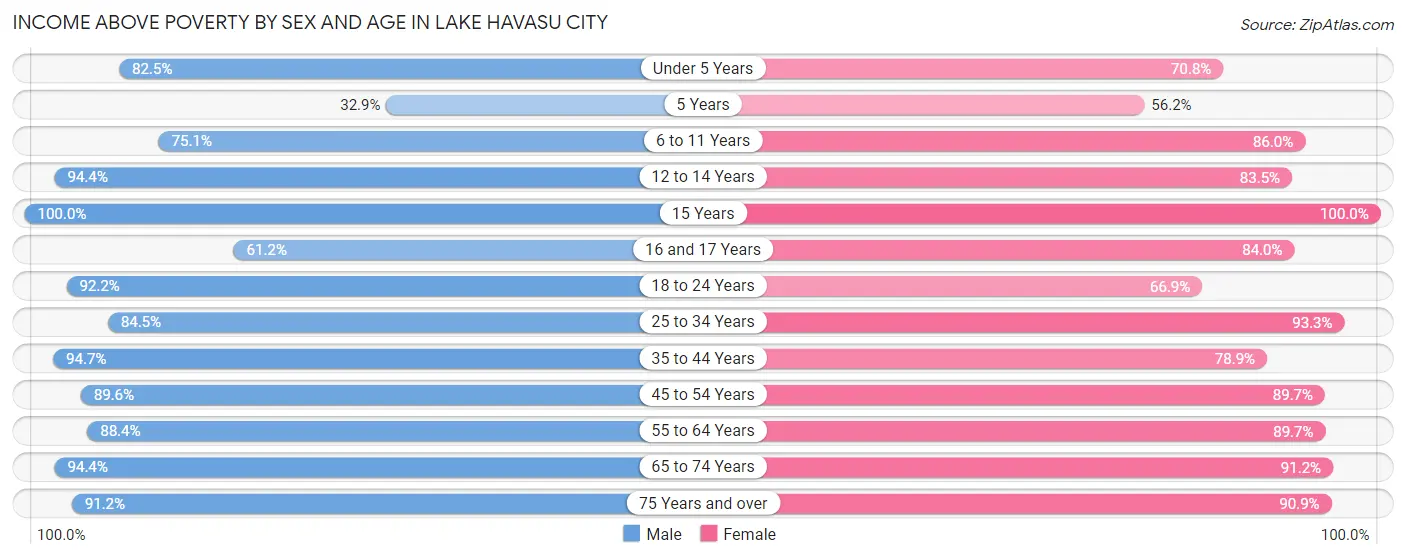
| Age Bracket | Male | Female |
| Under 5 Years | 936 (82.5%) | 608 (70.8%) |
| 5 Years | 71 (32.9%) | 173 (56.2%) |
| 6 to 11 Years | 1,376 (75.1%) | 1,283 (86.0%) |
| 12 to 14 Years | 509 (94.4%) | 675 (83.5%) |
| 15 Years | 254 (100.0%) | 188 (100.0%) |
| 16 and 17 Years | 265 (61.2%) | 566 (84.0%) |
| 18 to 24 Years | 1,520 (92.2%) | 1,118 (66.9%) |
| 25 to 34 Years | 2,777 (84.5%) | 2,528 (93.3%) |
| 35 to 44 Years | 2,176 (94.7%) | 2,071 (78.9%) |
| 45 to 54 Years | 2,593 (89.6%) | 2,611 (89.7%) |
| 55 to 64 Years | 3,632 (88.3%) | 3,768 (89.7%) |
| 65 to 74 Years | 5,233 (94.4%) | 5,333 (91.1%) |
| 75 Years and over | 3,977 (91.2%) | 3,589 (90.9%) |
| Total | 25,319 (88.7%) | 24,511 (86.8%) |
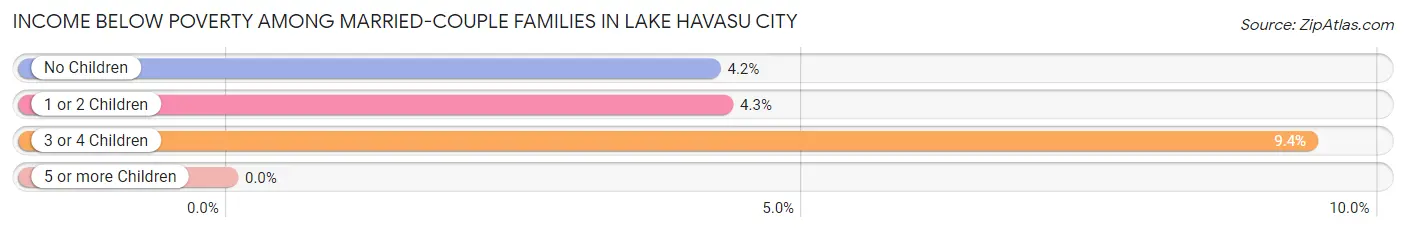
Income Below Poverty Among Married-Couple Families in Lake Havasu City
The poverty statistics for married-couple families in Lake Havasu City show that 4.4% or 570 of the total 12,834 families live below the poverty line. Families with 3 or 4 children have the highest poverty rate of 9.4%, comprising of 53 families. On the other hand, families with 5 or more children have the lowest poverty rate of 0.0%, which includes 0 families.
| Children | Above Poverty | Below Poverty |
| No Children | 9,592 (95.8%) | 421 (4.2%) |
| 1 or 2 Children | 2,131 (95.7%) | 96 (4.3%) |
| 3 or 4 Children | 511 (90.6%) | 53 (9.4%) |
| 5 or more Children | 30 (100.0%) | 0 (0.0%) |
| Total | 12,264 (95.6%) | 570 (4.4%) |
Income Below Poverty Among Single-Parent Households in Lake Havasu City
According to the poverty data in Lake Havasu City, 17.3% or 239 single-father households and 26.0% or 548 single-mother households are living below the poverty line. Among single-father households, those with 3 or 4 children have the highest poverty rate, with 15 households (21.7%) experiencing poverty. Likewise, among single-mother households, those with 5 or more children have the highest poverty rate, with 189 households (100.0%) falling below the poverty line.
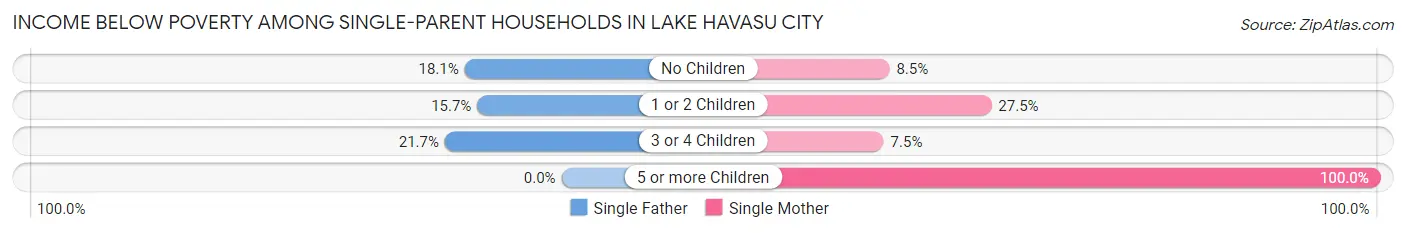
| Children | Single Father | Single Mother |
| No Children | 137 (18.0%) | 68 (8.5%) |
| 1 or 2 Children | 87 (15.7%) | 284 (27.5%) |
| 3 or 4 Children | 15 (21.7%) | 7 (7.4%) |
| 5 or more Children | 0 (0.0%) | 189 (100.0%) |
| Total | 239 (17.3%) | 548 (26.0%) |
Income Below Poverty Among Married-Couple vs Single-Parent Households in Lake Havasu City
The poverty data for Lake Havasu City shows that 570 of the married-couple family households (4.4%) and 787 of the single-parent households (22.5%) are living below the poverty level. Within the married-couple family households, those with 3 or 4 children have the highest poverty rate, with 53 households (9.4%) falling below the poverty line. Among the single-parent households, those with 5 or more children have the highest poverty rate, with 189 household (100.0%) living below poverty.
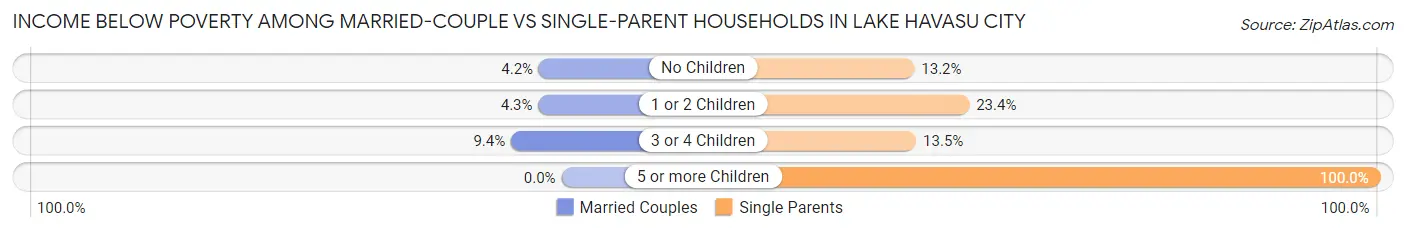
| Children | Married-Couple Families | Single-Parent Households |
| No Children | 421 (4.2%) | 205 (13.2%) |
| 1 or 2 Children | 96 (4.3%) | 371 (23.4%) |
| 3 or 4 Children | 53 (9.4%) | 22 (13.5%) |
| 5 or more Children | 0 (0.0%) | 189 (100.0%) |
| Total | 570 (4.4%) | 787 (22.5%) |
Race in Lake Havasu City
The most populous races in Lake Havasu City are White / Caucasian (49,356 | 86.2%), Hispanic or Latino (8,972 | 15.7%), and Two or more Races (4,781 | 8.3%).
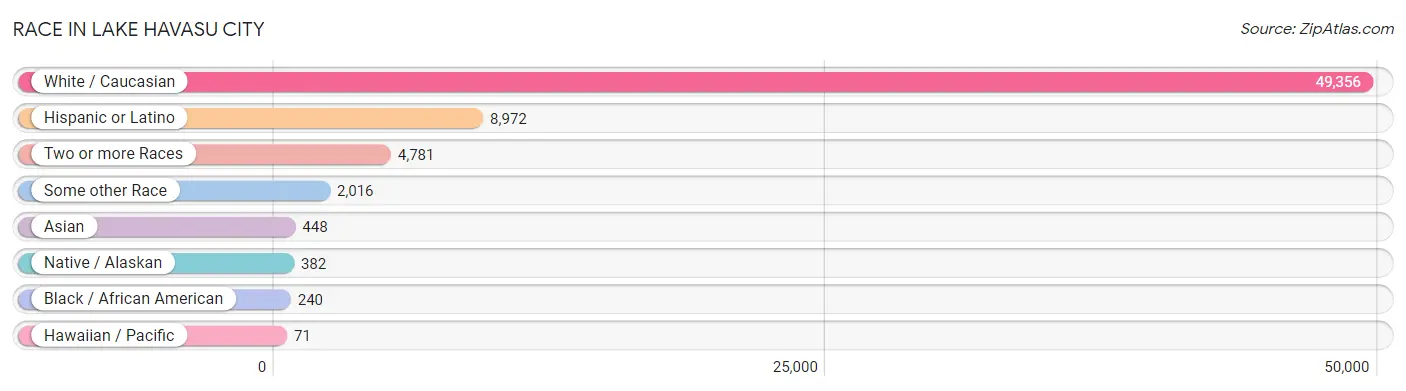
| Race | # Population | % Population |
| Asian | 448 | 0.8% |
| Black / African American | 240 | 0.4% |
| Hawaiian / Pacific | 71 | 0.1% |
| Hispanic or Latino | 8,972 | 15.7% |
| Native / Alaskan | 382 | 0.7% |
| White / Caucasian | 49,356 | 86.2% |
| Two or more Races | 4,781 | 8.3% |
| Some other Race | 2,016 | 3.5% |
| Total | 57,294 | 100.0% |
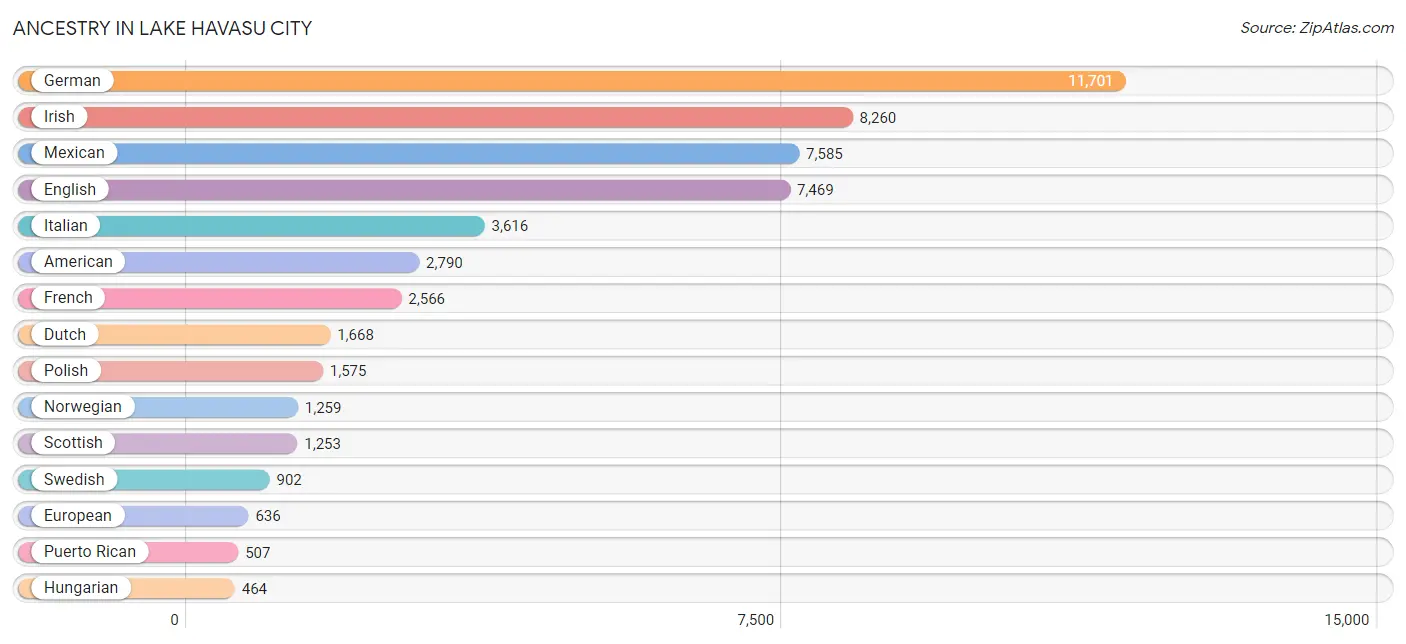
Ancestry in Lake Havasu City
The most populous ancestries reported in Lake Havasu City are German (11,701 | 20.4%), Irish (8,260 | 14.4%), Mexican (7,585 | 13.2%), English (7,469 | 13.0%), and Italian (3,616 | 6.3%), together accounting for 67.4% of all Lake Havasu City residents.
| Ancestry | # Population | % Population |
| Aleut | 11 | 0.0% |
| American | 2,790 | 4.9% |
| Apache | 12 | 0.0% |
| Arab | 210 | 0.4% |
| Argentinean | 183 | 0.3% |
| Armenian | 40 | 0.1% |
| Australian | 20 | 0.0% |
| Austrian | 105 | 0.2% |
| Basque | 31 | 0.1% |
| Belgian | 59 | 0.1% |
| Bhutanese | 100 | 0.2% |
| British | 391 | 0.7% |
| Burmese | 11 | 0.0% |
| Cajun | 36 | 0.1% |
| Cambodian | 5 | 0.0% |
| Canadian | 213 | 0.4% |
| Central American | 244 | 0.4% |
| Central American Indian | 12 | 0.0% |
| Cherokee | 188 | 0.3% |
| Chickasaw | 15 | 0.0% |
| Chippewa | 9 | 0.0% |
| Costa Rican | 100 | 0.2% |
| Cree | 27 | 0.1% |
| Creek | 106 | 0.2% |
| Croatian | 59 | 0.1% |
| Cuban | 86 | 0.2% |
| Czech | 172 | 0.3% |
| Czechoslovakian | 79 | 0.1% |
| Danish | 403 | 0.7% |
| Dutch | 1,668 | 2.9% |
| Eastern European | 38 | 0.1% |
| Ecuadorian | 13 | 0.0% |
| Egyptian | 28 | 0.1% |
| English | 7,469 | 13.0% |
| European | 636 | 1.1% |
| Filipino | 12 | 0.0% |
| Finnish | 101 | 0.2% |
| French | 2,566 | 4.5% |
| French Canadian | 408 | 0.7% |
| German | 11,701 | 20.4% |
| Greek | 240 | 0.4% |
| Guamanian / Chamorro | 24 | 0.0% |
| Guatemalan | 58 | 0.1% |
| Haitian | 8 | 0.0% |
| Hopi | 54 | 0.1% |
| Hungarian | 464 | 0.8% |
| Icelander | 54 | 0.1% |
| Indian (Asian) | 88 | 0.2% |
| Iranian | 15 | 0.0% |
| Irish | 8,260 | 14.4% |
| Italian | 3,616 | 6.3% |
| Korean | 264 | 0.5% |
| Lebanese | 24 | 0.0% |
| Lithuanian | 55 | 0.1% |
| Luxembourger | 22 | 0.0% |
| Mexican | 7,585 | 13.2% |
| Mexican American Indian | 37 | 0.1% |
| Native Hawaiian | 68 | 0.1% |
| Navajo | 96 | 0.2% |
| Nicaraguan | 16 | 0.0% |
| Nigerian | 9 | 0.0% |
| Northern European | 43 | 0.1% |
| Norwegian | 1,259 | 2.2% |
| Osage | 7 | 0.0% |
| Pakistani | 17 | 0.0% |
| Palestinian | 91 | 0.2% |
| Pennsylvania German | 48 | 0.1% |
| Peruvian | 142 | 0.3% |
| Polish | 1,575 | 2.8% |
| Portuguese | 181 | 0.3% |
| Potawatomi | 9 | 0.0% |
| Pueblo | 65 | 0.1% |
| Puerto Rican | 507 | 0.9% |
| Romanian | 55 | 0.1% |
| Russian | 433 | 0.8% |
| Salvadoran | 70 | 0.1% |
| Scandinavian | 211 | 0.4% |
| Scotch-Irish | 397 | 0.7% |
| Scottish | 1,253 | 2.2% |
| Serbian | 20 | 0.0% |
| Sioux | 28 | 0.1% |
| Slavic | 76 | 0.1% |
| Slovak | 63 | 0.1% |
| Slovene | 10 | 0.0% |
| South American | 348 | 0.6% |
| Spaniard | 54 | 0.1% |
| Spanish | 33 | 0.1% |
| Sri Lankan | 114 | 0.2% |
| Subsaharan African | 42 | 0.1% |
| Swedish | 902 | 1.6% |
| Swiss | 218 | 0.4% |
| Syrian | 54 | 0.1% |
| Thai | 46 | 0.1% |
| Tohono O'Odham | 2 | 0.0% |
| Ukrainian | 181 | 0.3% |
| Venezuelan | 10 | 0.0% |
| Welsh | 413 | 0.7% |
| Yaqui | 77 | 0.1% |
| Yugoslavian | 89 | 0.2% |
| Yuman | 10 | 0.0% | View All 100 Rows |
Immigrants in Lake Havasu City
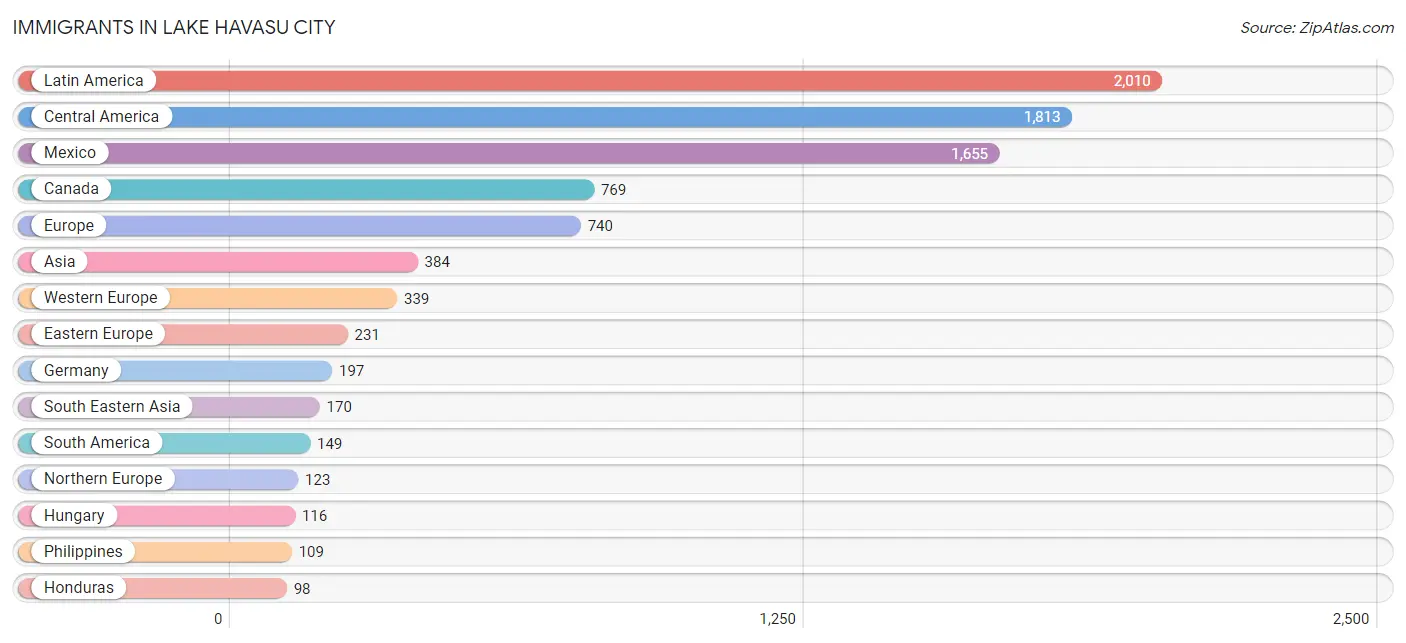
The most numerous immigrant groups reported in Lake Havasu City came from Latin America (2,010 | 3.5%), Central America (1,813 | 3.2%), Mexico (1,655 | 2.9%), Canada (769 | 1.3%), and Europe (740 | 1.3%), together accounting for 12.2% of all Lake Havasu City residents.
| Immigration Origin | # Population | % Population |
| Africa | 21 | 0.0% |
| Argentina | 88 | 0.2% |
| Asia | 384 | 0.7% |
| Austria | 18 | 0.0% |
| Canada | 769 | 1.3% |
| Caribbean | 48 | 0.1% |
| Central America | 1,813 | 3.2% |
| China | 76 | 0.1% |
| Cuba | 40 | 0.1% |
| Czechoslovakia | 50 | 0.1% |
| Eastern Africa | 12 | 0.0% |
| Eastern Asia | 81 | 0.1% |
| Eastern Europe | 231 | 0.4% |
| El Salvador | 15 | 0.0% |
| England | 80 | 0.1% |
| Europe | 740 | 1.3% |
| France | 24 | 0.0% |
| Germany | 197 | 0.3% |
| Guatemala | 45 | 0.1% |
| Haiti | 8 | 0.0% |
| Honduras | 98 | 0.2% |
| Hong Kong | 15 | 0.0% |
| Hungary | 116 | 0.2% |
| India | 53 | 0.1% |
| Italy | 47 | 0.1% |
| Laos | 5 | 0.0% |
| Latin America | 2,010 | 3.5% |
| Lebanon | 13 | 0.0% |
| Mexico | 1,655 | 2.9% |
| Netherlands | 89 | 0.2% |
| Nigeria | 9 | 0.0% |
| Northern Europe | 123 | 0.2% |
| Peru | 51 | 0.1% |
| Philippines | 109 | 0.2% |
| Scotland | 21 | 0.0% |
| South America | 149 | 0.3% |
| South Central Asia | 53 | 0.1% |
| South Eastern Asia | 170 | 0.3% |
| Southern Europe | 47 | 0.1% |
| Sweden | 22 | 0.0% |
| Switzerland | 11 | 0.0% |
| Taiwan | 37 | 0.1% |
| Ukraine | 65 | 0.1% |
| Venezuela | 10 | 0.0% |
| Vietnam | 44 | 0.1% |
| Western Africa | 9 | 0.0% |
| Western Asia | 57 | 0.1% |
| Western Europe | 339 | 0.6% | View All 48 Rows |
Sex and Age in Lake Havasu City
Sex and Age in Lake Havasu City
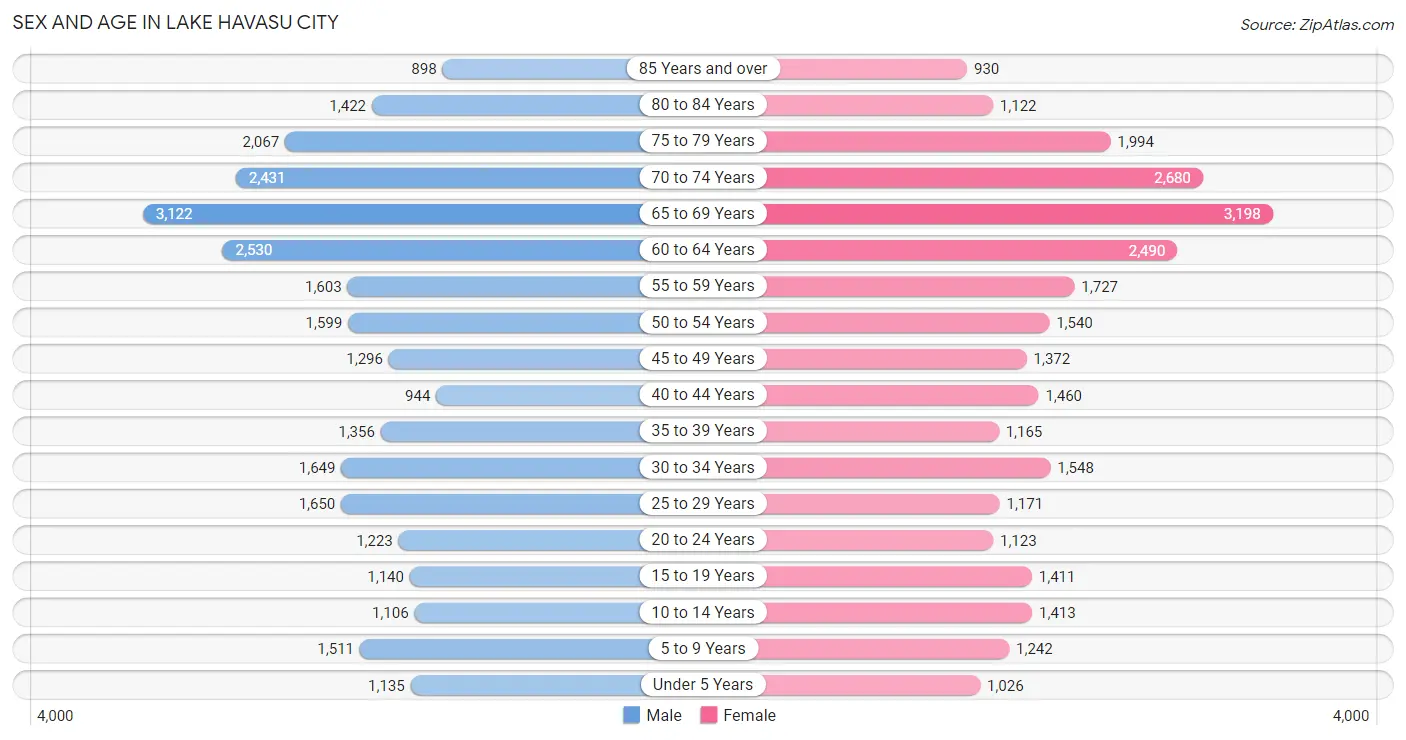
The most populous age groups in Lake Havasu City are 65 to 69 Years (3,122 | 10.9%) for men and 65 to 69 Years (3,198 | 11.2%) for women.
| Age Bracket | Male | Female |
| Under 5 Years | 1,135 (4.0%) | 1,026 (3.6%) |
| 5 to 9 Years | 1,511 (5.3%) | 1,242 (4.3%) |
| 10 to 14 Years | 1,106 (3.9%) | 1,413 (4.9%) |
| 15 to 19 Years | 1,140 (4.0%) | 1,411 (4.9%) |
| 20 to 24 Years | 1,223 (4.3%) | 1,123 (3.9%) |
| 25 to 29 Years | 1,650 (5.8%) | 1,171 (4.1%) |
| 30 to 34 Years | 1,649 (5.8%) | 1,548 (5.4%) |
| 35 to 39 Years | 1,356 (4.7%) | 1,165 (4.1%) |
| 40 to 44 Years | 944 (3.3%) | 1,460 (5.1%) |
| 45 to 49 Years | 1,296 (4.5%) | 1,372 (4.8%) |
| 50 to 54 Years | 1,599 (5.6%) | 1,540 (5.4%) |
| 55 to 59 Years | 1,603 (5.6%) | 1,727 (6.0%) |
| 60 to 64 Years | 2,530 (8.8%) | 2,490 (8.7%) |
| 65 to 69 Years | 3,122 (10.9%) | 3,198 (11.2%) |
| 70 to 74 Years | 2,431 (8.5%) | 2,680 (9.4%) |
| 75 to 79 Years | 2,067 (7.2%) | 1,994 (7.0%) |
| 80 to 84 Years | 1,422 (5.0%) | 1,122 (3.9%) |
| 85 Years and over | 898 (3.1%) | 930 (3.3%) |
| Total | 28,682 (100.0%) | 28,612 (100.0%) |
Families and Households in Lake Havasu City
Median Family Size in Lake Havasu City
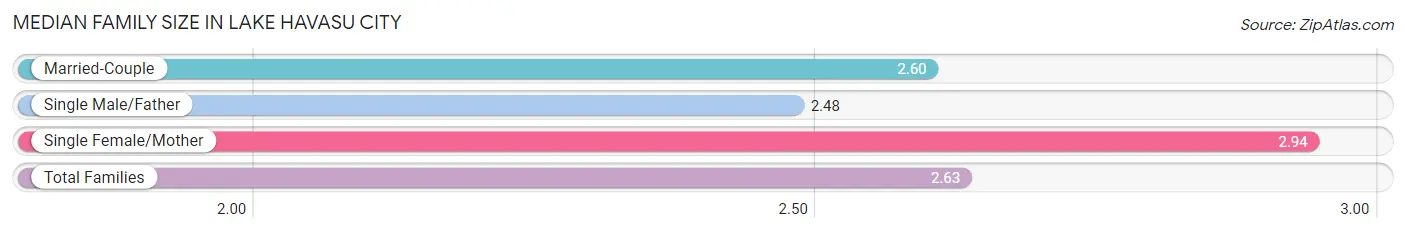
The median family size in Lake Havasu City is 2.63 persons per family, with single female/mother families (2,112 | 12.9%) accounting for the largest median family size of 2.94 persons per family. On the other hand, single male/father families (1,382 | 8.5%) represent the smallest median family size with 2.48 persons per family.
| Family Type | # Families | Family Size |
| Married-Couple | 12,834 (78.6%) | 2.60 |
| Single Male/Father | 1,382 (8.5%) | 2.48 |
| Single Female/Mother | 2,112 (12.9%) | 2.94 |
| Total Families | 16,328 (100.0%) | 2.63 |
Median Household Size in Lake Havasu City
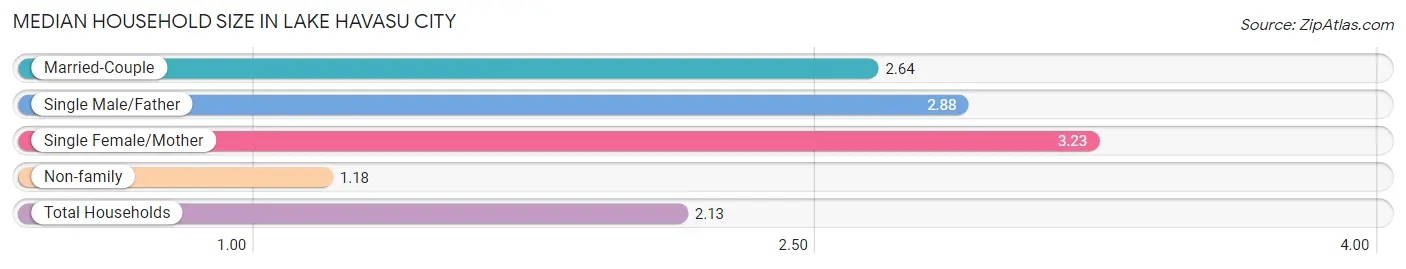
The median household size in Lake Havasu City is 2.13 persons per household, with single female/mother households (2,112 | 7.9%) accounting for the largest median household size of 3.23 persons per household. non-family households (10,383 | 38.9%) represent the smallest median household size with 1.18 persons per household.
| Household Type | # Households | Household Size |
| Married-Couple | 12,834 (48.0%) | 2.64 |
| Single Male/Father | 1,382 (5.2%) | 2.88 |
| Single Female/Mother | 2,112 (7.9%) | 3.23 |
| Non-family | 10,383 (38.9%) | 1.18 |
| Total Households | 26,711 (100.0%) | 2.13 |
Household Size by Marriage Status in Lake Havasu City
Out of a total of 26,711 households in Lake Havasu City, 16,328 (61.1%) are family households, while 10,383 (38.9%) are nonfamily households. The most numerous type of family households are 2-person households, comprising 10,493, and the most common type of nonfamily households are 1-person households, comprising 8,764.
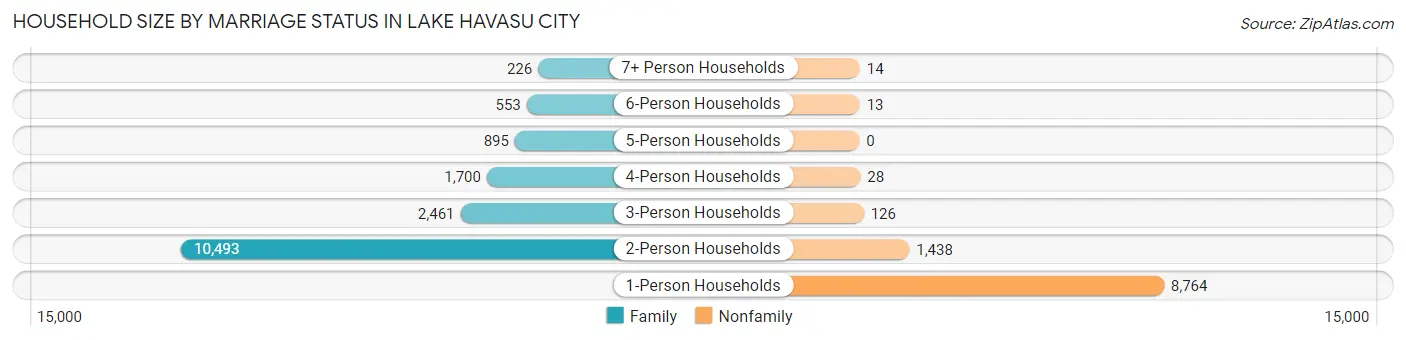
| Household Size | Family Households | Nonfamily Households |
| 1-Person Households | - | 8,764 (32.8%) |
| 2-Person Households | 10,493 (39.3%) | 1,438 (5.4%) |
| 3-Person Households | 2,461 (9.2%) | 126 (0.5%) |
| 4-Person Households | 1,700 (6.4%) | 28 (0.1%) |
| 5-Person Households | 895 (3.4%) | 0 (0.0%) |
| 6-Person Households | 553 (2.1%) | 13 (0.1%) |
| 7+ Person Households | 226 (0.9%) | 14 (0.1%) |
| Total | 16,328 (61.1%) | 10,383 (38.9%) |
Female Fertility in Lake Havasu City
Fertility by Age in Lake Havasu City
Average fertility rate in Lake Havasu City is 70.0 births per 1,000 women. Women in the age bracket of 20 to 34 years have the highest fertility rate with 117.0 births per 1,000 women. Women in the age bracket of 20 to 34 years acount for 67.3% of all women with births.
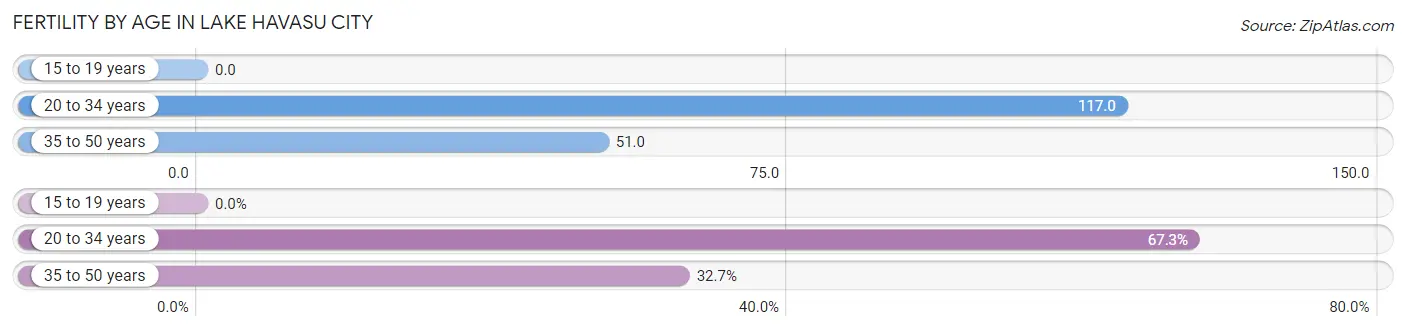
| Age Bracket | Women with Births | Births / 1,000 Women |
| 15 to 19 years | 0 (0.0%) | 0.0 |
| 20 to 34 years | 451 (67.3%) | 117.0 |
| 35 to 50 years | 219 (32.7%) | 51.0 |
| Total | 670 (100.0%) | 70.0 |
Fertility by Age by Marriage Status in Lake Havasu City
43.0% of women with births (670) in Lake Havasu City are married. The highest percentage of unmarried women with births falls into 20 to 34 years age bracket with 61.6% of them unmarried at the time of birth, while the lowest percentage of unmarried women with births belong to 35 to 50 years age bracket with 47.5% of them unmarried.
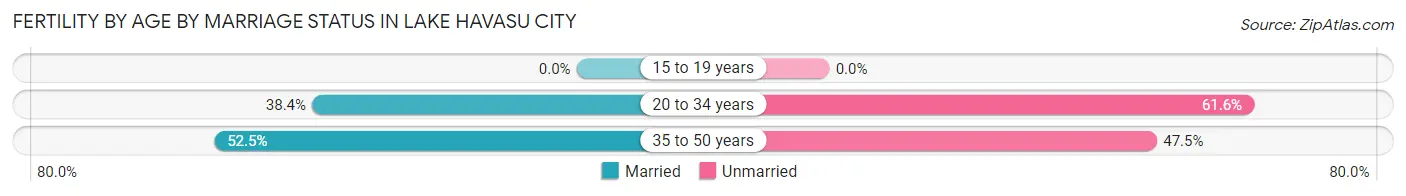
| Age Bracket | Married | Unmarried |
| 15 to 19 years | 0 (0.0%) | 0 (0.0%) |
| 20 to 34 years | 173 (38.4%) | 278 (61.6%) |
| 35 to 50 years | 115 (52.5%) | 104 (47.5%) |
| Total | 288 (43.0%) | 382 (57.0%) |
Fertility by Education in Lake Havasu City
Average fertility rate in Lake Havasu City is 70.0 births per 1,000 women. Women with the education attainment of high school diploma have the highest fertility rate of 149.0 births per 1,000 women, while women with the education attainment of bachelor's degree have the lowest fertility at 26.0 births per 1,000 women. Women with the education attainment of high school diploma represent 54.9% of all women with births.
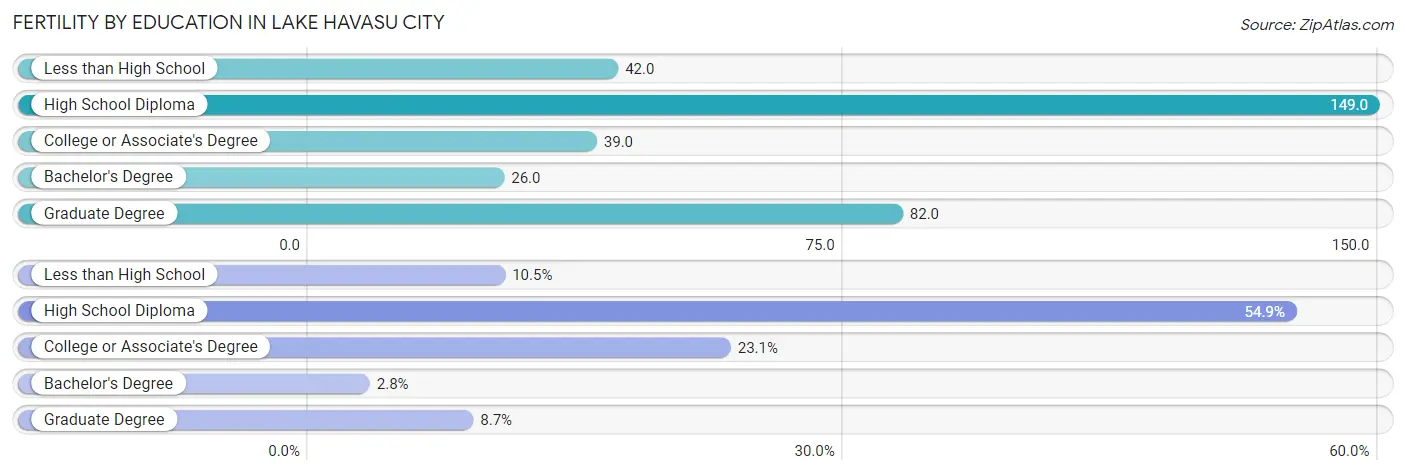
| Educational Attainment | Women with Births | Births / 1,000 Women |
| Less than High School | 70 (10.4%) | 42.0 |
| High School Diploma | 368 (54.9%) | 149.0 |
| College or Associate's Degree | 155 (23.1%) | 39.0 |
| Bachelor's Degree | 19 (2.8%) | 26.0 |
| Graduate Degree | 58 (8.7%) | 82.0 |
| Total | 670 (100.0%) | 70.0 |
Fertility by Education by Marriage Status in Lake Havasu City
57.0% of women with births in Lake Havasu City are unmarried. Women with the educational attainment of graduate degree are most likely to be married with 100.0% of them married at childbirth, while women with the educational attainment of bachelor's degree are least likely to be married with 100.0% of them unmarried at childbirth.
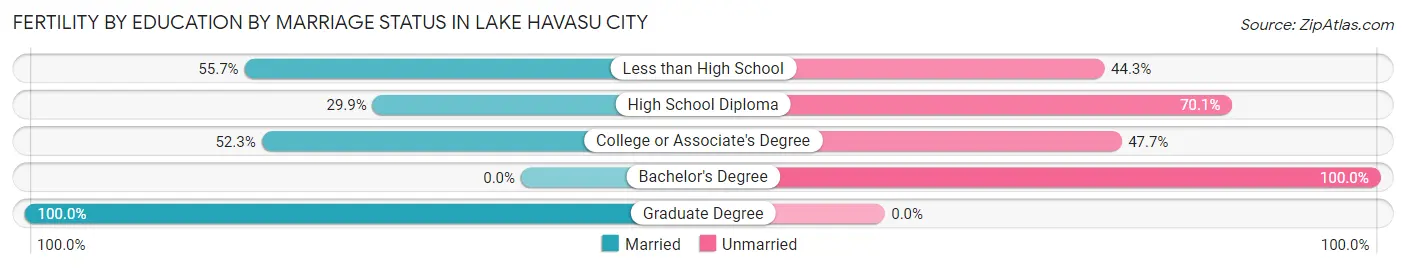
| Educational Attainment | Married | Unmarried |
| Less than High School | 39 (55.7%) | 31 (44.3%) |
| High School Diploma | 110 (29.9%) | 258 (70.1%) |
| College or Associate's Degree | 81 (52.3%) | 74 (47.7%) |
| Bachelor's Degree | 0 (0.0%) | 19 (100.0%) |
| Graduate Degree | 58 (100.0%) | 0 (0.0%) |
| Total | 288 (43.0%) | 382 (57.0%) |
Employment Characteristics in Lake Havasu City
Employment by Class of Employer in Lake Havasu City
Among the 21,142 employed individuals in Lake Havasu City, private company employees (14,272 | 67.5%), self-employed (not incorporated) (2,025 | 9.6%), and local government employees (1,692 | 8.0%) make up the most common classes of employment.
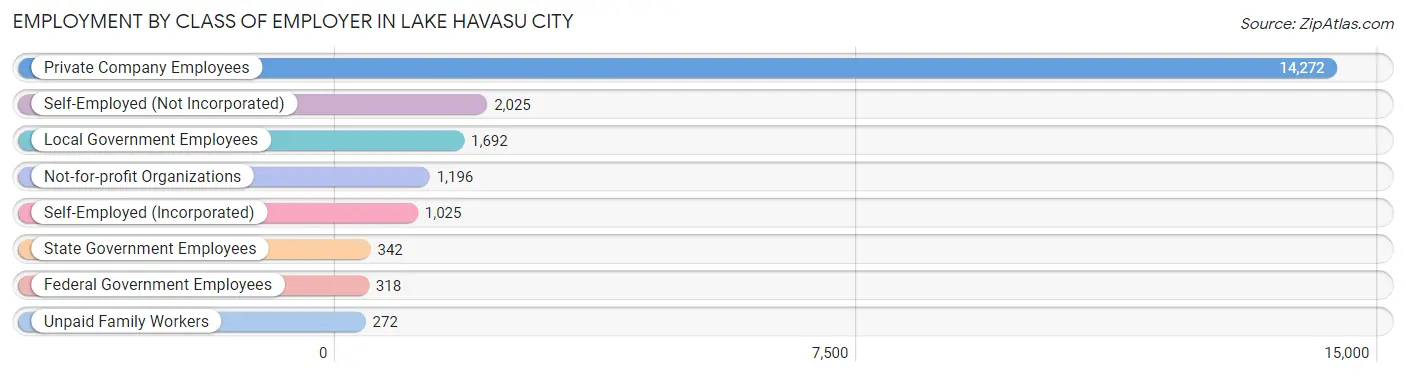
| Employer Class | # Employees | % Employees |
| Private Company Employees | 14,272 | 67.5% |
| Self-Employed (Incorporated) | 1,025 | 4.9% |
| Self-Employed (Not Incorporated) | 2,025 | 9.6% |
| Not-for-profit Organizations | 1,196 | 5.7% |
| Local Government Employees | 1,692 | 8.0% |
| State Government Employees | 342 | 1.6% |
| Federal Government Employees | 318 | 1.5% |
| Unpaid Family Workers | 272 | 1.3% |
| Total | 21,142 | 100.0% |
Employment Status by Age in Lake Havasu City
According to the labor force statistics for Lake Havasu City, out of the total population over 16 years of age (49,419), 46.2% or 22,832 individuals are in the labor force, with 5.9% or 1,347 of them unemployed. The age group with the highest labor force participation rate is 25 to 29 years, with 91.7% or 2,587 individuals in the labor force. Within the labor force, the 30 to 34 years age range has the highest percentage of unemployed individuals, with 9.6% or 281 of them being unemployed.
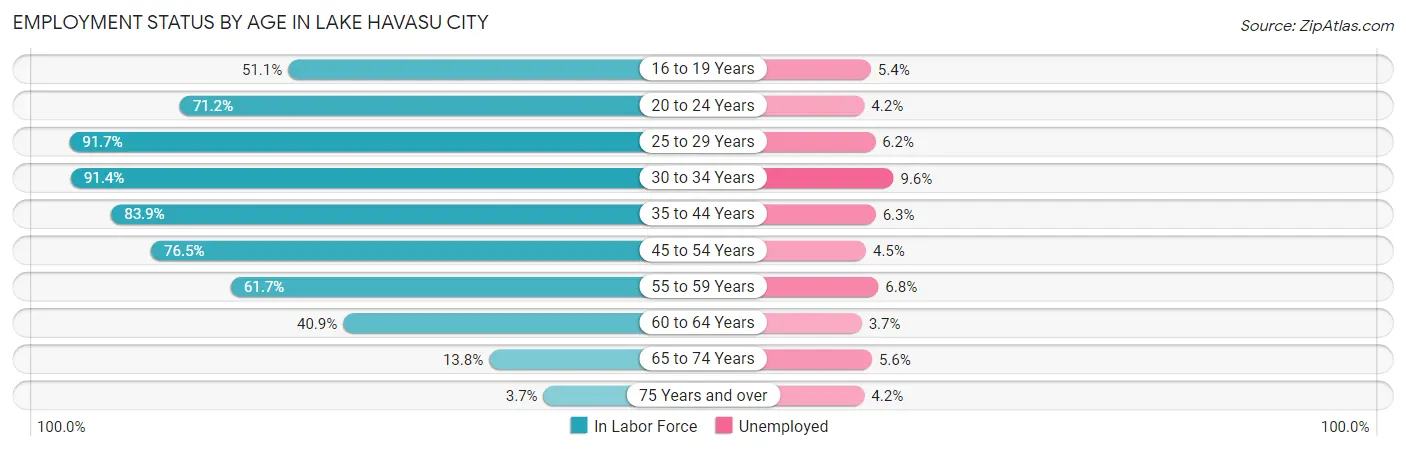
| Age Bracket | In Labor Force | Unemployed |
| 16 to 19 Years | 1,078 (51.1%) | 58 (5.4%) |
| 20 to 24 Years | 1,670 (71.2%) | 70 (4.2%) |
| 25 to 29 Years | 2,587 (91.7%) | 160 (6.2%) |
| 30 to 34 Years | 2,922 (91.4%) | 281 (9.6%) |
| 35 to 44 Years | 4,132 (83.9%) | 260 (6.3%) |
| 45 to 54 Years | 4,442 (76.5%) | 200 (4.5%) |
| 55 to 59 Years | 2,055 (61.7%) | 140 (6.8%) |
| 60 to 64 Years | 2,053 (40.9%) | 76 (3.7%) |
| 65 to 74 Years | 1,577 (13.8%) | 88 (5.6%) |
| 75 Years and over | 312 (3.7%) | 13 (4.2%) |
| Total | 22,832 (46.2%) | 1,347 (5.9%) |
Employment Status by Educational Attainment in Lake Havasu City
According to labor force statistics for Lake Havasu City, 72.5% of individuals (18,198) out of the total population between 25 and 64 years of age (25,100) are in the labor force, with 6.1% or 1,110 of them being unemployed. The group with the highest labor force participation rate are those with the educational attainment of high school diploma, with 73.2% or 5,396 individuals in the labor force. Within the labor force, individuals with less than high school education have the highest percentage of unemployment, with 11.0% or 192 of them being unemployed.
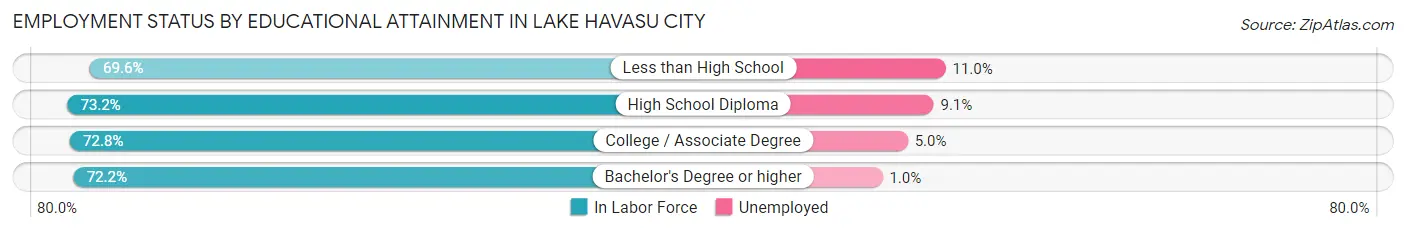
| Educational Attainment | In Labor Force | Unemployed |
| Less than High School | 1,748 (69.6%) | 276 (11.0%) |
| High School Diploma | 5,396 (73.2%) | 671 (9.1%) |
| College / Associate Degree | 7,947 (72.8%) | 546 (5.0%) |
| Bachelor's Degree or higher | 3,106 (72.2%) | 43 (1.0%) |
| Total | 18,198 (72.5%) | 1,531 (6.1%) |
Employment Occupations by Sex in Lake Havasu City
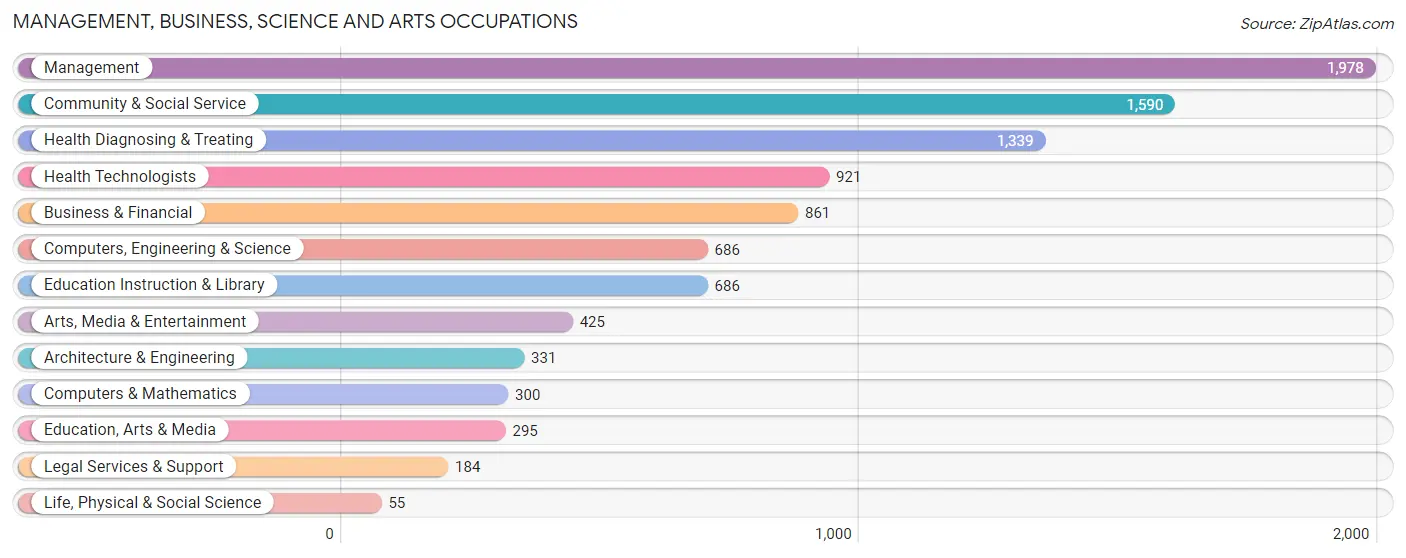
Management, Business, Science and Arts Occupations
The most common Management, Business, Science and Arts occupations in Lake Havasu City are Management (1,978 | 9.2%), Community & Social Service (1,590 | 7.4%), Health Diagnosing & Treating (1,339 | 6.2%), Health Technologists (921 | 4.3%), and Business & Financial (861 | 4.0%).
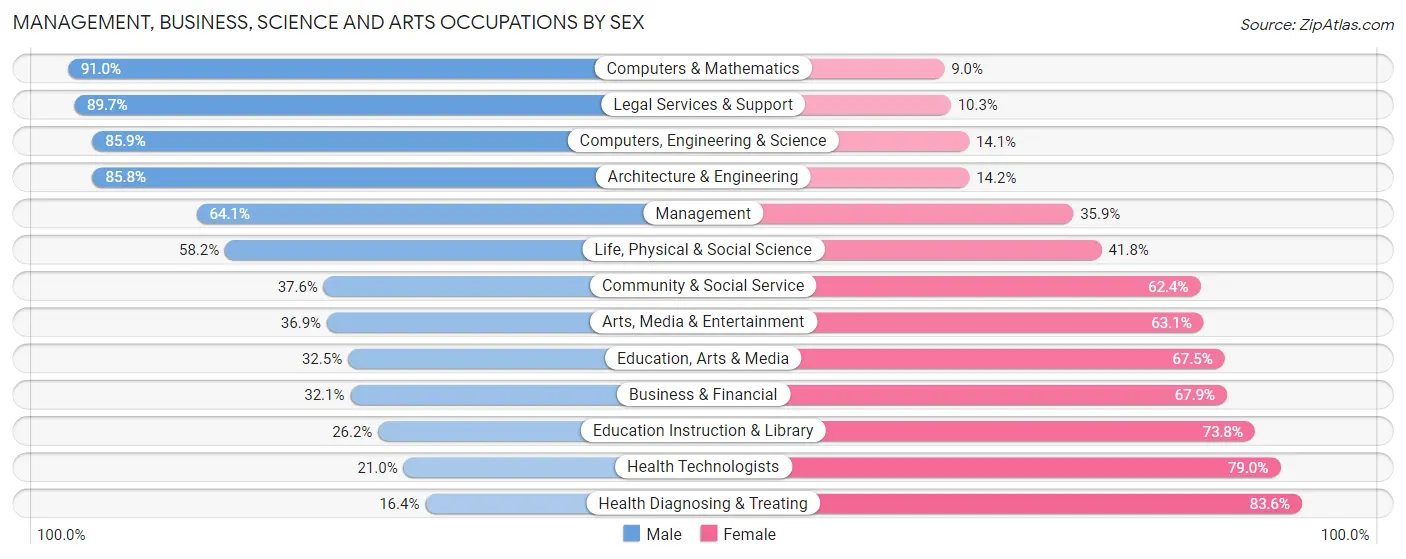
Management, Business, Science and Arts Occupations by Sex
Within the Management, Business, Science and Arts occupations in Lake Havasu City, the most male-oriented occupations are Computers & Mathematics (91.0%), Legal Services & Support (89.7%), and Computers, Engineering & Science (85.9%), while the most female-oriented occupations are Health Diagnosing & Treating (83.6%), Health Technologists (79.0%), and Education Instruction & Library (73.8%).
| Occupation | Male | Female |
| Management | 1,268 (64.1%) | 710 (35.9%) |
| Business & Financial | 276 (32.1%) | 585 (67.9%) |
| Computers, Engineering & Science | 589 (85.9%) | 97 (14.1%) |
| Computers & Mathematics | 273 (91.0%) | 27 (9.0%) |
| Architecture & Engineering | 284 (85.8%) | 47 (14.2%) |
| Life, Physical & Social Science | 32 (58.2%) | 23 (41.8%) |
| Community & Social Service | 598 (37.6%) | 992 (62.4%) |
| Education, Arts & Media | 96 (32.5%) | 199 (67.5%) |
| Legal Services & Support | 165 (89.7%) | 19 (10.3%) |
| Education Instruction & Library | 180 (26.2%) | 506 (73.8%) |
| Arts, Media & Entertainment | 157 (36.9%) | 268 (63.1%) |
| Health Diagnosing & Treating | 220 (16.4%) | 1,119 (83.6%) |
| Health Technologists | 193 (21.0%) | 728 (79.0%) |
| Total (Category) | 2,951 (45.7%) | 3,503 (54.3%) |
| Total (Overall) | 11,106 (51.7%) | 10,377 (48.3%) |
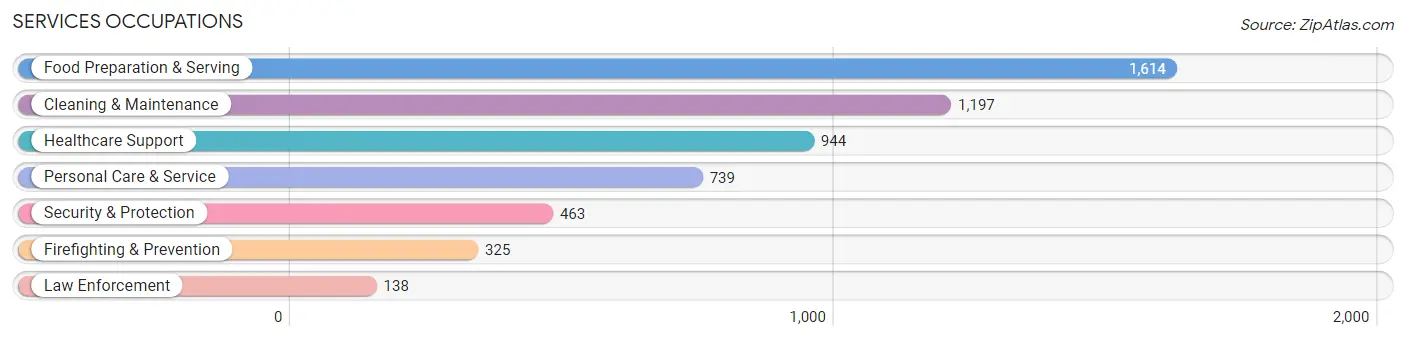
Services Occupations
The most common Services occupations in Lake Havasu City are Food Preparation & Serving (1,614 | 7.5%), Cleaning & Maintenance (1,197 | 5.6%), Healthcare Support (944 | 4.4%), Personal Care & Service (739 | 3.4%), and Security & Protection (463 | 2.2%).
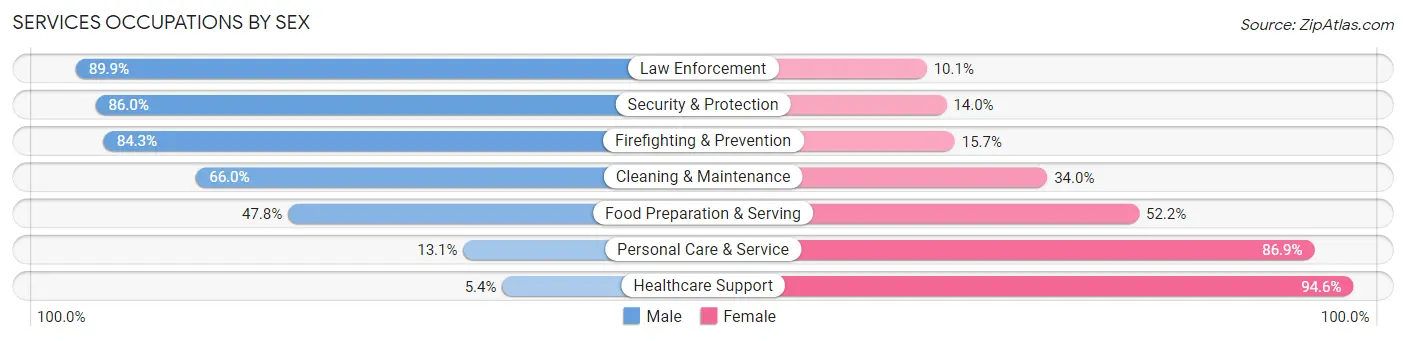
Services Occupations by Sex
Within the Services occupations in Lake Havasu City, the most male-oriented occupations are Law Enforcement (89.9%), Security & Protection (86.0%), and Firefighting & Prevention (84.3%), while the most female-oriented occupations are Healthcare Support (94.6%), Personal Care & Service (86.9%), and Food Preparation & Serving (52.2%).
| Occupation | Male | Female |
| Healthcare Support | 51 (5.4%) | 893 (94.6%) |
| Security & Protection | 398 (86.0%) | 65 (14.0%) |
| Firefighting & Prevention | 274 (84.3%) | 51 (15.7%) |
| Law Enforcement | 124 (89.9%) | 14 (10.1%) |
| Food Preparation & Serving | 772 (47.8%) | 842 (52.2%) |
| Cleaning & Maintenance | 790 (66.0%) | 407 (34.0%) |
| Personal Care & Service | 97 (13.1%) | 642 (86.9%) |
| Total (Category) | 2,108 (42.5%) | 2,849 (57.5%) |
| Total (Overall) | 11,106 (51.7%) | 10,377 (48.3%) |
Sales and Office Occupations
The most common Sales and Office occupations in Lake Havasu City are Office & Administration (3,020 | 14.1%), and Sales & Related (2,360 | 11.0%).

Sales and Office Occupations by Sex
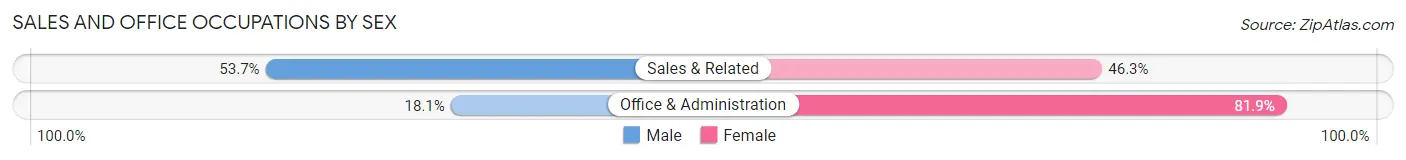
| Occupation | Male | Female |
| Sales & Related | 1,267 (53.7%) | 1,093 (46.3%) |
| Office & Administration | 546 (18.1%) | 2,474 (81.9%) |
| Total (Category) | 1,813 (33.7%) | 3,567 (66.3%) |
| Total (Overall) | 11,106 (51.7%) | 10,377 (48.3%) |
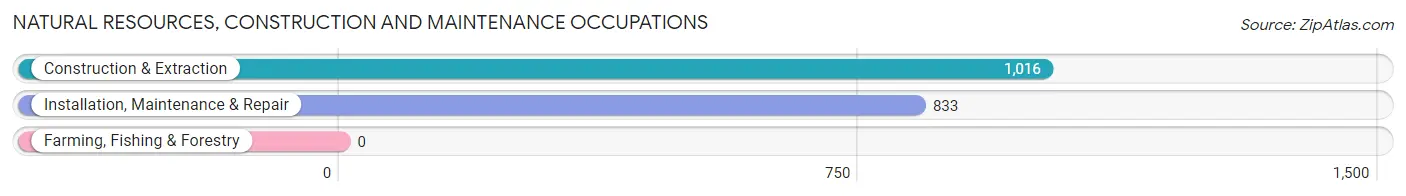
Natural Resources, Construction and Maintenance Occupations
The most common Natural Resources, Construction and Maintenance occupations in Lake Havasu City are Construction & Extraction (1,016 | 4.7%), and Installation, Maintenance & Repair (833 | 3.9%).
Natural Resources, Construction and Maintenance Occupations by Sex
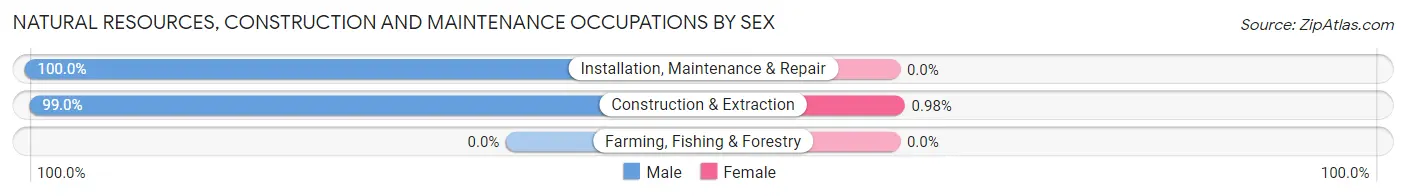
| Occupation | Male | Female |
| Farming, Fishing & Forestry | 0 (0.0%) | 0 (0.0%) |
| Construction & Extraction | 1,006 (99.0%) | 10 (1.0%) |
| Installation, Maintenance & Repair | 833 (100.0%) | 0 (0.0%) |
| Total (Category) | 1,839 (99.5%) | 10 (0.5%) |
| Total (Overall) | 11,106 (51.7%) | 10,377 (48.3%) |
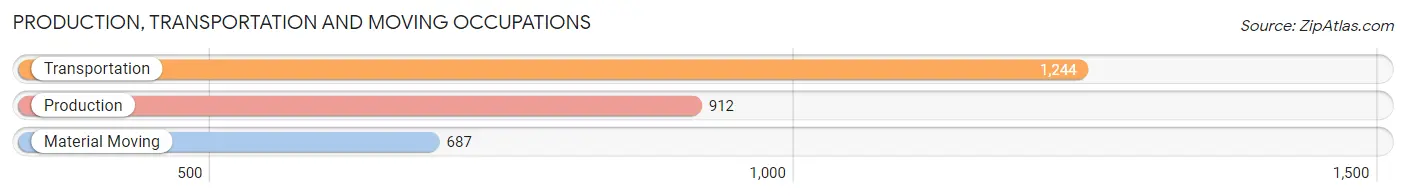
Production, Transportation and Moving Occupations
The most common Production, Transportation and Moving occupations in Lake Havasu City are Transportation (1,244 | 5.8%), Production (912 | 4.3%), and Material Moving (687 | 3.2%).
Production, Transportation and Moving Occupations by Sex
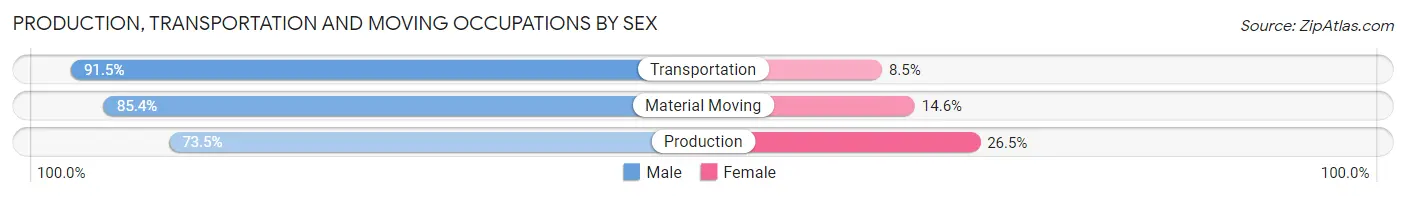
| Occupation | Male | Female |
| Production | 670 (73.5%) | 242 (26.5%) |
| Transportation | 1,138 (91.5%) | 106 (8.5%) |
| Material Moving | 587 (85.4%) | 100 (14.6%) |
| Total (Category) | 2,395 (84.2%) | 448 (15.8%) |
| Total (Overall) | 11,106 (51.7%) | 10,377 (48.3%) |
Employment Industries by Sex in Lake Havasu City
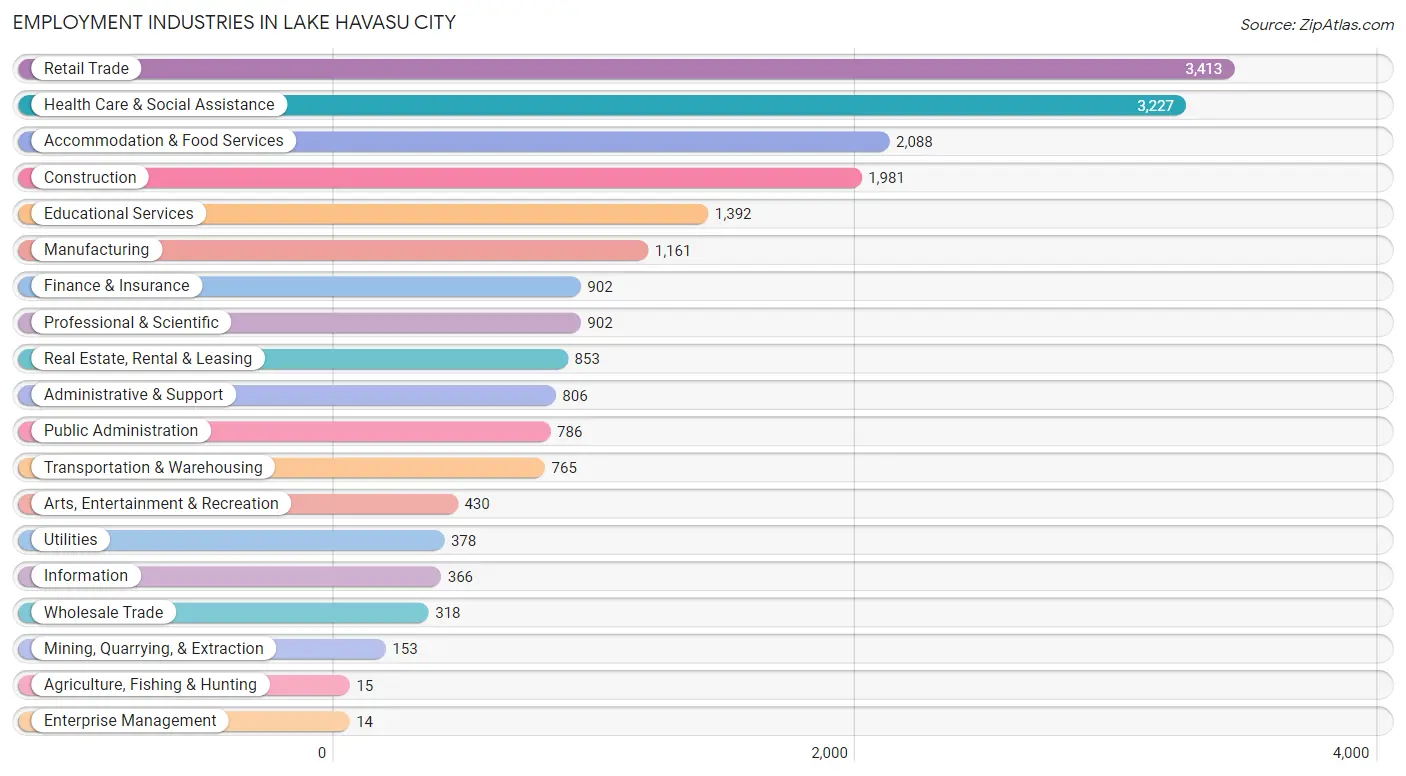
Employment Industries in Lake Havasu City
The major employment industries in Lake Havasu City include Retail Trade (3,413 | 15.9%), Health Care & Social Assistance (3,227 | 15.0%), Accommodation & Food Services (2,088 | 9.7%), Construction (1,981 | 9.2%), and Educational Services (1,392 | 6.5%).
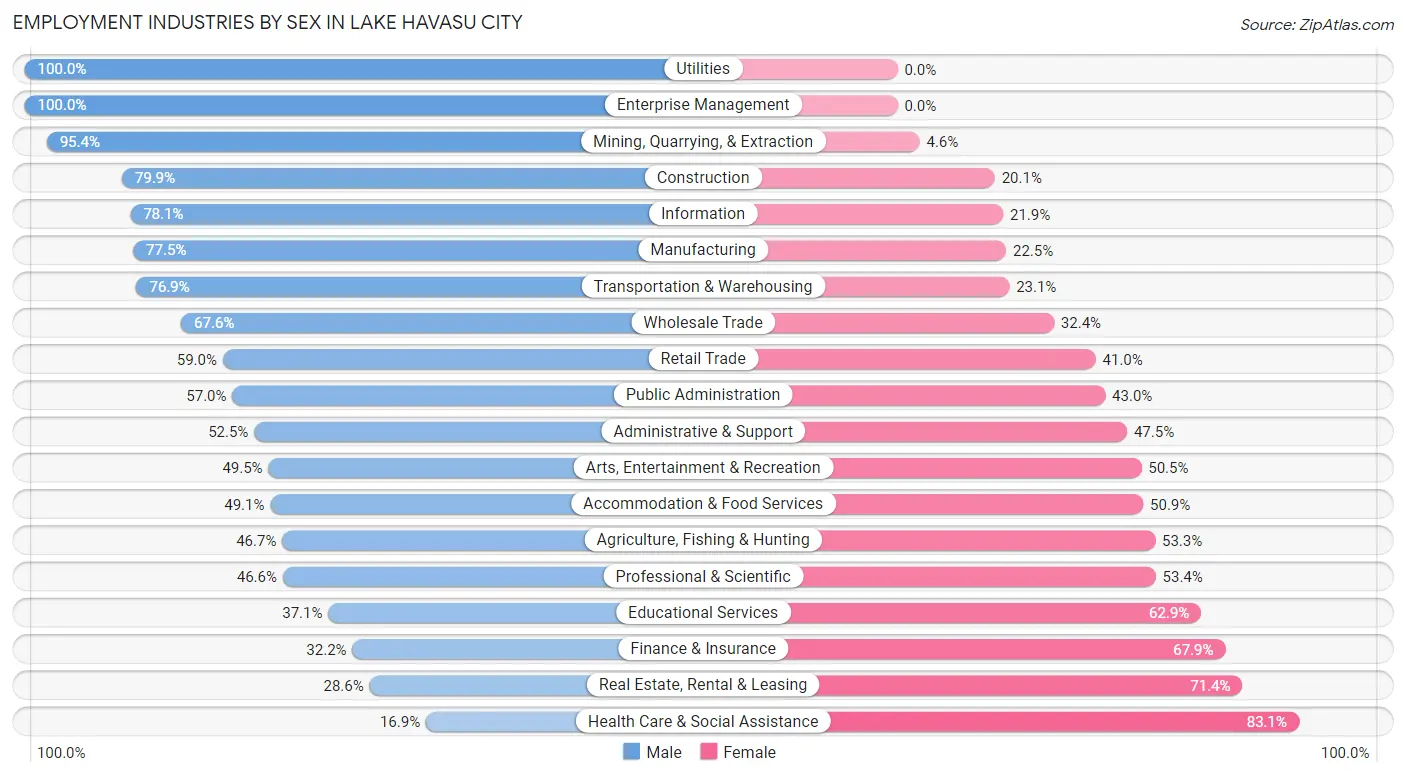
Employment Industries by Sex in Lake Havasu City
The Lake Havasu City industries that see more men than women are Utilities (100.0%), Enterprise Management (100.0%), and Mining, Quarrying, & Extraction (95.4%), whereas the industries that tend to have a higher number of women are Health Care & Social Assistance (83.1%), Real Estate, Rental & Leasing (71.4%), and Finance & Insurance (67.8%).
| Industry | Male | Female |
| Agriculture, Fishing & Hunting | 7 (46.7%) | 8 (53.3%) |
| Mining, Quarrying, & Extraction | 146 (95.4%) | 7 (4.6%) |
| Construction | 1,582 (79.9%) | 399 (20.1%) |
| Manufacturing | 900 (77.5%) | 261 (22.5%) |
| Wholesale Trade | 215 (67.6%) | 103 (32.4%) |
| Retail Trade | 2,013 (59.0%) | 1,400 (41.0%) |
| Transportation & Warehousing | 588 (76.9%) | 177 (23.1%) |
| Utilities | 378 (100.0%) | 0 (0.0%) |
| Information | 286 (78.1%) | 80 (21.9%) |
| Finance & Insurance | 290 (32.2%) | 612 (67.8%) |
| Real Estate, Rental & Leasing | 244 (28.6%) | 609 (71.4%) |
| Professional & Scientific | 420 (46.6%) | 482 (53.4%) |
| Enterprise Management | 14 (100.0%) | 0 (0.0%) |
| Administrative & Support | 423 (52.5%) | 383 (47.5%) |
| Educational Services | 517 (37.1%) | 875 (62.9%) |
| Health Care & Social Assistance | 546 (16.9%) | 2,681 (83.1%) |
| Arts, Entertainment & Recreation | 213 (49.5%) | 217 (50.5%) |
| Accommodation & Food Services | 1,026 (49.1%) | 1,062 (50.9%) |
| Public Administration | 448 (57.0%) | 338 (43.0%) |
| Total | 11,106 (51.7%) | 10,377 (48.3%) |
Education in Lake Havasu City
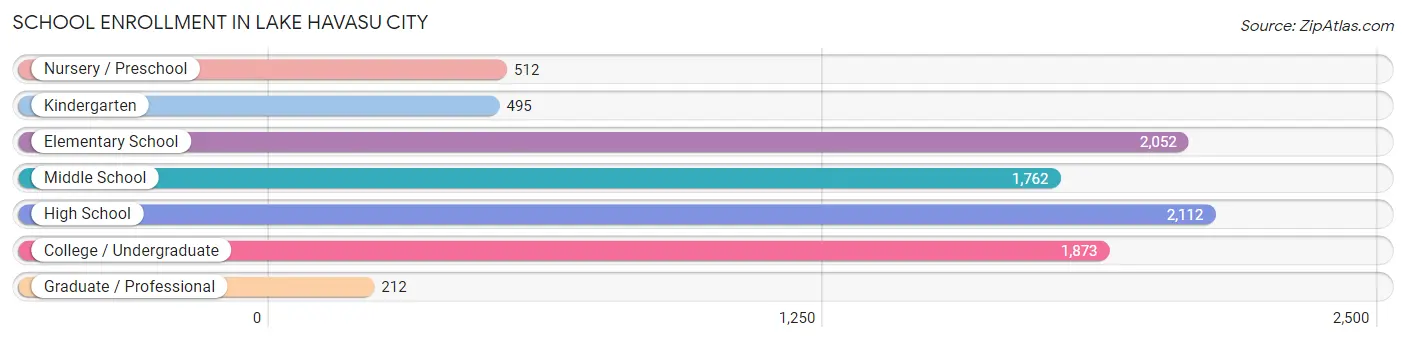
School Enrollment in Lake Havasu City
The most common levels of schooling among the 9,018 students in Lake Havasu City are high school (2,112 | 23.4%), elementary school (2,052 | 22.8%), and college / undergraduate (1,873 | 20.8%).
| School Level | # Students | % Students |
| Nursery / Preschool | 512 | 5.7% |
| Kindergarten | 495 | 5.5% |
| Elementary School | 2,052 | 22.8% |
| Middle School | 1,762 | 19.5% |
| High School | 2,112 | 23.4% |
| College / Undergraduate | 1,873 | 20.8% |
| Graduate / Professional | 212 | 2.4% |
| Total | 9,018 | 100.0% |
School Enrollment by Age by Funding Source in Lake Havasu City
Out of a total of 9,018 students who are enrolled in schools in Lake Havasu City, 1,181 (13.1%) attend a private institution, while the remaining 7,837 (86.9%) are enrolled in public schools. The age group of 3 to 4 year olds has the highest likelihood of being enrolled in private schools, with 90 (41.7% in the age bracket) enrolled. Conversely, the age group of 15 to 17 year olds has the lowest likelihood of being enrolled in a private school, with 1,475 (97.6% in the age bracket) attending a public institution.
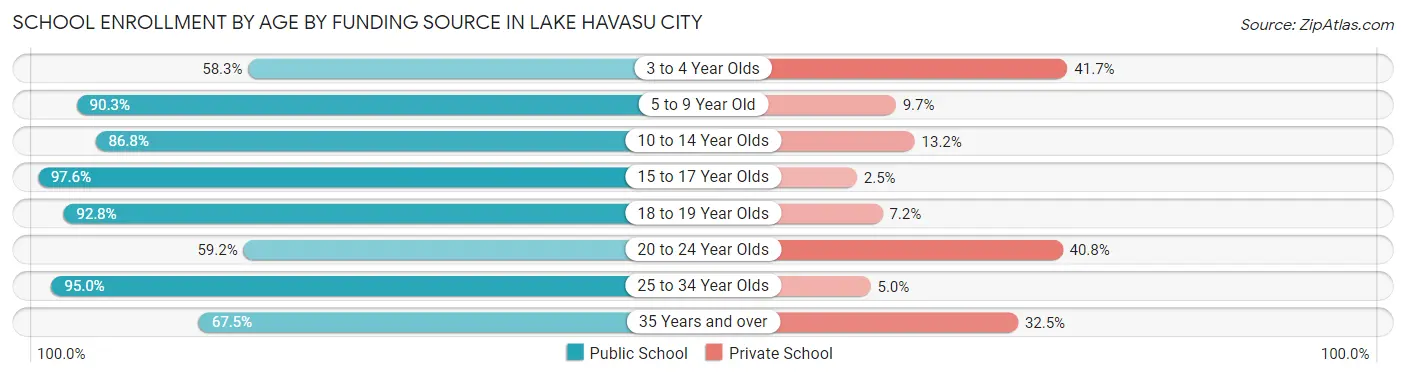
| Age Bracket | Public School | Private School |
| 3 to 4 Year Olds | 126 (58.3%) | 90 (41.7%) |
| 5 to 9 Year Old | 2,339 (90.3%) | 251 (9.7%) |
| 10 to 14 Year Olds | 1,965 (86.8%) | 299 (13.2%) |
| 15 to 17 Year Olds | 1,475 (97.6%) | 37 (2.5%) |
| 18 to 19 Year Olds | 526 (92.8%) | 41 (7.2%) |
| 20 to 24 Year Olds | 353 (59.2%) | 243 (40.8%) |
| 25 to 34 Year Olds | 665 (95.0%) | 35 (5.0%) |
| 35 Years and over | 387 (67.5%) | 186 (32.5%) |
| Total | 7,837 (86.9%) | 1,181 (13.1%) |
Educational Attainment by Field of Study in Lake Havasu City
Business (1,970 | 22.6%), education (1,561 | 17.9%), science & technology (1,193 | 13.7%), psychology (562 | 6.5%), and engineering (543 | 6.2%) are the most common fields of study among 8,718 individuals in Lake Havasu City who have obtained a bachelor's degree or higher.
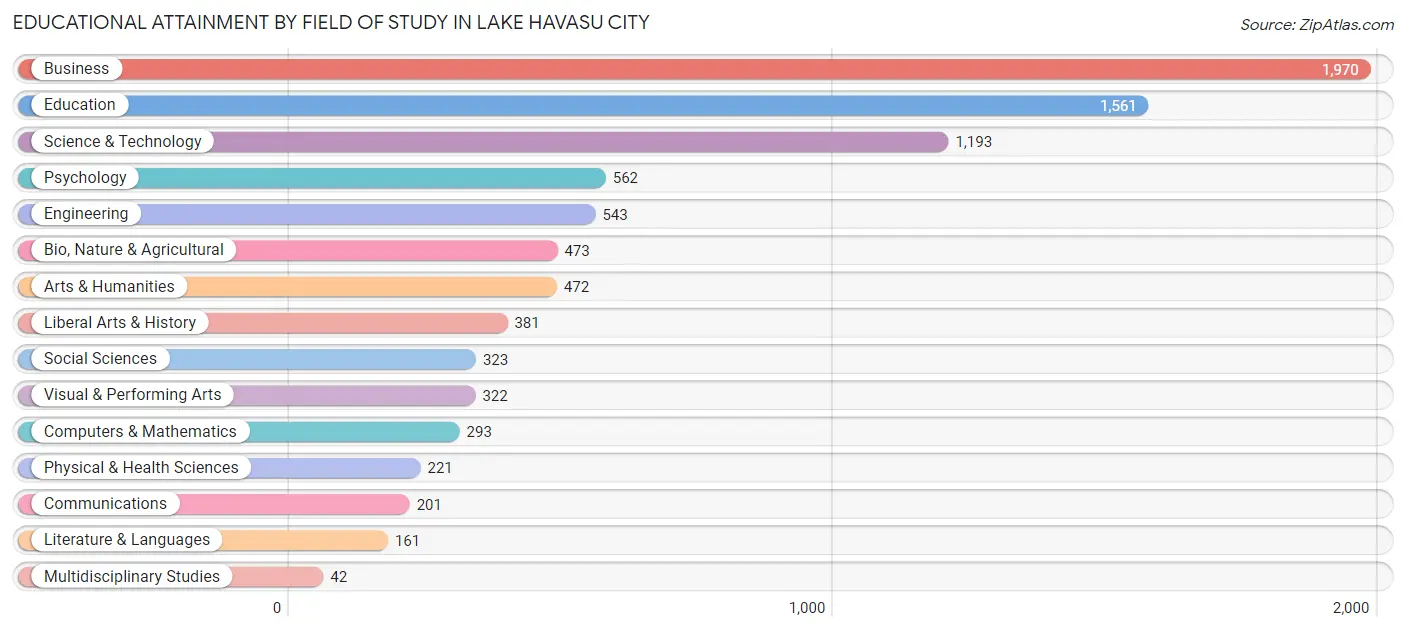
| Field of Study | # Graduates | % Graduates |
| Computers & Mathematics | 293 | 3.4% |
| Bio, Nature & Agricultural | 473 | 5.4% |
| Physical & Health Sciences | 221 | 2.5% |
| Psychology | 562 | 6.5% |
| Social Sciences | 323 | 3.7% |
| Engineering | 543 | 6.2% |
| Multidisciplinary Studies | 42 | 0.5% |
| Science & Technology | 1,193 | 13.7% |
| Business | 1,970 | 22.6% |
| Education | 1,561 | 17.9% |
| Literature & Languages | 161 | 1.8% |
| Liberal Arts & History | 381 | 4.4% |
| Visual & Performing Arts | 322 | 3.7% |
| Communications | 201 | 2.3% |
| Arts & Humanities | 472 | 5.4% |
| Total | 8,718 | 100.0% |
Transportation & Commute in Lake Havasu City
Vehicle Availability by Sex in Lake Havasu City
The most prevalent vehicle ownership categories in Lake Havasu City are males with 2 vehicles (3,523, accounting for 32.2%) and females with 2 vehicles (3,530, making up 34.5%).
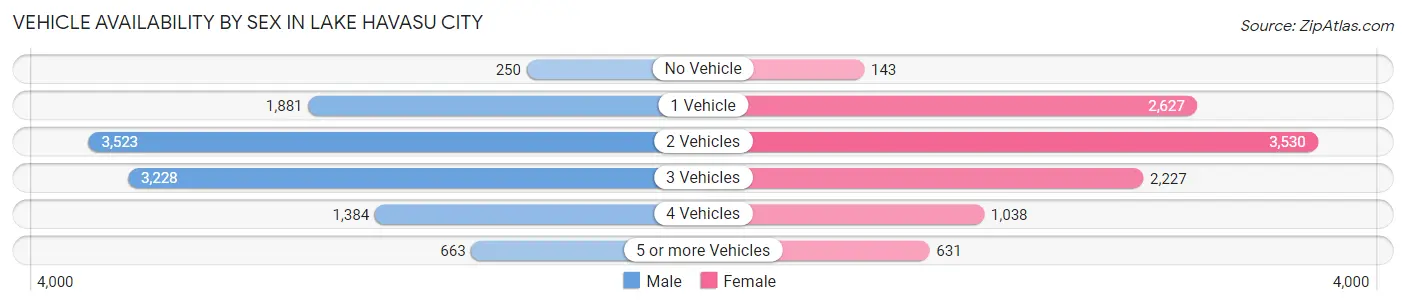
| Vehicles Available | Male | Female |
| No Vehicle | 250 (2.3%) | 143 (1.4%) |
| 1 Vehicle | 1,881 (17.2%) | 2,627 (25.8%) |
| 2 Vehicles | 3,523 (32.2%) | 3,530 (34.6%) |
| 3 Vehicles | 3,228 (29.5%) | 2,227 (21.8%) |
| 4 Vehicles | 1,384 (12.7%) | 1,038 (10.2%) |
| 5 or more Vehicles | 663 (6.1%) | 631 (6.2%) |
| Total | 10,929 (100.0%) | 10,196 (100.0%) |
Commute Time in Lake Havasu City
The most frequently occuring commute durations in Lake Havasu City are 10 to 14 minutes (5,538 commuters, 28.7%), 15 to 19 minutes (4,251 commuters, 22.0%), and 5 to 9 minutes (3,894 commuters, 20.2%).
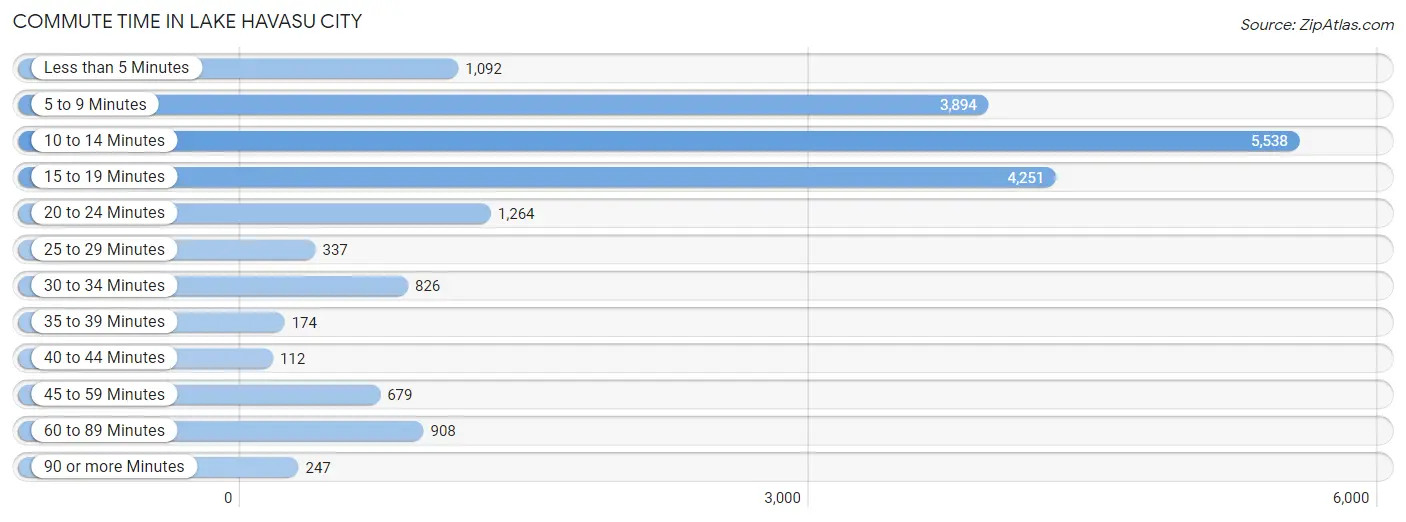
| Commute Time | # Commuters | % Commuters |
| Less than 5 Minutes | 1,092 | 5.7% |
| 5 to 9 Minutes | 3,894 | 20.2% |
| 10 to 14 Minutes | 5,538 | 28.7% |
| 15 to 19 Minutes | 4,251 | 22.0% |
| 20 to 24 Minutes | 1,264 | 6.5% |
| 25 to 29 Minutes | 337 | 1.7% |
| 30 to 34 Minutes | 826 | 4.3% |
| 35 to 39 Minutes | 174 | 0.9% |
| 40 to 44 Minutes | 112 | 0.6% |
| 45 to 59 Minutes | 679 | 3.5% |
| 60 to 89 Minutes | 908 | 4.7% |
| 90 or more Minutes | 247 | 1.3% |
Commute Time by Sex in Lake Havasu City
The most common commute times in Lake Havasu City are 10 to 14 minutes (2,952 commuters, 28.6%) for males and 10 to 14 minutes (2,586 commuters, 28.7%) for females.
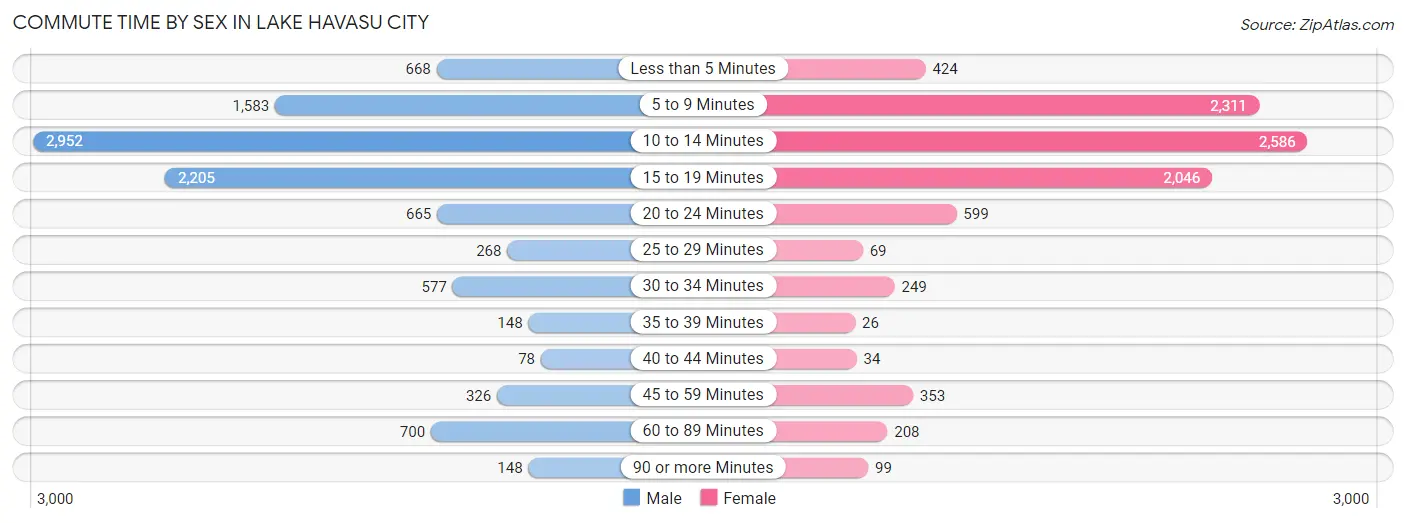
| Commute Time | Male | Female |
| Less than 5 Minutes | 668 (6.5%) | 424 (4.7%) |
| 5 to 9 Minutes | 1,583 (15.3%) | 2,311 (25.7%) |
| 10 to 14 Minutes | 2,952 (28.6%) | 2,586 (28.7%) |
| 15 to 19 Minutes | 2,205 (21.4%) | 2,046 (22.7%) |
| 20 to 24 Minutes | 665 (6.5%) | 599 (6.7%) |
| 25 to 29 Minutes | 268 (2.6%) | 69 (0.8%) |
| 30 to 34 Minutes | 577 (5.6%) | 249 (2.8%) |
| 35 to 39 Minutes | 148 (1.4%) | 26 (0.3%) |
| 40 to 44 Minutes | 78 (0.8%) | 34 (0.4%) |
| 45 to 59 Minutes | 326 (3.2%) | 353 (3.9%) |
| 60 to 89 Minutes | 700 (6.8%) | 208 (2.3%) |
| 90 or more Minutes | 148 (1.4%) | 99 (1.1%) |
Time of Departure to Work by Sex in Lake Havasu City
The most frequent times of departure to work in Lake Havasu City are 7:30 AM to 7:59 AM (1,522, 14.7%) for males and 7:30 AM to 7:59 AM (2,179, 24.2%) for females.
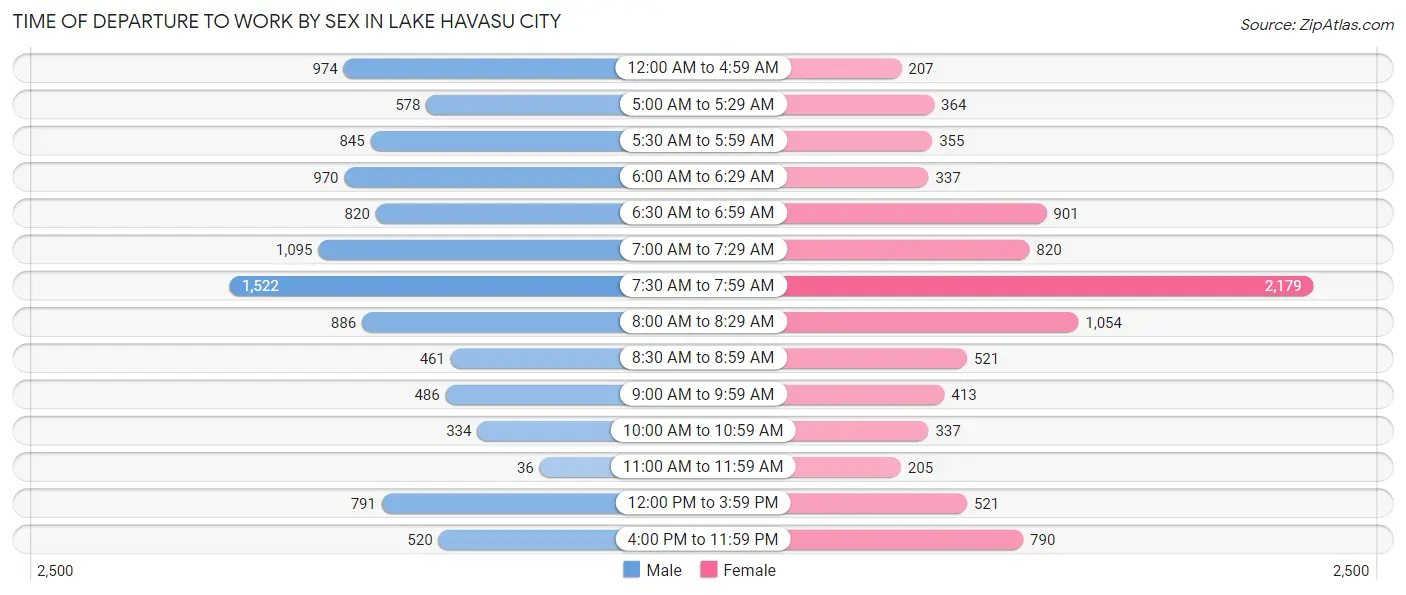
| Time of Departure | Male | Female |
| 12:00 AM to 4:59 AM | 974 (9.4%) | 207 (2.3%) |
| 5:00 AM to 5:29 AM | 578 (5.6%) | 364 (4.0%) |
| 5:30 AM to 5:59 AM | 845 (8.2%) | 355 (3.9%) |
| 6:00 AM to 6:29 AM | 970 (9.4%) | 337 (3.7%) |
| 6:30 AM to 6:59 AM | 820 (8.0%) | 901 (10.0%) |
| 7:00 AM to 7:29 AM | 1,095 (10.6%) | 820 (9.1%) |
| 7:30 AM to 7:59 AM | 1,522 (14.7%) | 2,179 (24.2%) |
| 8:00 AM to 8:29 AM | 886 (8.6%) | 1,054 (11.7%) |
| 8:30 AM to 8:59 AM | 461 (4.5%) | 521 (5.8%) |
| 9:00 AM to 9:59 AM | 486 (4.7%) | 413 (4.6%) |
| 10:00 AM to 10:59 AM | 334 (3.2%) | 337 (3.7%) |
| 11:00 AM to 11:59 AM | 36 (0.4%) | 205 (2.3%) |
| 12:00 PM to 3:59 PM | 791 (7.7%) | 521 (5.8%) |
| 4:00 PM to 11:59 PM | 520 (5.0%) | 790 (8.8%) |
| Total | 10,318 (100.0%) | 9,004 (100.0%) |
Housing Occupancy in Lake Havasu City
Occupancy by Ownership in Lake Havasu City
Of the total 26,711 dwellings in Lake Havasu City, owner-occupied units account for 19,856 (74.3%), while renter-occupied units make up 6,855 (25.7%).
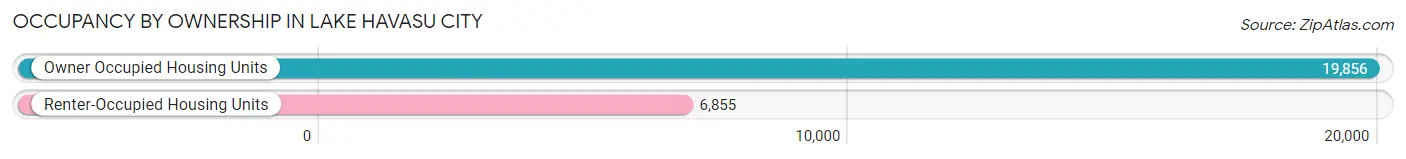
| Occupancy | # Housing Units | % Housing Units |
| Owner Occupied Housing Units | 19,856 | 74.3% |
| Renter-Occupied Housing Units | 6,855 | 25.7% |
| Total Occupied Housing Units | 26,711 | 100.0% |
Occupancy by Household Size in Lake Havasu City
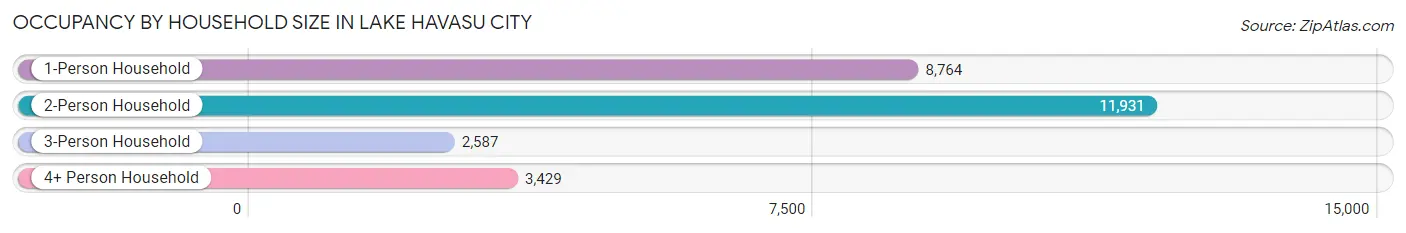
| Household Size | # Housing Units | % Housing Units |
| 1-Person Household | 8,764 | 32.8% |
| 2-Person Household | 11,931 | 44.7% |
| 3-Person Household | 2,587 | 9.7% |
| 4+ Person Household | 3,429 | 12.8% |
| Total Housing Units | 26,711 | 100.0% |
Occupancy by Ownership by Household Size in Lake Havasu City
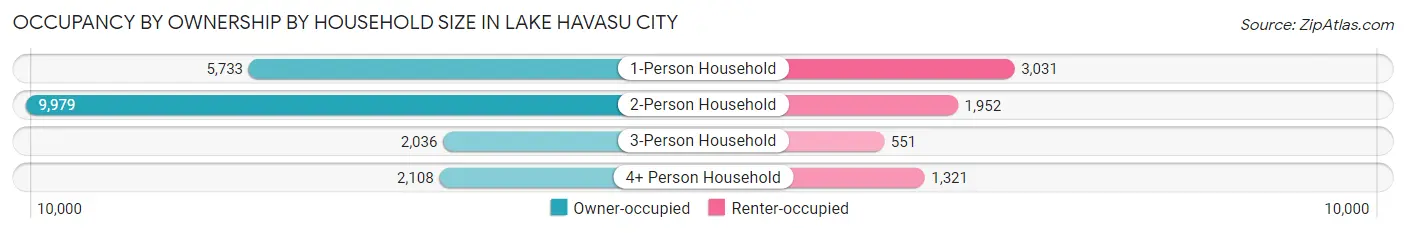
| Household Size | Owner-occupied | Renter-occupied |
| 1-Person Household | 5,733 (65.4%) | 3,031 (34.6%) |
| 2-Person Household | 9,979 (83.6%) | 1,952 (16.4%) |
| 3-Person Household | 2,036 (78.7%) | 551 (21.3%) |
| 4+ Person Household | 2,108 (61.5%) | 1,321 (38.5%) |
| Total Housing Units | 19,856 (74.3%) | 6,855 (25.7%) |
Occupancy by Educational Attainment in Lake Havasu City
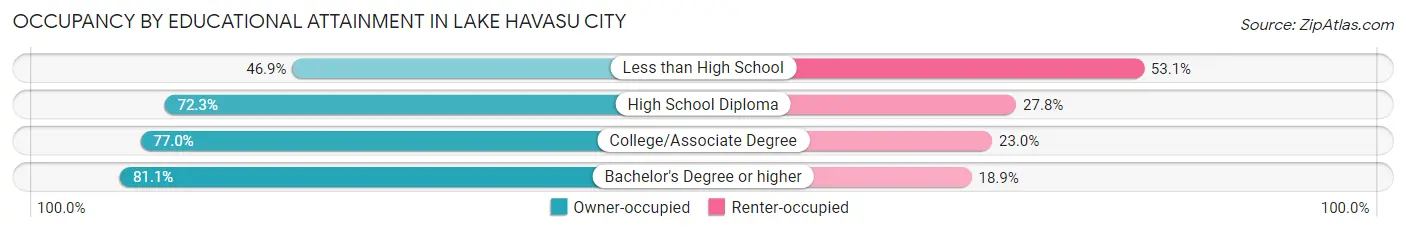
| Household Size | Owner-occupied | Renter-occupied |
| Less than High School | 884 (46.9%) | 1,000 (53.1%) |
| High School Diploma | 5,561 (72.3%) | 2,136 (27.8%) |
| College/Associate Degree | 9,101 (77.0%) | 2,714 (23.0%) |
| Bachelor's Degree or higher | 4,310 (81.1%) | 1,005 (18.9%) |
Occupancy by Age of Householder in Lake Havasu City
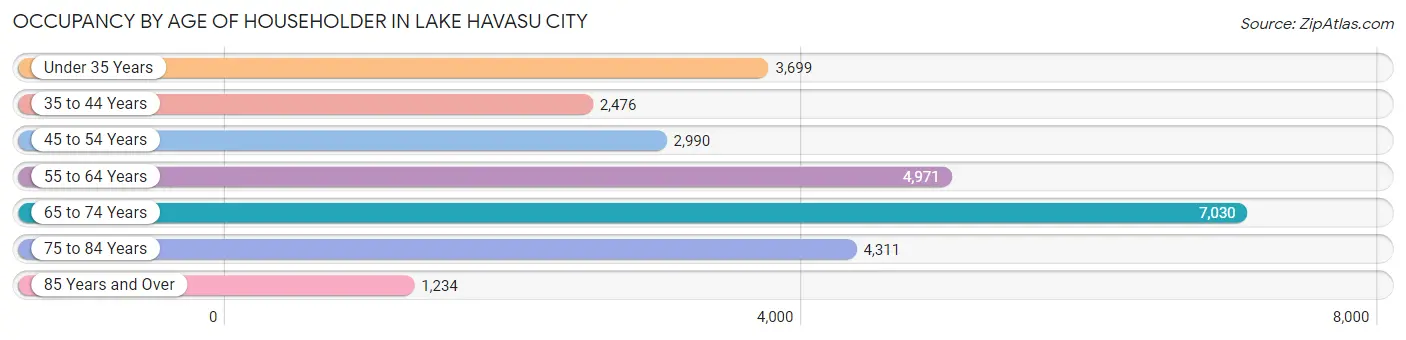
| Age Bracket | # Households | % Households |
| Under 35 Years | 3,699 | 13.9% |
| 35 to 44 Years | 2,476 | 9.3% |
| 45 to 54 Years | 2,990 | 11.2% |
| 55 to 64 Years | 4,971 | 18.6% |
| 65 to 74 Years | 7,030 | 26.3% |
| 75 to 84 Years | 4,311 | 16.1% |
| 85 Years and Over | 1,234 | 4.6% |
| Total | 26,711 | 100.0% |
Housing Finances in Lake Havasu City
Median Income by Occupancy in Lake Havasu City
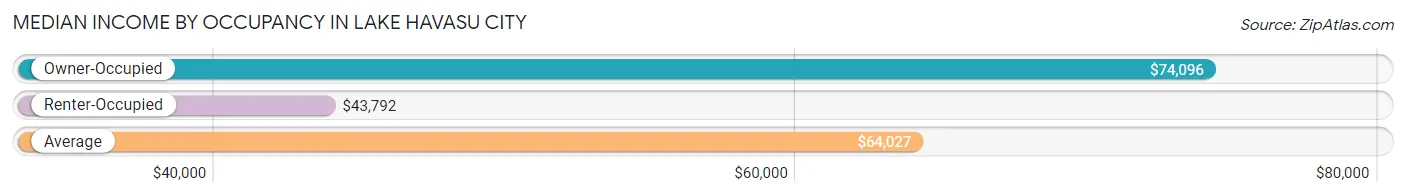
| Occupancy Type | # Households | Median Income |
| Owner-Occupied | 19,856 (74.3%) | $74,096 |
| Renter-Occupied | 6,855 (25.7%) | $43,792 |
| Average | 26,711 (100.0%) | $64,027 |
Occupancy by Householder Income Bracket in Lake Havasu City
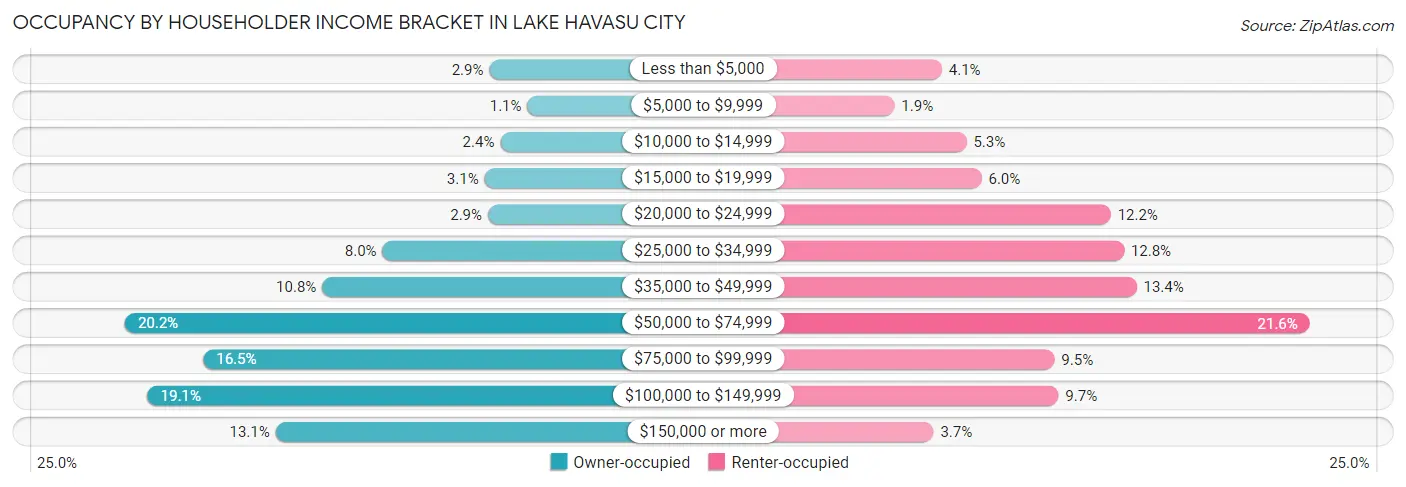
| Income Bracket | Owner-occupied | Renter-occupied |
| Less than $5,000 | 569 (2.9%) | 282 (4.1%) |
| $5,000 to $9,999 | 210 (1.1%) | 127 (1.8%) |
| $10,000 to $14,999 | 466 (2.4%) | 362 (5.3%) |
| $15,000 to $19,999 | 615 (3.1%) | 411 (6.0%) |
| $20,000 to $24,999 | 584 (2.9%) | 833 (12.1%) |
| $25,000 to $34,999 | 1,581 (8.0%) | 876 (12.8%) |
| $35,000 to $49,999 | 2,150 (10.8%) | 917 (13.4%) |
| $50,000 to $74,999 | 4,014 (20.2%) | 1,482 (21.6%) |
| $75,000 to $99,999 | 3,275 (16.5%) | 649 (9.5%) |
| $100,000 to $149,999 | 3,801 (19.1%) | 662 (9.7%) |
| $150,000 or more | 2,591 (13.1%) | 254 (3.7%) |
| Total | 19,856 (100.0%) | 6,855 (100.0%) |
Monthly Housing Cost Tiers in Lake Havasu City
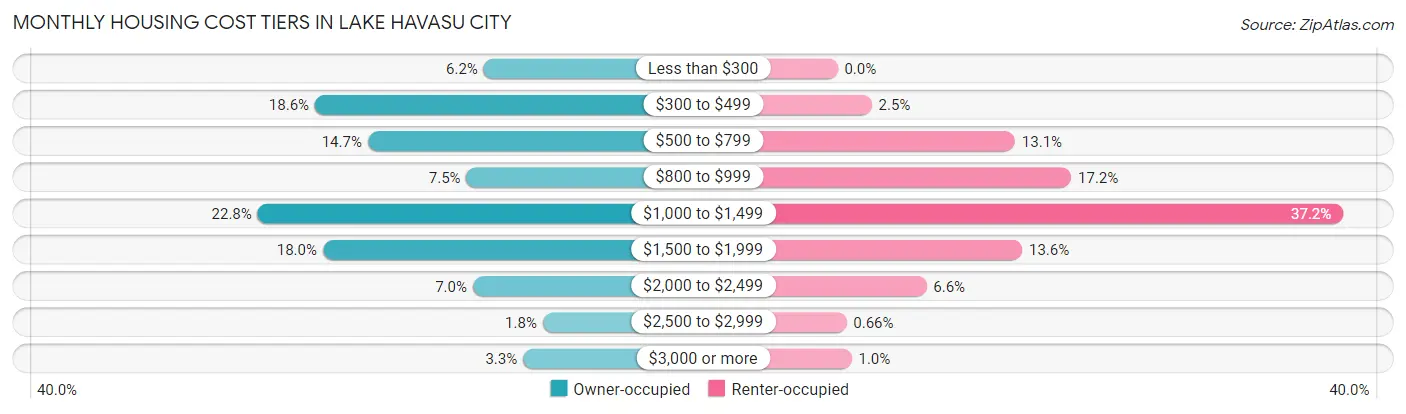
| Monthly Cost | Owner-occupied | Renter-occupied |
| Less than $300 | 1,229 (6.2%) | 0 (0.0%) |
| $300 to $499 | 3,698 (18.6%) | 173 (2.5%) |
| $500 to $799 | 2,924 (14.7%) | 896 (13.1%) |
| $800 to $999 | 1,481 (7.5%) | 1,180 (17.2%) |
| $1,000 to $1,499 | 4,535 (22.8%) | 2,553 (37.2%) |
| $1,500 to $1,999 | 3,582 (18.0%) | 932 (13.6%) |
| $2,000 to $2,499 | 1,388 (7.0%) | 449 (6.6%) |
| $2,500 to $2,999 | 365 (1.8%) | 45 (0.7%) |
| $3,000 or more | 654 (3.3%) | 71 (1.0%) |
| Total | 19,856 (100.0%) | 6,855 (100.0%) |
Physical Housing Characteristics in Lake Havasu City
Housing Structures in Lake Havasu City
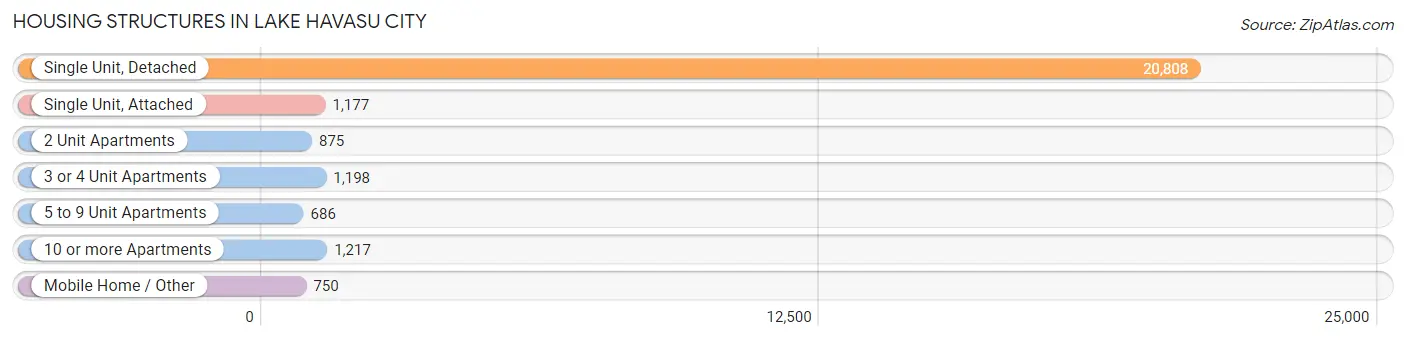
| Structure Type | # Housing Units | % Housing Units |
| Single Unit, Detached | 20,808 | 77.9% |
| Single Unit, Attached | 1,177 | 4.4% |
| 2 Unit Apartments | 875 | 3.3% |
| 3 or 4 Unit Apartments | 1,198 | 4.5% |
| 5 to 9 Unit Apartments | 686 | 2.6% |
| 10 or more Apartments | 1,217 | 4.6% |
| Mobile Home / Other | 750 | 2.8% |
| Total | 26,711 | 100.0% |
Housing Structures by Occupancy in Lake Havasu City
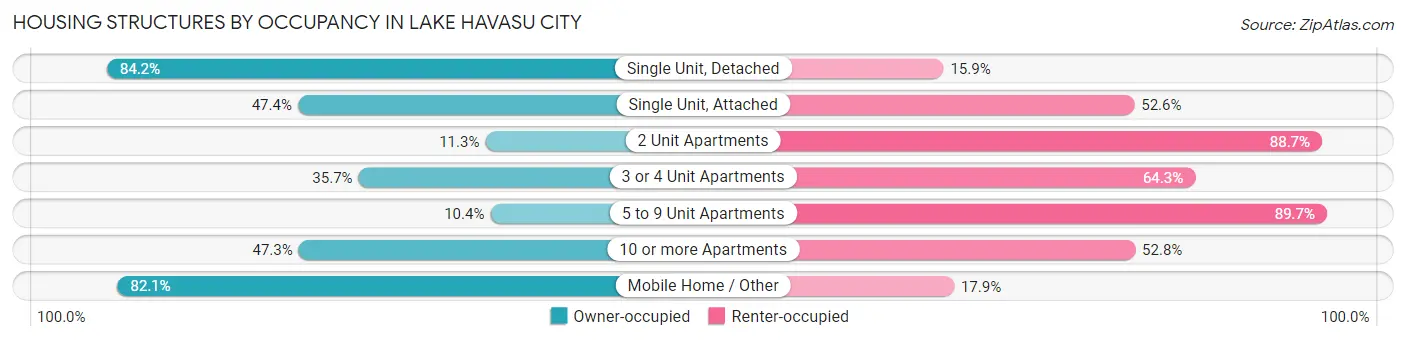
| Structure Type | Owner-occupied | Renter-occupied |
| Single Unit, Detached | 17,509 (84.2%) | 3,299 (15.9%) |
| Single Unit, Attached | 558 (47.4%) | 619 (52.6%) |
| 2 Unit Apartments | 99 (11.3%) | 776 (88.7%) |
| 3 or 4 Unit Apartments | 428 (35.7%) | 770 (64.3%) |
| 5 to 9 Unit Apartments | 71 (10.3%) | 615 (89.6%) |
| 10 or more Apartments | 575 (47.2%) | 642 (52.7%) |
| Mobile Home / Other | 616 (82.1%) | 134 (17.9%) |
| Total | 19,856 (74.3%) | 6,855 (25.7%) |
Housing Structures by Number of Rooms in Lake Havasu City
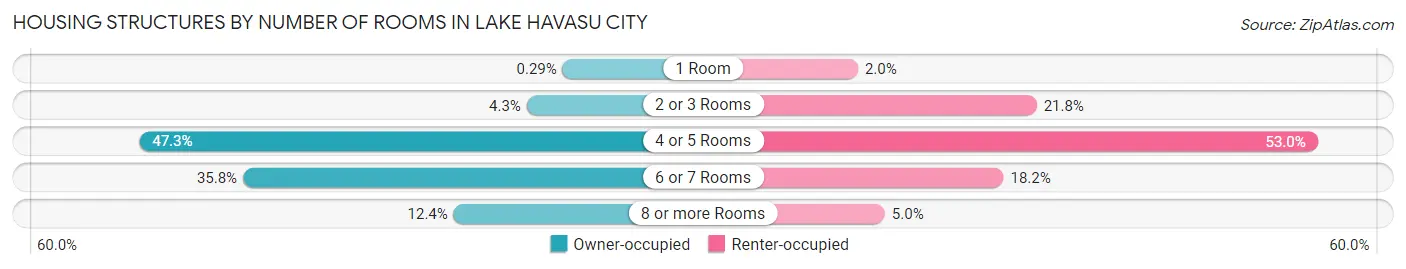
| Number of Rooms | Owner-occupied | Renter-occupied |
| 1 Room | 57 (0.3%) | 137 (2.0%) |
| 2 or 3 Rooms | 850 (4.3%) | 1,497 (21.8%) |
| 4 or 5 Rooms | 9,386 (47.3%) | 3,634 (53.0%) |
| 6 or 7 Rooms | 7,103 (35.8%) | 1,245 (18.2%) |
| 8 or more Rooms | 2,460 (12.4%) | 342 (5.0%) |
| Total | 19,856 (100.0%) | 6,855 (100.0%) |
Housing Structure by Heating Type in Lake Havasu City
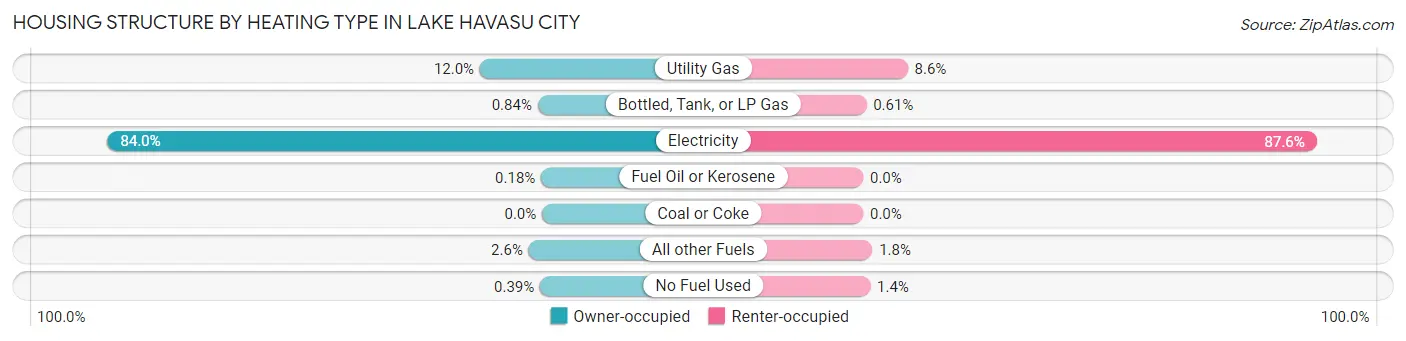
| Heating Type | Owner-occupied | Renter-occupied |
| Utility Gas | 2,384 (12.0%) | 590 (8.6%) |
| Bottled, Tank, or LP Gas | 167 (0.8%) | 42 (0.6%) |
| Electricity | 16,679 (84.0%) | 6,008 (87.6%) |
| Fuel Oil or Kerosene | 36 (0.2%) | 0 (0.0%) |
| Coal or Coke | 0 (0.0%) | 0 (0.0%) |
| All other Fuels | 512 (2.6%) | 122 (1.8%) |
| No Fuel Used | 78 (0.4%) | 93 (1.4%) |
| Total | 19,856 (100.0%) | 6,855 (100.0%) |
Household Vehicle Usage in Lake Havasu City
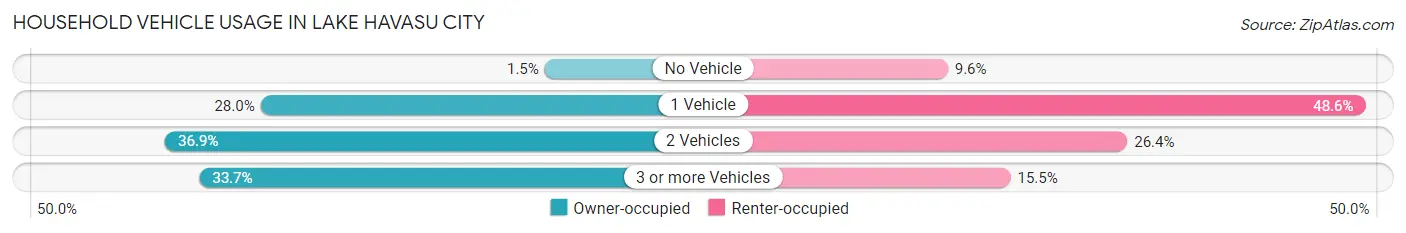
| Vehicles per Household | Owner-occupied | Renter-occupied |
| No Vehicle | 290 (1.5%) | 658 (9.6%) |
| 1 Vehicle | 5,555 (28.0%) | 3,330 (48.6%) |
| 2 Vehicles | 7,322 (36.9%) | 1,807 (26.4%) |
| 3 or more Vehicles | 6,689 (33.7%) | 1,060 (15.5%) |
| Total | 19,856 (100.0%) | 6,855 (100.0%) |
Real Estate & Mortgages in Lake Havasu City
Real Estate and Mortgage Overview in Lake Havasu City
| Characteristic | Without Mortgage | With Mortgage |
| Housing Units | 8,005 | 11,851 |
| Median Property Value | $335,000 | $380,500 |
| Median Household Income | $60,840 | $1,974 |
| Monthly Housing Costs | $443 | $643 |
| Real Estate Taxes | $1,612 | $348 |
Property Value by Mortgage Status in Lake Havasu City
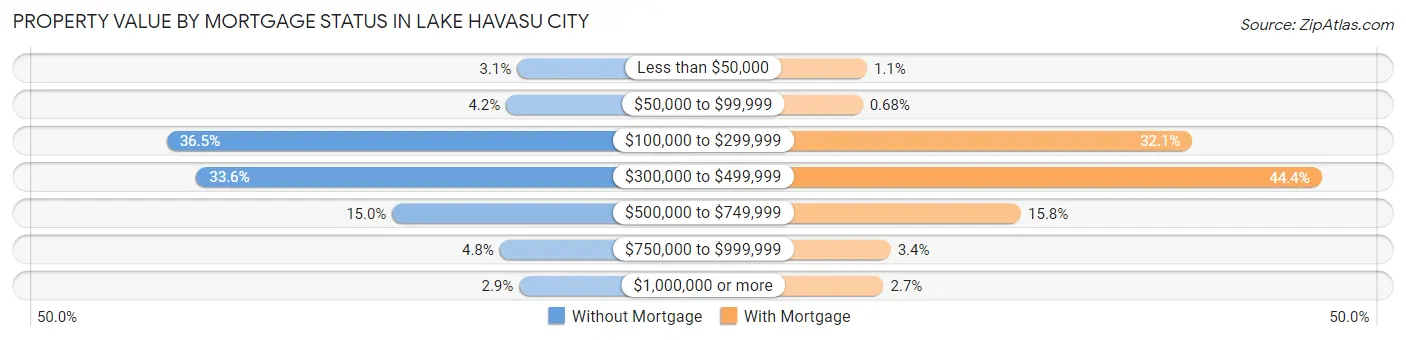
| Property Value | Without Mortgage | With Mortgage |
| Less than $50,000 | 248 (3.1%) | 129 (1.1%) |
| $50,000 to $99,999 | 332 (4.2%) | 81 (0.7%) |
| $100,000 to $299,999 | 2,919 (36.5%) | 3,799 (32.1%) |
| $300,000 to $499,999 | 2,693 (33.6%) | 5,260 (44.4%) |
| $500,000 to $749,999 | 1,200 (15.0%) | 1,869 (15.8%) |
| $750,000 to $999,999 | 381 (4.8%) | 397 (3.4%) |
| $1,000,000 or more | 232 (2.9%) | 316 (2.7%) |
| Total | 8,005 (100.0%) | 11,851 (100.0%) |
Household Income by Mortgage Status in Lake Havasu City
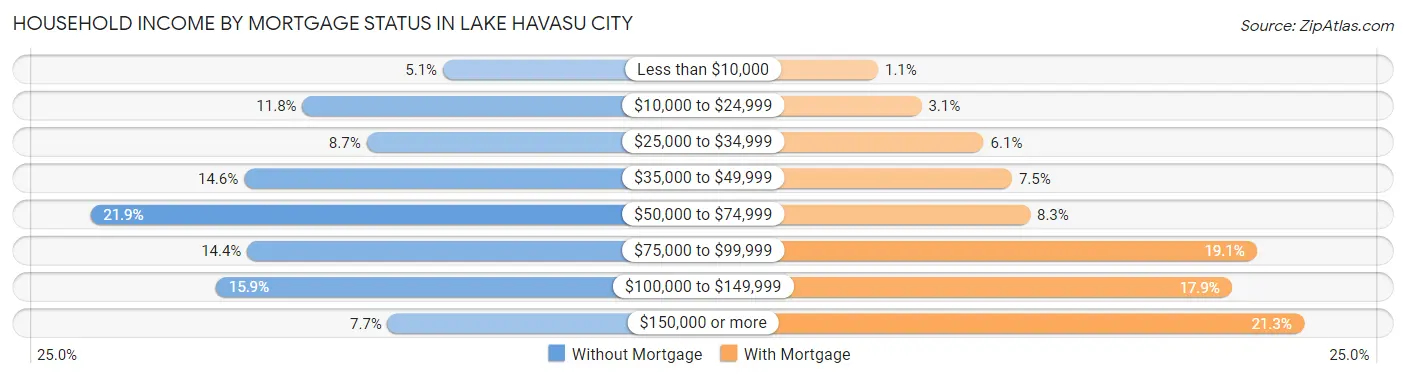
| Household Income | Without Mortgage | With Mortgage |
| Less than $10,000 | 407 (5.1%) | 127 (1.1%) |
| $10,000 to $24,999 | 942 (11.8%) | 372 (3.1%) |
| $25,000 to $34,999 | 698 (8.7%) | 723 (6.1%) |
| $35,000 to $49,999 | 1,165 (14.5%) | 883 (7.4%) |
| $50,000 to $74,999 | 1,751 (21.9%) | 985 (8.3%) |
| $75,000 to $99,999 | 1,153 (14.4%) | 2,263 (19.1%) |
| $100,000 to $149,999 | 1,272 (15.9%) | 2,122 (17.9%) |
| $150,000 or more | 617 (7.7%) | 2,529 (21.3%) |
| Total | 8,005 (100.0%) | 11,851 (100.0%) |
Property Value to Household Income Ratio in Lake Havasu City
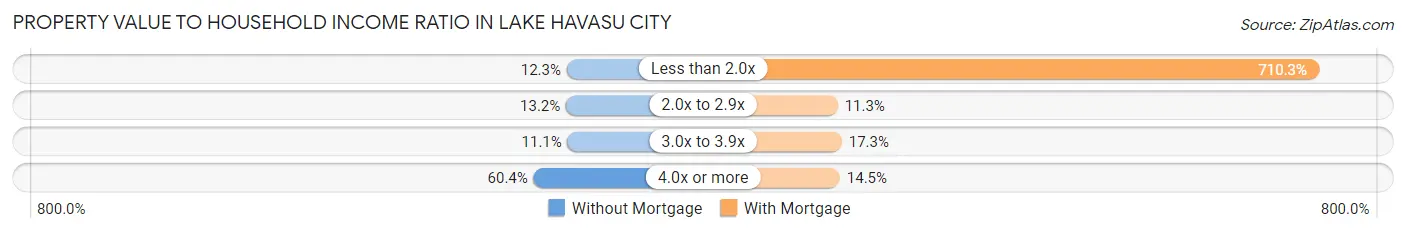
| Value-to-Income Ratio | Without Mortgage | With Mortgage |
| Less than 2.0x | 981 (12.2%) | 84,179 (710.3%) |
| 2.0x to 2.9x | 1,060 (13.2%) | 1,339 (11.3%) |
| 3.0x to 3.9x | 887 (11.1%) | 2,044 (17.2%) |
| 4.0x or more | 4,837 (60.4%) | 1,714 (14.5%) |
| Total | 8,005 (100.0%) | 11,851 (100.0%) |
Real Estate Taxes by Mortgage Status in Lake Havasu City
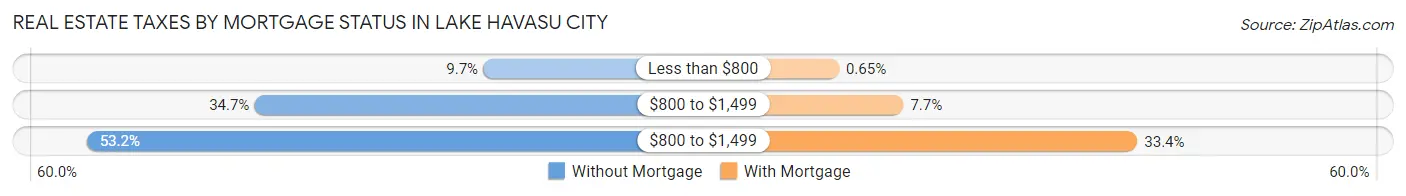
| Property Taxes | Without Mortgage | With Mortgage |
| Less than $800 | 773 (9.7%) | 77 (0.6%) |
| $800 to $1,499 | 2,780 (34.7%) | 915 (7.7%) |
| $800 to $1,499 | 4,258 (53.2%) | 3,952 (33.4%) |
| Total | 8,005 (100.0%) | 11,851 (100.0%) |
Health & Disability in Lake Havasu City
Health Insurance Coverage by Age in Lake Havasu City
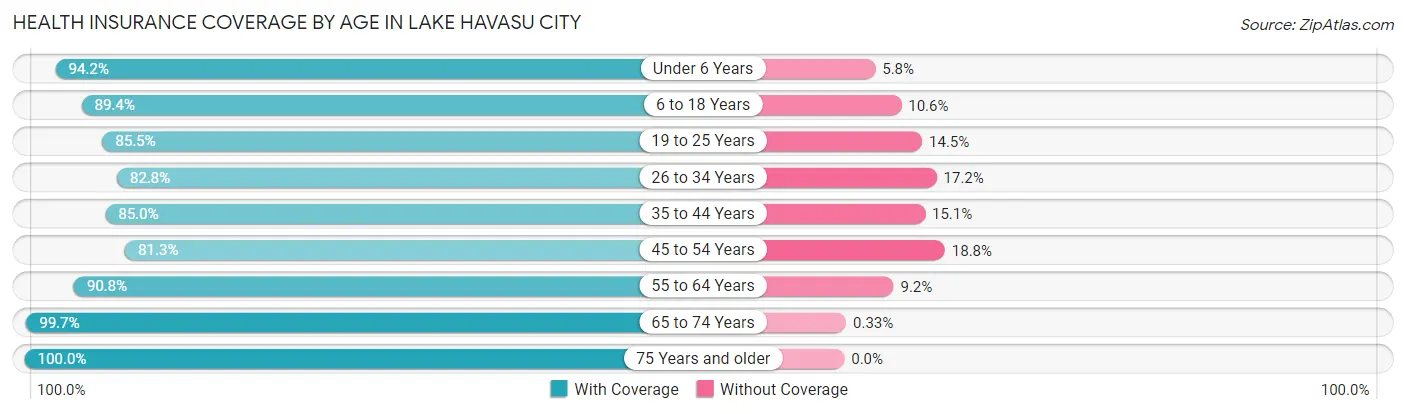
| Age Bracket | With Coverage | Without Coverage |
| Under 6 Years | 2,557 (94.2%) | 157 (5.8%) |
| 6 to 18 Years | 6,103 (89.4%) | 726 (10.6%) |
| 19 to 25 Years | 2,840 (85.5%) | 482 (14.5%) |
| 26 to 34 Years | 4,526 (82.8%) | 941 (17.2%) |
| 35 to 44 Years | 4,182 (85.0%) | 741 (15.0%) |
| 45 to 54 Years | 4,718 (81.2%) | 1,089 (18.8%) |
| 55 to 64 Years | 7,547 (90.8%) | 763 (9.2%) |
| 65 to 74 Years | 11,355 (99.7%) | 38 (0.3%) |
| 75 Years and older | 8,308 (100.0%) | 0 (0.0%) |
| Total | 52,136 (91.3%) | 4,937 (8.6%) |
Health Insurance Coverage by Citizenship Status in Lake Havasu City
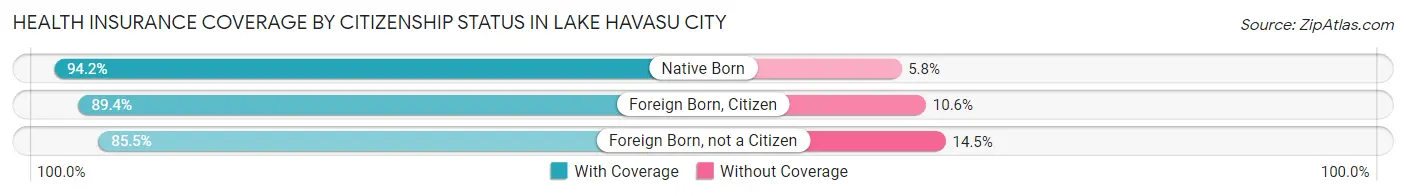
| Citizenship Status | With Coverage | Without Coverage |
| Native Born | 2,557 (94.2%) | 157 (5.8%) |
| Foreign Born, Citizen | 6,103 (89.4%) | 726 (10.6%) |
| Foreign Born, not a Citizen | 2,840 (85.5%) | 482 (14.5%) |
Health Insurance Coverage by Household Income in Lake Havasu City
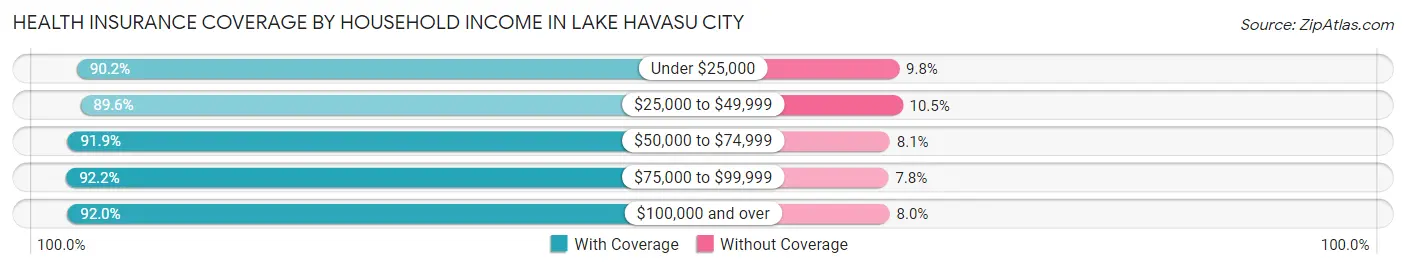
| Household Income | With Coverage | Without Coverage |
| Under $25,000 | 6,075 (90.2%) | 660 (9.8%) |
| $25,000 to $49,999 | 8,976 (89.5%) | 1,048 (10.4%) |
| $50,000 to $74,999 | 10,595 (91.9%) | 930 (8.1%) |
| $75,000 to $99,999 | 8,736 (92.2%) | 740 (7.8%) |
| $100,000 and over | 17,689 (92.0%) | 1,543 (8.0%) |
Public vs Private Health Insurance Coverage by Age in Lake Havasu City
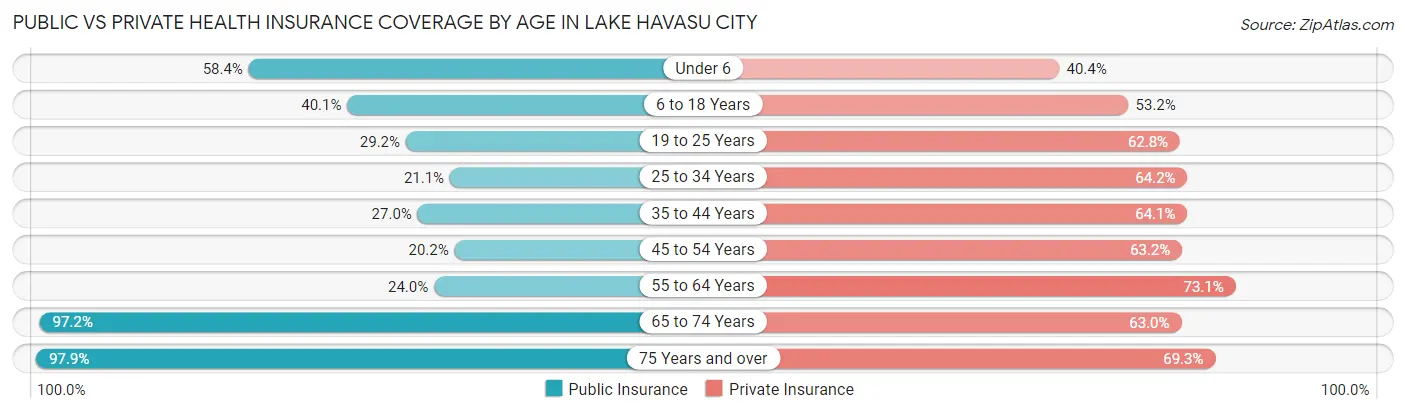
| Age Bracket | Public Insurance | Private Insurance |
| Under 6 | 1,585 (58.4%) | 1,097 (40.4%) |
| 6 to 18 Years | 2,739 (40.1%) | 3,636 (53.2%) |
| 19 to 25 Years | 971 (29.2%) | 2,085 (62.8%) |
| 25 to 34 Years | 1,151 (21.0%) | 3,507 (64.1%) |
| 35 to 44 Years | 1,331 (27.0%) | 3,157 (64.1%) |
| 45 to 54 Years | 1,173 (20.2%) | 3,669 (63.2%) |
| 55 to 64 Years | 1,994 (24.0%) | 6,075 (73.1%) |
| 65 to 74 Years | 11,076 (97.2%) | 7,180 (63.0%) |
| 75 Years and over | 8,132 (97.9%) | 5,759 (69.3%) |
| Total | 30,152 (52.8%) | 36,165 (63.4%) |
Disability Status by Sex by Age in Lake Havasu City
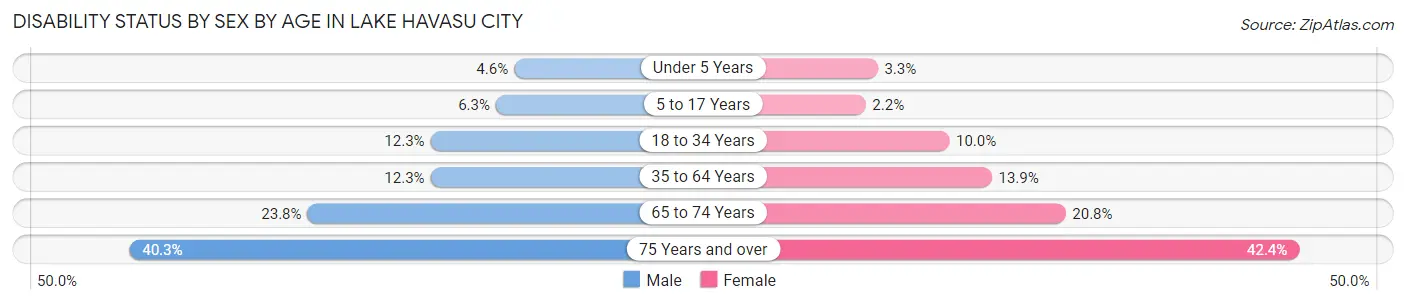
| Age Bracket | Male | Female |
| Under 5 Years | 52 (4.6%) | 34 (3.3%) |
| 5 to 17 Years | 207 (6.3%) | 77 (2.2%) |
| 18 to 34 Years | 613 (12.3%) | 436 (10.0%) |
| 35 to 64 Years | 1,148 (12.3%) | 1,353 (13.9%) |
| 65 to 74 Years | 1,317 (23.8%) | 1,214 (20.7%) |
| 75 Years and over | 1,756 (40.3%) | 1,676 (42.4%) |
Disability Class by Sex by Age in Lake Havasu City
Disability Class: Hearing Difficulty
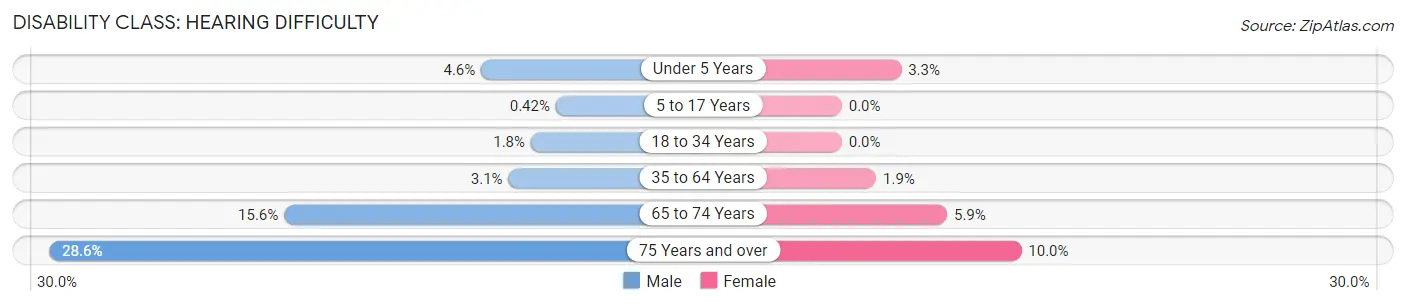
| Age Bracket | Male | Female |
| Under 5 Years | 52 (4.6%) | 34 (3.3%) |
| 5 to 17 Years | 14 (0.4%) | 0 (0.0%) |
| 18 to 34 Years | 90 (1.8%) | 0 (0.0%) |
| 35 to 64 Years | 285 (3.1%) | 186 (1.9%) |
| 65 to 74 Years | 862 (15.5%) | 343 (5.9%) |
| 75 Years and over | 1,248 (28.6%) | 395 (10.0%) |
Disability Class: Vision Difficulty
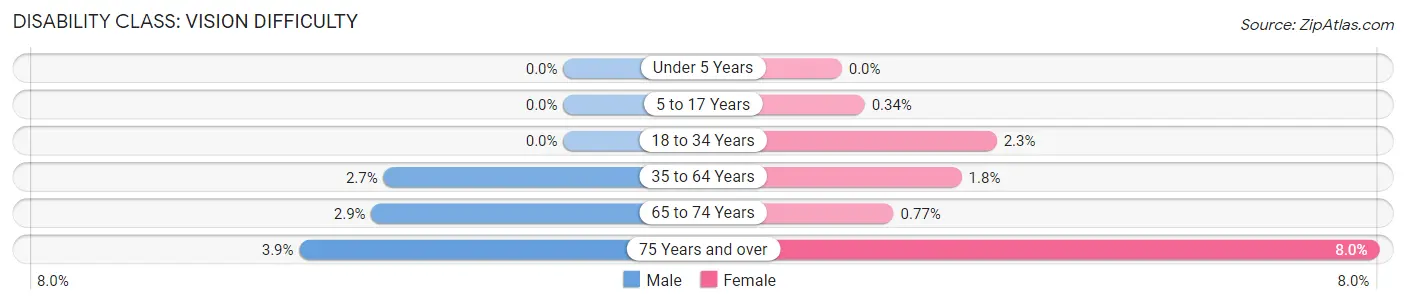
| Age Bracket | Male | Female |
| Under 5 Years | 0 (0.0%) | 0 (0.0%) |
| 5 to 17 Years | 0 (0.0%) | 12 (0.3%) |
| 18 to 34 Years | 0 (0.0%) | 101 (2.3%) |
| 35 to 64 Years | 248 (2.7%) | 173 (1.8%) |
| 65 to 74 Years | 158 (2.9%) | 45 (0.8%) |
| 75 Years and over | 171 (3.9%) | 315 (8.0%) |
Disability Class: Cognitive Difficulty
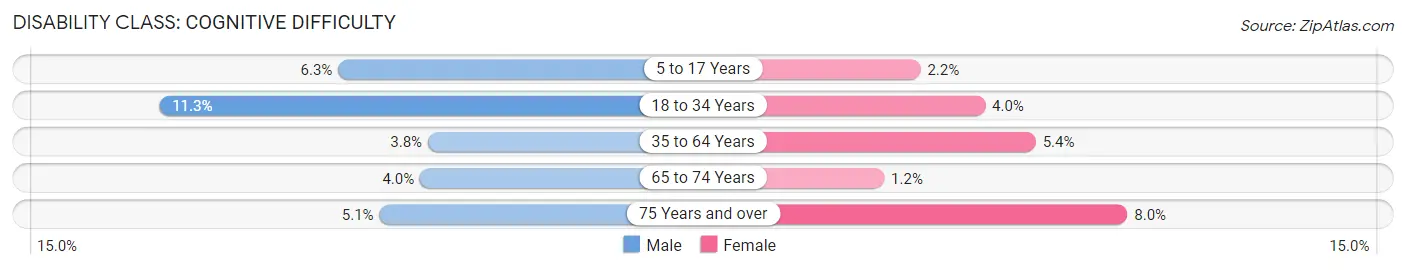
| Age Bracket | Male | Female |
| 5 to 17 Years | 207 (6.3%) | 77 (2.2%) |
| 18 to 34 Years | 559 (11.3%) | 175 (4.0%) |
| 35 to 64 Years | 351 (3.8%) | 526 (5.4%) |
| 65 to 74 Years | 221 (4.0%) | 69 (1.2%) |
| 75 Years and over | 223 (5.1%) | 314 (8.0%) |
Disability Class: Ambulatory Difficulty
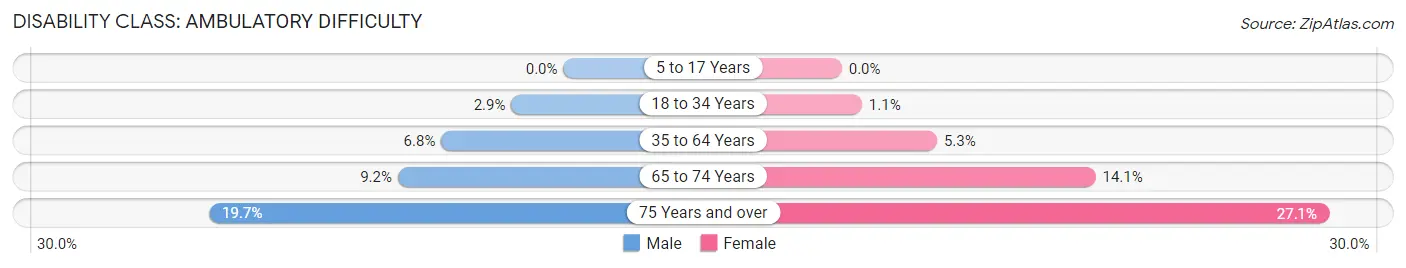
| Age Bracket | Male | Female |
| 5 to 17 Years | 0 (0.0%) | 0 (0.0%) |
| 18 to 34 Years | 144 (2.9%) | 49 (1.1%) |
| 35 to 64 Years | 633 (6.8%) | 516 (5.3%) |
| 65 to 74 Years | 511 (9.2%) | 827 (14.1%) |
| 75 Years and over | 860 (19.7%) | 1,071 (27.1%) |
Disability Class: Self-Care Difficulty
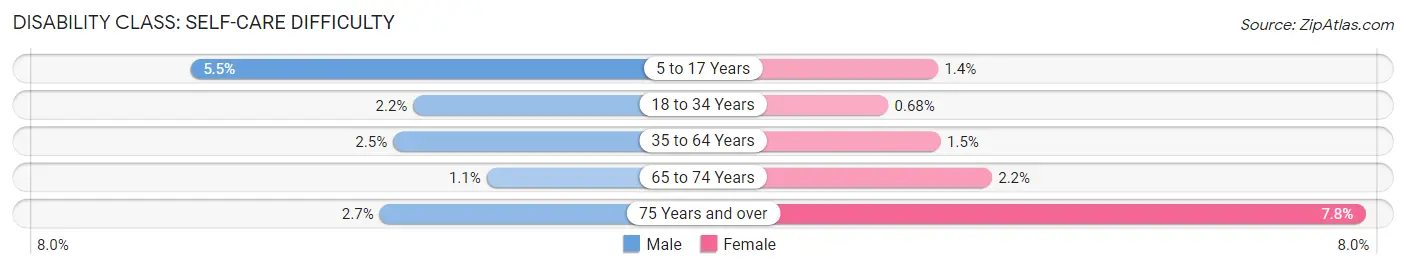
| Age Bracket | Male | Female |
| 5 to 17 Years | 183 (5.5%) | 50 (1.4%) |
| 18 to 34 Years | 111 (2.2%) | 30 (0.7%) |
| 35 to 64 Years | 235 (2.5%) | 142 (1.5%) |
| 65 to 74 Years | 63 (1.1%) | 130 (2.2%) |
| 75 Years and over | 119 (2.7%) | 307 (7.8%) |
Technology Access in Lake Havasu City
Computing Device Access in Lake Havasu City
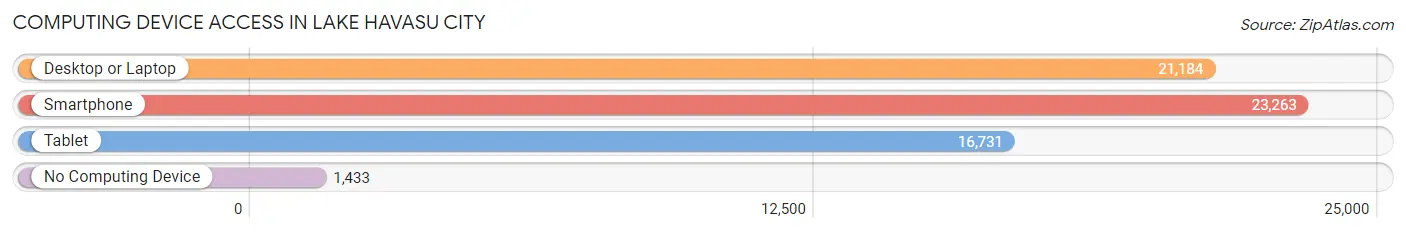
| Device Type | # Households | % Households |
| Desktop or Laptop | 21,184 | 79.3% |
| Smartphone | 23,263 | 87.1% |
| Tablet | 16,731 | 62.6% |
| No Computing Device | 1,433 | 5.4% |
| Total | 26,711 | 100.0% |
Internet Access in Lake Havasu City
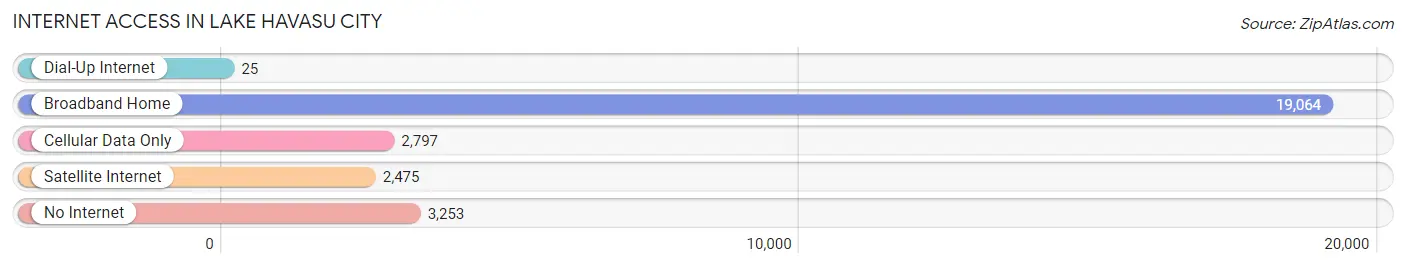
| Internet Type | # Households | % Households |
| Dial-Up Internet | 25 | 0.1% |
| Broadband Home | 19,064 | 71.4% |
| Cellular Data Only | 2,797 | 10.5% |
| Satellite Internet | 2,475 | 9.3% |
| No Internet | 3,253 | 12.2% |
| Total | 26,711 | 100.0% |
Lake Havasu City Summary
History
Lake Havasu City is a city located in Mohave County, Arizona. It is situated on the Colorado River and is known for its beautiful lake and desert landscape. The city was founded in 1964 by Robert P. McCulloch, a businessman from Michigan. McCulloch purchased 3,500 acres of land along the Colorado River and developed it into a recreational area. The city was named after Lake Havasu, which was created when Parker Dam was built in 1938.
The city was incorporated in 1978 and has since grown to become a popular tourist destination. It is home to the London Bridge, which was purchased by McCulloch in 1968 and relocated from London, England to Lake Havasu City. The bridge is a popular tourist attraction and is the centerpiece of the city.
Geography
Lake Havasu City is located in the western part of Arizona, on the Colorado River. It is situated in the Mojave Desert and is surrounded by mountains and desert terrain. The city has a total area of 64.2 square miles, with a population of 54,527 as of the 2020 census.
The city is located in a semi-arid climate, with hot summers and mild winters. The average temperature in the summer is around 90°F, while the average temperature in the winter is around 50°F. The city receives an average of 8.5 inches of precipitation per year.
Economy
Lake Havasu City’s economy is largely driven by tourism. The city is a popular destination for boaters, anglers, and other outdoor enthusiasts. The city is also home to several manufacturing companies, including a large aluminum plant.
The city’s largest employer is the London Bridge Resort, which employs over 1,000 people. Other major employers include the Lake Havasu Unified School District, the City of Lake Havasu, and the Lake Havasu City Airport.
Demographics
As of the 2020 census, the population of Lake Havasu City was 54,527. The population is predominantly white (86.2%), with smaller percentages of Hispanic (7.2%), African American (2.2%), and Asian (1.7%) residents. The median household income is $50,945, and the median age is 44.
The city is home to a large retirement community, with over 20% of the population over the age of 65. The city also has a large military presence, with over 10% of the population having served in the military.
Conclusion
Lake Havasu City is a city located in Mohave County, Arizona. It is situated on the Colorado River and is known for its beautiful lake and desert landscape. The city was founded in 1964 by Robert P. McCulloch and has since grown to become a popular tourist destination. The city’s economy is largely driven by tourism, and it is home to several manufacturing companies. The population of Lake Havasu City is predominantly white, with smaller percentages of Hispanic, African American, and Asian residents. The city is home to a large retirement community and a large military presence.
Common Questions
What is Per Capita Income in Lake Havasu City?
Per Capita income in Lake Havasu City is $40,951.
What is the Median Family Income in Lake Havasu City?
Median Family Income in Lake Havasu City is $76,862.
What is the Median Household income in Lake Havasu City?
Median Household Income in Lake Havasu City is $64,027.
What is Income or Wage Gap in Lake Havasu City?
Income or Wage Gap in Lake Havasu City is 21.3%.
Women in Lake Havasu City earn 78.7 cents for every dollar earned by a man.
What is Family Income Deficit in Lake Havasu City?
Family Income Deficit in Lake Havasu City is $12,817.
Families that are below poverty line in Lake Havasu City earn $12,817 less on average than the poverty threshold level.
What is Inequality or Gini Index in Lake Havasu City?
Inequality or Gini Index in Lake Havasu City is 0.45.
What is the Total Population of Lake Havasu City?
Total Population of Lake Havasu City is 57,294.
What is the Total Male Population of Lake Havasu City?
Total Male Population of Lake Havasu City is 28,682.
What is the Total Female Population of Lake Havasu City?
Total Female Population of Lake Havasu City is 28,612.
What is the Ratio of Males per 100 Females in Lake Havasu City?
There are 100.24 Males per 100 Females in Lake Havasu City.
What is the Ratio of Females per 100 Males in Lake Havasu City?
There are 99.76 Females per 100 Males in Lake Havasu City.
What is the Median Population Age in Lake Havasu City?
Median Population Age in Lake Havasu City is 54.3 Years.
What is the Average Family Size in Lake Havasu City
Average Family Size in Lake Havasu City is 2.6 People.
What is the Average Household Size in Lake Havasu City
Average Household Size in Lake Havasu City is 2.1 People.
How Large is the Labor Force in Lake Havasu City?
There are 22,832 People in the Labor Forcein in Lake Havasu City.
What is the Percentage of People in the Labor Force in Lake Havasu City?
46.2% of People are in the Labor Force in Lake Havasu City.
What is the Unemployment Rate in Lake Havasu City?
Unemployment Rate in Lake Havasu City is 5.9%.