Boalsburg, PA Map & Demographics
Boalsburg Map
Boalsburg Overview
$56,781
PER CAPITA INCOME
$120,589
AVG FAMILY INCOME
$117,114
AVG HOUSEHOLD INCOME
58.7%
WAGE / INCOME GAP [ % ]
41.3¢/ $1
WAGE / INCOME GAP [ $ ]
0.42
INEQUALITY / GINI INDEX
4,298
TOTAL POPULATION
2,126
MALE POPULATION
2,172
FEMALE POPULATION
97.88
MALES / 100 FEMALES
102.16
FEMALES / 100 MALES
45.1
MEDIAN AGE
2.8
AVG FAMILY SIZE
2.4
AVG HOUSEHOLD SIZE
2,340
LABOR FORCE [ PEOPLE ]
66.2%
PERCENT IN LABOR FORCE
4.1%
UNEMPLOYMENT RATE
Boalsburg Zip Codes
Boalsburg Area Codes
Income in Boalsburg
Income Overview in Boalsburg
Per Capita Income in Boalsburg is $56,781, while median incomes of families and households are $120,589 and $117,114 respectively.
| Characteristic | Number | Measure |
| Per Capita Income | 4,298 | $56,781 |
| Median Family Income | 1,301 | $120,589 |
| Mean Family Income | 1,301 | $161,460 |
| Median Household Income | 1,791 | $117,114 |
| Mean Household Income | 1,791 | $135,519 |
| Income Deficit | 1,301 | $0 |
| Wage / Income Gap (%) | 4,298 | 58.72% |
| Wage / Income Gap ($) | 4,298 | 41.28¢ per $1 |
| Gini / Inequality Index | 4,298 | 0.42 |
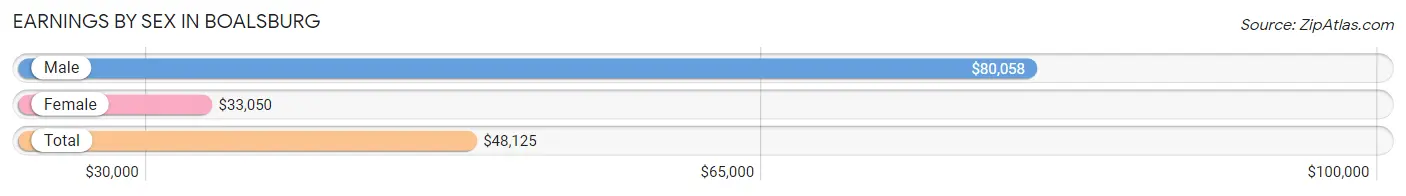
Earnings by Sex in Boalsburg
Average Earnings in Boalsburg are $48,125, $80,058 for men and $33,050 for women, a difference of 58.7%.
| Sex | Number | Average Earnings |
| Male | 1,321 (54.0%) | $80,058 |
| Female | 1,127 (46.0%) | $33,050 |
| Total | 2,448 (100.0%) | $48,125 |
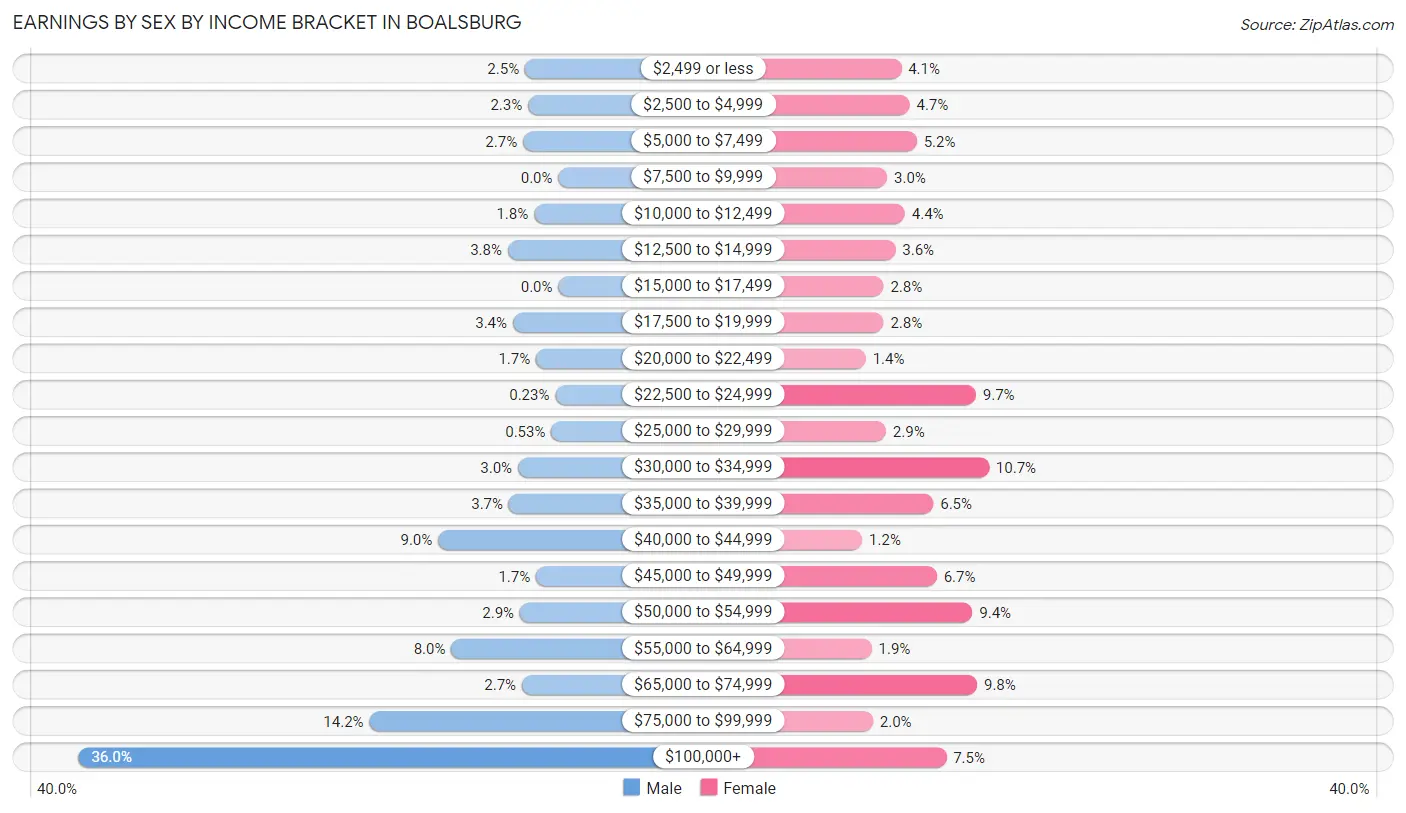
Earnings by Sex by Income Bracket in Boalsburg
The most common earnings brackets in Boalsburg are $100,000+ for men (475 | 36.0%) and $30,000 to $34,999 for women (120 | 10.6%).
| Income | Male | Female |
| $2,499 or less | 33 (2.5%) | 46 (4.1%) |
| $2,500 to $4,999 | 30 (2.3%) | 53 (4.7%) |
| $5,000 to $7,499 | 35 (2.6%) | 59 (5.2%) |
| $7,500 to $9,999 | 0 (0.0%) | 34 (3.0%) |
| $10,000 to $12,499 | 24 (1.8%) | 49 (4.3%) |
| $12,500 to $14,999 | 50 (3.8%) | 41 (3.6%) |
| $15,000 to $17,499 | 0 (0.0%) | 31 (2.8%) |
| $17,500 to $19,999 | 45 (3.4%) | 31 (2.8%) |
| $20,000 to $22,499 | 22 (1.7%) | 16 (1.4%) |
| $22,500 to $24,999 | 3 (0.2%) | 109 (9.7%) |
| $25,000 to $29,999 | 7 (0.5%) | 33 (2.9%) |
| $30,000 to $34,999 | 40 (3.0%) | 120 (10.6%) |
| $35,000 to $39,999 | 49 (3.7%) | 73 (6.5%) |
| $40,000 to $44,999 | 119 (9.0%) | 13 (1.1%) |
| $45,000 to $49,999 | 22 (1.7%) | 76 (6.7%) |
| $50,000 to $54,999 | 38 (2.9%) | 106 (9.4%) |
| $55,000 to $64,999 | 106 (8.0%) | 21 (1.9%) |
| $65,000 to $74,999 | 36 (2.7%) | 110 (9.8%) |
| $75,000 to $99,999 | 187 (14.2%) | 22 (1.9%) |
| $100,000+ | 475 (36.0%) | 84 (7.4%) |
| Total | 1,321 (100.0%) | 1,127 (100.0%) |
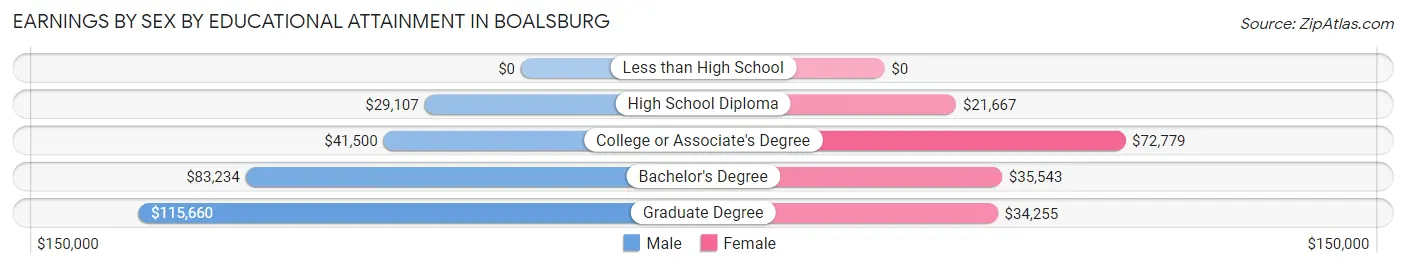
Earnings by Sex by Educational Attainment in Boalsburg
Average earnings in Boalsburg are $80,962 for men and $35,000 for women, a difference of 56.8%. Men with an educational attainment of graduate degree enjoy the highest average annual earnings of $115,660, while those with high school diploma education earn the least with $29,107. Women with an educational attainment of college or associate's degree earn the most with the average annual earnings of $72,779, while those with high school diploma education have the smallest earnings of $21,667.
| Educational Attainment | Male Income | Female Income |
| Less than High School | - | - |
| High School Diploma | $29,107 | $21,667 |
| College or Associate's Degree | $41,500 | $72,779 |
| Bachelor's Degree | $83,234 | $35,543 |
| Graduate Degree | $115,660 | $34,255 |
| Total | $80,962 | $35,000 |
Family Income in Boalsburg
Family Income Brackets in Boalsburg
According to the Boalsburg family income data, there are 500 families falling into the $100,000 to $149,999 income range, which is the most common income bracket and makes up 38.4% of all families.
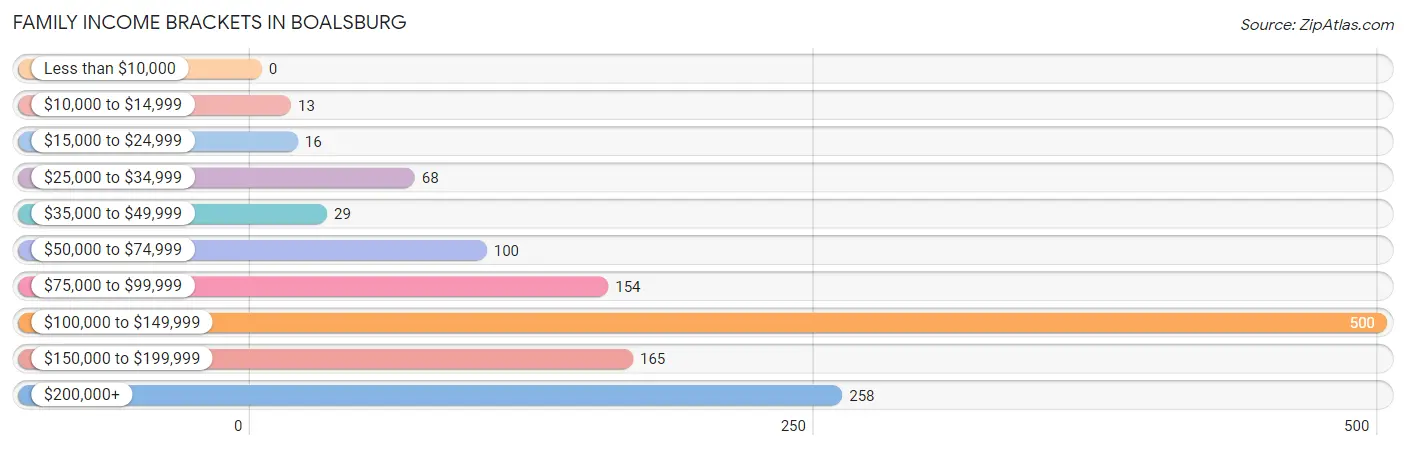
| Income Bracket | # Families | % Families |
| Less than $10,000 | 0 | 0.0% |
| $10,000 to $14,999 | 13 | 1.0% |
| $15,000 to $24,999 | 16 | 1.2% |
| $25,000 to $34,999 | 68 | 5.2% |
| $35,000 to $49,999 | 29 | 2.2% |
| $50,000 to $74,999 | 100 | 7.7% |
| $75,000 to $99,999 | 154 | 11.8% |
| $100,000 to $149,999 | 500 | 38.4% |
| $150,000 to $199,999 | 165 | 12.7% |
| $200,000+ | 258 | 19.8% |
Family Income by Famaliy Size in Boalsburg
5-person families (124 | 9.5%) account for the highest median family income in Boalsburg with $131,957 per family, while 2-person families (768 | 59.0%) have the highest median income of $59,844 per family member.
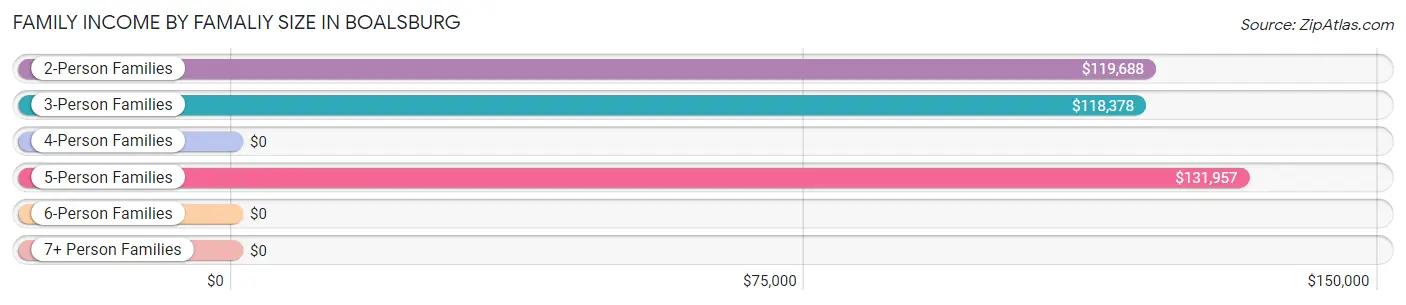
| Income Bracket | # Families | Median Income |
| 2-Person Families | 768 (59.0%) | $119,688 |
| 3-Person Families | 238 (18.3%) | $118,378 |
| 4-Person Families | 148 (11.4%) | $0 |
| 5-Person Families | 124 (9.5%) | $131,957 |
| 6-Person Families | 23 (1.8%) | $0 |
| 7+ Person Families | 0 (0.0%) | $0 |
| Total | 1,301 (100.0%) | $120,589 |
Family Income by Number of Earners in Boalsburg
The median family income in Boalsburg is $120,589, with families comprising 3+ earners (71) having the highest median family income of $250,001, while families with 2 earners (650) have the lowest median family income of $118,803, accounting for 5.5% and 50.0% of families, respectively.
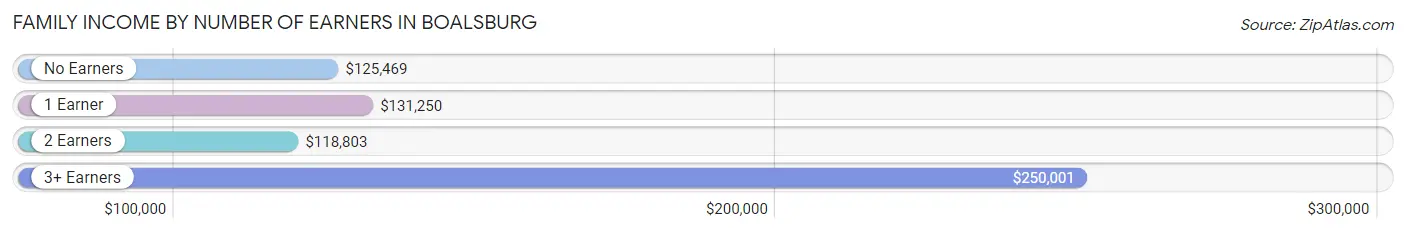
| Number of Earners | # Families | Median Income |
| No Earners | 226 (17.4%) | $125,469 |
| 1 Earner | 354 (27.2%) | $131,250 |
| 2 Earners | 650 (50.0%) | $118,803 |
| 3+ Earners | 71 (5.5%) | $250,001 |
| Total | 1,301 (100.0%) | $120,589 |
Household Income in Boalsburg
Household Income Brackets in Boalsburg
With 580 households falling in the category, the $100,000 to $149,999 income range is the most frequent in Boalsburg, accounting for 32.4% of all households.
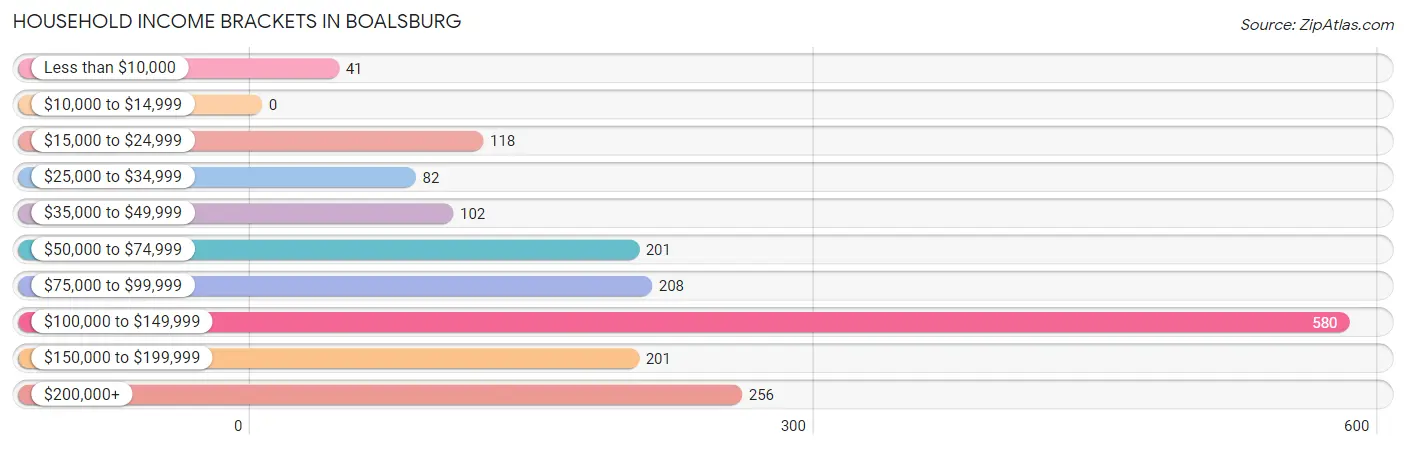
| Income Bracket | # Households | % Households |
| Less than $10,000 | 41 | 2.3% |
| $10,000 to $14,999 | 0 | 0.0% |
| $15,000 to $24,999 | 118 | 6.6% |
| $25,000 to $34,999 | 82 | 4.6% |
| $35,000 to $49,999 | 102 | 5.7% |
| $50,000 to $74,999 | 201 | 11.2% |
| $75,000 to $99,999 | 208 | 11.6% |
| $100,000 to $149,999 | 580 | 32.4% |
| $150,000 to $199,999 | 201 | 11.2% |
| $200,000+ | 256 | 14.3% |
Household Income by Householder Age in Boalsburg
The median household income in Boalsburg is $117,114, with the highest median household income of $121,026 found in the 45 to 64 years age bracket for the primary householder. A total of 646 households (36.1%) fall into this category. Meanwhile, the 15 to 24 years age bracket for the primary householder has the lowest median household income of $0, with 15 households (0.8%) in this group.
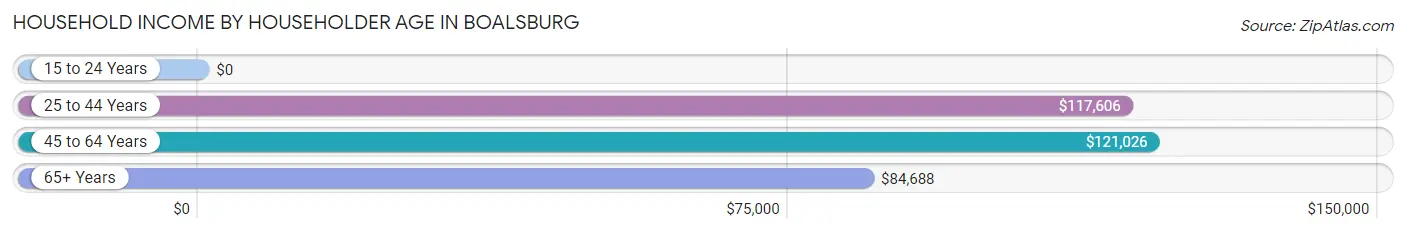
| Income Bracket | # Households | Median Income |
| 15 to 24 Years | 15 (0.8%) | $0 |
| 25 to 44 Years | 528 (29.5%) | $117,606 |
| 45 to 64 Years | 646 (36.1%) | $121,026 |
| 65+ Years | 602 (33.6%) | $84,688 |
| Total | 1,791 (100.0%) | $117,114 |
Poverty in Boalsburg
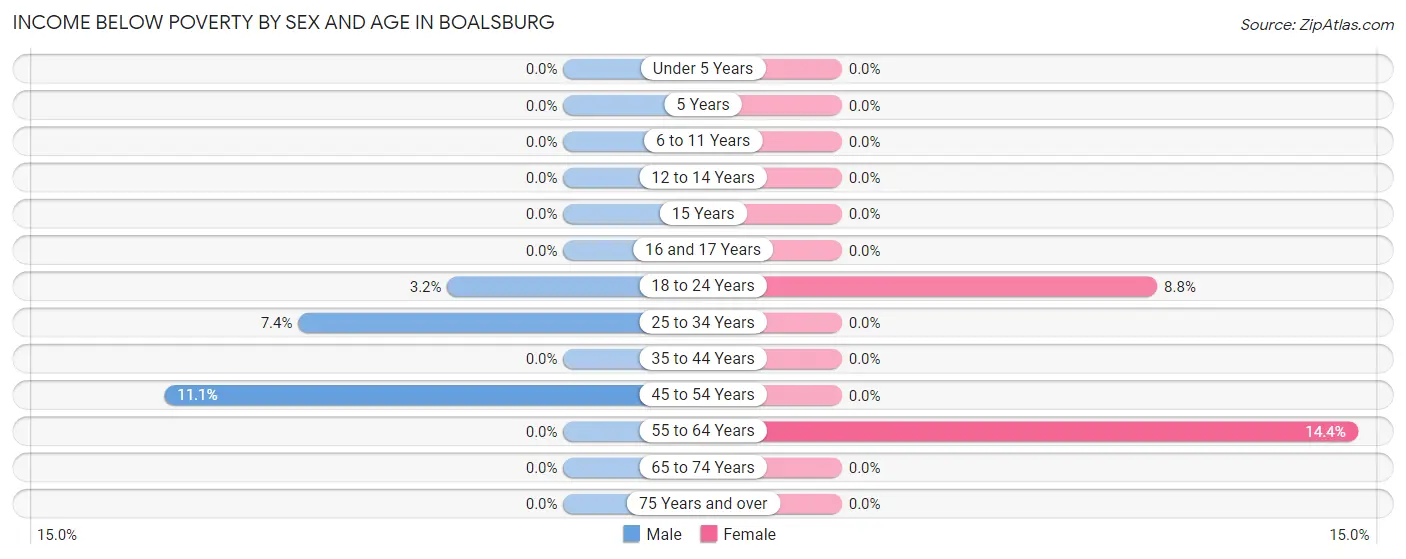
Income Below Poverty by Sex and Age in Boalsburg
With 2.3% poverty level for males and 3.3% for females among the residents of Boalsburg, 45 to 54 year old males and 55 to 64 year old females are the most vulnerable to poverty, with 24 males (11.1%) and 59 females (14.4%) in their respective age groups living below the poverty level.
| Age Bracket | Male | Female |
| Under 5 Years | 0 (0.0%) | 0 (0.0%) |
| 5 Years | 0 (0.0%) | 0 (0.0%) |
| 6 to 11 Years | 0 (0.0%) | 0 (0.0%) |
| 12 to 14 Years | 0 (0.0%) | 0 (0.0%) |
| 15 Years | 0 (0.0%) | 0 (0.0%) |
| 16 and 17 Years | 0 (0.0%) | 0 (0.0%) |
| 18 to 24 Years | 2 (3.2%) | 13 (8.8%) |
| 25 to 34 Years | 22 (7.4%) | 0 (0.0%) |
| 35 to 44 Years | 0 (0.0%) | 0 (0.0%) |
| 45 to 54 Years | 24 (11.1%) | 0 (0.0%) |
| 55 to 64 Years | 0 (0.0%) | 59 (14.4%) |
| 65 to 74 Years | 0 (0.0%) | 0 (0.0%) |
| 75 Years and over | 0 (0.0%) | 0 (0.0%) |
| Total | 48 (2.3%) | 72 (3.3%) |
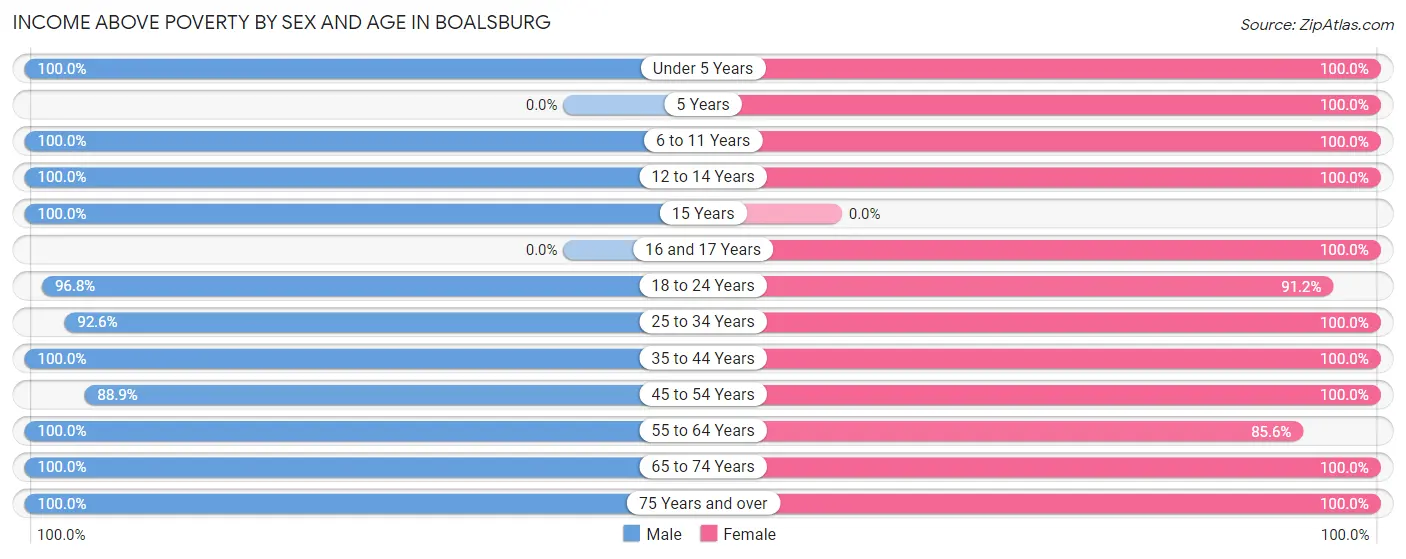
Income Above Poverty by Sex and Age in Boalsburg
According to the poverty statistics in Boalsburg, males aged under 5 years and females aged under 5 years are the age groups that are most secure financially, with 100.0% of males and 100.0% of females in these age groups living above the poverty line.
| Age Bracket | Male | Female |
| Under 5 Years | 114 (100.0%) | 111 (100.0%) |
| 5 Years | 0 (0.0%) | 64 (100.0%) |
| 6 to 11 Years | 241 (100.0%) | 27 (100.0%) |
| 12 to 14 Years | 113 (100.0%) | 53 (100.0%) |
| 15 Years | 40 (100.0%) | 0 (0.0%) |
| 16 and 17 Years | 0 (0.0%) | 9 (100.0%) |
| 18 to 24 Years | 60 (96.8%) | 135 (91.2%) |
| 25 to 34 Years | 276 (92.6%) | 267 (100.0%) |
| 35 to 44 Years | 303 (100.0%) | 289 (100.0%) |
| 45 to 54 Years | 192 (88.9%) | 222 (100.0%) |
| 55 to 64 Years | 316 (100.0%) | 352 (85.6%) |
| 65 to 74 Years | 223 (100.0%) | 270 (100.0%) |
| 75 Years and over | 200 (100.0%) | 301 (100.0%) |
| Total | 2,078 (97.7%) | 2,100 (96.7%) |
Income Below Poverty Among Married-Couple Families in Boalsburg
The poverty statistics for married-couple families in Boalsburg show that 1.3% or 15 of the total 1,141 families live below the poverty line. Families with no children have the highest poverty rate of 2.0%, comprising of 15 families. On the other hand, families with 1 or 2 children have the lowest poverty rate of 0.0%, which includes 0 families.
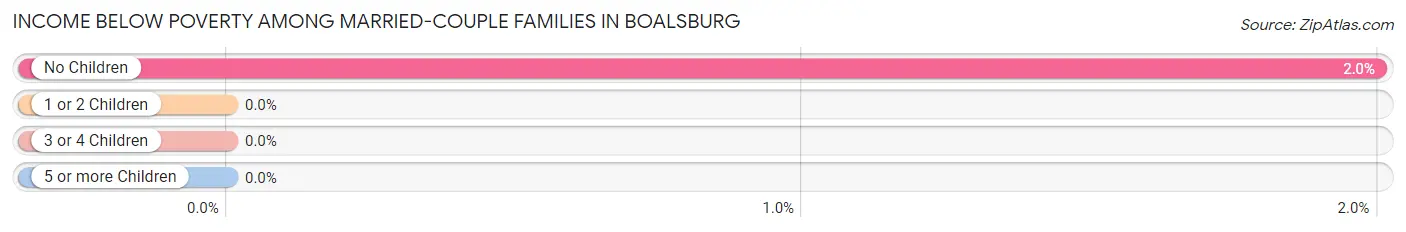
| Children | Above Poverty | Below Poverty |
| No Children | 736 (98.0%) | 15 (2.0%) |
| 1 or 2 Children | 285 (100.0%) | 0 (0.0%) |
| 3 or 4 Children | 105 (100.0%) | 0 (0.0%) |
| 5 or more Children | 0 (0.0%) | 0 (0.0%) |
| Total | 1,126 (98.7%) | 15 (1.3%) |
Income Below Poverty Among Single-Parent Households in Boalsburg
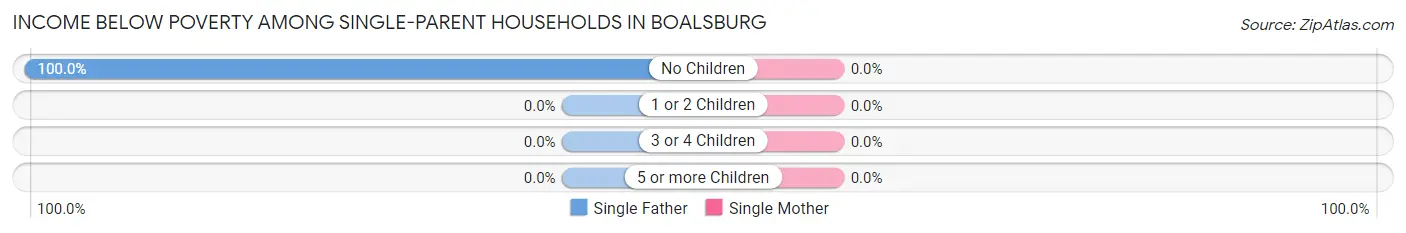
| Children | Single Father | Single Mother |
| No Children | 13 (100.0%) | 0 (0.0%) |
| 1 or 2 Children | 0 (0.0%) | 0 (0.0%) |
| 3 or 4 Children | 0 (0.0%) | 0 (0.0%) |
| 5 or more Children | 0 (0.0%) | 0 (0.0%) |
| Total | 13 (100.0%) | 0 (0.0%) |
Income Below Poverty Among Married-Couple vs Single-Parent Households in Boalsburg
The poverty data for Boalsburg shows that 15 of the married-couple family households (1.3%) and 13 of the single-parent households (8.1%) are living below the poverty level. Within the married-couple family households, those with no children have the highest poverty rate, with 15 households (2.0%) falling below the poverty line. Among the single-parent households, those with no children have the highest poverty rate, with 13 household (13.7%) living below poverty.
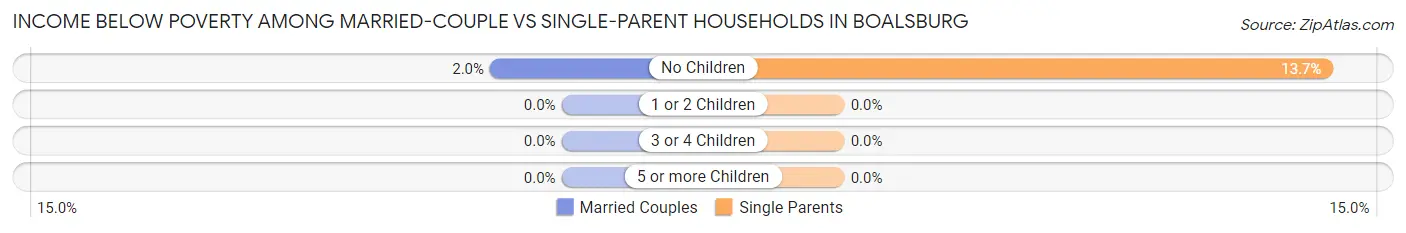
| Children | Married-Couple Families | Single-Parent Households |
| No Children | 15 (2.0%) | 13 (13.7%) |
| 1 or 2 Children | 0 (0.0%) | 0 (0.0%) |
| 3 or 4 Children | 0 (0.0%) | 0 (0.0%) |
| 5 or more Children | 0 (0.0%) | 0 (0.0%) |
| Total | 15 (1.3%) | 13 (8.1%) |
Race in Boalsburg
The most populous races in Boalsburg are White / Caucasian (4,169 | 97.0%), Hispanic or Latino (173 | 4.0%), and Asian (43 | 1.0%).
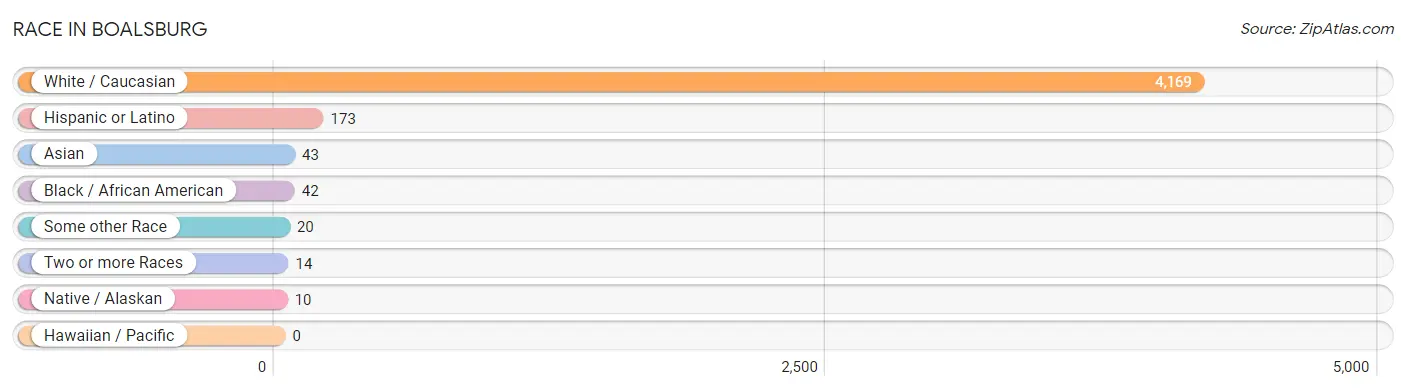
| Race | # Population | % Population |
| Asian | 43 | 1.0% |
| Black / African American | 42 | 1.0% |
| Hawaiian / Pacific | 0 | 0.0% |
| Hispanic or Latino | 173 | 4.0% |
| Native / Alaskan | 10 | 0.2% |
| White / Caucasian | 4,169 | 97.0% |
| Two or more Races | 14 | 0.3% |
| Some other Race | 20 | 0.5% |
| Total | 4,298 | 100.0% |
Ancestry in Boalsburg
The most populous ancestries reported in Boalsburg are German (1,376 | 32.0%), Irish (691 | 16.1%), English (687 | 16.0%), Polish (522 | 12.1%), and Italian (438 | 10.2%), together accounting for 86.4% of all Boalsburg residents.
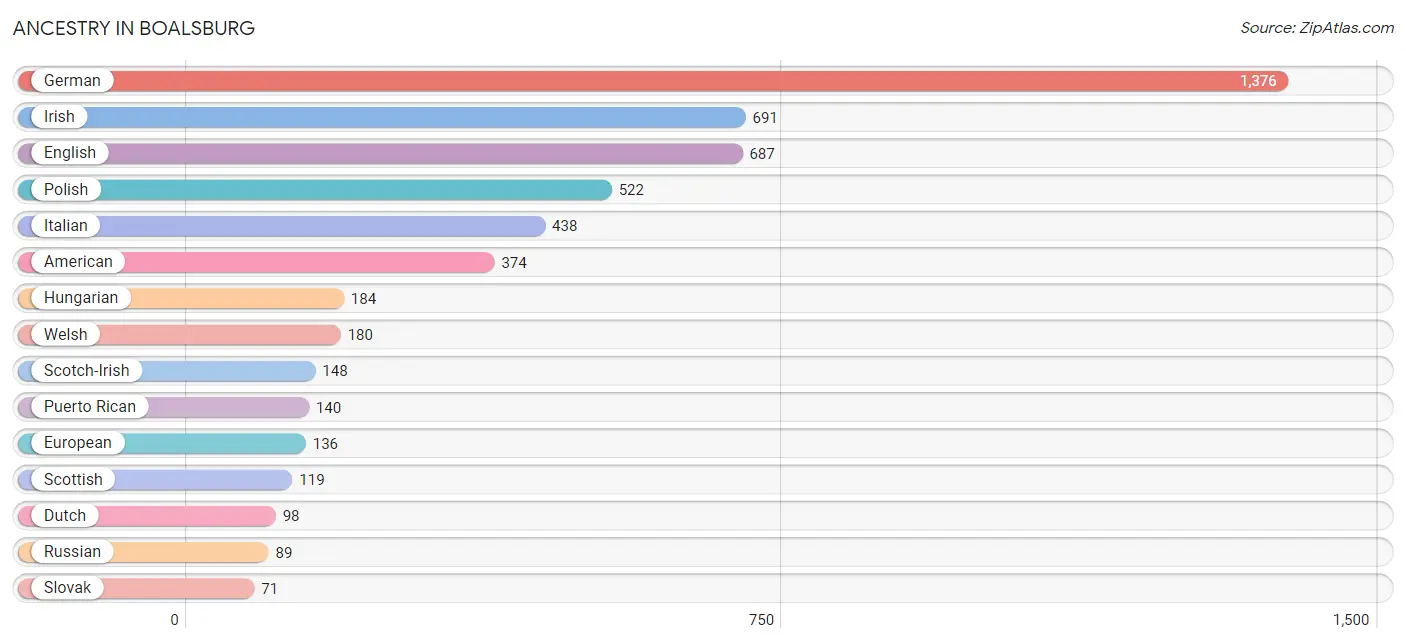
| Ancestry | # Population | % Population |
| American | 374 | 8.7% |
| Arab | 19 | 0.4% |
| Burmese | 18 | 0.4% |
| Central American | 10 | 0.2% |
| Central American Indian | 10 | 0.2% |
| Dutch | 98 | 2.3% |
| English | 687 | 16.0% |
| European | 136 | 3.2% |
| French | 54 | 1.3% |
| German | 1,376 | 32.0% |
| Guatemalan | 10 | 0.2% |
| Hungarian | 184 | 4.3% |
| Irish | 691 | 16.1% |
| Italian | 438 | 10.2% |
| Korean | 25 | 0.6% |
| Lebanese | 12 | 0.3% |
| Mexican | 23 | 0.5% |
| Pennsylvania German | 53 | 1.2% |
| Polish | 522 | 12.1% |
| Puerto Rican | 140 | 3.3% |
| Russian | 89 | 2.1% |
| Scandinavian | 11 | 0.3% |
| Scotch-Irish | 148 | 3.4% |
| Scottish | 119 | 2.8% |
| Slovak | 71 | 1.7% |
| Swedish | 52 | 1.2% |
| Welsh | 180 | 4.2% |
| Yugoslavian | 16 | 0.4% | View All 28 Rows |
Immigrants in Boalsburg
The most numerous immigrant groups reported in Boalsburg came from Europe (158 | 3.7%), Eastern Europe (135 | 3.1%), Hungary (104 | 2.4%), Latin America (62 | 1.4%), and Central America (46 | 1.1%), together accounting for 11.7% of all Boalsburg residents.
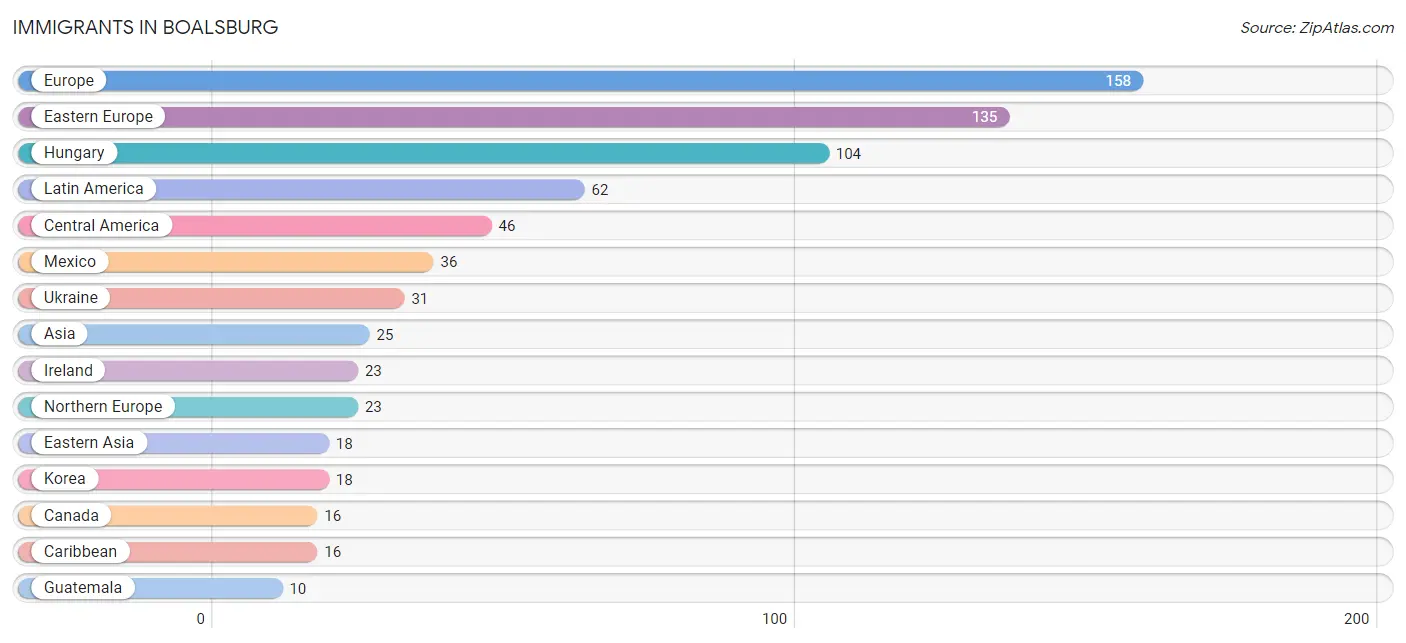
| Immigration Origin | # Population | % Population |
| Asia | 25 | 0.6% |
| Canada | 16 | 0.4% |
| Caribbean | 16 | 0.4% |
| Central America | 46 | 1.1% |
| Eastern Asia | 18 | 0.4% |
| Eastern Europe | 135 | 3.1% |
| Europe | 158 | 3.7% |
| Guatemala | 10 | 0.2% |
| Hungary | 104 | 2.4% |
| Ireland | 23 | 0.5% |
| Korea | 18 | 0.4% |
| Kuwait | 7 | 0.2% |
| Latin America | 62 | 1.4% |
| Mexico | 36 | 0.8% |
| Northern Europe | 23 | 0.5% |
| Ukraine | 31 | 0.7% |
| Western Asia | 7 | 0.2% | View All 17 Rows |
Sex and Age in Boalsburg
Sex and Age in Boalsburg
The most populous age groups in Boalsburg are 10 to 14 Years (270 | 12.7%) for men and 60 to 64 Years (206 | 9.5%) for women.
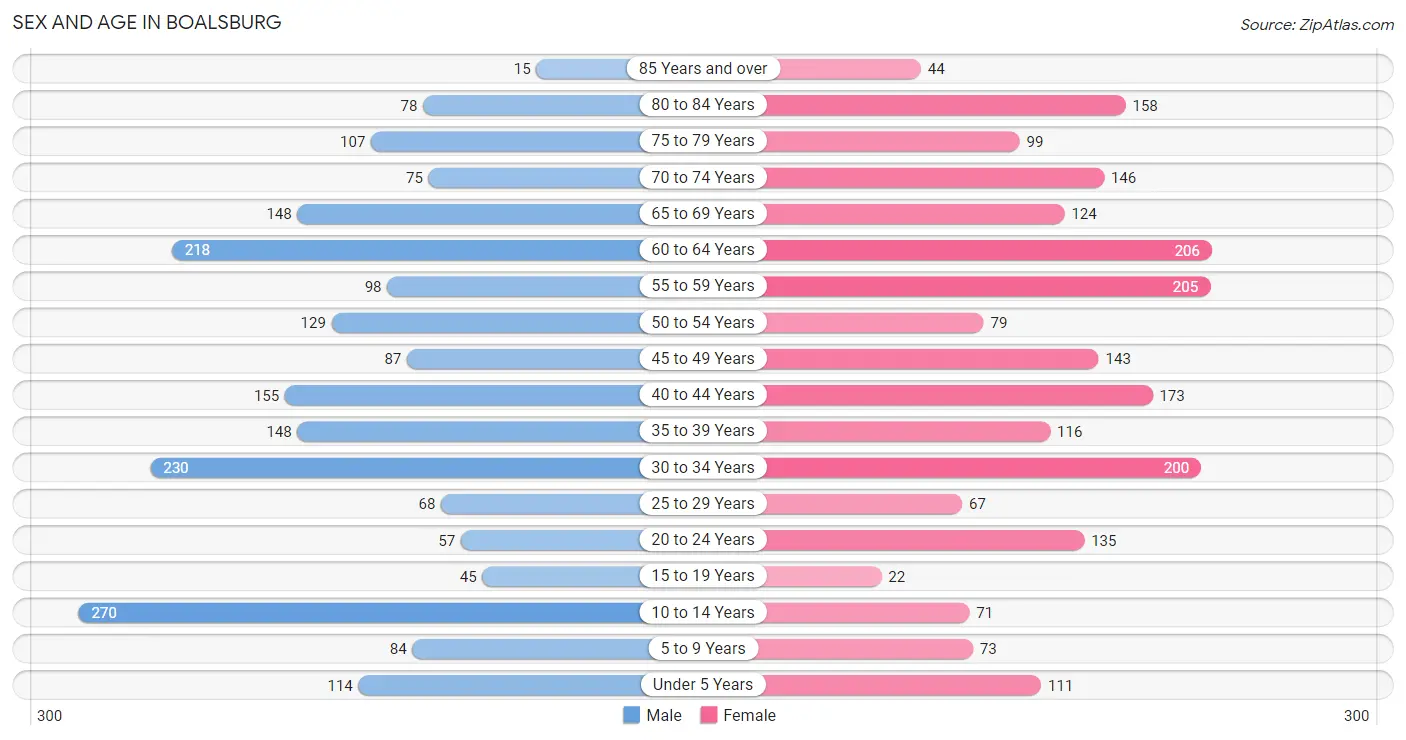
| Age Bracket | Male | Female |
| Under 5 Years | 114 (5.4%) | 111 (5.1%) |
| 5 to 9 Years | 84 (4.0%) | 73 (3.4%) |
| 10 to 14 Years | 270 (12.7%) | 71 (3.3%) |
| 15 to 19 Years | 45 (2.1%) | 22 (1.0%) |
| 20 to 24 Years | 57 (2.7%) | 135 (6.2%) |
| 25 to 29 Years | 68 (3.2%) | 67 (3.1%) |
| 30 to 34 Years | 230 (10.8%) | 200 (9.2%) |
| 35 to 39 Years | 148 (7.0%) | 116 (5.3%) |
| 40 to 44 Years | 155 (7.3%) | 173 (8.0%) |
| 45 to 49 Years | 87 (4.1%) | 143 (6.6%) |
| 50 to 54 Years | 129 (6.1%) | 79 (3.6%) |
| 55 to 59 Years | 98 (4.6%) | 205 (9.4%) |
| 60 to 64 Years | 218 (10.2%) | 206 (9.5%) |
| 65 to 69 Years | 148 (7.0%) | 124 (5.7%) |
| 70 to 74 Years | 75 (3.5%) | 146 (6.7%) |
| 75 to 79 Years | 107 (5.0%) | 99 (4.6%) |
| 80 to 84 Years | 78 (3.7%) | 158 (7.3%) |
| 85 Years and over | 15 (0.7%) | 44 (2.0%) |
| Total | 2,126 (100.0%) | 2,172 (100.0%) |
Families and Households in Boalsburg
Median Family Size in Boalsburg
The median family size in Boalsburg is 2.83 persons per family, with married-couple families (1,141 | 87.7%) accounting for the largest median family size of 2.89 persons per family. On the other hand, single male/father families (13 | 1.0%) represent the smallest median family size with 1.15 persons per family.
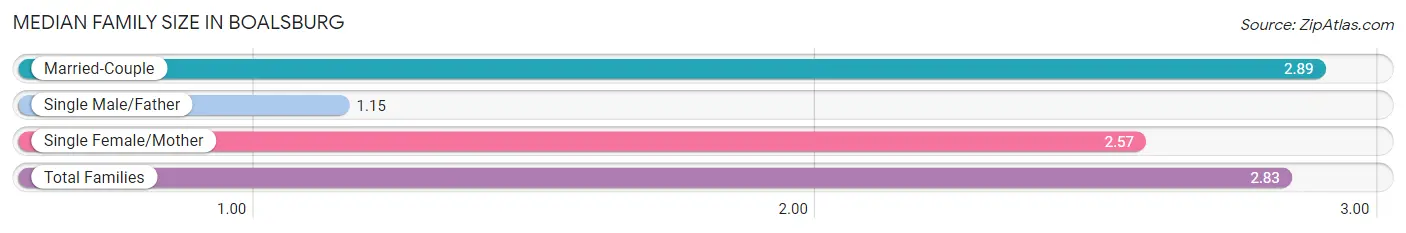
| Family Type | # Families | Family Size |
| Married-Couple | 1,141 (87.7%) | 2.89 |
| Single Male/Father | 13 (1.0%) | 1.15 |
| Single Female/Mother | 147 (11.3%) | 2.57 |
| Total Families | 1,301 (100.0%) | 2.83 |
Median Household Size in Boalsburg
The median household size in Boalsburg is 2.40 persons per household, with married-couple households (1,141 | 63.7%) accounting for the largest median household size of 2.89 persons per household. non-family households (490 | 27.4%) represent the smallest median household size with 1.22 persons per household.
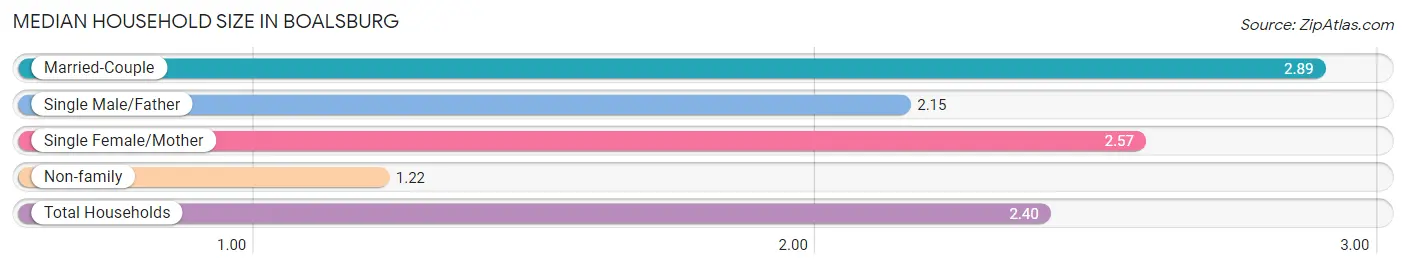
| Household Type | # Households | Household Size |
| Married-Couple | 1,141 (63.7%) | 2.89 |
| Single Male/Father | 13 (0.7%) | 2.15 |
| Single Female/Mother | 147 (8.2%) | 2.57 |
| Non-family | 490 (27.4%) | 1.22 |
| Total Households | 1,791 (100.0%) | 2.40 |
Household Size by Marriage Status in Boalsburg
Out of a total of 1,791 households in Boalsburg, 1,301 (72.6%) are family households, while 490 (27.4%) are nonfamily households. The most numerous type of family households are 2-person households, comprising 755, and the most common type of nonfamily households are 1-person households, comprising 407.
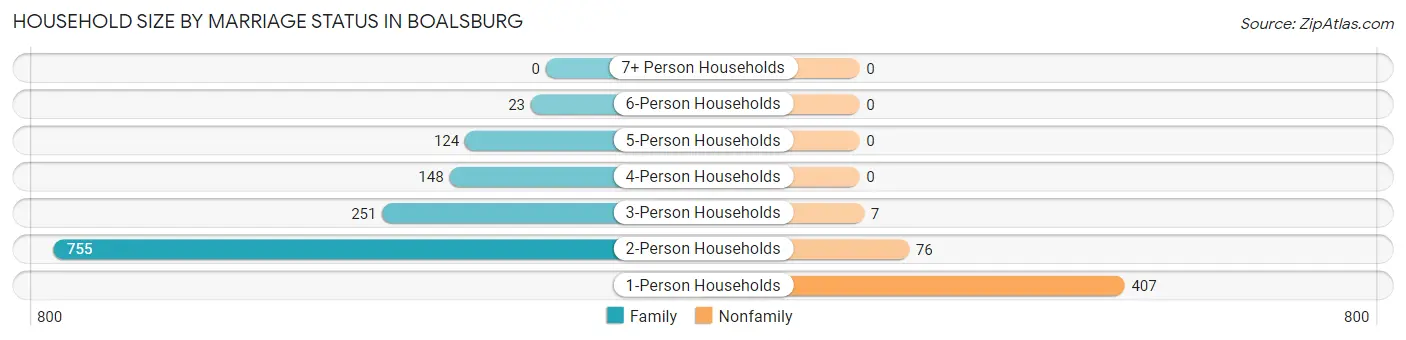
| Household Size | Family Households | Nonfamily Households |
| 1-Person Households | - | 407 (22.7%) |
| 2-Person Households | 755 (42.2%) | 76 (4.2%) |
| 3-Person Households | 251 (14.0%) | 7 (0.4%) |
| 4-Person Households | 148 (8.3%) | 0 (0.0%) |
| 5-Person Households | 124 (6.9%) | 0 (0.0%) |
| 6-Person Households | 23 (1.3%) | 0 (0.0%) |
| 7+ Person Households | 0 (0.0%) | 0 (0.0%) |
| Total | 1,301 (72.6%) | 490 (27.4%) |
Female Fertility in Boalsburg
Fertility by Age in Boalsburg
Average fertility rate in Boalsburg is 143.0 births per 1,000 women. Women in the age bracket of 35 to 50 years have the highest fertility rate with 199.0 births per 1,000 women. Women in the age bracket of 35 to 50 years acount for 73.4% of all women with births.
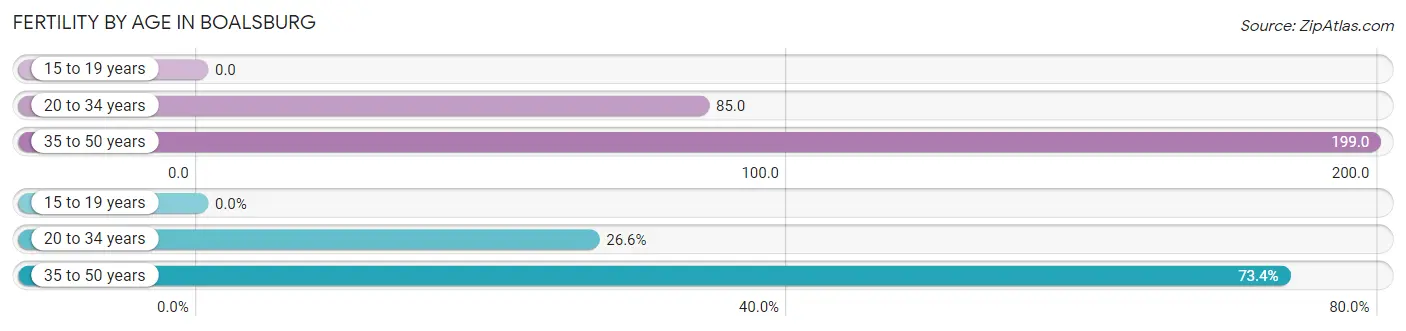
| Age Bracket | Women with Births | Births / 1,000 Women |
| 15 to 19 years | 0 (0.0%) | 0.0 |
| 20 to 34 years | 34 (26.6%) | 85.0 |
| 35 to 50 years | 94 (73.4%) | 199.0 |
| Total | 128 (100.0%) | 143.0 |
Fertility by Age by Marriage Status in Boalsburg
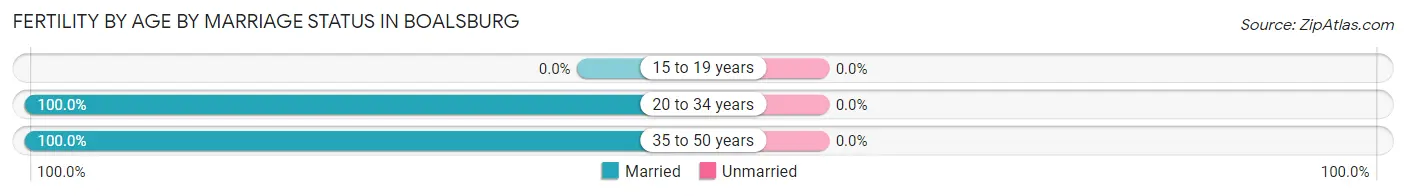
| Age Bracket | Married | Unmarried |
| 15 to 19 years | 0 (0.0%) | 0 (0.0%) |
| 20 to 34 years | 34 (100.0%) | 0 (0.0%) |
| 35 to 50 years | 94 (100.0%) | 0 (0.0%) |
| Total | 128 (100.0%) | 0 (0.0%) |
Fertility by Education in Boalsburg
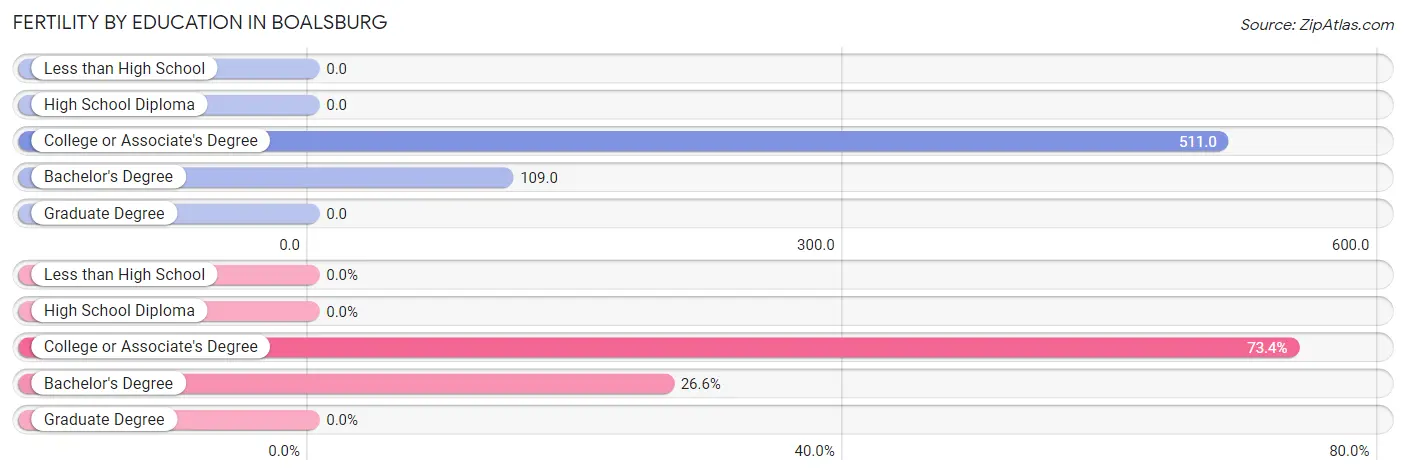
| Educational Attainment | Women with Births | Births / 1,000 Women |
| Less than High School | 0 (0.0%) | 0.0 |
| High School Diploma | 0 (0.0%) | 0.0 |
| College or Associate's Degree | 94 (73.4%) | 511.0 |
| Bachelor's Degree | 34 (26.6%) | 109.0 |
| Graduate Degree | 0 (0.0%) | 0.0 |
| Total | 128 (100.0%) | 143.0 |
Fertility by Education by Marriage Status in Boalsburg
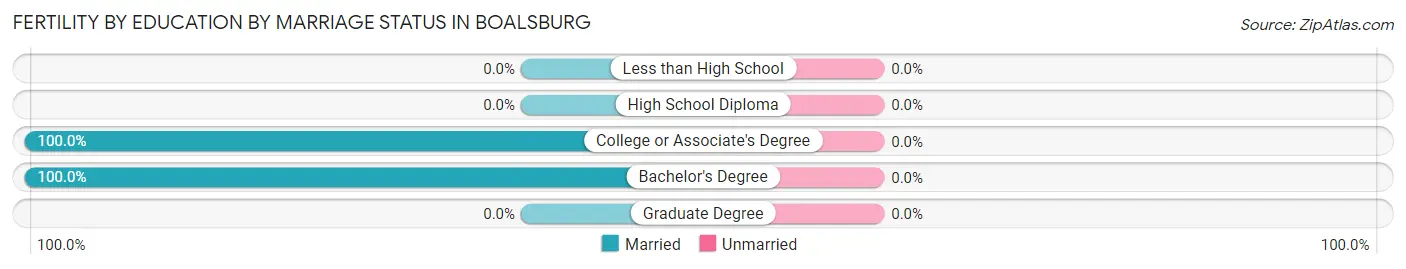
| Educational Attainment | Married | Unmarried |
| Less than High School | 0 (0.0%) | 0 (0.0%) |
| High School Diploma | 0 (0.0%) | 0 (0.0%) |
| College or Associate's Degree | 94 (100.0%) | 0 (0.0%) |
| Bachelor's Degree | 34 (100.0%) | 0 (0.0%) |
| Graduate Degree | 0 (0.0%) | 0 (0.0%) |
| Total | 128 (100.0%) | 0 (0.0%) |
Employment Characteristics in Boalsburg
Employment by Class of Employer in Boalsburg
Among the 2,227 employed individuals in Boalsburg, private company employees (1,356 | 60.9%), not-for-profit organizations (408 | 18.3%), and state government employees (181 | 8.1%) make up the most common classes of employment.
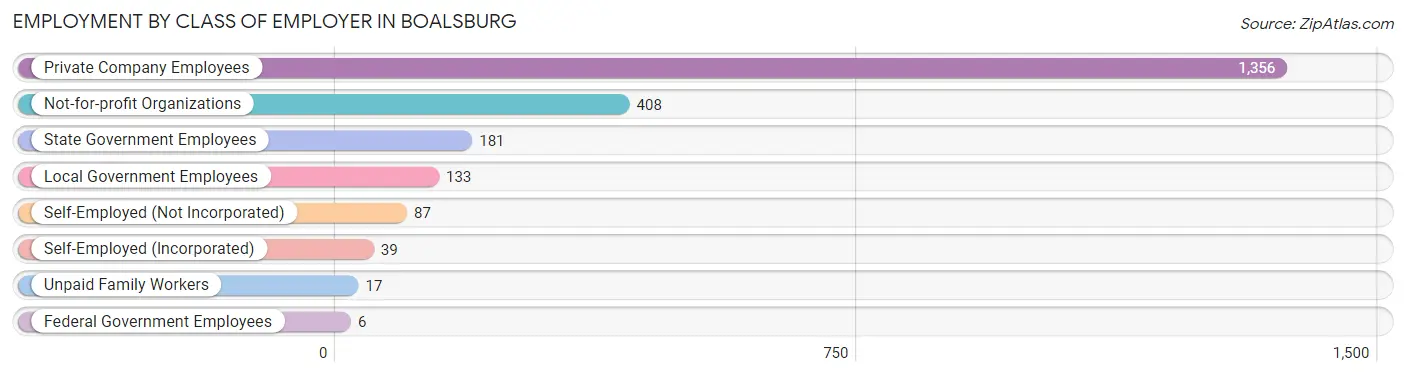
| Employer Class | # Employees | % Employees |
| Private Company Employees | 1,356 | 60.9% |
| Self-Employed (Incorporated) | 39 | 1.8% |
| Self-Employed (Not Incorporated) | 87 | 3.9% |
| Not-for-profit Organizations | 408 | 18.3% |
| Local Government Employees | 133 | 6.0% |
| State Government Employees | 181 | 8.1% |
| Federal Government Employees | 6 | 0.3% |
| Unpaid Family Workers | 17 | 0.8% |
| Total | 2,227 | 100.0% |
Employment Status by Age in Boalsburg
According to the labor force statistics for Boalsburg, out of the total population over 16 years of age (3,535), 66.2% or 2,340 individuals are in the labor force, with 4.1% or 96 of them unemployed. The age group with the highest labor force participation rate is 25 to 29 years, with 100.0% or 135 individuals in the labor force. Within the labor force, the 16 to 19 years age range has the highest percentage of unemployed individuals, with 40.0% or 2 of them being unemployed.
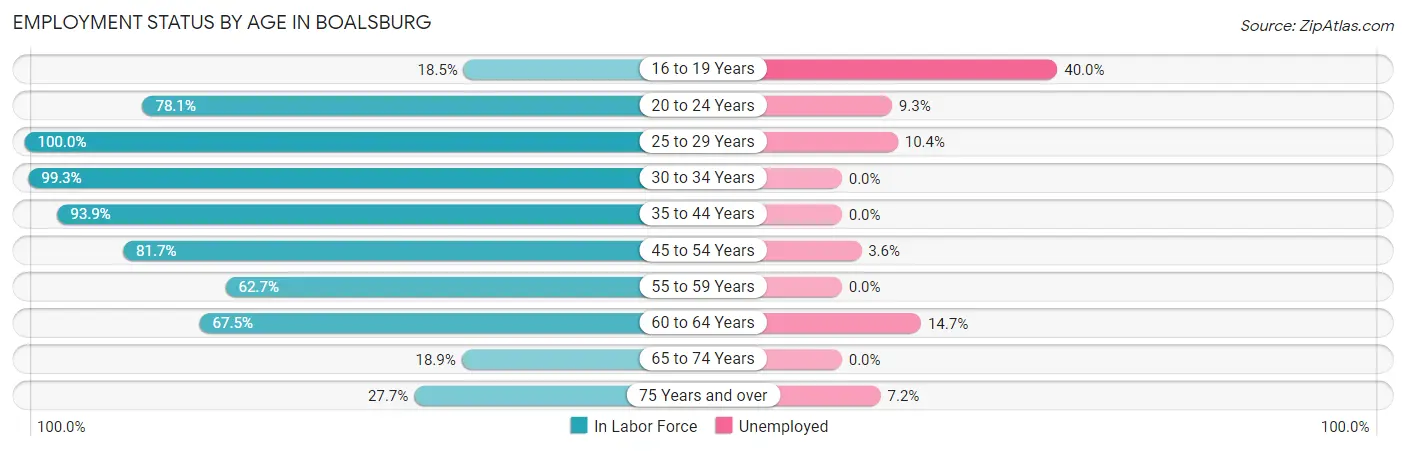
| Age Bracket | In Labor Force | Unemployed |
| 16 to 19 Years | 5 (18.5%) | 2 (40.0%) |
| 20 to 24 Years | 150 (78.1%) | 14 (9.3%) |
| 25 to 29 Years | 135 (100.0%) | 14 (10.4%) |
| 30 to 34 Years | 427 (99.3%) | 0 (0.0%) |
| 35 to 44 Years | 556 (93.9%) | 0 (0.0%) |
| 45 to 54 Years | 358 (81.7%) | 13 (3.6%) |
| 55 to 59 Years | 190 (62.7%) | 0 (0.0%) |
| 60 to 64 Years | 286 (67.5%) | 42 (14.7%) |
| 65 to 74 Years | 93 (18.9%) | 0 (0.0%) |
| 75 Years and over | 139 (27.7%) | 10 (7.2%) |
| Total | 2,340 (66.2%) | 96 (4.1%) |
Employment Status by Educational Attainment in Boalsburg
According to labor force statistics for Boalsburg, 84.1% of individuals (1,953) out of the total population between 25 and 64 years of age (2,322) are in the labor force, with 3.5% or 68 of them being unemployed. The group with the highest labor force participation rate are those with the educational attainment of bachelor's degree or higher, with 87.0% or 1,389 individuals in the labor force. Within the labor force, individuals with high school diploma education have the highest percentage of unemployment, with 12.2% or 42 of them being unemployed.
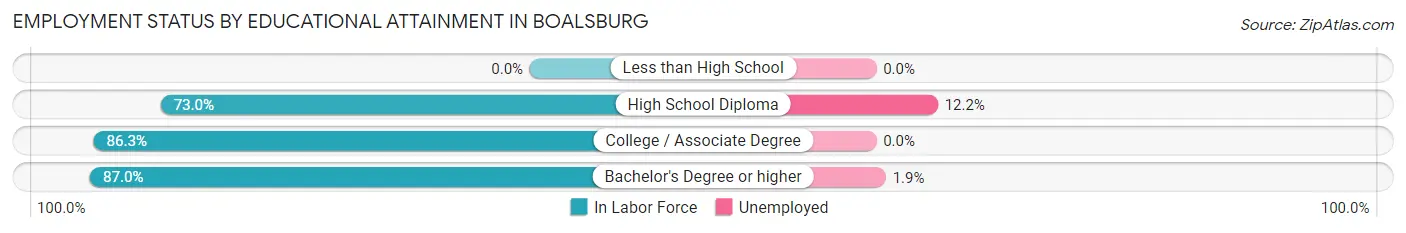
| Educational Attainment | In Labor Force | Unemployed |
| Less than High School | 0 (0.0%) | 0 (0.0%) |
| High School Diploma | 343 (73.0%) | 57 (12.2%) |
| College / Associate Degree | 220 (86.3%) | 0 (0.0%) |
| Bachelor's Degree or higher | 1,389 (87.0%) | 30 (1.9%) |
| Total | 1,953 (84.1%) | 81 (3.5%) |
Employment Occupations by Sex in Boalsburg
Management, Business, Science and Arts Occupations
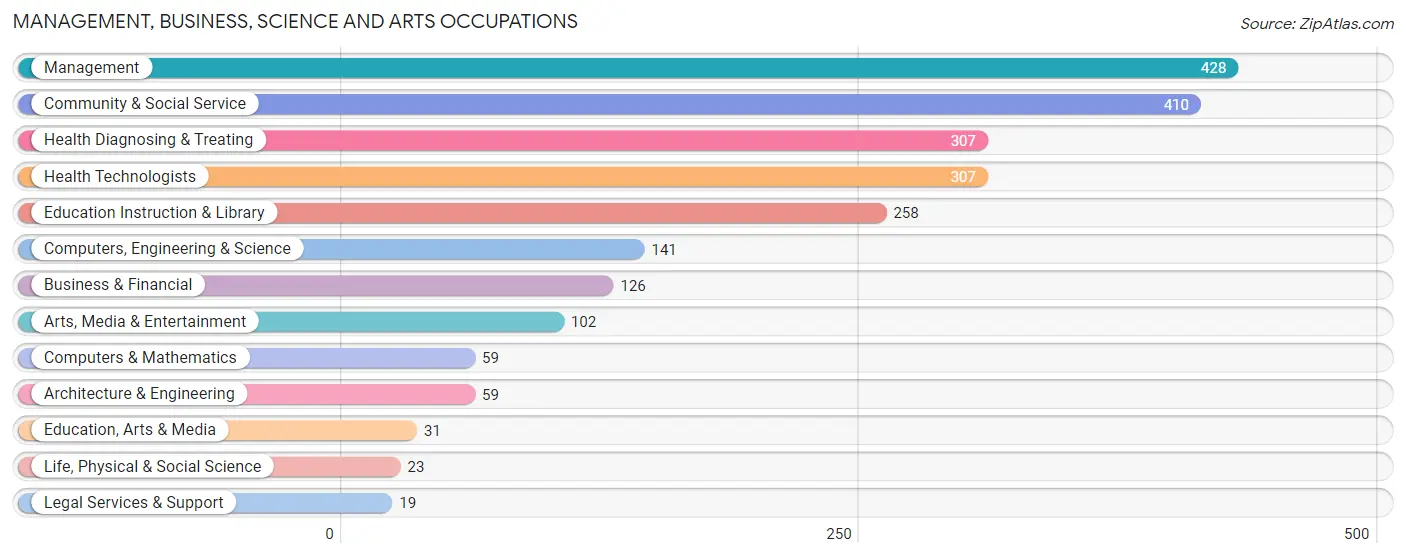
The most common Management, Business, Science and Arts occupations in Boalsburg are Management (428 | 19.1%), Community & Social Service (410 | 18.3%), Health Diagnosing & Treating (307 | 13.7%), Health Technologists (307 | 13.7%), and Education Instruction & Library (258 | 11.5%).
Management, Business, Science and Arts Occupations by Sex
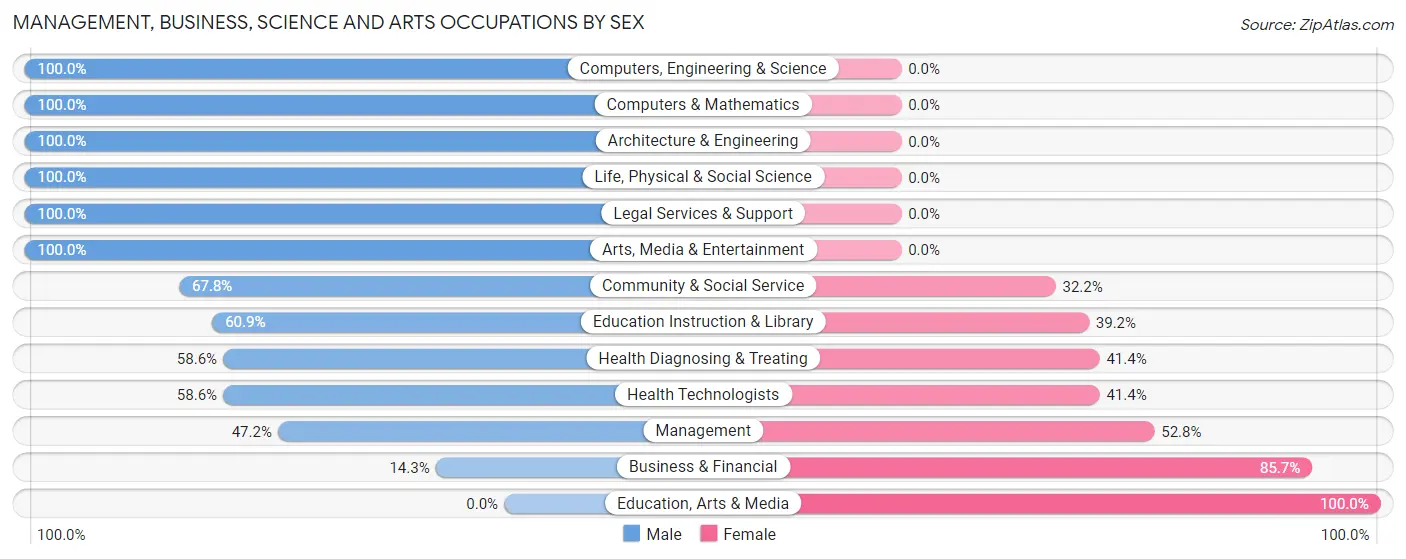
Within the Management, Business, Science and Arts occupations in Boalsburg, the most male-oriented occupations are Computers, Engineering & Science (100.0%), Computers & Mathematics (100.0%), and Architecture & Engineering (100.0%), while the most female-oriented occupations are Education, Arts & Media (100.0%), Business & Financial (85.7%), and Management (52.8%).
| Occupation | Male | Female |
| Management | 202 (47.2%) | 226 (52.8%) |
| Business & Financial | 18 (14.3%) | 108 (85.7%) |
| Computers, Engineering & Science | 141 (100.0%) | 0 (0.0%) |
| Computers & Mathematics | 59 (100.0%) | 0 (0.0%) |
| Architecture & Engineering | 59 (100.0%) | 0 (0.0%) |
| Life, Physical & Social Science | 23 (100.0%) | 0 (0.0%) |
| Community & Social Service | 278 (67.8%) | 132 (32.2%) |
| Education, Arts & Media | 0 (0.0%) | 31 (100.0%) |
| Legal Services & Support | 19 (100.0%) | 0 (0.0%) |
| Education Instruction & Library | 157 (60.9%) | 101 (39.2%) |
| Arts, Media & Entertainment | 102 (100.0%) | 0 (0.0%) |
| Health Diagnosing & Treating | 180 (58.6%) | 127 (41.4%) |
| Health Technologists | 180 (58.6%) | 127 (41.4%) |
| Total (Category) | 819 (58.0%) | 593 (42.0%) |
| Total (Overall) | 1,199 (53.4%) | 1,045 (46.6%) |
Services Occupations
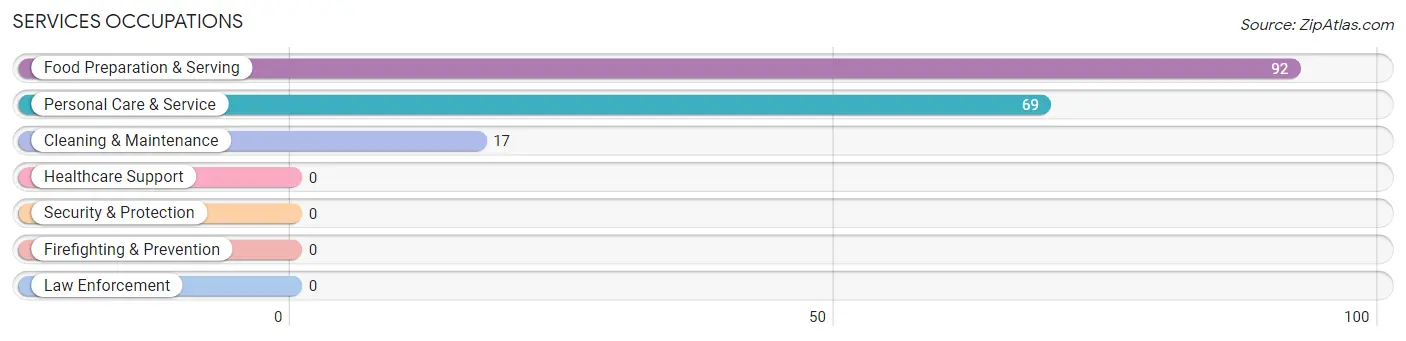
The most common Services occupations in Boalsburg are Food Preparation & Serving (92 | 4.1%), Personal Care & Service (69 | 3.1%), and Cleaning & Maintenance (17 | 0.8%).
Services Occupations by Sex
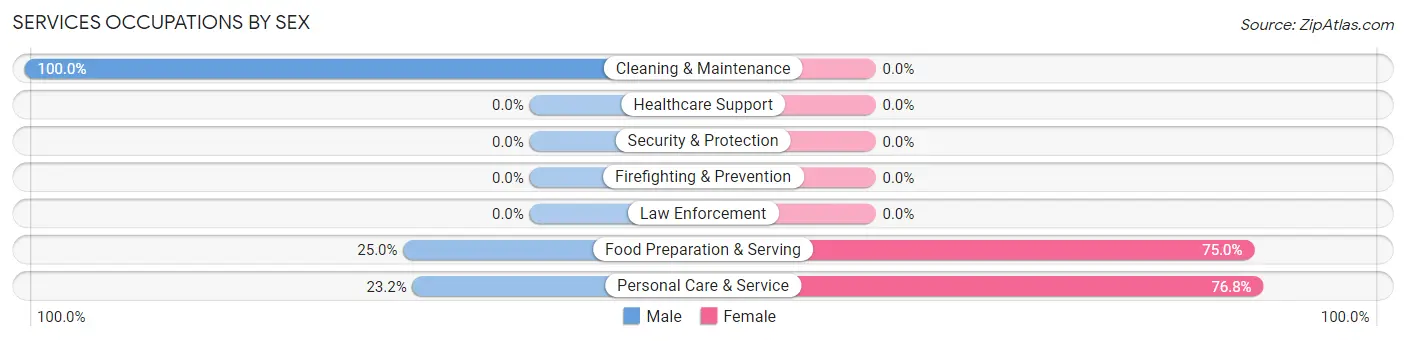
Within the Services occupations in Boalsburg, the most male-oriented occupations are Cleaning & Maintenance (100.0%), Food Preparation & Serving (25.0%), and Personal Care & Service (23.2%), while the most female-oriented occupations are Personal Care & Service (76.8%), and Food Preparation & Serving (75.0%).
| Occupation | Male | Female |
| Healthcare Support | 0 (0.0%) | 0 (0.0%) |
| Security & Protection | 0 (0.0%) | 0 (0.0%) |
| Firefighting & Prevention | 0 (0.0%) | 0 (0.0%) |
| Law Enforcement | 0 (0.0%) | 0 (0.0%) |
| Food Preparation & Serving | 23 (25.0%) | 69 (75.0%) |
| Cleaning & Maintenance | 17 (100.0%) | 0 (0.0%) |
| Personal Care & Service | 16 (23.2%) | 53 (76.8%) |
| Total (Category) | 56 (31.5%) | 122 (68.5%) |
| Total (Overall) | 1,199 (53.4%) | 1,045 (46.6%) |
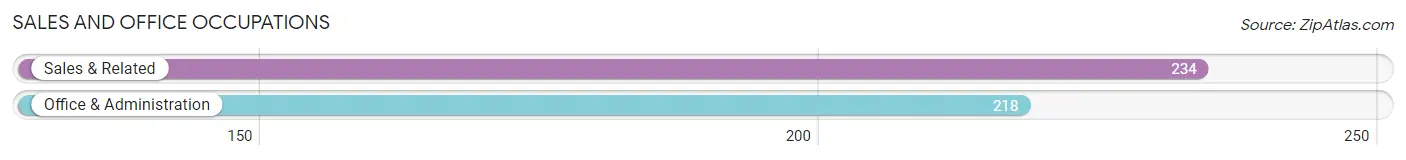
Sales and Office Occupations
The most common Sales and Office occupations in Boalsburg are Sales & Related (234 | 10.4%), and Office & Administration (218 | 9.7%).
Sales and Office Occupations by Sex
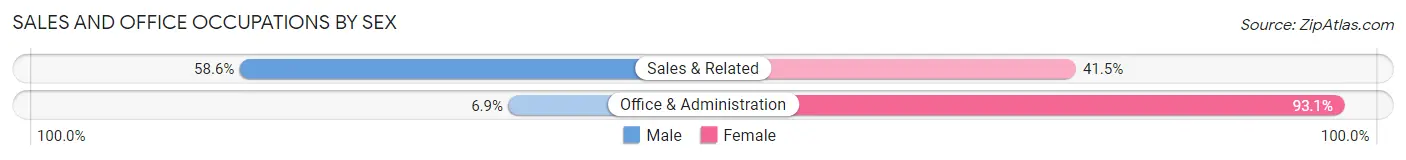
| Occupation | Male | Female |
| Sales & Related | 137 (58.6%) | 97 (41.4%) |
| Office & Administration | 15 (6.9%) | 203 (93.1%) |
| Total (Category) | 152 (33.6%) | 300 (66.4%) |
| Total (Overall) | 1,199 (53.4%) | 1,045 (46.6%) |
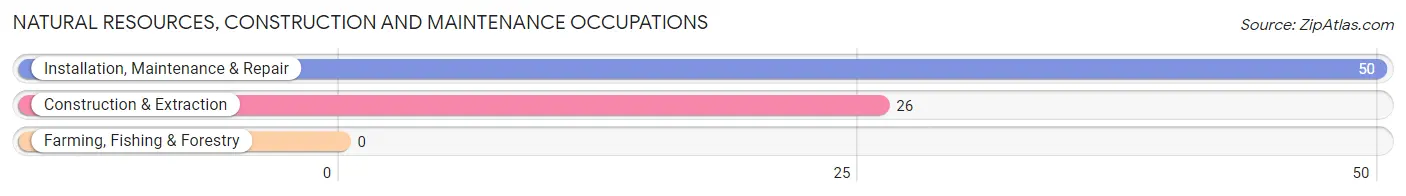
Natural Resources, Construction and Maintenance Occupations
The most common Natural Resources, Construction and Maintenance occupations in Boalsburg are Installation, Maintenance & Repair (50 | 2.2%), and Construction & Extraction (26 | 1.2%).
Natural Resources, Construction and Maintenance Occupations by Sex
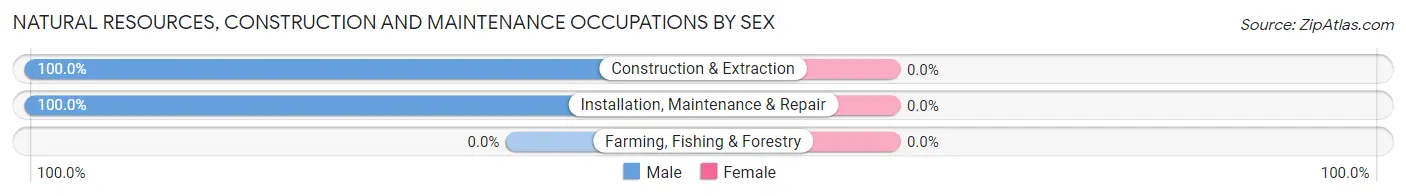
| Occupation | Male | Female |
| Farming, Fishing & Forestry | 0 (0.0%) | 0 (0.0%) |
| Construction & Extraction | 26 (100.0%) | 0 (0.0%) |
| Installation, Maintenance & Repair | 50 (100.0%) | 0 (0.0%) |
| Total (Category) | 76 (100.0%) | 0 (0.0%) |
| Total (Overall) | 1,199 (53.4%) | 1,045 (46.6%) |
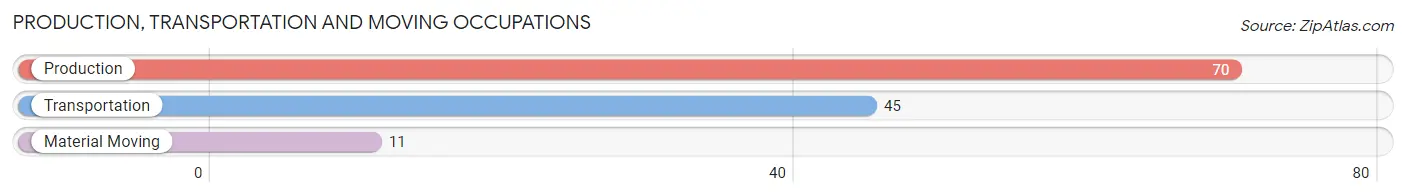
Production, Transportation and Moving Occupations
The most common Production, Transportation and Moving occupations in Boalsburg are Production (70 | 3.1%), Transportation (45 | 2.0%), and Material Moving (11 | 0.5%).
Production, Transportation and Moving Occupations by Sex
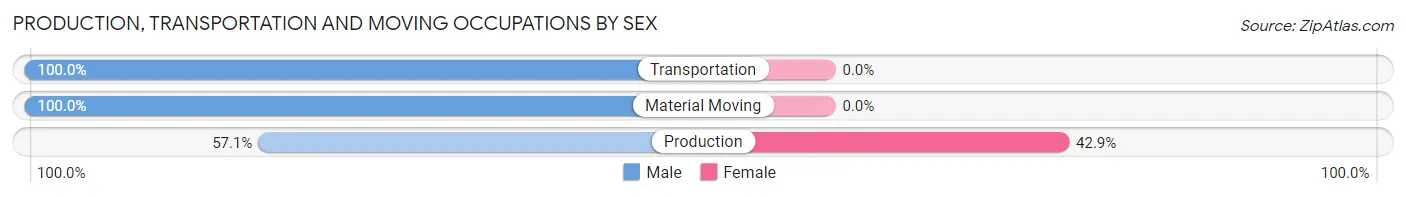
| Occupation | Male | Female |
| Production | 40 (57.1%) | 30 (42.9%) |
| Transportation | 45 (100.0%) | 0 (0.0%) |
| Material Moving | 11 (100.0%) | 0 (0.0%) |
| Total (Category) | 96 (76.2%) | 30 (23.8%) |
| Total (Overall) | 1,199 (53.4%) | 1,045 (46.6%) |
Employment Industries by Sex in Boalsburg
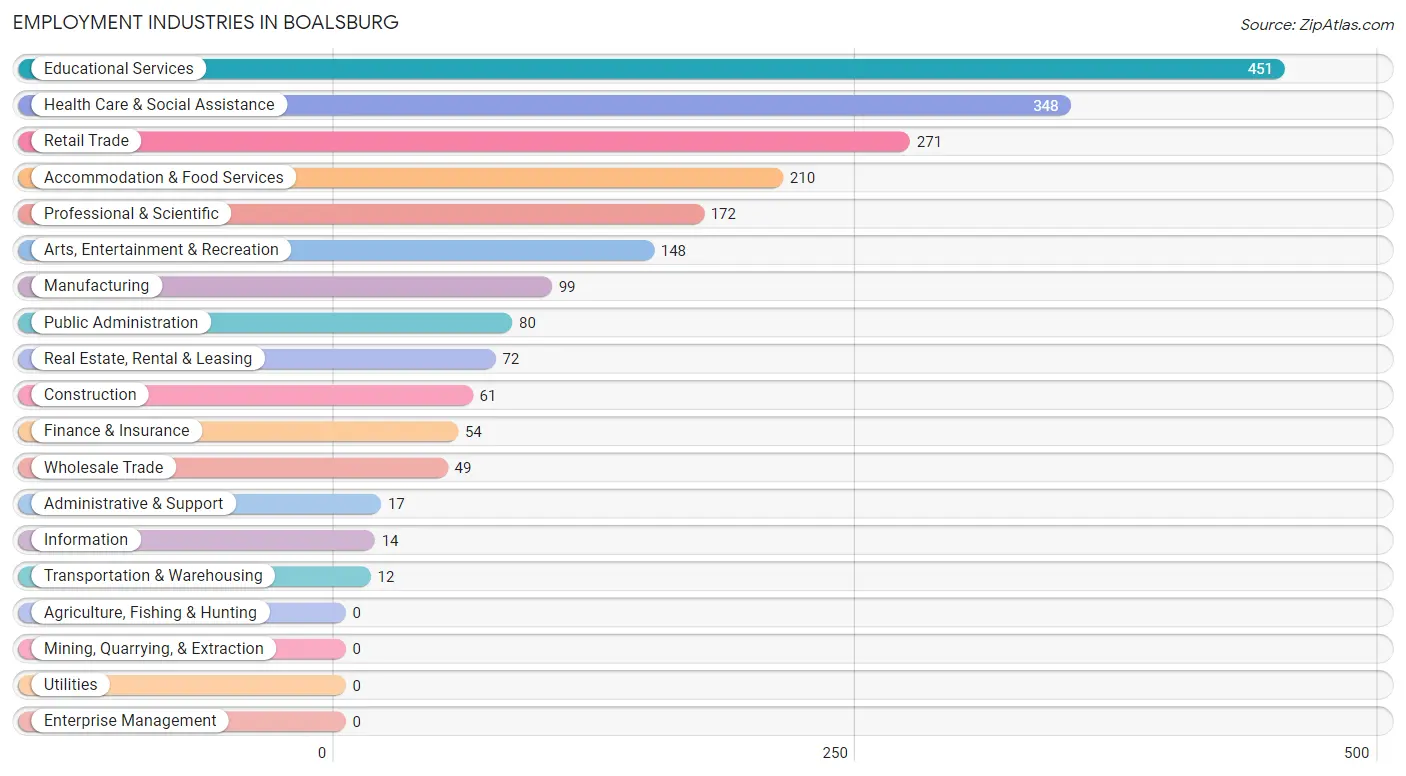
Employment Industries in Boalsburg
The major employment industries in Boalsburg include Educational Services (451 | 20.1%), Health Care & Social Assistance (348 | 15.5%), Retail Trade (271 | 12.1%), Accommodation & Food Services (210 | 9.4%), and Professional & Scientific (172 | 7.7%).
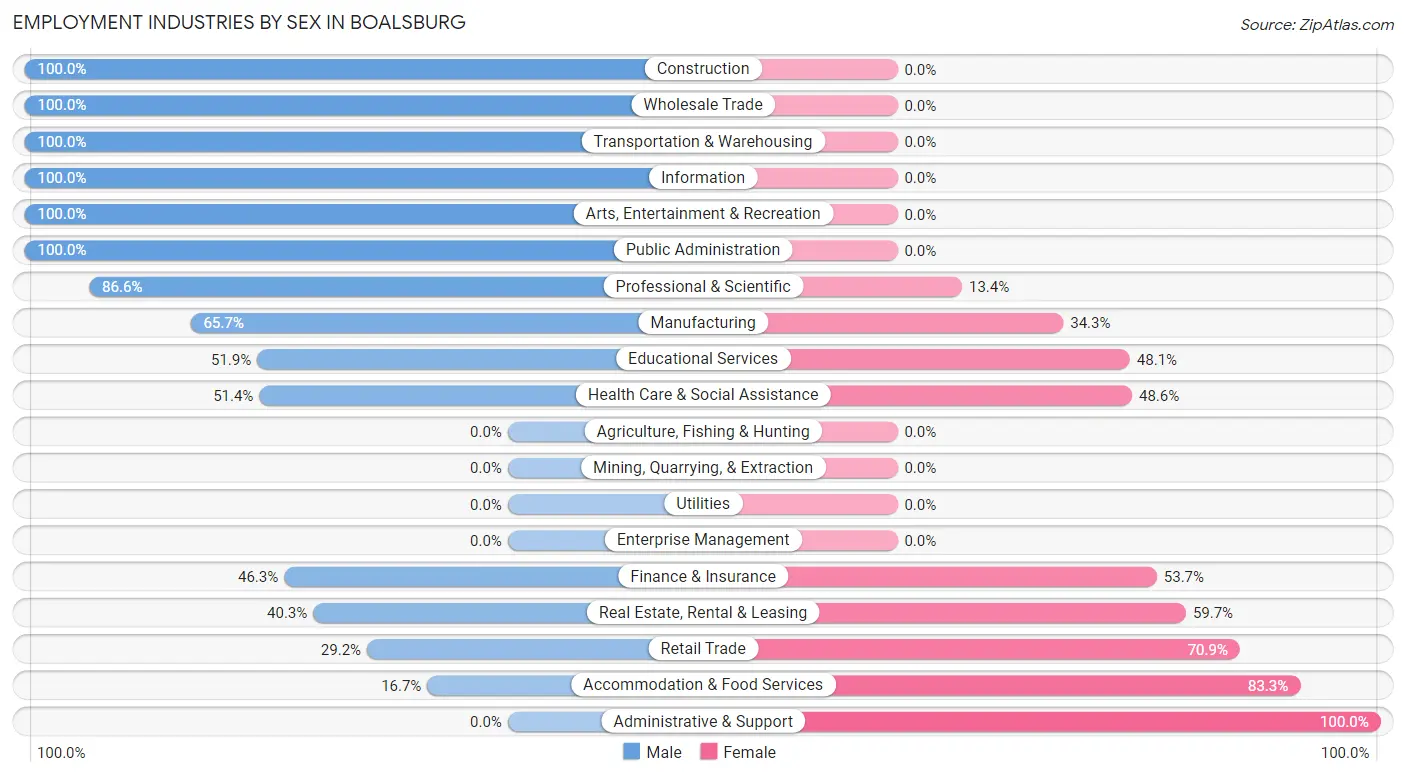
Employment Industries by Sex in Boalsburg
The Boalsburg industries that see more men than women are Construction (100.0%), Wholesale Trade (100.0%), and Transportation & Warehousing (100.0%), whereas the industries that tend to have a higher number of women are Administrative & Support (100.0%), Accommodation & Food Services (83.3%), and Retail Trade (70.9%).
| Industry | Male | Female |
| Agriculture, Fishing & Hunting | 0 (0.0%) | 0 (0.0%) |
| Mining, Quarrying, & Extraction | 0 (0.0%) | 0 (0.0%) |
| Construction | 61 (100.0%) | 0 (0.0%) |
| Manufacturing | 65 (65.7%) | 34 (34.3%) |
| Wholesale Trade | 49 (100.0%) | 0 (0.0%) |
| Retail Trade | 79 (29.1%) | 192 (70.9%) |
| Transportation & Warehousing | 12 (100.0%) | 0 (0.0%) |
| Utilities | 0 (0.0%) | 0 (0.0%) |
| Information | 14 (100.0%) | 0 (0.0%) |
| Finance & Insurance | 25 (46.3%) | 29 (53.7%) |
| Real Estate, Rental & Leasing | 29 (40.3%) | 43 (59.7%) |
| Professional & Scientific | 149 (86.6%) | 23 (13.4%) |
| Enterprise Management | 0 (0.0%) | 0 (0.0%) |
| Administrative & Support | 0 (0.0%) | 17 (100.0%) |
| Educational Services | 234 (51.9%) | 217 (48.1%) |
| Health Care & Social Assistance | 179 (51.4%) | 169 (48.6%) |
| Arts, Entertainment & Recreation | 148 (100.0%) | 0 (0.0%) |
| Accommodation & Food Services | 35 (16.7%) | 175 (83.3%) |
| Public Administration | 80 (100.0%) | 0 (0.0%) |
| Total | 1,199 (53.4%) | 1,045 (46.6%) |
Education in Boalsburg
School Enrollment in Boalsburg
The most common levels of schooling among the 781 students in Boalsburg are middle school (234 | 30.0%), college / undergraduate (163 | 20.9%), and graduate / professional (151 | 19.3%).
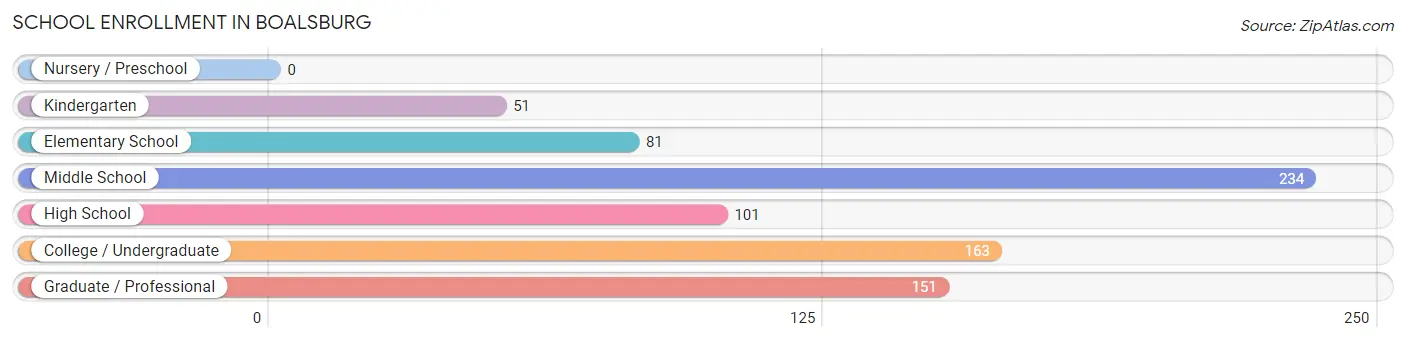
| School Level | # Students | % Students |
| Nursery / Preschool | 0 | 0.0% |
| Kindergarten | 51 | 6.5% |
| Elementary School | 81 | 10.4% |
| Middle School | 234 | 30.0% |
| High School | 101 | 12.9% |
| College / Undergraduate | 163 | 20.9% |
| Graduate / Professional | 151 | 19.3% |
| Total | 781 | 100.0% |
School Enrollment by Age by Funding Source in Boalsburg
Out of a total of 781 students who are enrolled in schools in Boalsburg, 128 (16.4%) attend a private institution, while the remaining 653 (83.6%) are enrolled in public schools. The age group of 18 to 19 year olds has the highest likelihood of being enrolled in private schools, with 16 (88.9% in the age bracket) enrolled. Conversely, the age group of 5 to 9 year old has the lowest likelihood of being enrolled in a private school, with 93 (100.0% in the age bracket) attending a public institution.
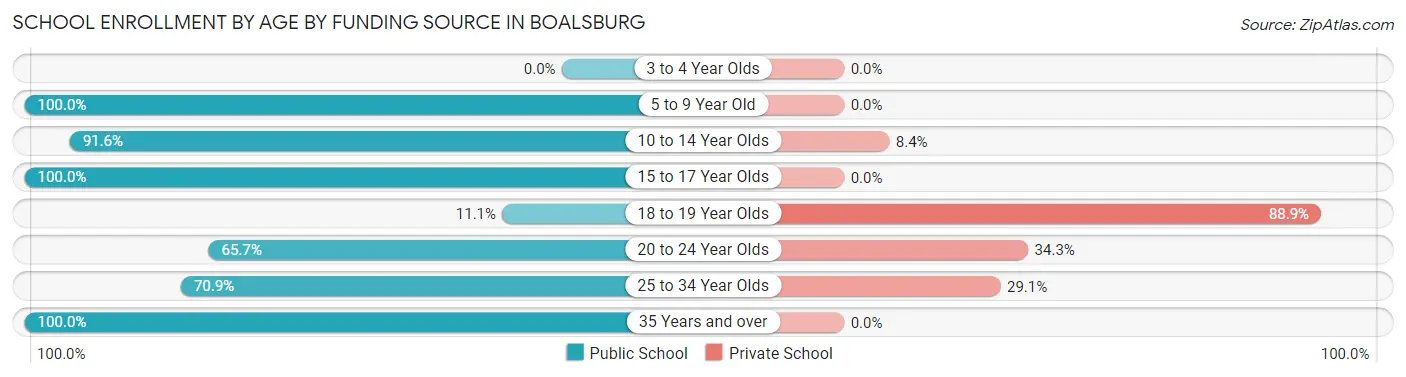
| Age Bracket | Public School | Private School |
| 3 to 4 Year Olds | 0 (0.0%) | 0 (0.0%) |
| 5 to 9 Year Old | 93 (100.0%) | 0 (0.0%) |
| 10 to 14 Year Olds | 283 (91.6%) | 26 (8.4%) |
| 15 to 17 Year Olds | 49 (100.0%) | 0 (0.0%) |
| 18 to 19 Year Olds | 2 (11.1%) | 16 (88.9%) |
| 20 to 24 Year Olds | 94 (65.7%) | 49 (34.3%) |
| 25 to 34 Year Olds | 90 (70.9%) | 37 (29.1%) |
| 35 Years and over | 42 (100.0%) | 0 (0.0%) |
| Total | 653 (83.6%) | 128 (16.4%) |
Educational Attainment by Field of Study in Boalsburg
Bio, nature & agricultural (345 | 14.8%), business (303 | 13.0%), science & technology (247 | 10.6%), visual & performing arts (244 | 10.5%), and education (227 | 9.7%) are the most common fields of study among 2,330 individuals in Boalsburg who have obtained a bachelor's degree or higher.
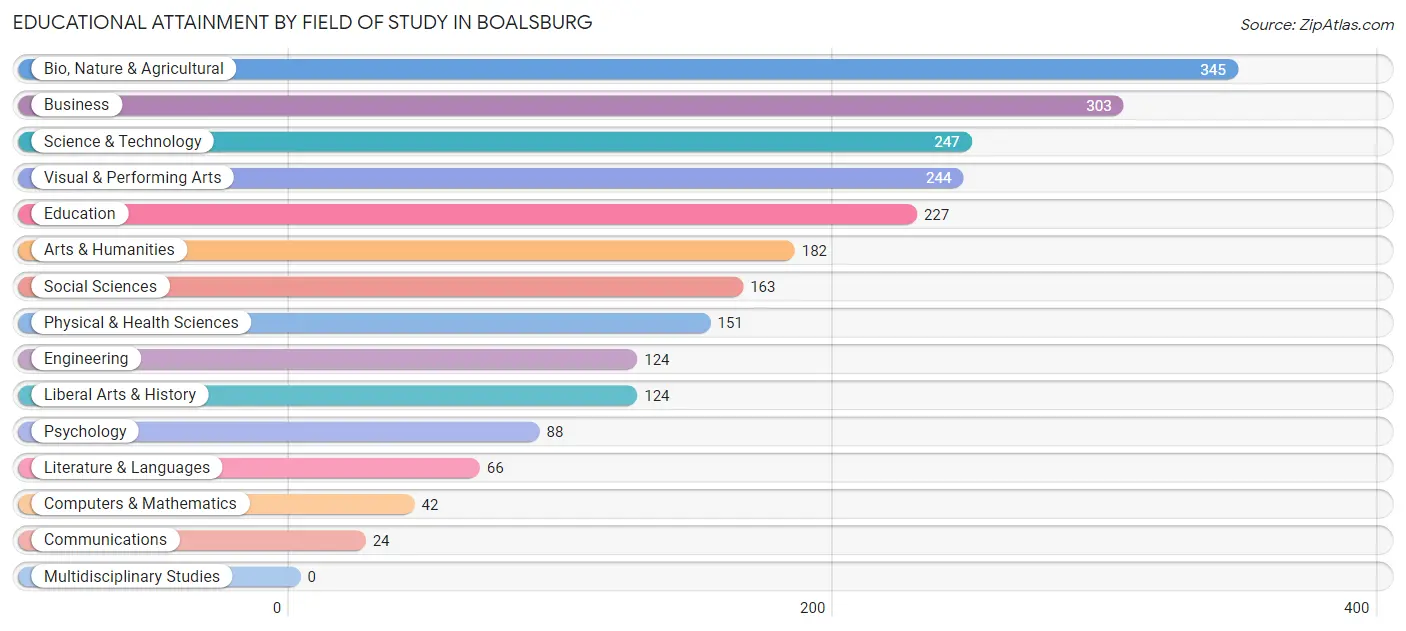
| Field of Study | # Graduates | % Graduates |
| Computers & Mathematics | 42 | 1.8% |
| Bio, Nature & Agricultural | 345 | 14.8% |
| Physical & Health Sciences | 151 | 6.5% |
| Psychology | 88 | 3.8% |
| Social Sciences | 163 | 7.0% |
| Engineering | 124 | 5.3% |
| Multidisciplinary Studies | 0 | 0.0% |
| Science & Technology | 247 | 10.6% |
| Business | 303 | 13.0% |
| Education | 227 | 9.7% |
| Literature & Languages | 66 | 2.8% |
| Liberal Arts & History | 124 | 5.3% |
| Visual & Performing Arts | 244 | 10.5% |
| Communications | 24 | 1.0% |
| Arts & Humanities | 182 | 7.8% |
| Total | 2,330 | 100.0% |
Transportation & Commute in Boalsburg
Vehicle Availability by Sex in Boalsburg
The most prevalent vehicle ownership categories in Boalsburg are males with 2 vehicles (619, accounting for 51.6%) and females with 2 vehicles (534, making up 60.2%).
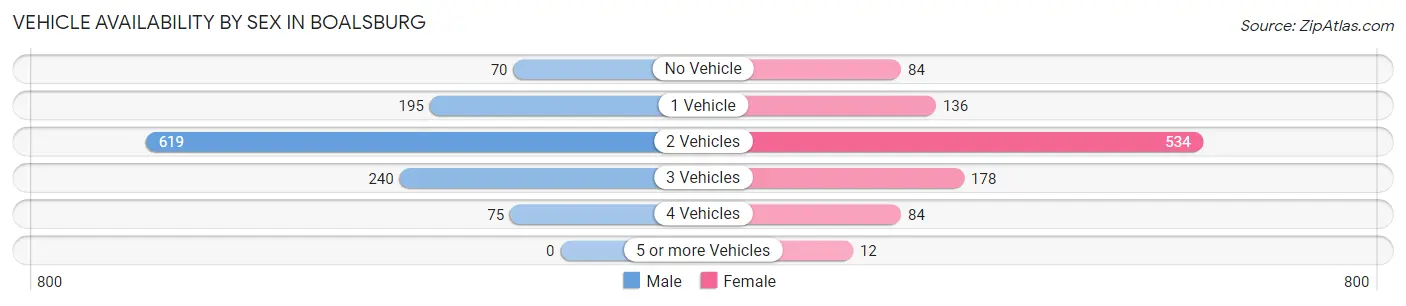
| Vehicles Available | Male | Female |
| No Vehicle | 70 (5.8%) | 84 (8.2%) |
| 1 Vehicle | 195 (16.3%) | 136 (13.2%) |
| 2 Vehicles | 619 (51.6%) | 534 (51.9%) |
| 3 Vehicles | 240 (20.0%) | 178 (17.3%) |
| 4 Vehicles | 75 (6.3%) | 84 (8.2%) |
| 5 or more Vehicles | 0 (0.0%) | 12 (1.2%) |
| Total | 1,199 (100.0%) | 1,028 (100.0%) |
Commute Time in Boalsburg
The most frequently occuring commute durations in Boalsburg are 10 to 14 minutes (735 commuters, 38.1%), 15 to 19 minutes (384 commuters, 19.9%), and 5 to 9 minutes (322 commuters, 16.7%).
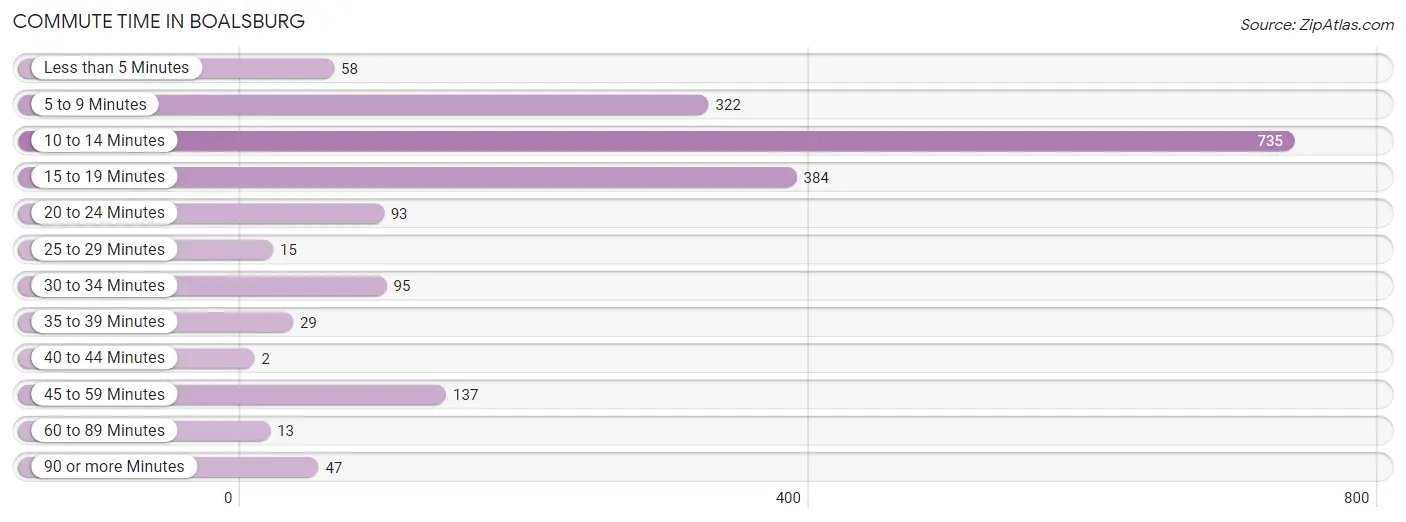
| Commute Time | # Commuters | % Commuters |
| Less than 5 Minutes | 58 | 3.0% |
| 5 to 9 Minutes | 322 | 16.7% |
| 10 to 14 Minutes | 735 | 38.1% |
| 15 to 19 Minutes | 384 | 19.9% |
| 20 to 24 Minutes | 93 | 4.8% |
| 25 to 29 Minutes | 15 | 0.8% |
| 30 to 34 Minutes | 95 | 4.9% |
| 35 to 39 Minutes | 29 | 1.5% |
| 40 to 44 Minutes | 2 | 0.1% |
| 45 to 59 Minutes | 137 | 7.1% |
| 60 to 89 Minutes | 13 | 0.7% |
| 90 or more Minutes | 47 | 2.4% |
Commute Time by Sex in Boalsburg
The most common commute times in Boalsburg are 10 to 14 minutes (396 commuters, 37.8%) for males and 10 to 14 minutes (339 commuters, 38.4%) for females.
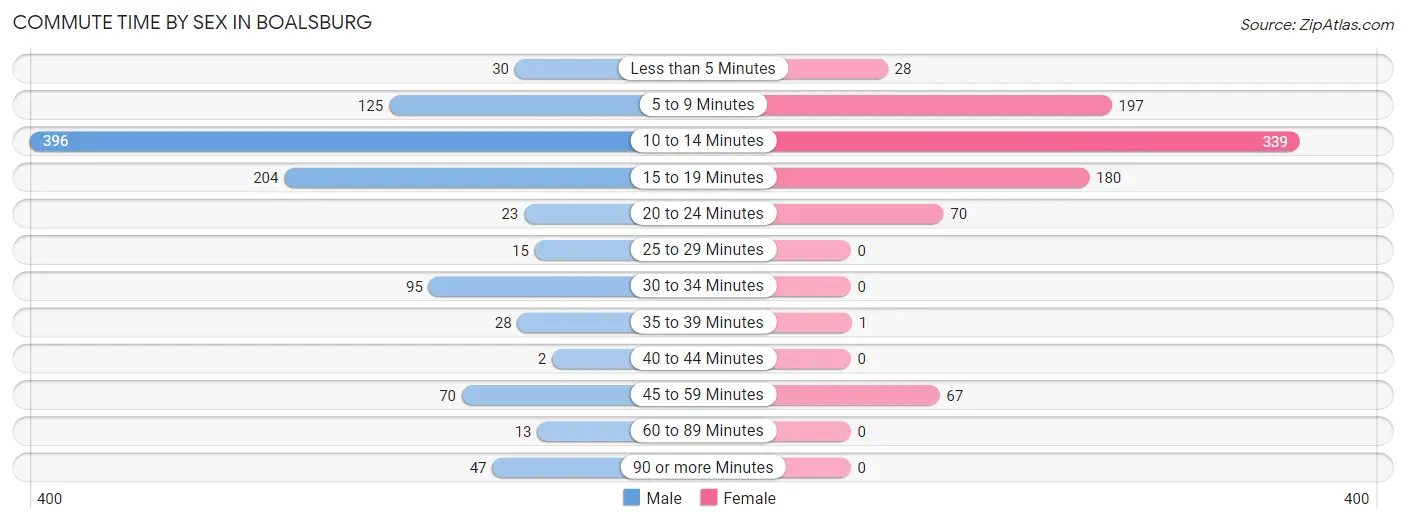
| Commute Time | Male | Female |
| Less than 5 Minutes | 30 (2.9%) | 28 (3.2%) |
| 5 to 9 Minutes | 125 (11.9%) | 197 (22.3%) |
| 10 to 14 Minutes | 396 (37.8%) | 339 (38.4%) |
| 15 to 19 Minutes | 204 (19.5%) | 180 (20.4%) |
| 20 to 24 Minutes | 23 (2.2%) | 70 (7.9%) |
| 25 to 29 Minutes | 15 (1.4%) | 0 (0.0%) |
| 30 to 34 Minutes | 95 (9.1%) | 0 (0.0%) |
| 35 to 39 Minutes | 28 (2.7%) | 1 (0.1%) |
| 40 to 44 Minutes | 2 (0.2%) | 0 (0.0%) |
| 45 to 59 Minutes | 70 (6.7%) | 67 (7.6%) |
| 60 to 89 Minutes | 13 (1.2%) | 0 (0.0%) |
| 90 or more Minutes | 47 (4.5%) | 0 (0.0%) |
Time of Departure to Work by Sex in Boalsburg
The most frequent times of departure to work in Boalsburg are 8:00 AM to 8:29 AM (406, 38.7%) for males and 7:30 AM to 7:59 AM (252, 28.6%) for females.
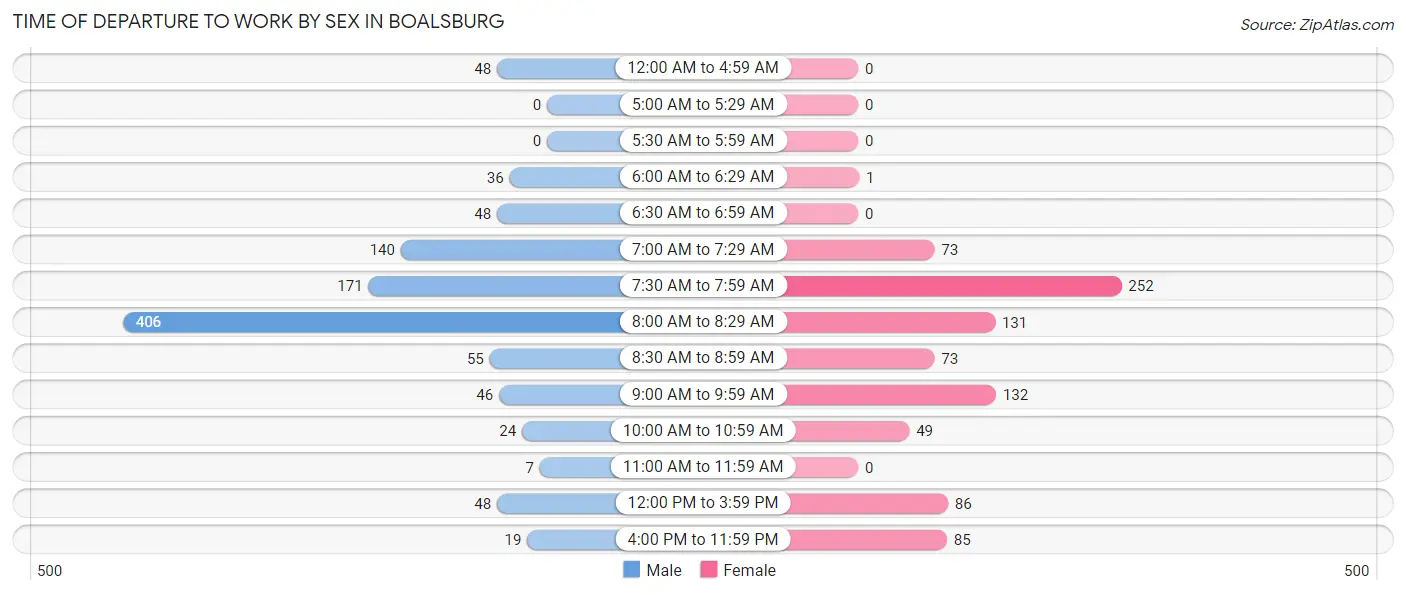
| Time of Departure | Male | Female |
| 12:00 AM to 4:59 AM | 48 (4.6%) | 0 (0.0%) |
| 5:00 AM to 5:29 AM | 0 (0.0%) | 0 (0.0%) |
| 5:30 AM to 5:59 AM | 0 (0.0%) | 0 (0.0%) |
| 6:00 AM to 6:29 AM | 36 (3.4%) | 1 (0.1%) |
| 6:30 AM to 6:59 AM | 48 (4.6%) | 0 (0.0%) |
| 7:00 AM to 7:29 AM | 140 (13.4%) | 73 (8.3%) |
| 7:30 AM to 7:59 AM | 171 (16.3%) | 252 (28.6%) |
| 8:00 AM to 8:29 AM | 406 (38.7%) | 131 (14.8%) |
| 8:30 AM to 8:59 AM | 55 (5.2%) | 73 (8.3%) |
| 9:00 AM to 9:59 AM | 46 (4.4%) | 132 (15.0%) |
| 10:00 AM to 10:59 AM | 24 (2.3%) | 49 (5.6%) |
| 11:00 AM to 11:59 AM | 7 (0.7%) | 0 (0.0%) |
| 12:00 PM to 3:59 PM | 48 (4.6%) | 86 (9.8%) |
| 4:00 PM to 11:59 PM | 19 (1.8%) | 85 (9.6%) |
| Total | 1,048 (100.0%) | 882 (100.0%) |
Housing Occupancy in Boalsburg
Occupancy by Ownership in Boalsburg
Of the total 1,791 dwellings in Boalsburg, owner-occupied units account for 1,492 (83.3%), while renter-occupied units make up 299 (16.7%).
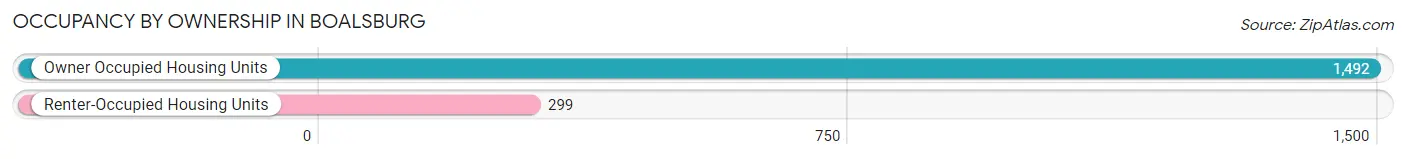
| Occupancy | # Housing Units | % Housing Units |
| Owner Occupied Housing Units | 1,492 | 83.3% |
| Renter-Occupied Housing Units | 299 | 16.7% |
| Total Occupied Housing Units | 1,791 | 100.0% |
Occupancy by Household Size in Boalsburg
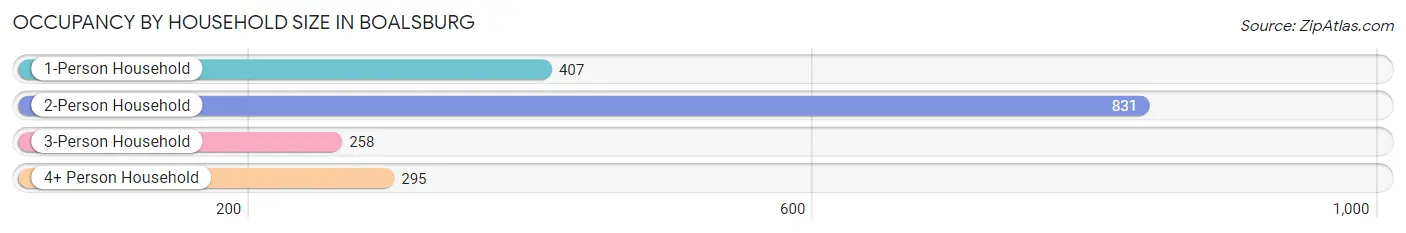
| Household Size | # Housing Units | % Housing Units |
| 1-Person Household | 407 | 22.7% |
| 2-Person Household | 831 | 46.4% |
| 3-Person Household | 258 | 14.4% |
| 4+ Person Household | 295 | 16.5% |
| Total Housing Units | 1,791 | 100.0% |
Occupancy by Ownership by Household Size in Boalsburg
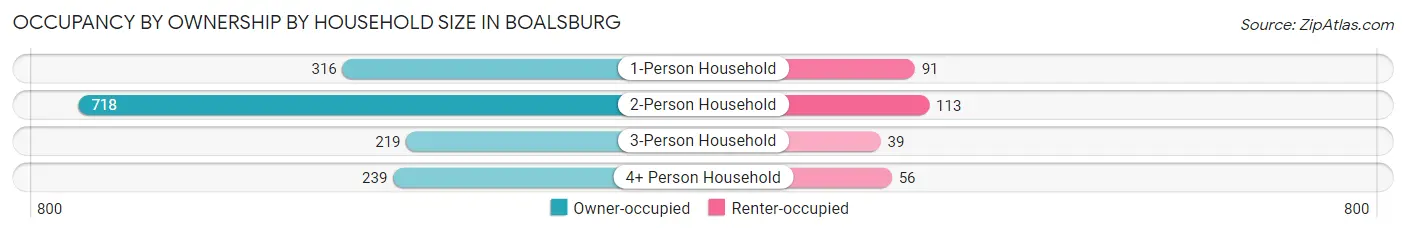
| Household Size | Owner-occupied | Renter-occupied |
| 1-Person Household | 316 (77.6%) | 91 (22.4%) |
| 2-Person Household | 718 (86.4%) | 113 (13.6%) |
| 3-Person Household | 219 (84.9%) | 39 (15.1%) |
| 4+ Person Household | 239 (81.0%) | 56 (19.0%) |
| Total Housing Units | 1,492 (83.3%) | 299 (16.7%) |
Occupancy by Educational Attainment in Boalsburg
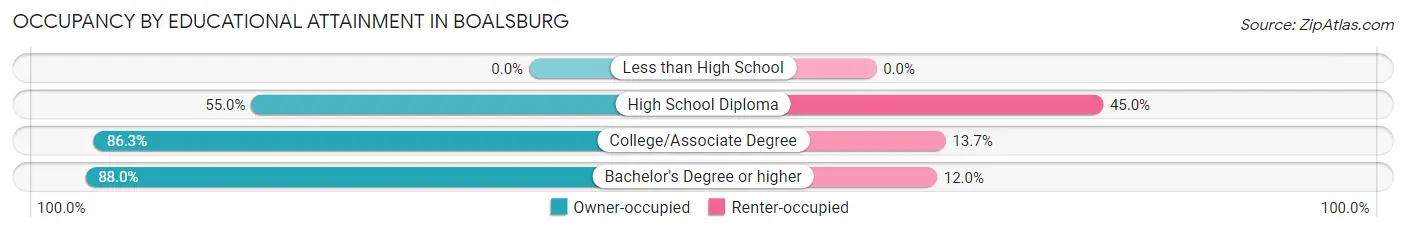
| Household Size | Owner-occupied | Renter-occupied |
| Less than High School | 0 (0.0%) | 0 (0.0%) |
| High School Diploma | 131 (55.0%) | 107 (45.0%) |
| College/Associate Degree | 270 (86.3%) | 43 (13.7%) |
| Bachelor's Degree or higher | 1,091 (88.0%) | 149 (12.0%) |
Occupancy by Age of Householder in Boalsburg
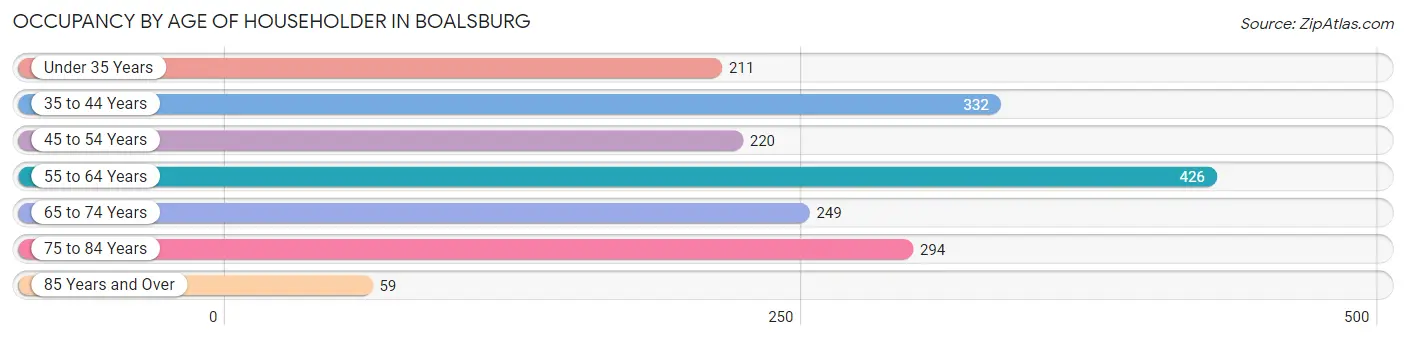
| Age Bracket | # Households | % Households |
| Under 35 Years | 211 | 11.8% |
| 35 to 44 Years | 332 | 18.5% |
| 45 to 54 Years | 220 | 12.3% |
| 55 to 64 Years | 426 | 23.8% |
| 65 to 74 Years | 249 | 13.9% |
| 75 to 84 Years | 294 | 16.4% |
| 85 Years and Over | 59 | 3.3% |
| Total | 1,791 | 100.0% |
Housing Finances in Boalsburg
Median Income by Occupancy in Boalsburg
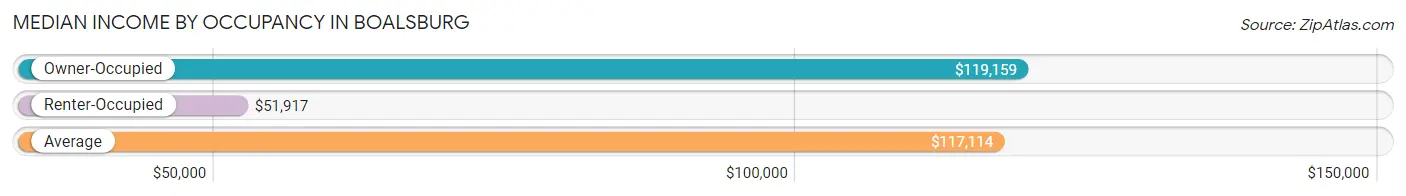
| Occupancy Type | # Households | Median Income |
| Owner-Occupied | 1,492 (83.3%) | $119,159 |
| Renter-Occupied | 299 (16.7%) | $51,917 |
| Average | 1,791 (100.0%) | $117,114 |
Occupancy by Householder Income Bracket in Boalsburg
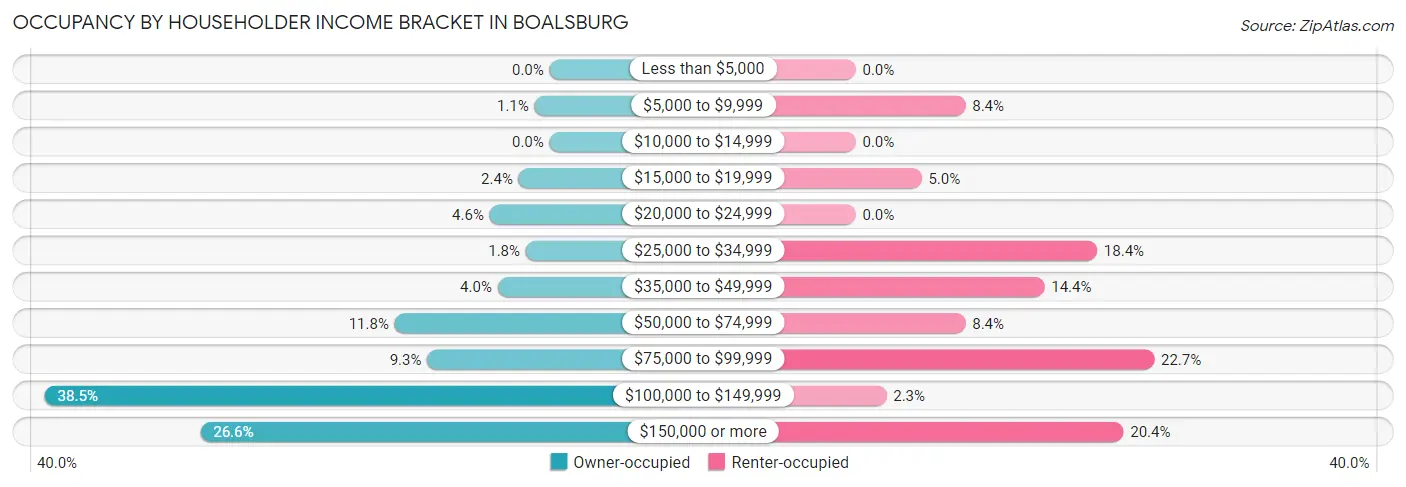
| Income Bracket | Owner-occupied | Renter-occupied |
| Less than $5,000 | 0 (0.0%) | 0 (0.0%) |
| $5,000 to $9,999 | 17 (1.1%) | 25 (8.4%) |
| $10,000 to $14,999 | 0 (0.0%) | 0 (0.0%) |
| $15,000 to $19,999 | 35 (2.4%) | 15 (5.0%) |
| $20,000 to $24,999 | 68 (4.6%) | 0 (0.0%) |
| $25,000 to $34,999 | 27 (1.8%) | 55 (18.4%) |
| $35,000 to $49,999 | 59 (4.0%) | 43 (14.4%) |
| $50,000 to $74,999 | 176 (11.8%) | 25 (8.4%) |
| $75,000 to $99,999 | 139 (9.3%) | 68 (22.7%) |
| $100,000 to $149,999 | 574 (38.5%) | 7 (2.3%) |
| $150,000 or more | 397 (26.6%) | 61 (20.4%) |
| Total | 1,492 (100.0%) | 299 (100.0%) |
Monthly Housing Cost Tiers in Boalsburg
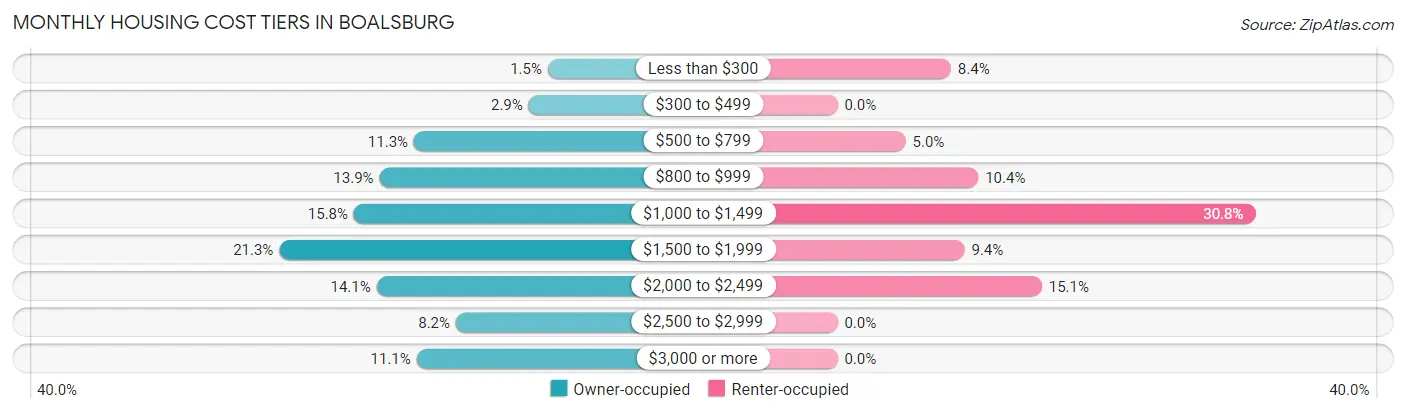
| Monthly Cost | Owner-occupied | Renter-occupied |
| Less than $300 | 22 (1.5%) | 25 (8.4%) |
| $300 to $499 | 43 (2.9%) | 0 (0.0%) |
| $500 to $799 | 169 (11.3%) | 15 (5.0%) |
| $800 to $999 | 207 (13.9%) | 31 (10.4%) |
| $1,000 to $1,499 | 235 (15.8%) | 92 (30.8%) |
| $1,500 to $1,999 | 317 (21.2%) | 28 (9.4%) |
| $2,000 to $2,499 | 210 (14.1%) | 45 (15.0%) |
| $2,500 to $2,999 | 123 (8.2%) | 0 (0.0%) |
| $3,000 or more | 166 (11.1%) | 0 (0.0%) |
| Total | 1,492 (100.0%) | 299 (100.0%) |
Physical Housing Characteristics in Boalsburg
Housing Structures in Boalsburg
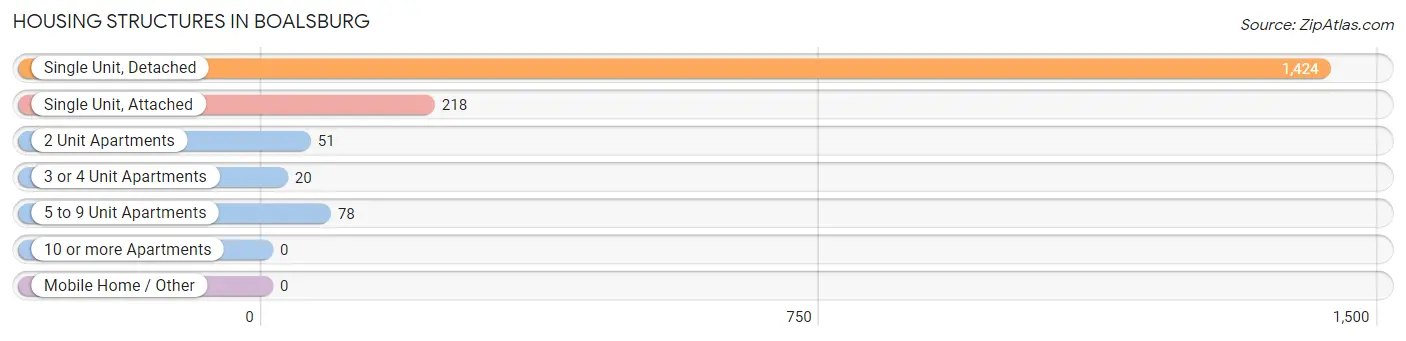
| Structure Type | # Housing Units | % Housing Units |
| Single Unit, Detached | 1,424 | 79.5% |
| Single Unit, Attached | 218 | 12.2% |
| 2 Unit Apartments | 51 | 2.9% |
| 3 or 4 Unit Apartments | 20 | 1.1% |
| 5 to 9 Unit Apartments | 78 | 4.4% |
| 10 or more Apartments | 0 | 0.0% |
| Mobile Home / Other | 0 | 0.0% |
| Total | 1,791 | 100.0% |
Housing Structures by Occupancy in Boalsburg
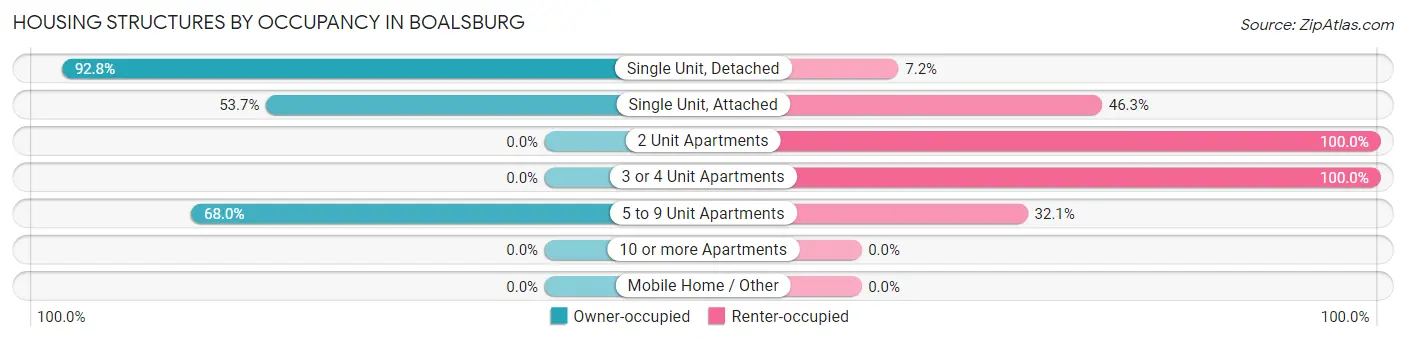
| Structure Type | Owner-occupied | Renter-occupied |
| Single Unit, Detached | 1,322 (92.8%) | 102 (7.2%) |
| Single Unit, Attached | 117 (53.7%) | 101 (46.3%) |
| 2 Unit Apartments | 0 (0.0%) | 51 (100.0%) |
| 3 or 4 Unit Apartments | 0 (0.0%) | 20 (100.0%) |
| 5 to 9 Unit Apartments | 53 (67.9%) | 25 (32.1%) |
| 10 or more Apartments | 0 (0.0%) | 0 (0.0%) |
| Mobile Home / Other | 0 (0.0%) | 0 (0.0%) |
| Total | 1,492 (83.3%) | 299 (16.7%) |
Housing Structures by Number of Rooms in Boalsburg
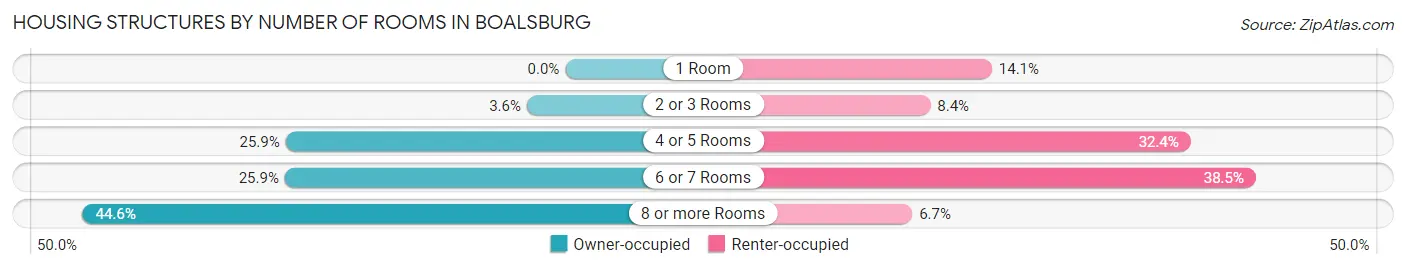
| Number of Rooms | Owner-occupied | Renter-occupied |
| 1 Room | 0 (0.0%) | 42 (14.1%) |
| 2 or 3 Rooms | 53 (3.5%) | 25 (8.4%) |
| 4 or 5 Rooms | 386 (25.9%) | 97 (32.4%) |
| 6 or 7 Rooms | 387 (25.9%) | 115 (38.5%) |
| 8 or more Rooms | 666 (44.6%) | 20 (6.7%) |
| Total | 1,492 (100.0%) | 299 (100.0%) |
Housing Structure by Heating Type in Boalsburg
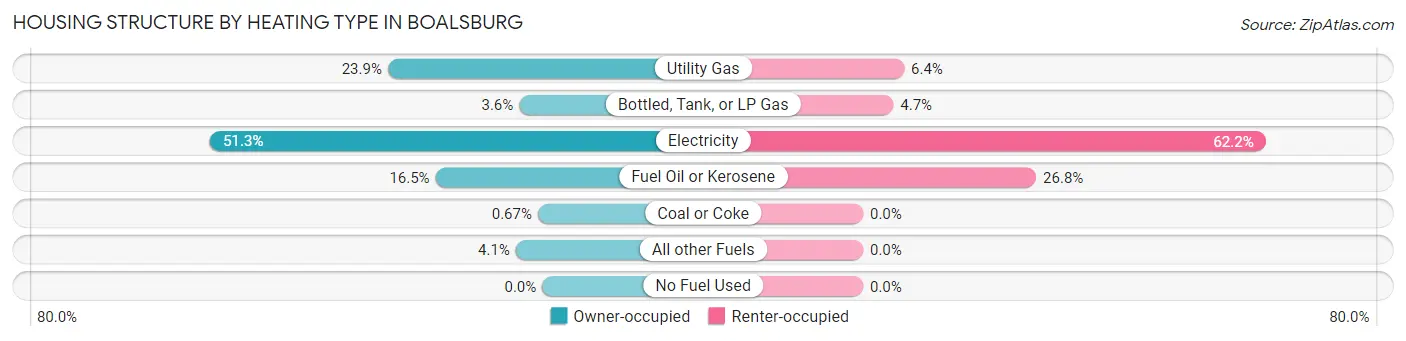
| Heating Type | Owner-occupied | Renter-occupied |
| Utility Gas | 356 (23.9%) | 19 (6.4%) |
| Bottled, Tank, or LP Gas | 53 (3.5%) | 14 (4.7%) |
| Electricity | 766 (51.3%) | 186 (62.2%) |
| Fuel Oil or Kerosene | 246 (16.5%) | 80 (26.8%) |
| Coal or Coke | 10 (0.7%) | 0 (0.0%) |
| All other Fuels | 61 (4.1%) | 0 (0.0%) |
| No Fuel Used | 0 (0.0%) | 0 (0.0%) |
| Total | 1,492 (100.0%) | 299 (100.0%) |
Household Vehicle Usage in Boalsburg
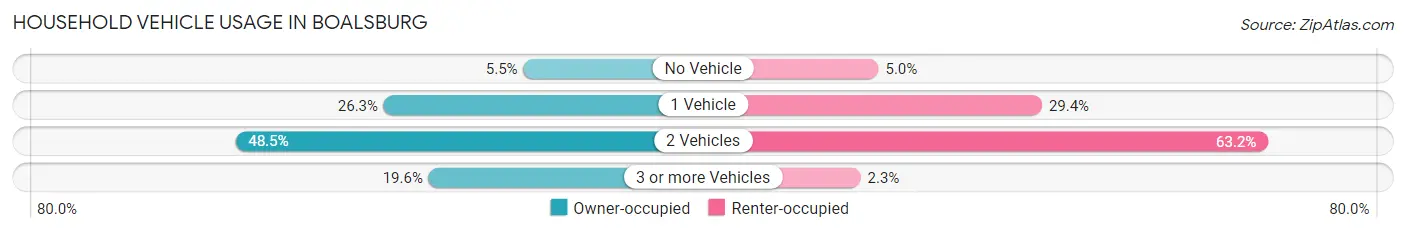
| Vehicles per Household | Owner-occupied | Renter-occupied |
| No Vehicle | 82 (5.5%) | 15 (5.0%) |
| 1 Vehicle | 393 (26.3%) | 88 (29.4%) |
| 2 Vehicles | 724 (48.5%) | 189 (63.2%) |
| 3 or more Vehicles | 293 (19.6%) | 7 (2.3%) |
| Total | 1,492 (100.0%) | 299 (100.0%) |
Real Estate & Mortgages in Boalsburg
Real Estate and Mortgage Overview in Boalsburg
| Characteristic | Without Mortgage | With Mortgage |
| Housing Units | 610 | 882 |
| Median Property Value | $461,100 | $361,000 |
| Median Household Income | $84,219 | $184 |
| Monthly Housing Costs | $967 | $148 |
| Real Estate Taxes | $5,657 | $0 |
Property Value by Mortgage Status in Boalsburg
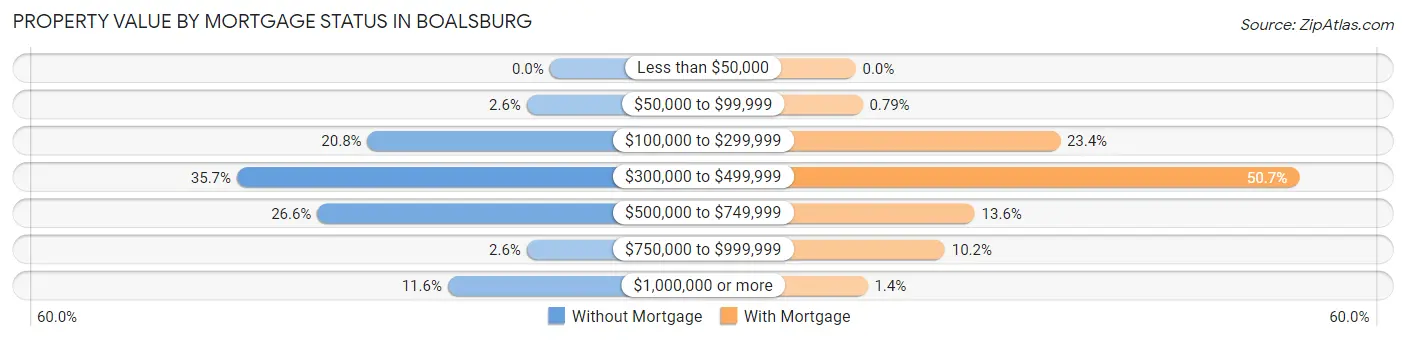
| Property Value | Without Mortgage | With Mortgage |
| Less than $50,000 | 0 (0.0%) | 0 (0.0%) |
| $50,000 to $99,999 | 16 (2.6%) | 7 (0.8%) |
| $100,000 to $299,999 | 127 (20.8%) | 206 (23.4%) |
| $300,000 to $499,999 | 218 (35.7%) | 447 (50.7%) |
| $500,000 to $749,999 | 162 (26.6%) | 120 (13.6%) |
| $750,000 to $999,999 | 16 (2.6%) | 90 (10.2%) |
| $1,000,000 or more | 71 (11.6%) | 12 (1.4%) |
| Total | 610 (100.0%) | 882 (100.0%) |
Household Income by Mortgage Status in Boalsburg
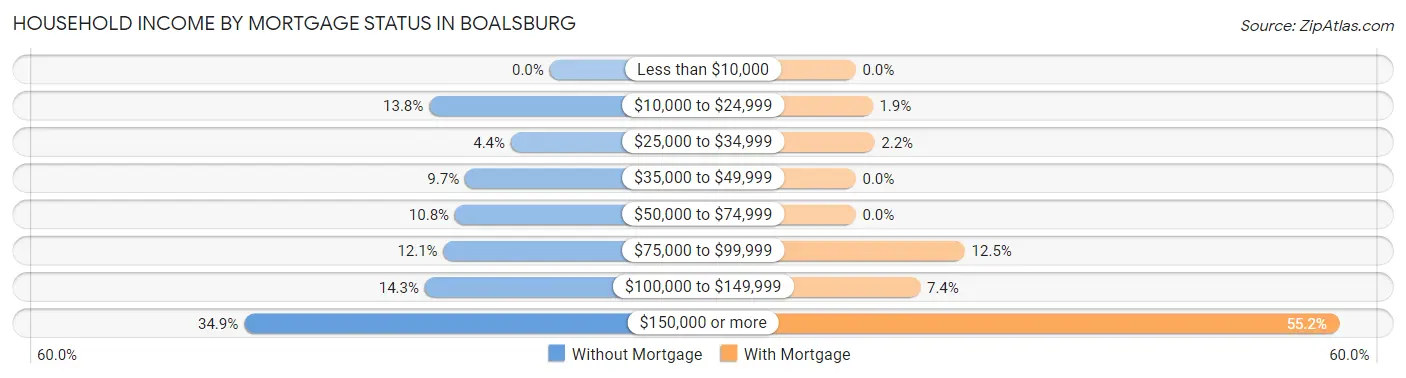
| Household Income | Without Mortgage | With Mortgage |
| Less than $10,000 | 0 (0.0%) | 0 (0.0%) |
| $10,000 to $24,999 | 84 (13.8%) | 17 (1.9%) |
| $25,000 to $34,999 | 27 (4.4%) | 19 (2.1%) |
| $35,000 to $49,999 | 59 (9.7%) | 0 (0.0%) |
| $50,000 to $74,999 | 66 (10.8%) | 0 (0.0%) |
| $75,000 to $99,999 | 74 (12.1%) | 110 (12.5%) |
| $100,000 to $149,999 | 87 (14.3%) | 65 (7.4%) |
| $150,000 or more | 213 (34.9%) | 487 (55.2%) |
| Total | 610 (100.0%) | 882 (100.0%) |
Property Value to Household Income Ratio in Boalsburg
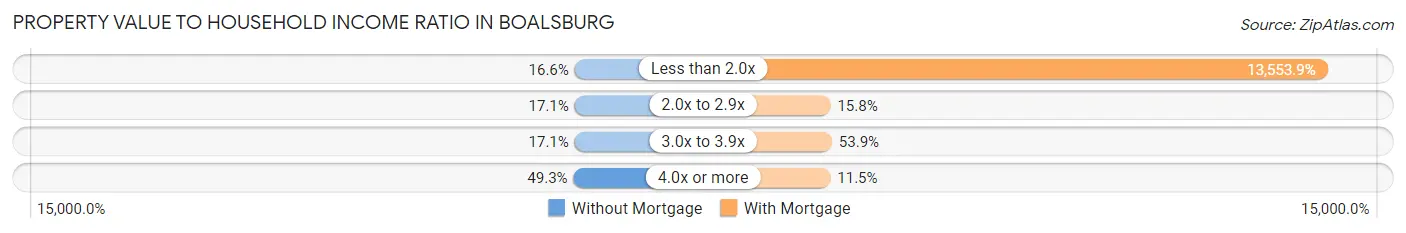
| Value-to-Income Ratio | Without Mortgage | With Mortgage |
| Less than 2.0x | 101 (16.6%) | 119,545 (13,553.8%) |
| 2.0x to 2.9x | 104 (17.1%) | 139 (15.8%) |
| 3.0x to 3.9x | 104 (17.1%) | 475 (53.8%) |
| 4.0x or more | 301 (49.3%) | 101 (11.5%) |
| Total | 610 (100.0%) | 882 (100.0%) |
Real Estate Taxes by Mortgage Status in Boalsburg
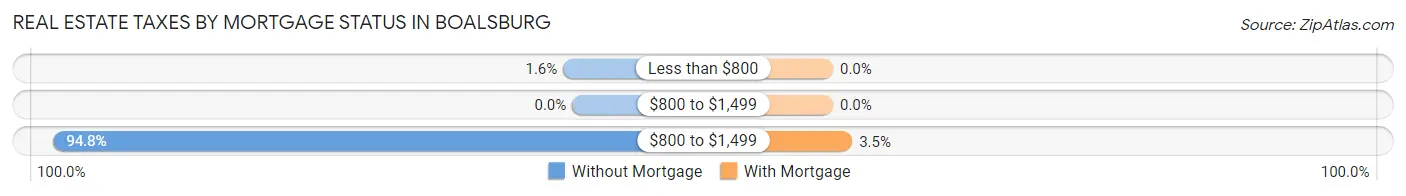
| Property Taxes | Without Mortgage | With Mortgage |
| Less than $800 | 10 (1.6%) | 0 (0.0%) |
| $800 to $1,499 | 0 (0.0%) | 0 (0.0%) |
| $800 to $1,499 | 578 (94.8%) | 31 (3.5%) |
| Total | 610 (100.0%) | 882 (100.0%) |
Health & Disability in Boalsburg
Health Insurance Coverage by Age in Boalsburg
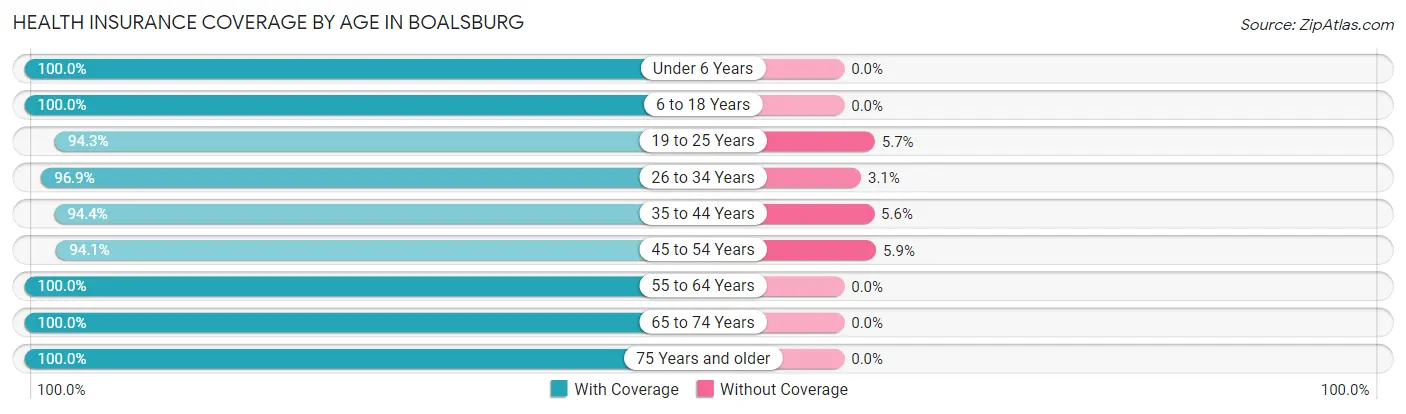
| Age Bracket | With Coverage | Without Coverage |
| Under 6 Years | 289 (100.0%) | 0 (0.0%) |
| 6 to 18 Years | 499 (100.0%) | 0 (0.0%) |
| 19 to 25 Years | 232 (94.3%) | 14 (5.7%) |
| 26 to 34 Years | 497 (96.9%) | 16 (3.1%) |
| 35 to 44 Years | 559 (94.4%) | 33 (5.6%) |
| 45 to 54 Years | 412 (94.1%) | 26 (5.9%) |
| 55 to 64 Years | 727 (100.0%) | 0 (0.0%) |
| 65 to 74 Years | 493 (100.0%) | 0 (0.0%) |
| 75 Years and older | 501 (100.0%) | 0 (0.0%) |
| Total | 4,209 (97.9%) | 89 (2.1%) |
Health Insurance Coverage by Citizenship Status in Boalsburg
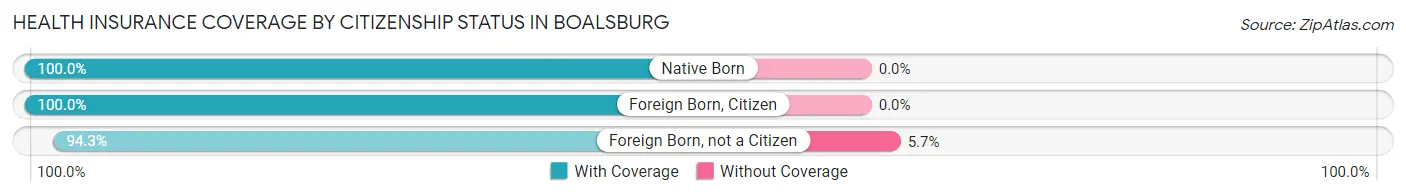
| Citizenship Status | With Coverage | Without Coverage |
| Native Born | 289 (100.0%) | 0 (0.0%) |
| Foreign Born, Citizen | 499 (100.0%) | 0 (0.0%) |
| Foreign Born, not a Citizen | 232 (94.3%) | 14 (5.7%) |
Health Insurance Coverage by Household Income in Boalsburg
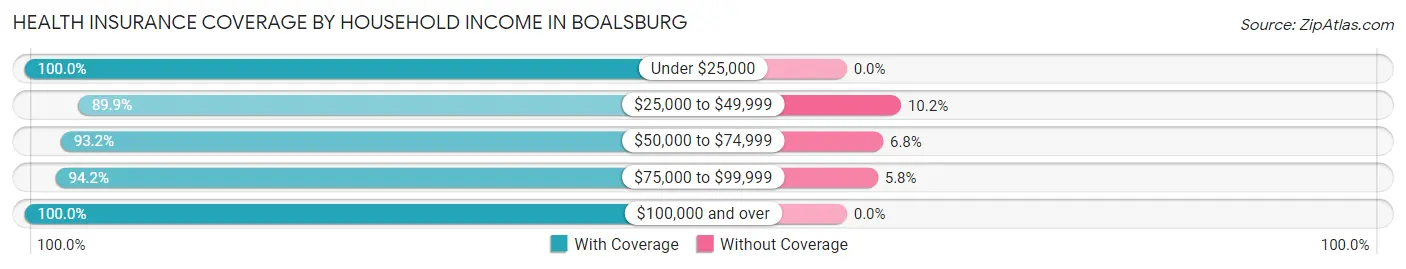
| Household Income | With Coverage | Without Coverage |
| Under $25,000 | 190 (100.0%) | 0 (0.0%) |
| $25,000 to $49,999 | 292 (89.8%) | 33 (10.2%) |
| $50,000 to $74,999 | 357 (93.2%) | 26 (6.8%) |
| $75,000 to $99,999 | 486 (94.2%) | 30 (5.8%) |
| $100,000 and over | 2,884 (100.0%) | 0 (0.0%) |
Public vs Private Health Insurance Coverage by Age in Boalsburg
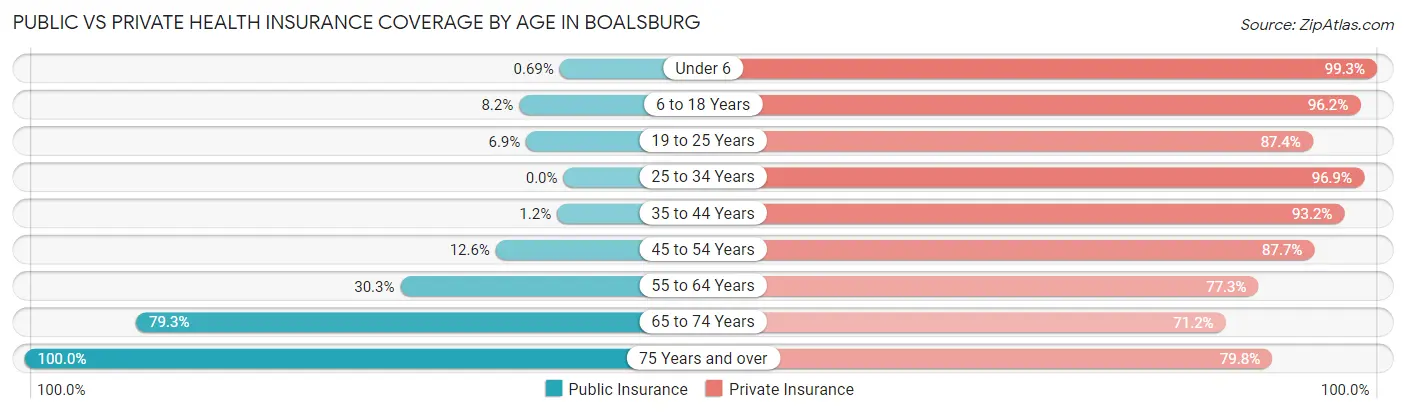
| Age Bracket | Public Insurance | Private Insurance |
| Under 6 | 2 (0.7%) | 287 (99.3%) |
| 6 to 18 Years | 41 (8.2%) | 480 (96.2%) |
| 19 to 25 Years | 17 (6.9%) | 215 (87.4%) |
| 25 to 34 Years | 0 (0.0%) | 497 (96.9%) |
| 35 to 44 Years | 7 (1.2%) | 552 (93.2%) |
| 45 to 54 Years | 55 (12.6%) | 384 (87.7%) |
| 55 to 64 Years | 220 (30.3%) | 562 (77.3%) |
| 65 to 74 Years | 391 (79.3%) | 351 (71.2%) |
| 75 Years and over | 501 (100.0%) | 400 (79.8%) |
| Total | 1,234 (28.7%) | 3,728 (86.7%) |
Disability Status by Sex by Age in Boalsburg
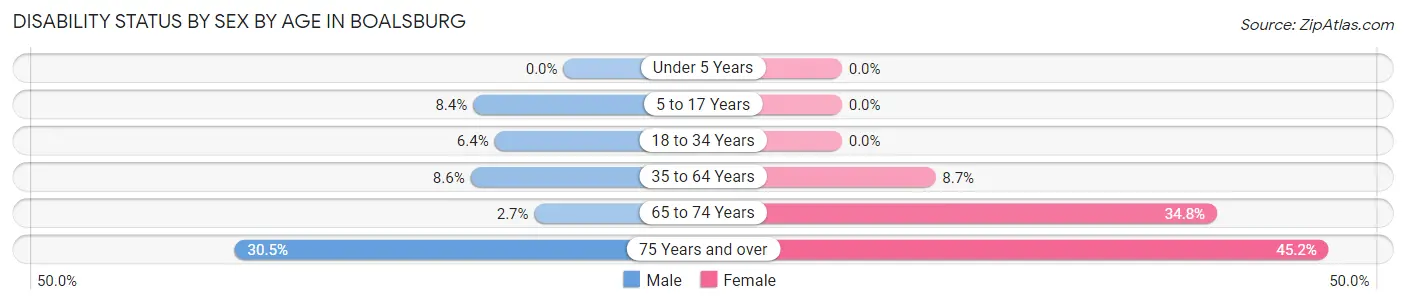
| Age Bracket | Male | Female |
| Under 5 Years | 0 (0.0%) | 0 (0.0%) |
| 5 to 17 Years | 33 (8.4%) | 0 (0.0%) |
| 18 to 34 Years | 23 (6.4%) | 0 (0.0%) |
| 35 to 64 Years | 72 (8.6%) | 80 (8.7%) |
| 65 to 74 Years | 6 (2.7%) | 94 (34.8%) |
| 75 Years and over | 61 (30.5%) | 136 (45.2%) |
Disability Class by Sex by Age in Boalsburg
Disability Class: Hearing Difficulty
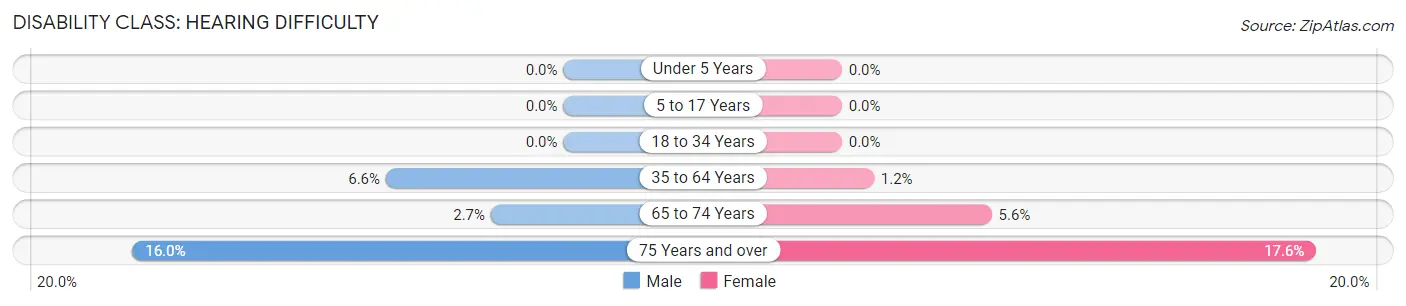
| Age Bracket | Male | Female |
| Under 5 Years | 0 (0.0%) | 0 (0.0%) |
| 5 to 17 Years | 0 (0.0%) | 0 (0.0%) |
| 18 to 34 Years | 0 (0.0%) | 0 (0.0%) |
| 35 to 64 Years | 55 (6.6%) | 11 (1.2%) |
| 65 to 74 Years | 6 (2.7%) | 15 (5.6%) |
| 75 Years and over | 32 (16.0%) | 53 (17.6%) |
Disability Class: Vision Difficulty
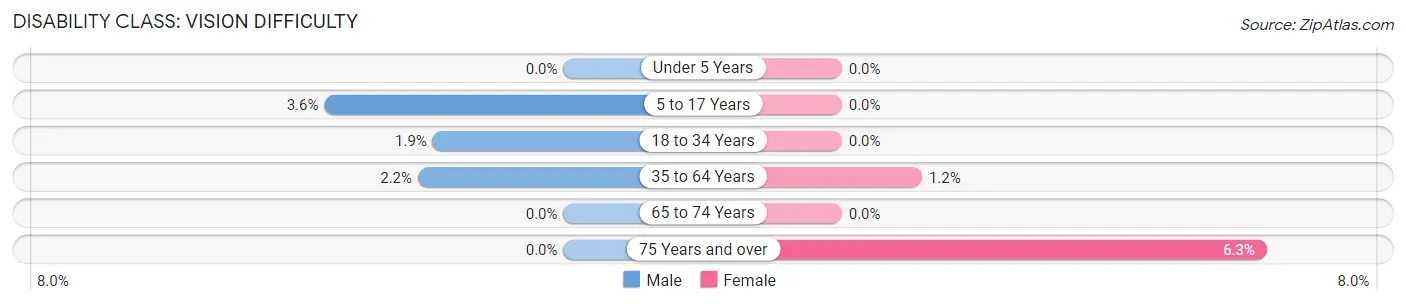
| Age Bracket | Male | Female |
| Under 5 Years | 0 (0.0%) | 0 (0.0%) |
| 5 to 17 Years | 14 (3.5%) | 0 (0.0%) |
| 18 to 34 Years | 7 (1.9%) | 0 (0.0%) |
| 35 to 64 Years | 18 (2.2%) | 11 (1.2%) |
| 65 to 74 Years | 0 (0.0%) | 0 (0.0%) |
| 75 Years and over | 0 (0.0%) | 19 (6.3%) |
Disability Class: Cognitive Difficulty
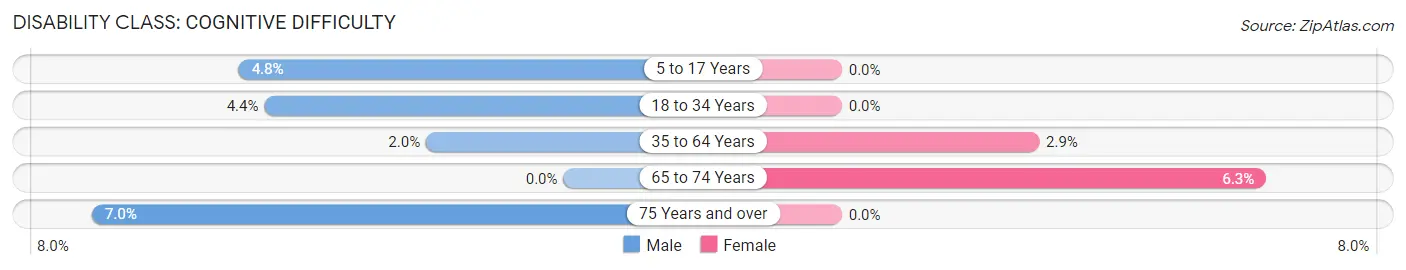
| Age Bracket | Male | Female |
| 5 to 17 Years | 19 (4.8%) | 0 (0.0%) |
| 18 to 34 Years | 16 (4.4%) | 0 (0.0%) |
| 35 to 64 Years | 17 (2.0%) | 27 (2.9%) |
| 65 to 74 Years | 0 (0.0%) | 17 (6.3%) |
| 75 Years and over | 14 (7.0%) | 0 (0.0%) |
Disability Class: Ambulatory Difficulty
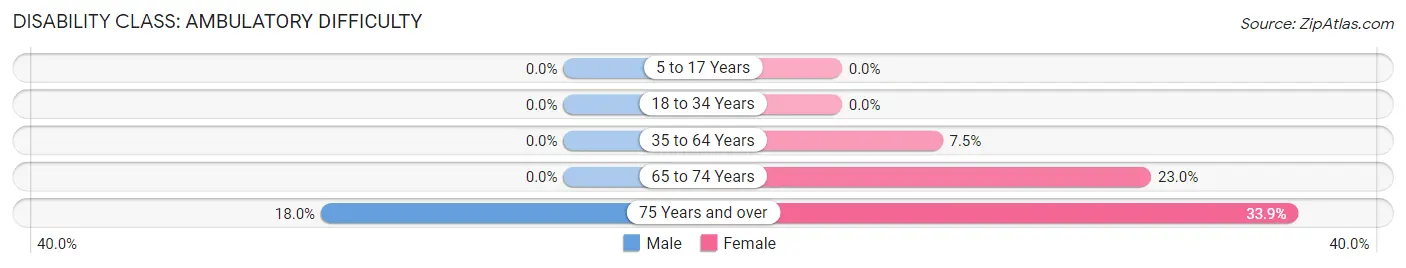
| Age Bracket | Male | Female |
| 5 to 17 Years | 0 (0.0%) | 0 (0.0%) |
| 18 to 34 Years | 0 (0.0%) | 0 (0.0%) |
| 35 to 64 Years | 0 (0.0%) | 69 (7.5%) |
| 65 to 74 Years | 0 (0.0%) | 62 (23.0%) |
| 75 Years and over | 36 (18.0%) | 102 (33.9%) |
Disability Class: Self-Care Difficulty
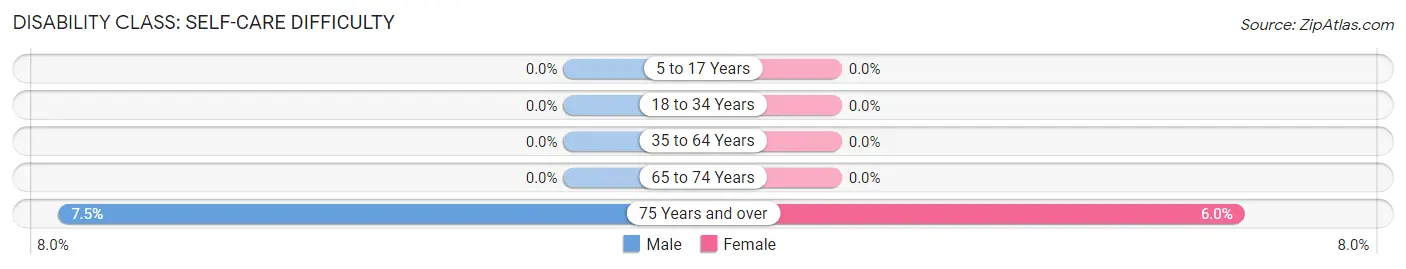
| Age Bracket | Male | Female |
| 5 to 17 Years | 0 (0.0%) | 0 (0.0%) |
| 18 to 34 Years | 0 (0.0%) | 0 (0.0%) |
| 35 to 64 Years | 0 (0.0%) | 0 (0.0%) |
| 65 to 74 Years | 0 (0.0%) | 0 (0.0%) |
| 75 Years and over | 15 (7.5%) | 18 (6.0%) |
Technology Access in Boalsburg
Computing Device Access in Boalsburg
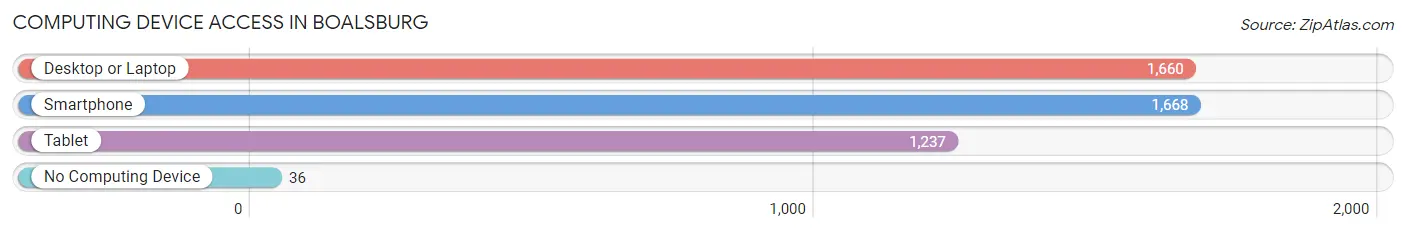
| Device Type | # Households | % Households |
| Desktop or Laptop | 1,660 | 92.7% |
| Smartphone | 1,668 | 93.1% |
| Tablet | 1,237 | 69.1% |
| No Computing Device | 36 | 2.0% |
| Total | 1,791 | 100.0% |
Internet Access in Boalsburg
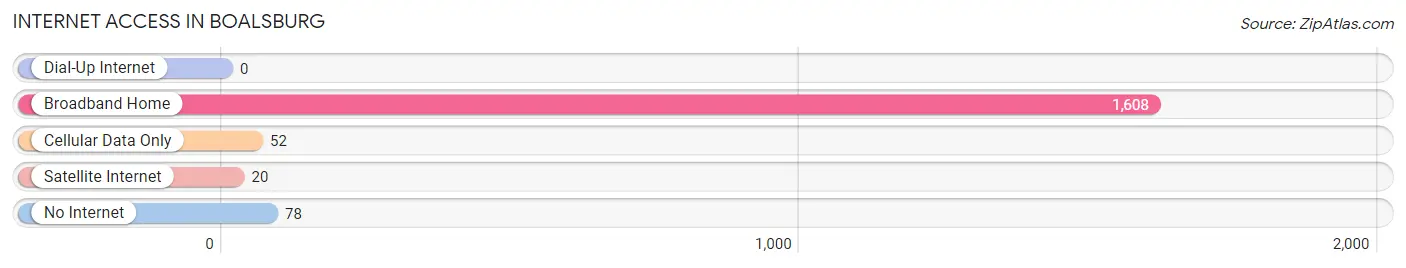
| Internet Type | # Households | % Households |
| Dial-Up Internet | 0 | 0.0% |
| Broadband Home | 1,608 | 89.8% |
| Cellular Data Only | 52 | 2.9% |
| Satellite Internet | 20 | 1.1% |
| No Internet | 78 | 4.4% |
| Total | 1,791 | 100.0% |
Boalsburg Summary
Boalsburg, Pennsylvania is a small village located in Centre County, Pennsylvania. It is situated in the Nittany Valley, approximately five miles east of State College and the Penn State University campus. Boalsburg is known for its historical significance, its picturesque landscape, and its vibrant economy.
History
Boalsburg was founded in 1793 by Colonel Thomas Boal, a Revolutionary War veteran who had served under General George Washington. Boal purchased a large tract of land in the Nittany Valley and built a log cabin on the site. He named the settlement Boalsburg in honor of his family.
The village grew slowly over the next several decades, and by the mid-1800s, it had become a thriving community. Boalsburg was home to a variety of businesses, including a blacksmith shop, a general store, a grist mill, and a sawmill. The village also had a post office, a school, and several churches.
In 1864, Boalsburg was the site of the first Memorial Day celebration in the United States. The event was organized by local women to honor the soldiers who had died in the Civil War. The tradition of honoring fallen soldiers on Memorial Day continues to this day.
Geography
Boalsburg is located in the Nittany Valley, a region of rolling hills and lush farmland. The village is situated at the intersection of two major roads, Route 45 and Route 322. Boalsburg is surrounded by the boroughs of State College and Bellefonte, as well as the townships of College, Harris, and Ferguson.
The village is situated at an elevation of 1,068 feet above sea level. The climate is humid continental, with cold winters and warm summers. The average annual temperature is 48°F, and the average annual precipitation is 40 inches.
Economy
Boalsburg has a vibrant economy that is largely driven by tourism. The village is home to several popular attractions, including the Boal Mansion and Museum, the Pennsylvania Military Museum, and the Boalsburg Heritage Museum. The village also hosts a variety of annual events, such as the Boalsburg Craft Fair and the Boalsburg Music Festival.
In addition to tourism, Boalsburg is home to several businesses, including restaurants, retail stores, and professional services. The village is also home to several technology companies, including the software development firm, BoalTech.
Demographics
As of the 2010 census, Boalsburg had a population of 1,788. The racial makeup of the village was 94.3% White, 2.2% African American, 0.3% Native American, 1.2% Asian, 0.1% Pacific Islander, 0.7% from other races, and 1.2% from two or more races. Hispanic or Latino of any race were 2.2% of the population.
Boalsburg is a highly educated community, with nearly 90% of the population having at least a high school diploma and nearly 40% having a bachelor's degree or higher. The median household income is $63,000, and the median home value is $250,000.
Boalsburg is a small but vibrant village with a rich history and a bright future. The village is home to a variety of attractions, businesses, and residents, and it is a great place to live, work, and play.
Common Questions
What is Per Capita Income in Boalsburg?
Per Capita income in Boalsburg is $56,781.
What is the Median Family Income in Boalsburg?
Median Family Income in Boalsburg is $120,589.
What is the Median Household income in Boalsburg?
Median Household Income in Boalsburg is $117,114.
What is Income or Wage Gap in Boalsburg?
Income or Wage Gap in Boalsburg is 58.7%.
Women in Boalsburg earn 41.3 cents for every dollar earned by a man.
What is Inequality or Gini Index in Boalsburg?
Inequality or Gini Index in Boalsburg is 0.42.
What is the Total Population of Boalsburg?
Total Population of Boalsburg is 4,298.
What is the Total Male Population of Boalsburg?
Total Male Population of Boalsburg is 2,126.
What is the Total Female Population of Boalsburg?
Total Female Population of Boalsburg is 2,172.
What is the Ratio of Males per 100 Females in Boalsburg?
There are 97.88 Males per 100 Females in Boalsburg.
What is the Ratio of Females per 100 Males in Boalsburg?
There are 102.16 Females per 100 Males in Boalsburg.
What is the Median Population Age in Boalsburg?
Median Population Age in Boalsburg is 45.1 Years.
What is the Average Family Size in Boalsburg
Average Family Size in Boalsburg is 2.8 People.
What is the Average Household Size in Boalsburg
Average Household Size in Boalsburg is 2.4 People.
How Large is the Labor Force in Boalsburg?
There are 2,340 People in the Labor Forcein in Boalsburg.
What is the Percentage of People in the Labor Force in Boalsburg?
66.2% of People are in the Labor Force in Boalsburg.
What is the Unemployment Rate in Boalsburg?
Unemployment Rate in Boalsburg is 4.1%.