Middleburg Heights, OH Map & Demographics
Middleburg Heights Map
Middleburg Heights Overview
$41,198
PER CAPITA INCOME
$93,514
AVG FAMILY INCOME
$74,109
AVG HOUSEHOLD INCOME
24.0%
WAGE / INCOME GAP [ % ]
76.0¢/ $1
WAGE / INCOME GAP [ $ ]
$6,535
FAMILY INCOME DEFICIT
0.36
INEQUALITY / GINI INDEX
15,918
TOTAL POPULATION
7,911
MALE POPULATION
8,007
FEMALE POPULATION
98.80
MALES / 100 FEMALES
101.21
FEMALES / 100 MALES
47.9
MEDIAN AGE
2.9
AVG FAMILY SIZE
2.1
AVG HOUSEHOLD SIZE
8,065
LABOR FORCE [ PEOPLE ]
59.4%
PERCENT IN LABOR FORCE
2.0%
UNEMPLOYMENT RATE
Income in Middleburg Heights
Income Overview in Middleburg Heights
Per Capita Income in Middleburg Heights is $41,198, while median incomes of families and households are $93,514 and $74,109 respectively.
| Characteristic | Number | Measure |
| Per Capita Income | 15,918 | $41,198 |
| Median Family Income | 3,964 | $93,514 |
| Mean Family Income | 3,964 | $109,184 |
| Median Household Income | 7,474 | $74,109 |
| Mean Household Income | 7,474 | $86,109 |
| Income Deficit | 3,964 | $6,535 |
| Wage / Income Gap (%) | 15,918 | 23.98% |
| Wage / Income Gap ($) | 15,918 | 76.02¢ per $1 |
| Gini / Inequality Index | 15,918 | 0.36 |
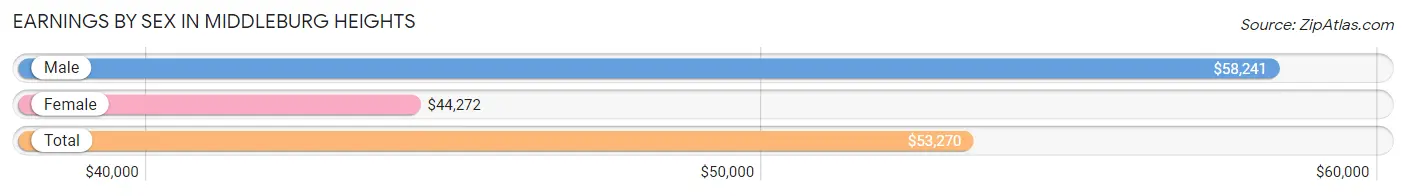
Earnings by Sex in Middleburg Heights
Average Earnings in Middleburg Heights are $53,270, $58,241 for men and $44,272 for women, a difference of 24.0%.
| Sex | Number | Average Earnings |
| Male | 4,672 (55.2%) | $58,241 |
| Female | 3,787 (44.8%) | $44,272 |
| Total | 8,459 (100.0%) | $53,270 |
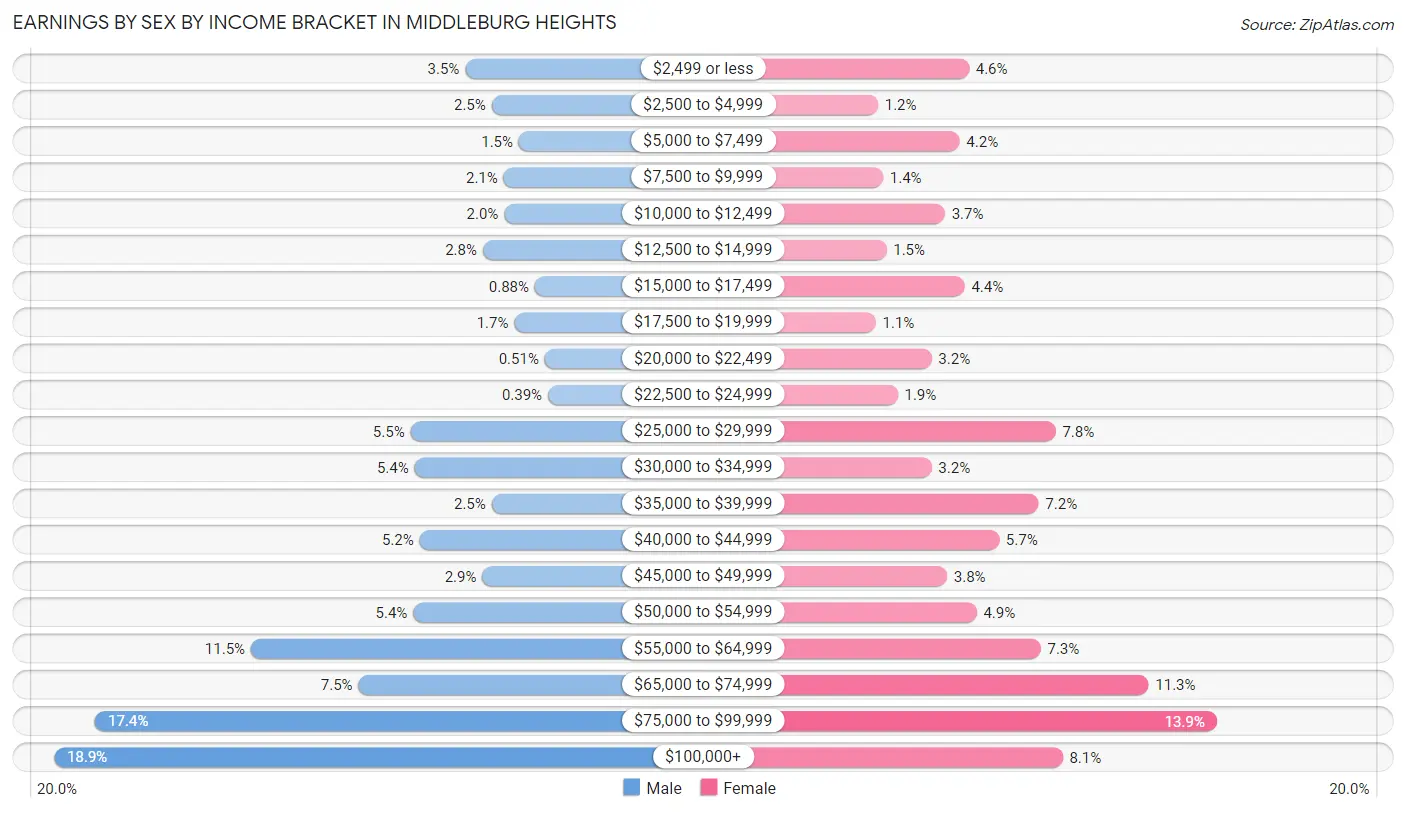
Earnings by Sex by Income Bracket in Middleburg Heights
The most common earnings brackets in Middleburg Heights are $100,000+ for men (883 | 18.9%) and $75,000 to $99,999 for women (525 | 13.9%).
| Income | Male | Female |
| $2,499 or less | 163 (3.5%) | 173 (4.6%) |
| $2,500 to $4,999 | 117 (2.5%) | 44 (1.2%) |
| $5,000 to $7,499 | 69 (1.5%) | 160 (4.2%) |
| $7,500 to $9,999 | 96 (2.1%) | 51 (1.3%) |
| $10,000 to $12,499 | 95 (2.0%) | 139 (3.7%) |
| $12,500 to $14,999 | 132 (2.8%) | 56 (1.5%) |
| $15,000 to $17,499 | 41 (0.9%) | 167 (4.4%) |
| $17,500 to $19,999 | 77 (1.7%) | 41 (1.1%) |
| $20,000 to $22,499 | 24 (0.5%) | 120 (3.2%) |
| $22,500 to $24,999 | 18 (0.4%) | 72 (1.9%) |
| $25,000 to $29,999 | 259 (5.5%) | 296 (7.8%) |
| $30,000 to $34,999 | 252 (5.4%) | 120 (3.2%) |
| $35,000 to $39,999 | 117 (2.5%) | 272 (7.2%) |
| $40,000 to $44,999 | 243 (5.2%) | 216 (5.7%) |
| $45,000 to $49,999 | 133 (2.9%) | 142 (3.7%) |
| $50,000 to $54,999 | 254 (5.4%) | 184 (4.9%) |
| $55,000 to $64,999 | 538 (11.5%) | 275 (7.3%) |
| $65,000 to $74,999 | 350 (7.5%) | 428 (11.3%) |
| $75,000 to $99,999 | 811 (17.4%) | 525 (13.9%) |
| $100,000+ | 883 (18.9%) | 306 (8.1%) |
| Total | 4,672 (100.0%) | 3,787 (100.0%) |
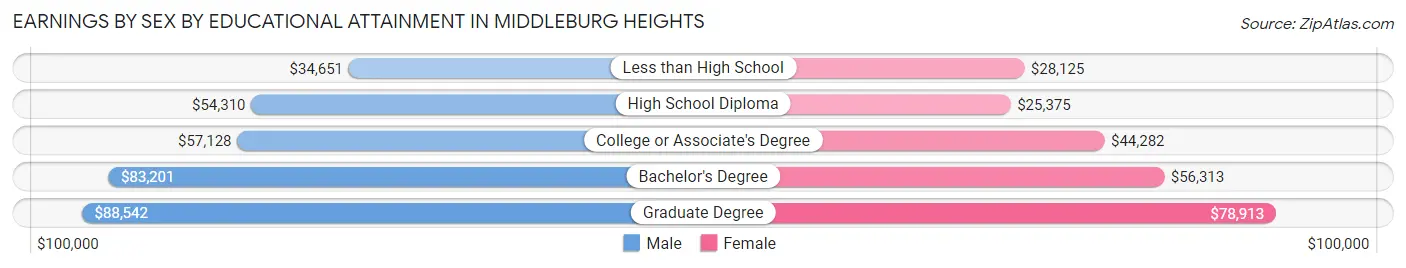
Earnings by Sex by Educational Attainment in Middleburg Heights
Average earnings in Middleburg Heights are $63,750 for men and $49,655 for women, a difference of 22.1%. Men with an educational attainment of graduate degree enjoy the highest average annual earnings of $88,542, while those with less than high school education earn the least with $34,651. Women with an educational attainment of graduate degree earn the most with the average annual earnings of $78,913, while those with high school diploma education have the smallest earnings of $25,375.
| Educational Attainment | Male Income | Female Income |
| Less than High School | $34,651 | $28,125 |
| High School Diploma | $54,310 | $25,375 |
| College or Associate's Degree | $57,128 | $44,282 |
| Bachelor's Degree | $83,201 | $56,313 |
| Graduate Degree | $88,542 | $78,913 |
| Total | $63,750 | $49,655 |
Family Income in Middleburg Heights
Family Income Brackets in Middleburg Heights
According to the Middleburg Heights family income data, there are 1,003 families falling into the $100,000 to $149,999 income range, which is the most common income bracket and makes up 25.3% of all families. Conversely, the $10,000 to $14,999 income bracket is the least frequent group with only 20 families (0.5%) belonging to this category.
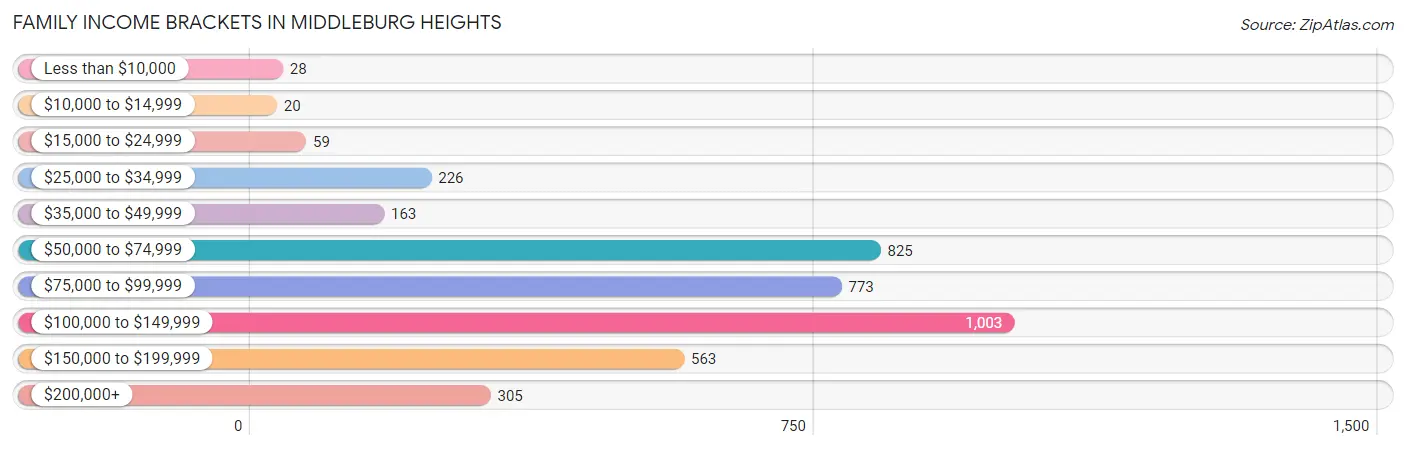
| Income Bracket | # Families | % Families |
| Less than $10,000 | 28 | 0.7% |
| $10,000 to $14,999 | 20 | 0.5% |
| $15,000 to $24,999 | 59 | 1.5% |
| $25,000 to $34,999 | 226 | 5.7% |
| $35,000 to $49,999 | 163 | 4.1% |
| $50,000 to $74,999 | 825 | 20.8% |
| $75,000 to $99,999 | 773 | 19.5% |
| $100,000 to $149,999 | 1,003 | 25.3% |
| $150,000 to $199,999 | 563 | 14.2% |
| $200,000+ | 305 | 7.7% |
Family Income by Famaliy Size in Middleburg Heights
6-person families (72 | 1.8%) account for the highest median family income in Middleburg Heights with $146,923 per family, while 2-person families (1,987 | 50.1%) have the highest median income of $40,284 per family member.
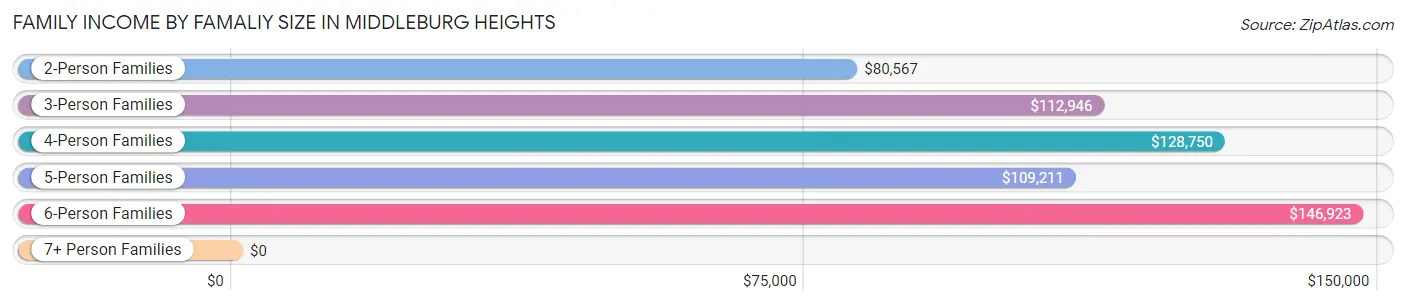
| Income Bracket | # Families | Median Income |
| 2-Person Families | 1,987 (50.1%) | $80,567 |
| 3-Person Families | 995 (25.1%) | $112,946 |
| 4-Person Families | 696 (17.6%) | $128,750 |
| 5-Person Families | 196 (4.9%) | $109,211 |
| 6-Person Families | 72 (1.8%) | $146,923 |
| 7+ Person Families | 18 (0.4%) | $0 |
| Total | 3,964 (100.0%) | $93,514 |
Family Income by Number of Earners in Middleburg Heights
The median family income in Middleburg Heights is $93,514, with families comprising 3+ earners (483) having the highest median family income of $153,698, while families with no earners (810) have the lowest median family income of $67,927, accounting for 12.2% and 20.4% of families, respectively.
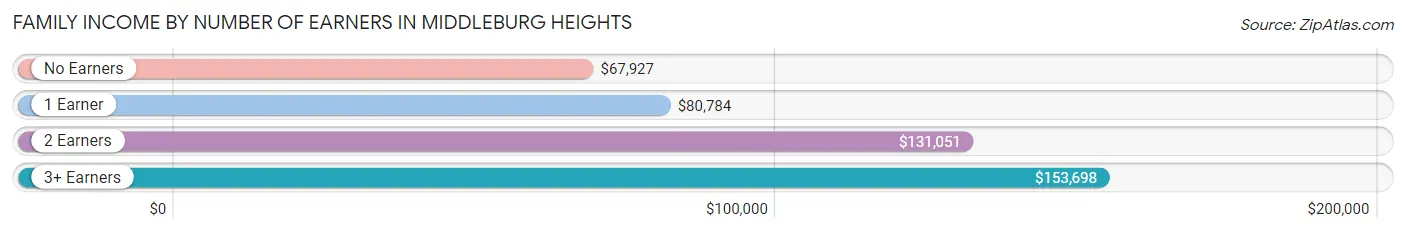
| Number of Earners | # Families | Median Income |
| No Earners | 810 (20.4%) | $67,927 |
| 1 Earner | 1,108 (28.0%) | $80,784 |
| 2 Earners | 1,563 (39.4%) | $131,051 |
| 3+ Earners | 483 (12.2%) | $153,698 |
| Total | 3,964 (100.0%) | $93,514 |
Household Income in Middleburg Heights
Household Income Brackets in Middleburg Heights
With 1,607 households falling in the category, the $50,000 to $74,999 income range is the most frequent in Middleburg Heights, accounting for 21.5% of all households. In contrast, only 142 households (1.9%) fall into the less than $10,000 income bracket, making it the least populous group.
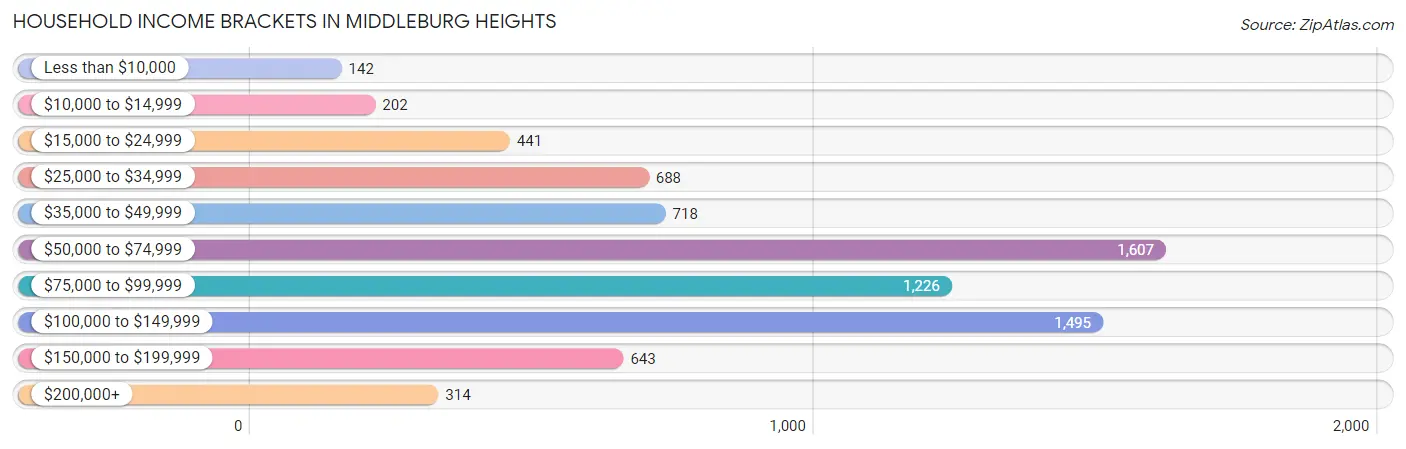
| Income Bracket | # Households | % Households |
| Less than $10,000 | 142 | 1.9% |
| $10,000 to $14,999 | 202 | 2.7% |
| $15,000 to $24,999 | 441 | 5.9% |
| $25,000 to $34,999 | 688 | 9.2% |
| $35,000 to $49,999 | 718 | 9.6% |
| $50,000 to $74,999 | 1,607 | 21.5% |
| $75,000 to $99,999 | 1,226 | 16.4% |
| $100,000 to $149,999 | 1,495 | 20.0% |
| $150,000 to $199,999 | 643 | 8.6% |
| $200,000+ | 314 | 4.2% |
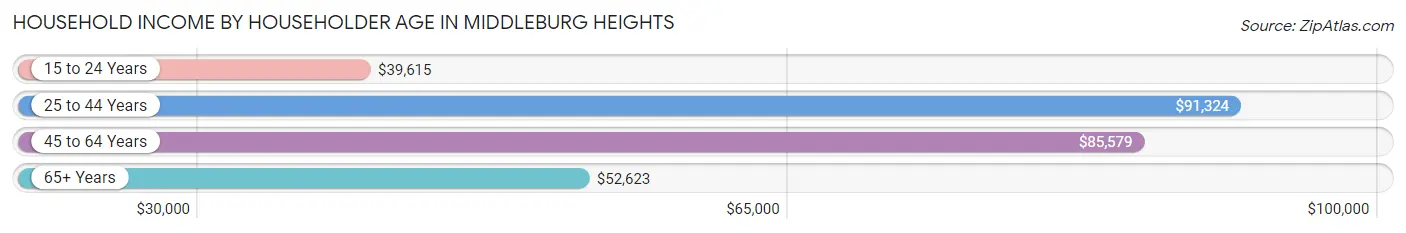
Household Income by Householder Age in Middleburg Heights
The median household income in Middleburg Heights is $74,109, with the highest median household income of $91,324 found in the 25 to 44 years age bracket for the primary householder. A total of 1,992 households (26.7%) fall into this category. Meanwhile, the 15 to 24 years age bracket for the primary householder has the lowest median household income of $39,615, with 80 households (1.1%) in this group.
| Income Bracket | # Households | Median Income |
| 15 to 24 Years | 80 (1.1%) | $39,615 |
| 25 to 44 Years | 1,992 (26.7%) | $91,324 |
| 45 to 64 Years | 2,771 (37.1%) | $85,579 |
| 65+ Years | 2,631 (35.2%) | $52,623 |
| Total | 7,474 (100.0%) | $74,109 |
Poverty in Middleburg Heights
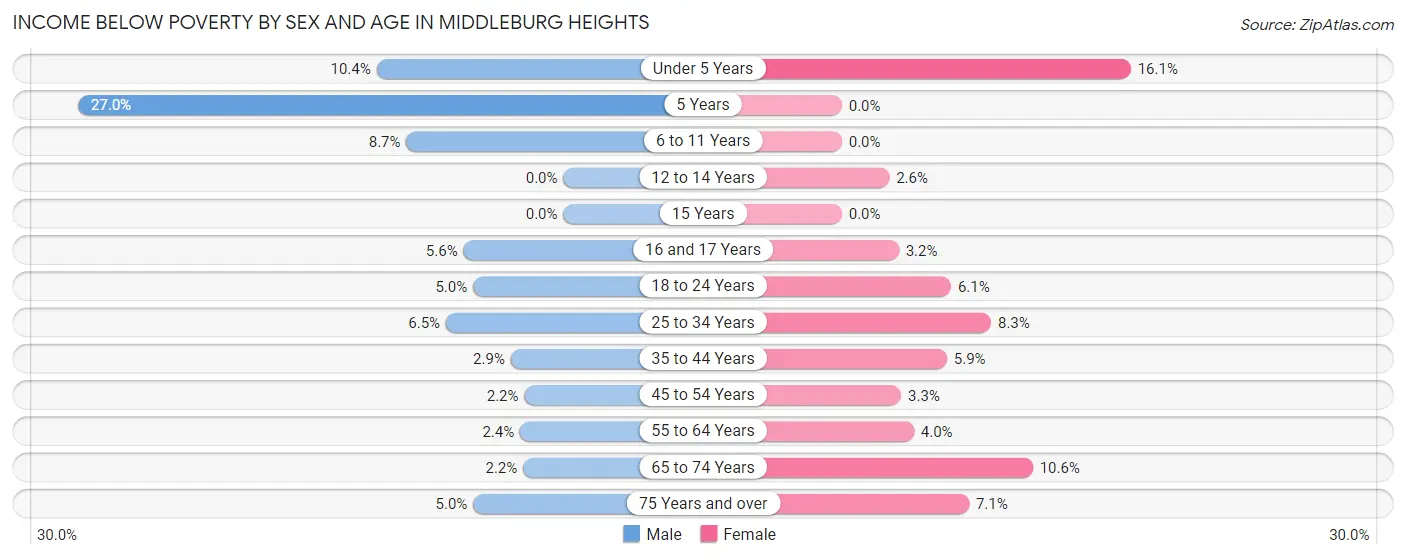
Income Below Poverty by Sex and Age in Middleburg Heights
With 4.3% poverty level for males and 6.4% for females among the residents of Middleburg Heights, 5 year old males and under 5 year old females are the most vulnerable to poverty, with 10 males (27.0%) and 61 females (16.1%) in their respective age groups living below the poverty level.
| Age Bracket | Male | Female |
| Under 5 Years | 49 (10.4%) | 61 (16.1%) |
| 5 Years | 10 (27.0%) | 0 (0.0%) |
| 6 to 11 Years | 39 (8.7%) | 0 (0.0%) |
| 12 to 14 Years | 0 (0.0%) | 8 (2.6%) |
| 15 Years | 0 (0.0%) | 0 (0.0%) |
| 16 and 17 Years | 8 (5.6%) | 4 (3.2%) |
| 18 to 24 Years | 26 (5.0%) | 18 (6.1%) |
| 25 to 34 Years | 57 (6.5%) | 70 (8.3%) |
| 35 to 44 Years | 34 (2.9%) | 58 (5.9%) |
| 45 to 54 Years | 23 (2.2%) | 29 (3.3%) |
| 55 to 64 Years | 28 (2.4%) | 57 (4.0%) |
| 65 to 74 Years | 18 (2.2%) | 123 (10.6%) |
| 75 Years and over | 42 (5.0%) | 64 (7.1%) |
| Total | 334 (4.3%) | 492 (6.4%) |
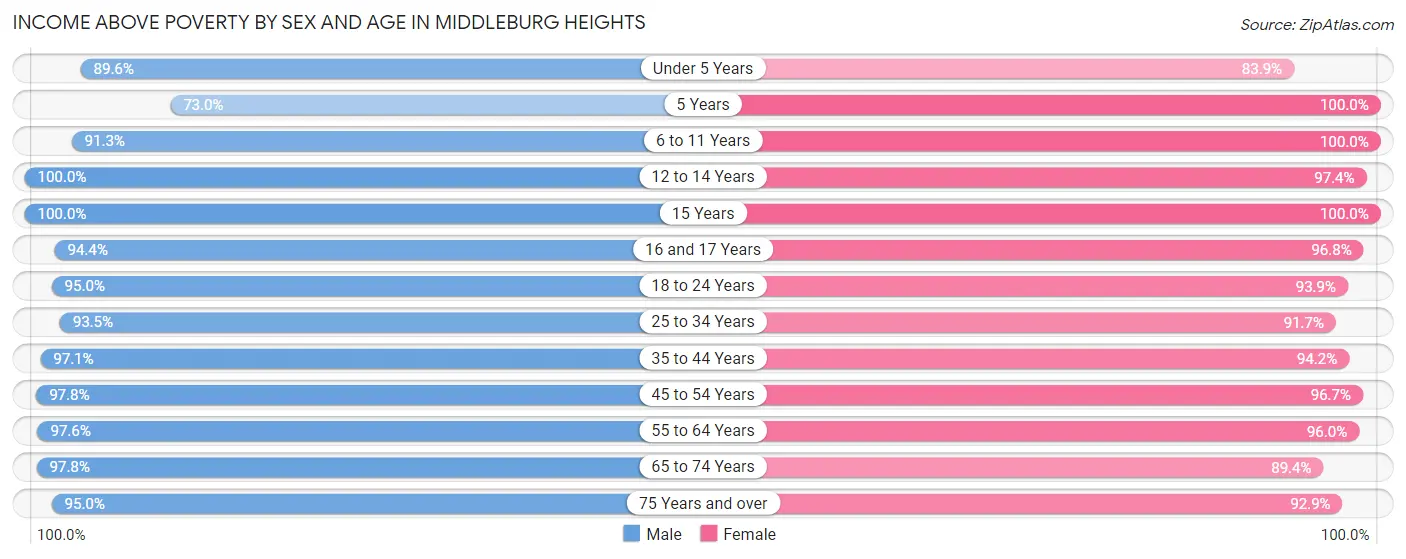
Income Above Poverty by Sex and Age in Middleburg Heights
According to the poverty statistics in Middleburg Heights, males aged 12 to 14 years and females aged 5 years are the age groups that are most secure financially, with 100.0% of males and 100.0% of females in these age groups living above the poverty line.
| Age Bracket | Male | Female |
| Under 5 Years | 422 (89.6%) | 318 (83.9%) |
| 5 Years | 27 (73.0%) | 83 (100.0%) |
| 6 to 11 Years | 407 (91.3%) | 346 (100.0%) |
| 12 to 14 Years | 141 (100.0%) | 295 (97.4%) |
| 15 Years | 48 (100.0%) | 14 (100.0%) |
| 16 and 17 Years | 136 (94.4%) | 122 (96.8%) |
| 18 to 24 Years | 491 (95.0%) | 278 (93.9%) |
| 25 to 34 Years | 814 (93.5%) | 772 (91.7%) |
| 35 to 44 Years | 1,127 (97.1%) | 934 (94.2%) |
| 45 to 54 Years | 1,036 (97.8%) | 849 (96.7%) |
| 55 to 64 Years | 1,134 (97.6%) | 1,363 (96.0%) |
| 65 to 74 Years | 786 (97.8%) | 1,034 (89.4%) |
| 75 Years and over | 794 (95.0%) | 840 (92.9%) |
| Total | 7,363 (95.7%) | 7,248 (93.6%) |
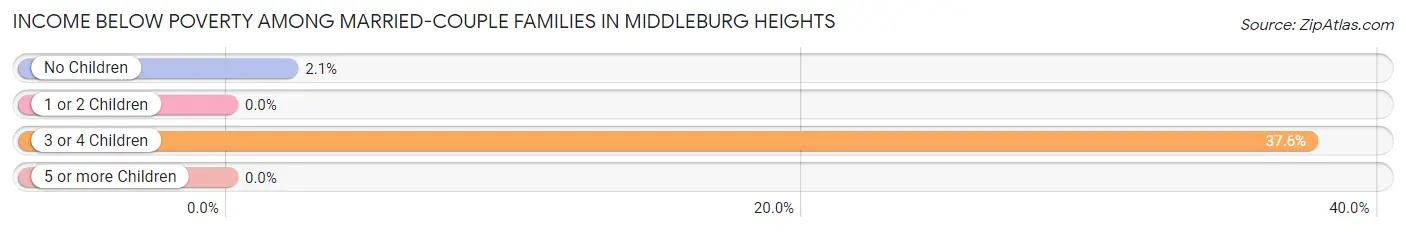
Income Below Poverty Among Married-Couple Families in Middleburg Heights
The poverty statistics for married-couple families in Middleburg Heights show that 2.8% or 93 of the total 3,374 families live below the poverty line. Families with 3 or 4 children have the highest poverty rate of 37.6%, comprising of 47 families. On the other hand, families with 1 or 2 children have the lowest poverty rate of 0.0%, which includes 0 families.
| Children | Above Poverty | Below Poverty |
| No Children | 2,145 (97.9%) | 46 (2.1%) |
| 1 or 2 Children | 1,058 (100.0%) | 0 (0.0%) |
| 3 or 4 Children | 78 (62.4%) | 47 (37.6%) |
| 5 or more Children | 0 (0.0%) | 0 (0.0%) |
| Total | 3,281 (97.2%) | 93 (2.8%) |
Income Below Poverty Among Single-Parent Households in Middleburg Heights
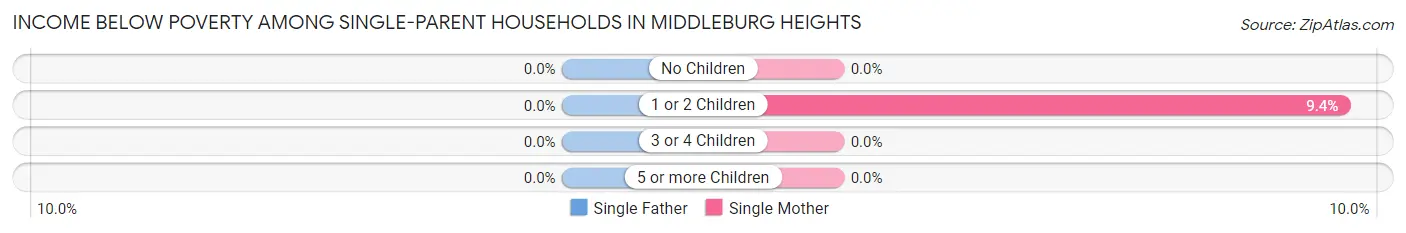
| Children | Single Father | Single Mother |
| No Children | 0 (0.0%) | 0 (0.0%) |
| 1 or 2 Children | 0 (0.0%) | 23 (9.4%) |
| 3 or 4 Children | 0 (0.0%) | 0 (0.0%) |
| 5 or more Children | 0 (0.0%) | 0 (0.0%) |
| Total | 0 (0.0%) | 23 (5.9%) |
Income Below Poverty Among Married-Couple vs Single-Parent Households in Middleburg Heights
The poverty data for Middleburg Heights shows that 93 of the married-couple family households (2.8%) and 23 of the single-parent households (3.9%) are living below the poverty level. Within the married-couple family households, those with 3 or 4 children have the highest poverty rate, with 47 households (37.6%) falling below the poverty line. Among the single-parent households, those with 1 or 2 children have the highest poverty rate, with 23 household (6.4%) living below poverty.
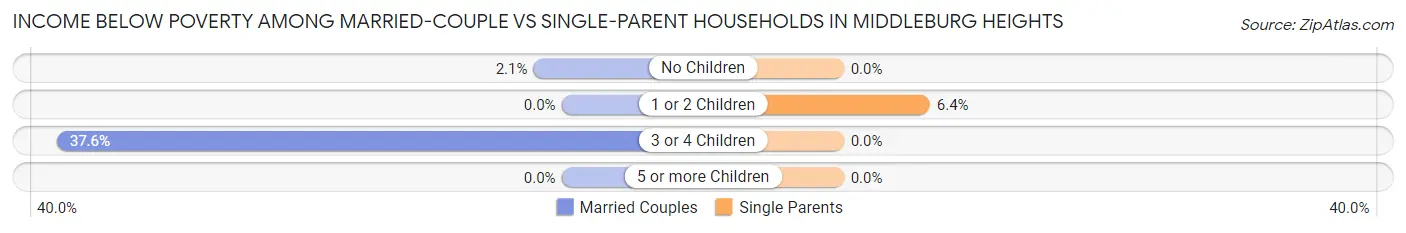
| Children | Married-Couple Families | Single-Parent Households |
| No Children | 46 (2.1%) | 0 (0.0%) |
| 1 or 2 Children | 0 (0.0%) | 23 (6.4%) |
| 3 or 4 Children | 47 (37.6%) | 0 (0.0%) |
| 5 or more Children | 0 (0.0%) | 0 (0.0%) |
| Total | 93 (2.8%) | 23 (3.9%) |
Race in Middleburg Heights
The most populous races in Middleburg Heights are White / Caucasian (12,927 | 81.2%), Asian (1,413 | 8.9%), and Hispanic or Latino (992 | 6.2%).
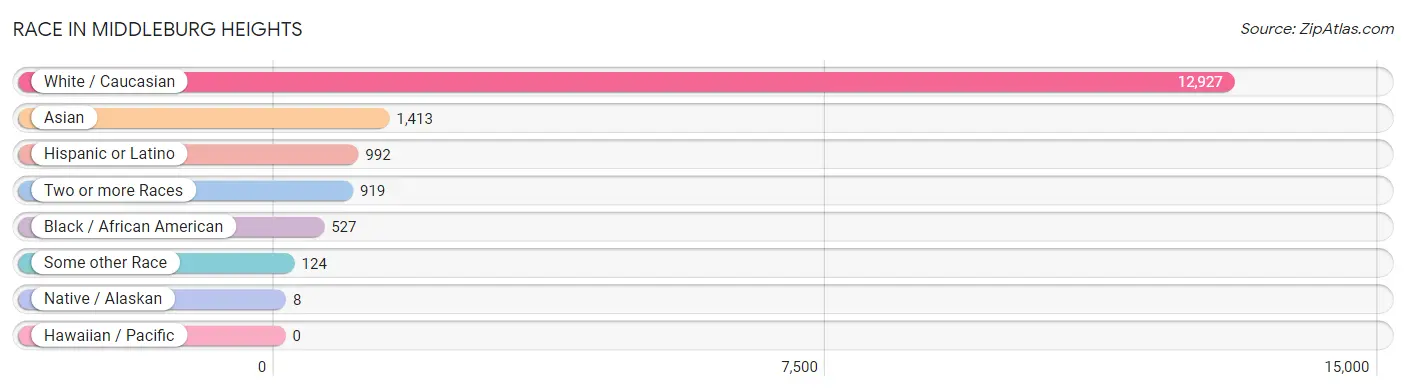
| Race | # Population | % Population |
| Asian | 1,413 | 8.9% |
| Black / African American | 527 | 3.3% |
| Hawaiian / Pacific | 0 | 0.0% |
| Hispanic or Latino | 992 | 6.2% |
| Native / Alaskan | 8 | 0.1% |
| White / Caucasian | 12,927 | 81.2% |
| Two or more Races | 919 | 5.8% |
| Some other Race | 124 | 0.8% |
| Total | 15,918 | 100.0% |
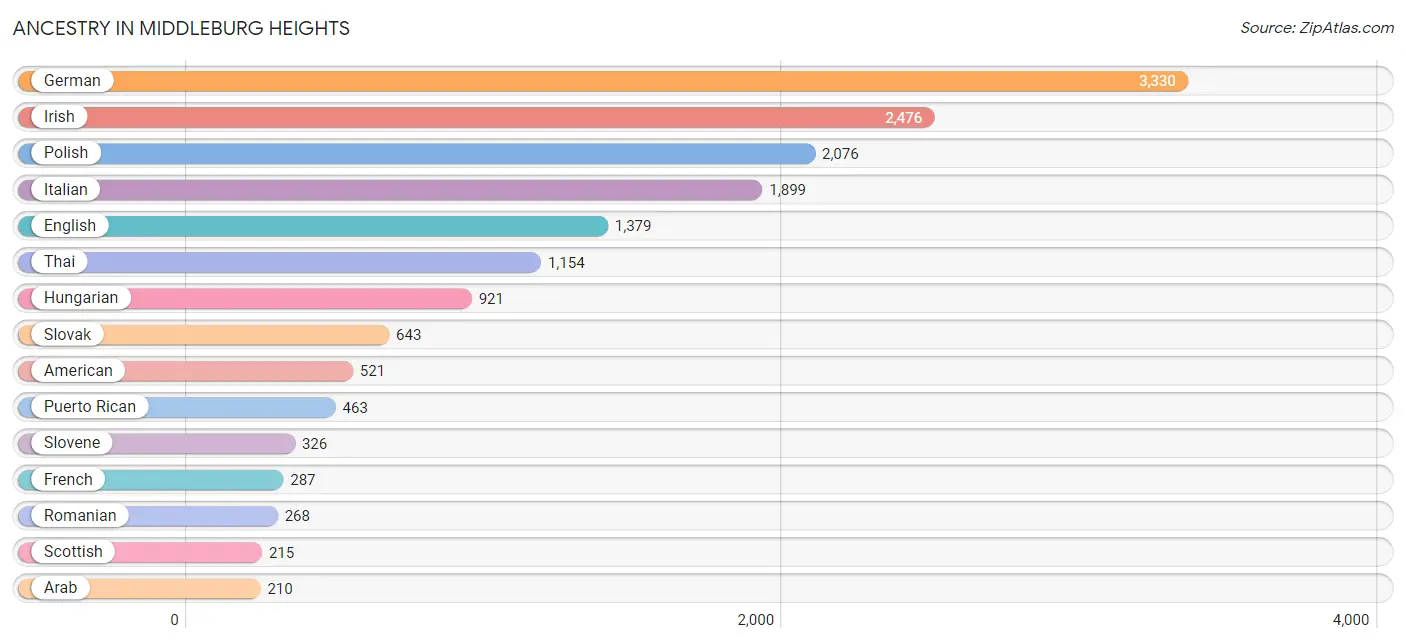
Ancestry in Middleburg Heights
The most populous ancestries reported in Middleburg Heights are German (3,330 | 20.9%), Irish (2,476 | 15.5%), Polish (2,076 | 13.0%), Italian (1,899 | 11.9%), and English (1,379 | 8.7%), together accounting for 70.1% of all Middleburg Heights residents.
| Ancestry | # Population | % Population |
| African | 38 | 0.2% |
| Albanian | 20 | 0.1% |
| American | 521 | 3.3% |
| Arab | 210 | 1.3% |
| Armenian | 2 | 0.0% |
| Assyrian / Chaldean / Syriac | 7 | 0.0% |
| Austrian | 118 | 0.7% |
| Belgian | 19 | 0.1% |
| Bhutanese | 45 | 0.3% |
| Blackfeet | 9 | 0.1% |
| British | 11 | 0.1% |
| Burmese | 10 | 0.1% |
| Canadian | 54 | 0.3% |
| Central American | 116 | 0.7% |
| Cherokee | 73 | 0.5% |
| Colombian | 10 | 0.1% |
| Croatian | 176 | 1.1% |
| Cuban | 6 | 0.0% |
| Czech | 168 | 1.1% |
| Czechoslovakian | 75 | 0.5% |
| Danish | 24 | 0.2% |
| Dutch | 103 | 0.6% |
| Eastern European | 58 | 0.4% |
| English | 1,379 | 8.7% |
| European | 127 | 0.8% |
| French | 287 | 1.8% |
| French Canadian | 10 | 0.1% |
| German | 3,330 | 20.9% |
| Greek | 152 | 0.9% |
| Hungarian | 921 | 5.8% |
| Indian (Asian) | 49 | 0.3% |
| Irish | 2,476 | 15.5% |
| Israeli | 12 | 0.1% |
| Italian | 1,899 | 11.9% |
| Japanese | 80 | 0.5% |
| Korean | 69 | 0.4% |
| Latvian | 14 | 0.1% |
| Lebanese | 145 | 0.9% |
| Lithuanian | 35 | 0.2% |
| Mexican | 204 | 1.3% |
| Navajo | 18 | 0.1% |
| Nicaraguan | 105 | 0.7% |
| Norwegian | 27 | 0.2% |
| Polish | 2,076 | 13.0% |
| Puerto Rican | 463 | 2.9% |
| Romanian | 268 | 1.7% |
| Russian | 97 | 0.6% |
| Salvadoran | 11 | 0.1% |
| Scandinavian | 7 | 0.0% |
| Scotch-Irish | 188 | 1.2% |
| Scottish | 215 | 1.3% |
| Serbian | 26 | 0.2% |
| Slavic | 66 | 0.4% |
| Slovak | 643 | 4.0% |
| Slovene | 326 | 2.1% |
| South American | 44 | 0.3% |
| Spaniard | 56 | 0.4% |
| Spanish | 103 | 0.6% |
| Sri Lankan | 65 | 0.4% |
| Subsaharan African | 38 | 0.2% |
| Swedish | 65 | 0.4% |
| Swiss | 29 | 0.2% |
| Syrian | 9 | 0.1% |
| Thai | 1,154 | 7.2% |
| Ukrainian | 172 | 1.1% |
| Venezuelan | 34 | 0.2% |
| Welsh | 174 | 1.1% |
| Yugoslavian | 15 | 0.1% | View All 68 Rows |
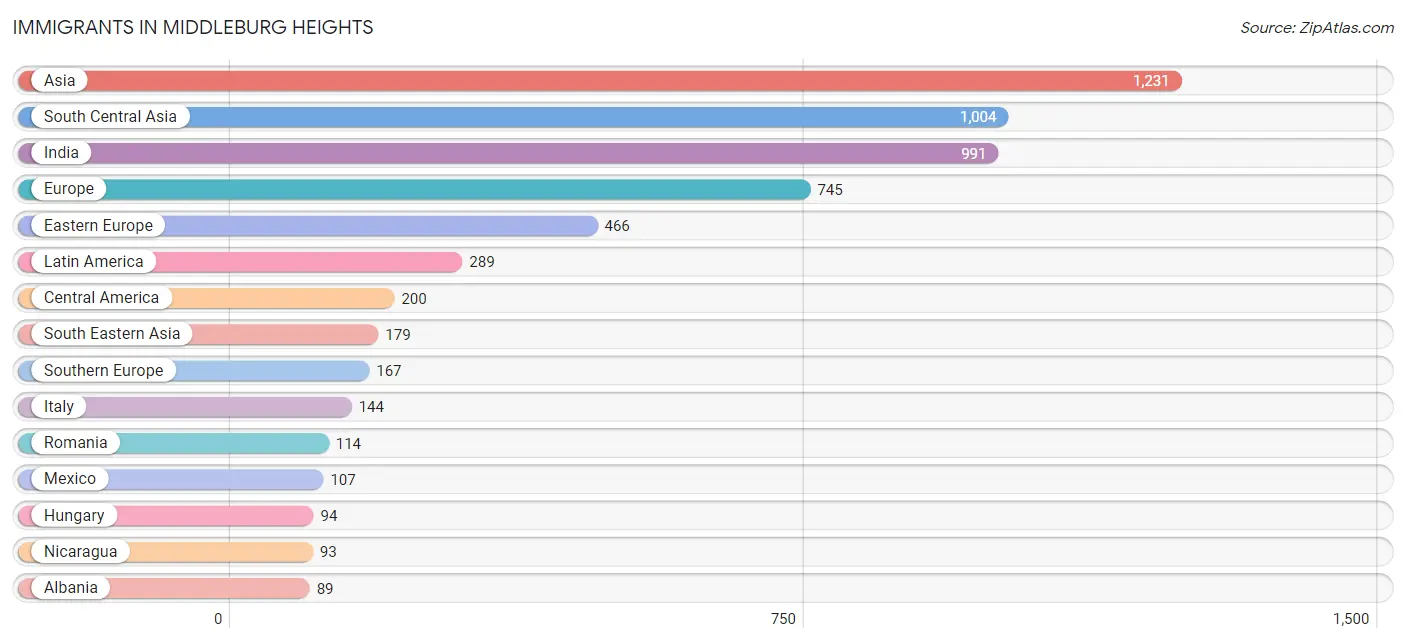
Immigrants in Middleburg Heights
The most numerous immigrant groups reported in Middleburg Heights came from Asia (1,231 | 7.7%), South Central Asia (1,004 | 6.3%), India (991 | 6.2%), Europe (745 | 4.7%), and Eastern Europe (466 | 2.9%), together accounting for 27.9% of all Middleburg Heights residents.
| Immigration Origin | # Population | % Population |
| Africa | 46 | 0.3% |
| Albania | 89 | 0.6% |
| Asia | 1,231 | 7.7% |
| Austria | 25 | 0.2% |
| Bosnia and Herzegovina | 13 | 0.1% |
| Brazil | 10 | 0.1% |
| Cambodia | 51 | 0.3% |
| Canada | 42 | 0.3% |
| Central America | 200 | 1.3% |
| China | 11 | 0.1% |
| Colombia | 10 | 0.1% |
| Czechoslovakia | 12 | 0.1% |
| Eastern Asia | 17 | 0.1% |
| Eastern Europe | 466 | 2.9% |
| Europe | 745 | 4.7% |
| France | 14 | 0.1% |
| Germany | 31 | 0.2% |
| Greece | 23 | 0.1% |
| Hong Kong | 7 | 0.0% |
| Hungary | 94 | 0.6% |
| India | 991 | 6.2% |
| Ireland | 42 | 0.3% |
| Israel | 19 | 0.1% |
| Italy | 144 | 0.9% |
| Kazakhstan | 13 | 0.1% |
| Korea | 6 | 0.0% |
| Latin America | 289 | 1.8% |
| Lebanon | 12 | 0.1% |
| Mexico | 107 | 0.7% |
| Moldova | 8 | 0.1% |
| Morocco | 46 | 0.3% |
| Nicaragua | 93 | 0.6% |
| Northern Africa | 46 | 0.3% |
| Northern Europe | 42 | 0.3% |
| Philippines | 41 | 0.3% |
| Poland | 43 | 0.3% |
| Romania | 114 | 0.7% |
| Russia | 9 | 0.1% |
| Serbia | 27 | 0.2% |
| South America | 89 | 0.6% |
| South Central Asia | 1,004 | 6.3% |
| South Eastern Asia | 179 | 1.1% |
| Southern Europe | 167 | 1.1% |
| Ukraine | 29 | 0.2% |
| Uruguay | 55 | 0.4% |
| Venezuela | 14 | 0.1% |
| Vietnam | 87 | 0.5% |
| Western Asia | 31 | 0.2% |
| Western Europe | 70 | 0.4% | View All 49 Rows |
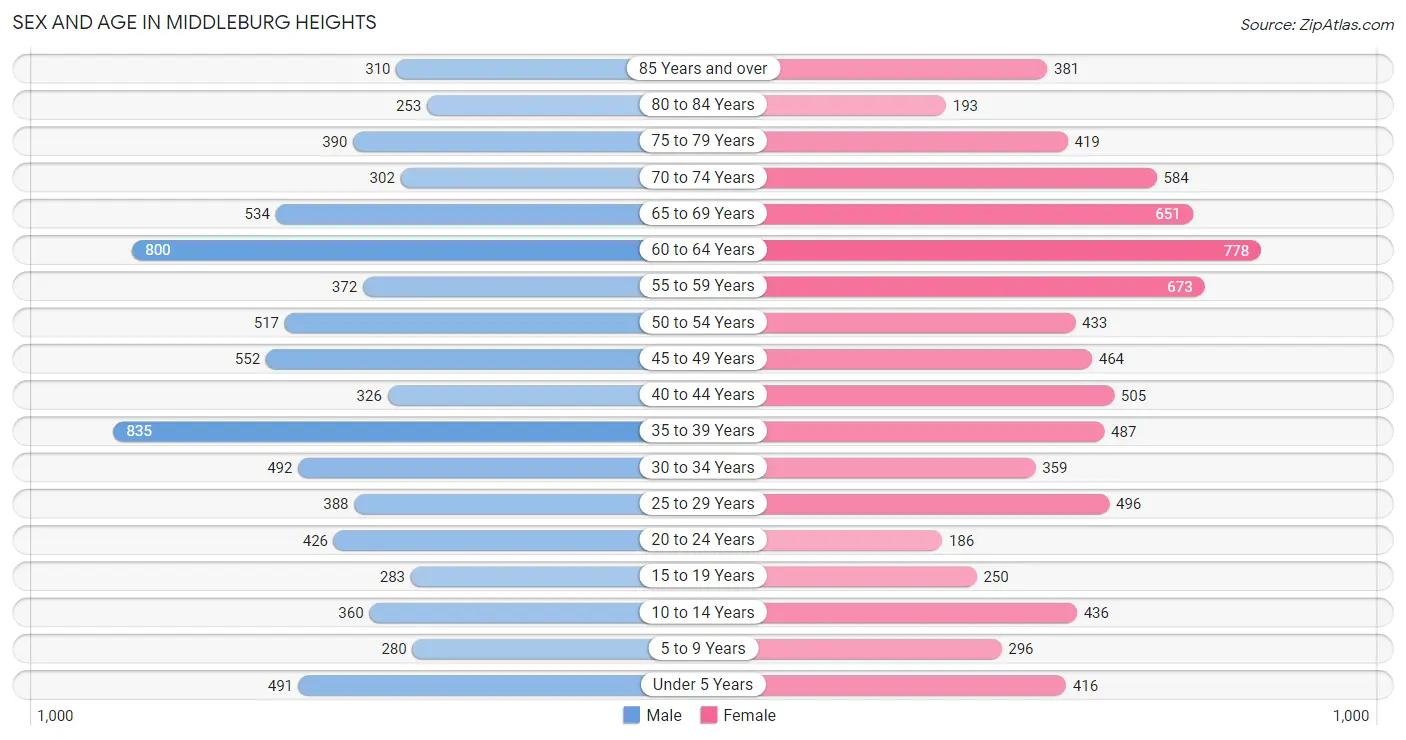
Sex and Age in Middleburg Heights
Sex and Age in Middleburg Heights
The most populous age groups in Middleburg Heights are 35 to 39 Years (835 | 10.5%) for men and 60 to 64 Years (778 | 9.7%) for women.
| Age Bracket | Male | Female |
| Under 5 Years | 491 (6.2%) | 416 (5.2%) |
| 5 to 9 Years | 280 (3.5%) | 296 (3.7%) |
| 10 to 14 Years | 360 (4.5%) | 436 (5.4%) |
| 15 to 19 Years | 283 (3.6%) | 250 (3.1%) |
| 20 to 24 Years | 426 (5.4%) | 186 (2.3%) |
| 25 to 29 Years | 388 (4.9%) | 496 (6.2%) |
| 30 to 34 Years | 492 (6.2%) | 359 (4.5%) |
| 35 to 39 Years | 835 (10.5%) | 487 (6.1%) |
| 40 to 44 Years | 326 (4.1%) | 505 (6.3%) |
| 45 to 49 Years | 552 (7.0%) | 464 (5.8%) |
| 50 to 54 Years | 517 (6.5%) | 433 (5.4%) |
| 55 to 59 Years | 372 (4.7%) | 673 (8.4%) |
| 60 to 64 Years | 800 (10.1%) | 778 (9.7%) |
| 65 to 69 Years | 534 (6.8%) | 651 (8.1%) |
| 70 to 74 Years | 302 (3.8%) | 584 (7.3%) |
| 75 to 79 Years | 390 (4.9%) | 419 (5.2%) |
| 80 to 84 Years | 253 (3.2%) | 193 (2.4%) |
| 85 Years and over | 310 (3.9%) | 381 (4.8%) |
| Total | 7,911 (100.0%) | 8,007 (100.0%) |
Families and Households in Middleburg Heights
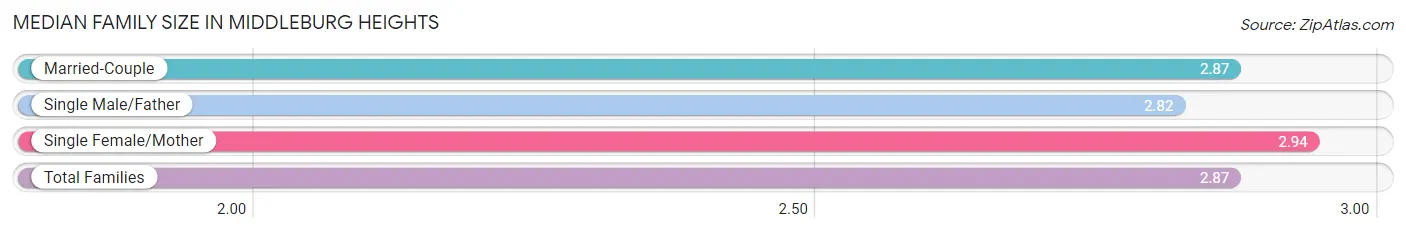
Median Family Size in Middleburg Heights
The median family size in Middleburg Heights is 2.87 persons per family, with single female/mother families (390 | 9.8%) accounting for the largest median family size of 2.94 persons per family. On the other hand, single male/father families (200 | 5.1%) represent the smallest median family size with 2.82 persons per family.
| Family Type | # Families | Family Size |
| Married-Couple | 3,374 (85.1%) | 2.87 |
| Single Male/Father | 200 (5.1%) | 2.82 |
| Single Female/Mother | 390 (9.8%) | 2.94 |
| Total Families | 3,964 (100.0%) | 2.87 |
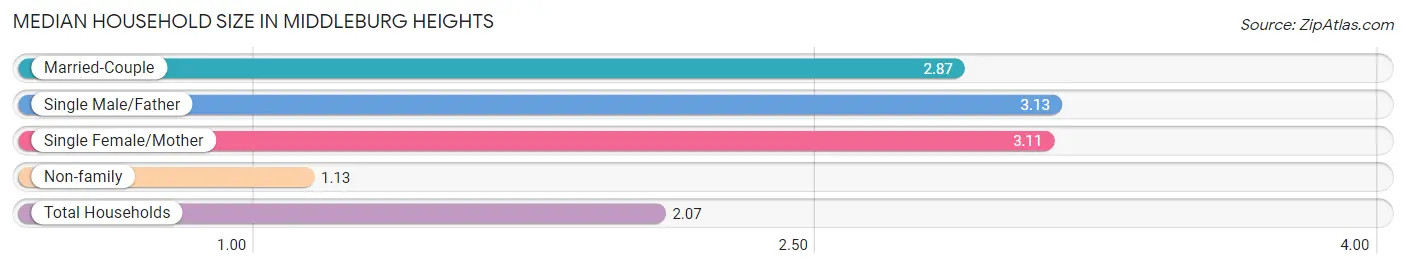
Median Household Size in Middleburg Heights
The median household size in Middleburg Heights is 2.07 persons per household, with single male/father households (200 | 2.7%) accounting for the largest median household size of 3.13 persons per household. non-family households (3,510 | 47.0%) represent the smallest median household size with 1.13 persons per household.
| Household Type | # Households | Household Size |
| Married-Couple | 3,374 (45.1%) | 2.87 |
| Single Male/Father | 200 (2.7%) | 3.13 |
| Single Female/Mother | 390 (5.2%) | 3.11 |
| Non-family | 3,510 (47.0%) | 1.13 |
| Total Households | 7,474 (100.0%) | 2.07 |
Household Size by Marriage Status in Middleburg Heights
Out of a total of 7,474 households in Middleburg Heights, 3,964 (53.0%) are family households, while 3,510 (47.0%) are nonfamily households. The most numerous type of family households are 2-person households, comprising 1,917, and the most common type of nonfamily households are 1-person households, comprising 3,120.
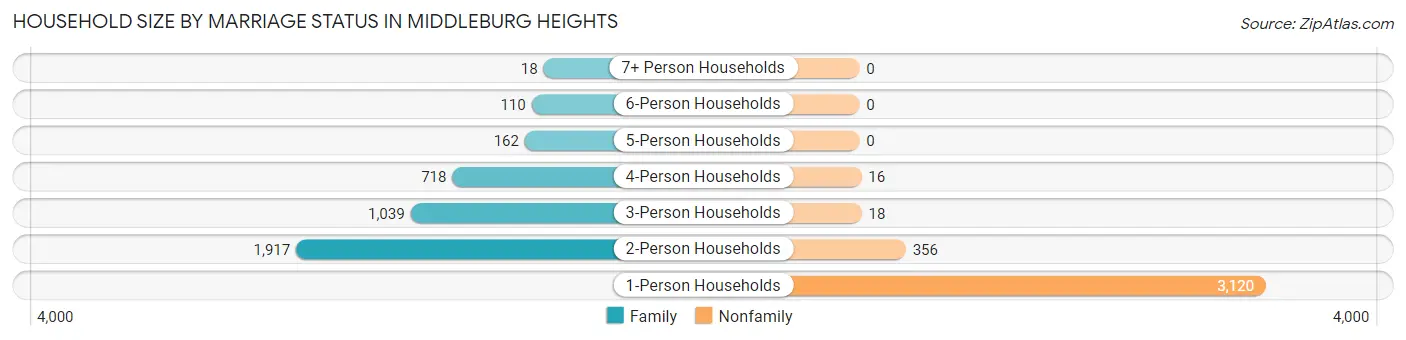
| Household Size | Family Households | Nonfamily Households |
| 1-Person Households | - | 3,120 (41.7%) |
| 2-Person Households | 1,917 (25.7%) | 356 (4.8%) |
| 3-Person Households | 1,039 (13.9%) | 18 (0.2%) |
| 4-Person Households | 718 (9.6%) | 16 (0.2%) |
| 5-Person Households | 162 (2.2%) | 0 (0.0%) |
| 6-Person Households | 110 (1.5%) | 0 (0.0%) |
| 7+ Person Households | 18 (0.2%) | 0 (0.0%) |
| Total | 3,964 (53.0%) | 3,510 (47.0%) |
Female Fertility in Middleburg Heights
Fertility by Age in Middleburg Heights
Average fertility rate in Middleburg Heights is 38.0 births per 1,000 women. Women in the age bracket of 20 to 34 years have the highest fertility rate with 64.0 births per 1,000 women. Women in the age bracket of 20 to 34 years acount for 62.0% of all women with births.
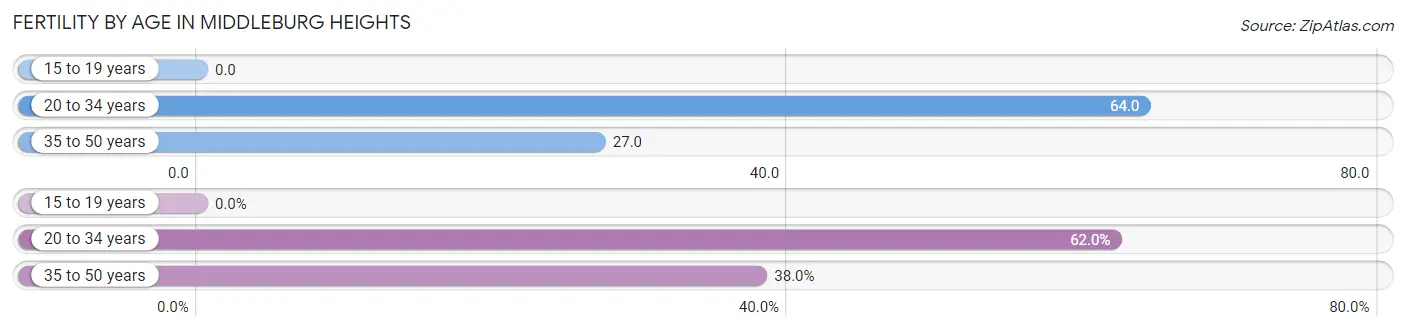
| Age Bracket | Women with Births | Births / 1,000 Women |
| 15 to 19 years | 0 (0.0%) | 0.0 |
| 20 to 34 years | 67 (62.0%) | 64.0 |
| 35 to 50 years | 41 (38.0%) | 27.0 |
| Total | 108 (100.0%) | 38.0 |
Fertility by Age by Marriage Status in Middleburg Heights
61.1% of women with births (108) in Middleburg Heights are married. The highest percentage of unmarried women with births falls into 20 to 34 years age bracket with 50.7% of them unmarried at the time of birth, while the lowest percentage of unmarried women with births belong to 35 to 50 years age bracket with 19.5% of them unmarried.
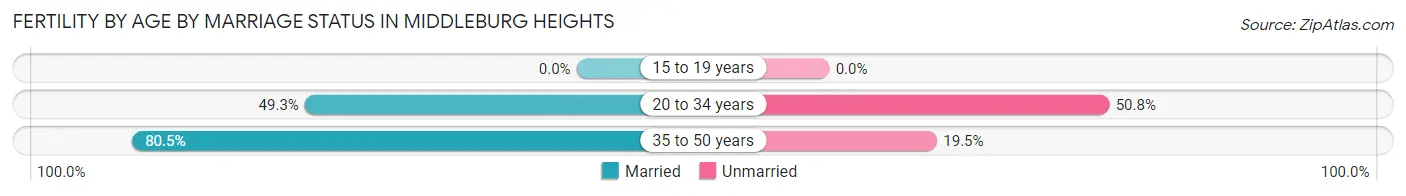
| Age Bracket | Married | Unmarried |
| 15 to 19 years | 0 (0.0%) | 0 (0.0%) |
| 20 to 34 years | 33 (49.2%) | 34 (50.7%) |
| 35 to 50 years | 33 (80.5%) | 8 (19.5%) |
| Total | 66 (61.1%) | 42 (38.9%) |
Fertility by Education in Middleburg Heights
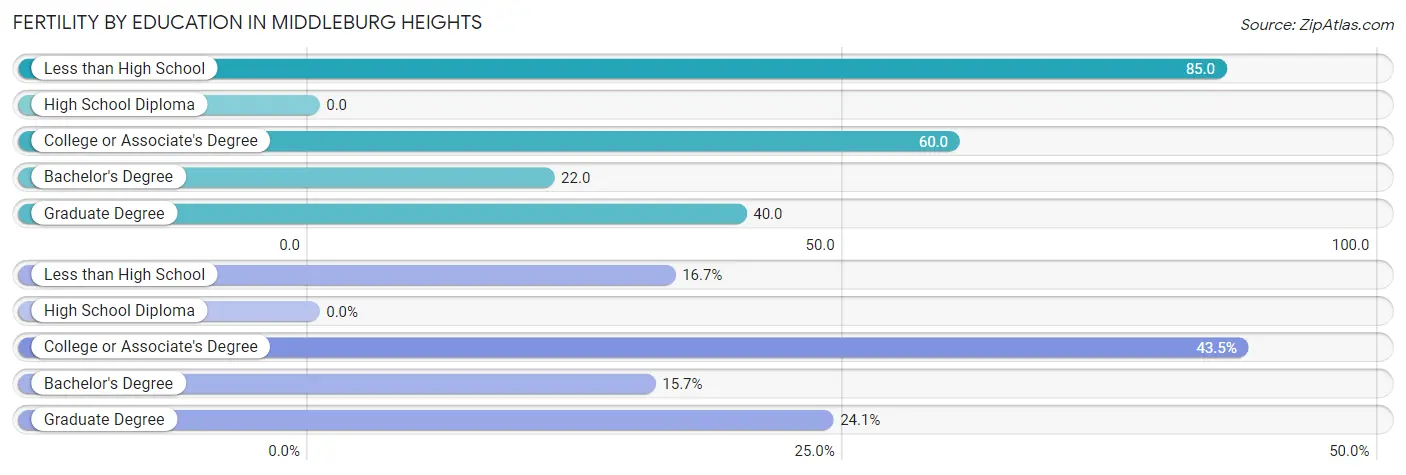
| Educational Attainment | Women with Births | Births / 1,000 Women |
| Less than High School | 18 (16.7%) | 85.0 |
| High School Diploma | 0 (0.0%) | 0.0 |
| College or Associate's Degree | 47 (43.5%) | 60.0 |
| Bachelor's Degree | 17 (15.7%) | 22.0 |
| Graduate Degree | 26 (24.1%) | 40.0 |
| Total | 108 (100.0%) | 38.0 |
Fertility by Education by Marriage Status in Middleburg Heights
38.9% of women with births in Middleburg Heights are unmarried. Women with the educational attainment of less than high school are most likely to be married with 100.0% of them married at childbirth, while women with the educational attainment of college or associate's degree are least likely to be married with 89.4% of them unmarried at childbirth.
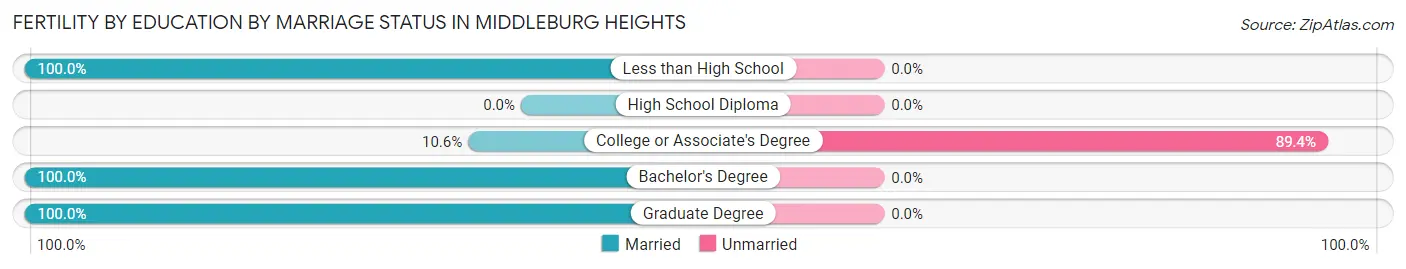
| Educational Attainment | Married | Unmarried |
| Less than High School | 18 (100.0%) | 0 (0.0%) |
| High School Diploma | 0 (0.0%) | 0 (0.0%) |
| College or Associate's Degree | 5 (10.6%) | 42 (89.4%) |
| Bachelor's Degree | 17 (100.0%) | 0 (0.0%) |
| Graduate Degree | 26 (100.0%) | 0 (0.0%) |
| Total | 66 (61.1%) | 42 (38.9%) |
Employment Characteristics in Middleburg Heights
Employment by Class of Employer in Middleburg Heights
Among the 7,779 employed individuals in Middleburg Heights, private company employees (4,927 | 63.3%), not-for-profit organizations (1,056 | 13.6%), and local government employees (595 | 7.6%) make up the most common classes of employment.
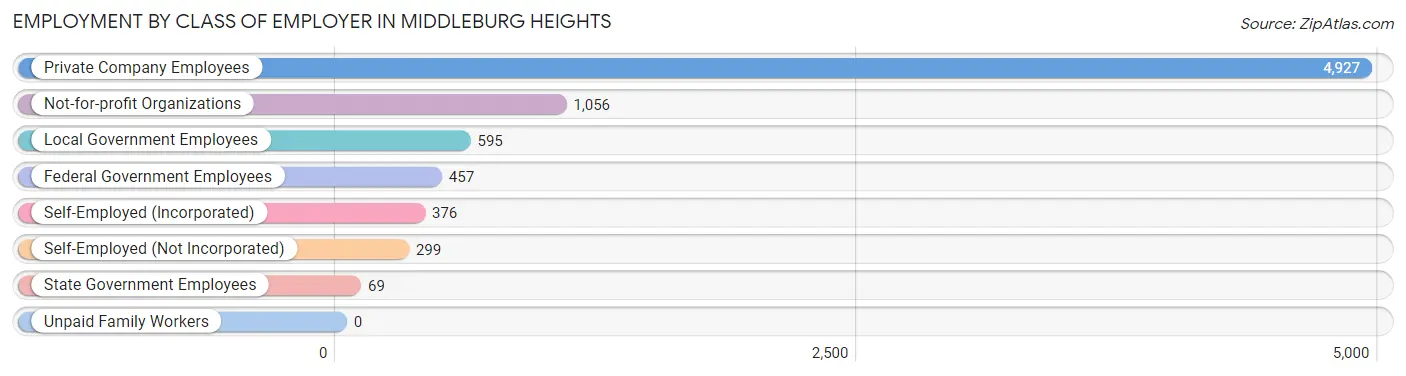
| Employer Class | # Employees | % Employees |
| Private Company Employees | 4,927 | 63.3% |
| Self-Employed (Incorporated) | 376 | 4.8% |
| Self-Employed (Not Incorporated) | 299 | 3.8% |
| Not-for-profit Organizations | 1,056 | 13.6% |
| Local Government Employees | 595 | 7.6% |
| State Government Employees | 69 | 0.9% |
| Federal Government Employees | 457 | 5.9% |
| Unpaid Family Workers | 0 | 0.0% |
| Total | 7,779 | 100.0% |
Employment Status by Age in Middleburg Heights
According to the labor force statistics for Middleburg Heights, out of the total population over 16 years of age (13,577), 59.4% or 8,065 individuals are in the labor force, with 2.0% or 161 of them unemployed. The age group with the highest labor force participation rate is 20 to 24 years, with 91.0% or 557 individuals in the labor force. Within the labor force, the 16 to 19 years age range has the highest percentage of unemployed individuals, with 12.3% or 38 of them being unemployed.
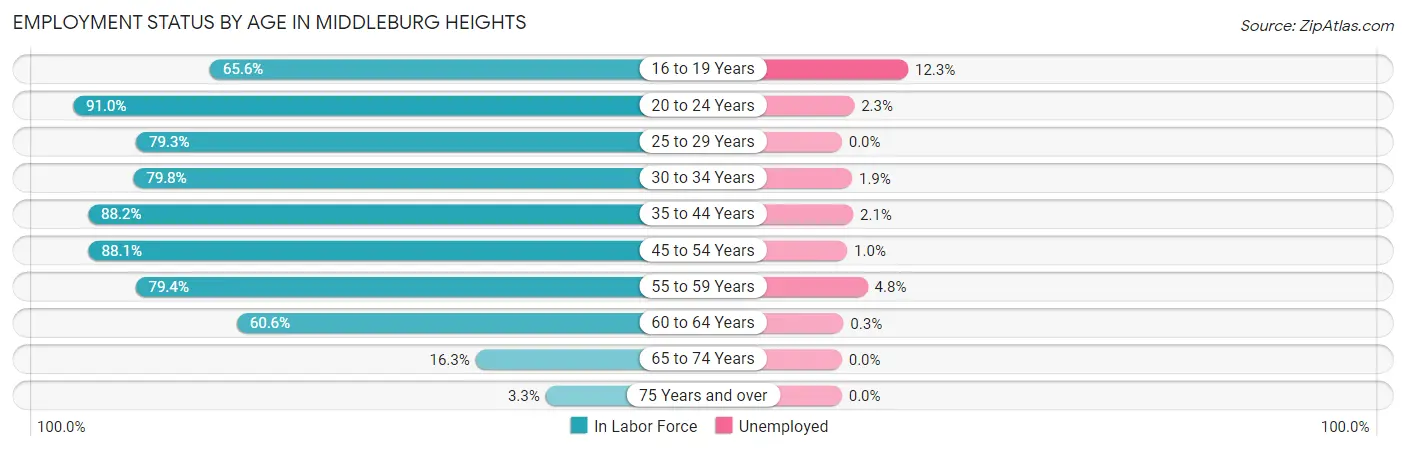
| Age Bracket | In Labor Force | Unemployed |
| 16 to 19 Years | 309 (65.6%) | 38 (12.3%) |
| 20 to 24 Years | 557 (91.0%) | 13 (2.3%) |
| 25 to 29 Years | 701 (79.3%) | 0 (0.0%) |
| 30 to 34 Years | 679 (79.8%) | 13 (1.9%) |
| 35 to 44 Years | 1,899 (88.2%) | 40 (2.1%) |
| 45 to 54 Years | 1,732 (88.1%) | 17 (1.0%) |
| 55 to 59 Years | 830 (79.4%) | 40 (4.8%) |
| 60 to 64 Years | 956 (60.6%) | 3 (0.3%) |
| 65 to 74 Years | 338 (16.3%) | 0 (0.0%) |
| 75 Years and over | 64 (3.3%) | 0 (0.0%) |
| Total | 8,065 (59.4%) | 161 (2.0%) |
Employment Status by Educational Attainment in Middleburg Heights
According to labor force statistics for Middleburg Heights, 80.2% of individuals (6,799) out of the total population between 25 and 64 years of age (8,477) are in the labor force, with 1.7% or 116 of them being unemployed. The group with the highest labor force participation rate are those with the educational attainment of bachelor's degree or higher, with 86.1% or 3,066 individuals in the labor force. Within the labor force, individuals with college / associate degree education have the highest percentage of unemployment, with 2.7% or 59 of them being unemployed.
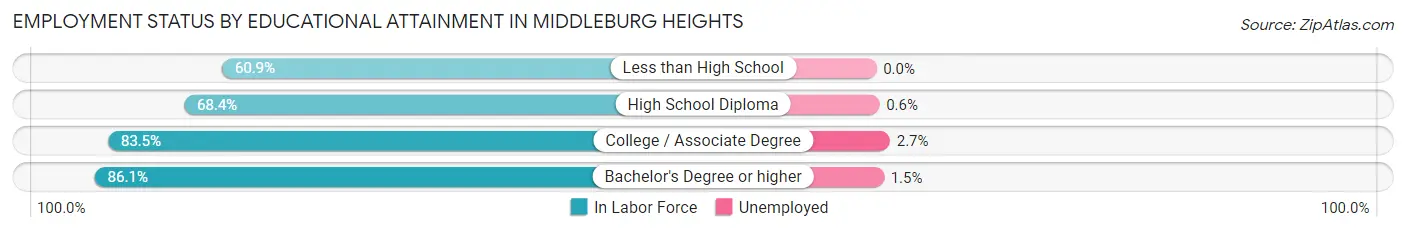
| Educational Attainment | In Labor Force | Unemployed |
| Less than High School | 204 (60.9%) | 0 (0.0%) |
| High School Diploma | 1,345 (68.4%) | 12 (0.6%) |
| College / Associate Degree | 2,183 (83.5%) | 71 (2.7%) |
| Bachelor's Degree or higher | 3,066 (86.1%) | 53 (1.5%) |
| Total | 6,799 (80.2%) | 144 (1.7%) |
Employment Occupations by Sex in Middleburg Heights
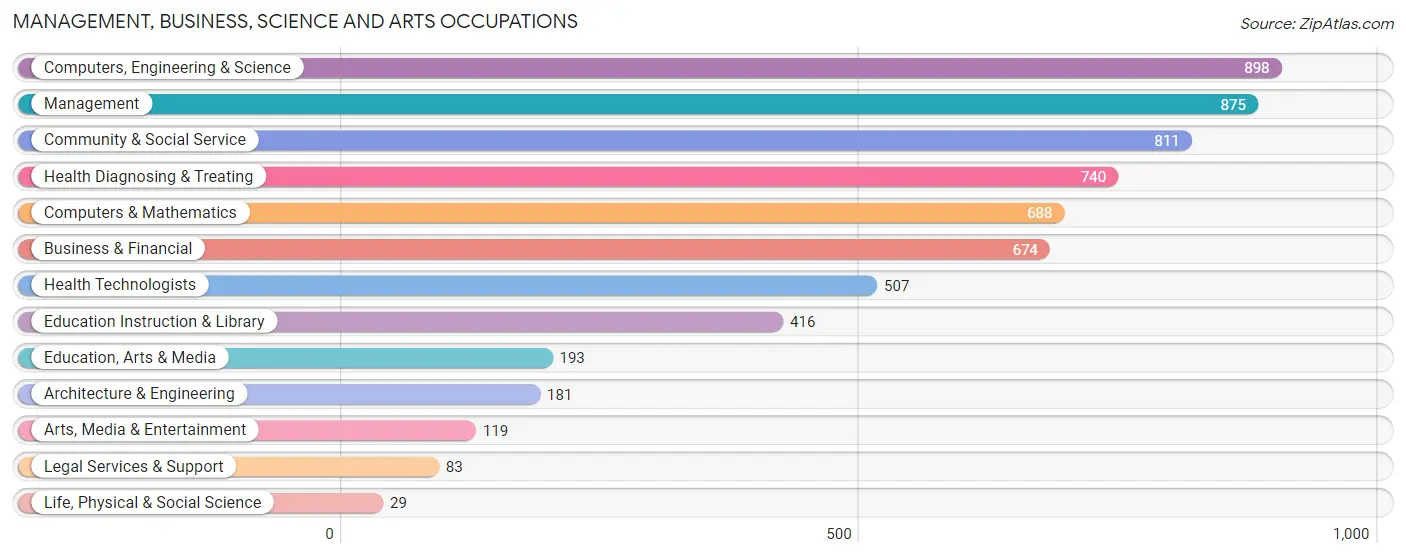
Management, Business, Science and Arts Occupations
The most common Management, Business, Science and Arts occupations in Middleburg Heights are Computers, Engineering & Science (898 | 11.4%), Management (875 | 11.1%), Community & Social Service (811 | 10.3%), Health Diagnosing & Treating (740 | 9.4%), and Computers & Mathematics (688 | 8.7%).
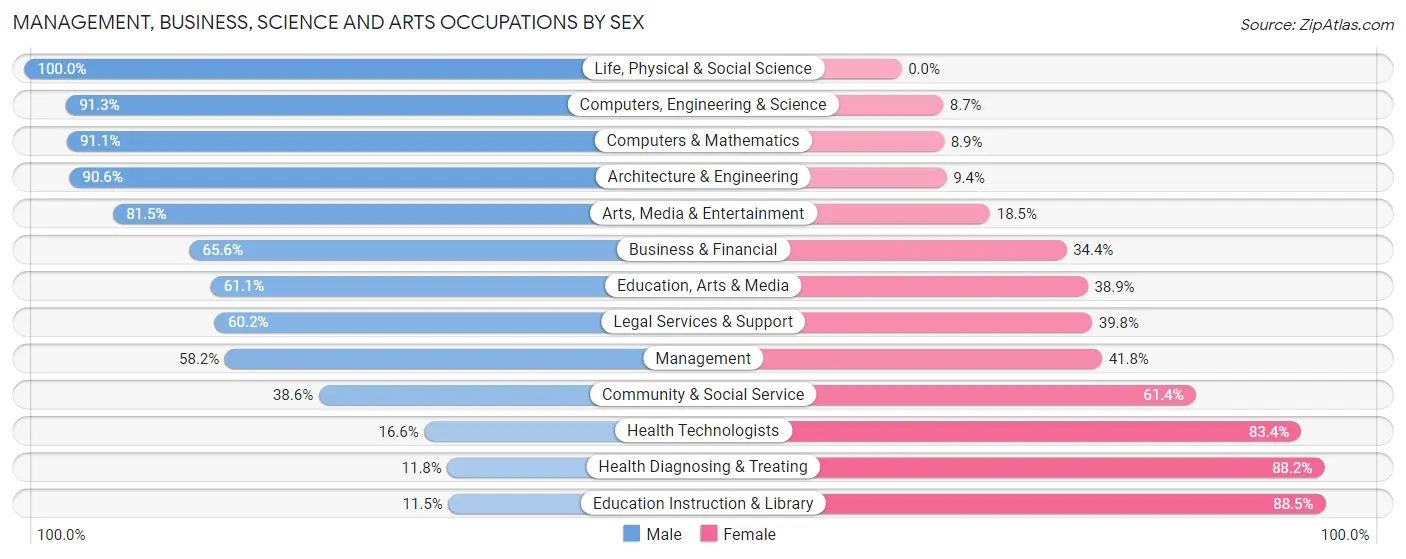
Management, Business, Science and Arts Occupations by Sex
Within the Management, Business, Science and Arts occupations in Middleburg Heights, the most male-oriented occupations are Life, Physical & Social Science (100.0%), Computers, Engineering & Science (91.3%), and Computers & Mathematics (91.1%), while the most female-oriented occupations are Education Instruction & Library (88.5%), Health Diagnosing & Treating (88.2%), and Health Technologists (83.4%).
| Occupation | Male | Female |
| Management | 509 (58.2%) | 366 (41.8%) |
| Business & Financial | 442 (65.6%) | 232 (34.4%) |
| Computers, Engineering & Science | 820 (91.3%) | 78 (8.7%) |
| Computers & Mathematics | 627 (91.1%) | 61 (8.9%) |
| Architecture & Engineering | 164 (90.6%) | 17 (9.4%) |
| Life, Physical & Social Science | 29 (100.0%) | 0 (0.0%) |
| Community & Social Service | 313 (38.6%) | 498 (61.4%) |
| Education, Arts & Media | 118 (61.1%) | 75 (38.9%) |
| Legal Services & Support | 50 (60.2%) | 33 (39.8%) |
| Education Instruction & Library | 48 (11.5%) | 368 (88.5%) |
| Arts, Media & Entertainment | 97 (81.5%) | 22 (18.5%) |
| Health Diagnosing & Treating | 87 (11.8%) | 653 (88.2%) |
| Health Technologists | 84 (16.6%) | 423 (83.4%) |
| Total (Category) | 2,171 (54.3%) | 1,827 (45.7%) |
| Total (Overall) | 4,433 (56.1%) | 3,468 (43.9%) |
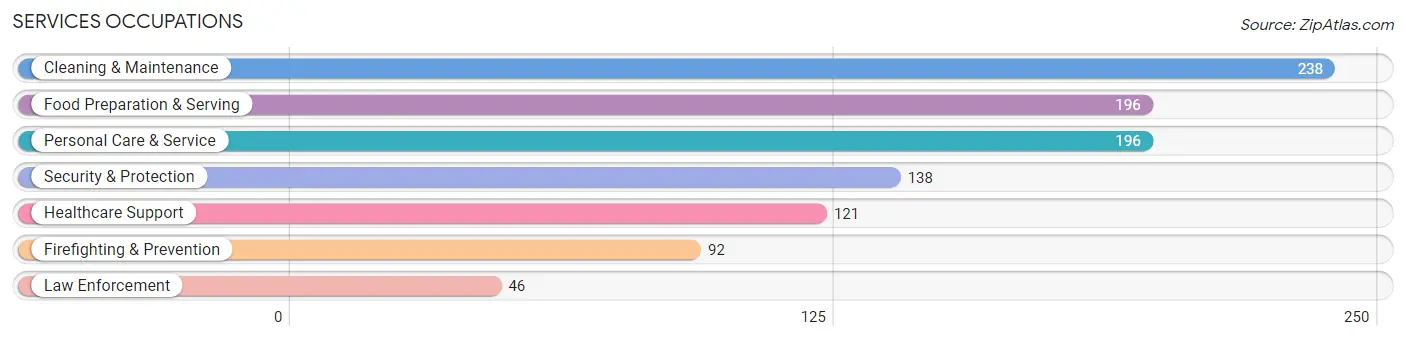
Services Occupations
The most common Services occupations in Middleburg Heights are Cleaning & Maintenance (238 | 3.0%), Food Preparation & Serving (196 | 2.5%), Personal Care & Service (196 | 2.5%), Security & Protection (138 | 1.8%), and Healthcare Support (121 | 1.5%).
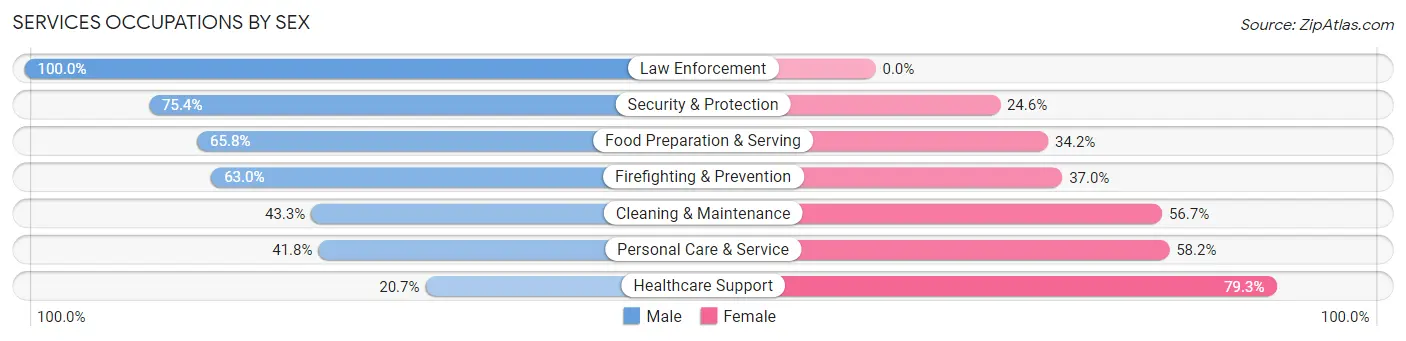
Services Occupations by Sex
Within the Services occupations in Middleburg Heights, the most male-oriented occupations are Law Enforcement (100.0%), Security & Protection (75.4%), and Food Preparation & Serving (65.8%), while the most female-oriented occupations are Healthcare Support (79.3%), Personal Care & Service (58.2%), and Cleaning & Maintenance (56.7%).
| Occupation | Male | Female |
| Healthcare Support | 25 (20.7%) | 96 (79.3%) |
| Security & Protection | 104 (75.4%) | 34 (24.6%) |
| Firefighting & Prevention | 58 (63.0%) | 34 (37.0%) |
| Law Enforcement | 46 (100.0%) | 0 (0.0%) |
| Food Preparation & Serving | 129 (65.8%) | 67 (34.2%) |
| Cleaning & Maintenance | 103 (43.3%) | 135 (56.7%) |
| Personal Care & Service | 82 (41.8%) | 114 (58.2%) |
| Total (Category) | 443 (49.8%) | 446 (50.2%) |
| Total (Overall) | 4,433 (56.1%) | 3,468 (43.9%) |
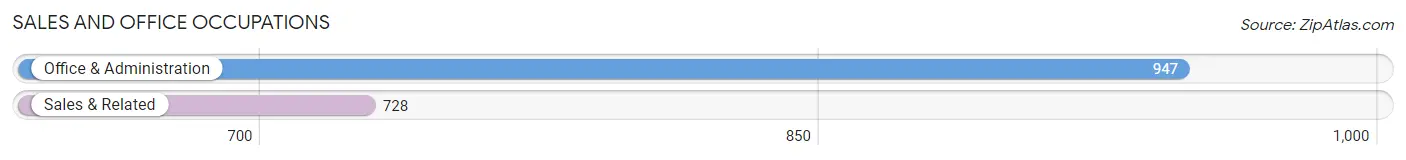
Sales and Office Occupations
The most common Sales and Office occupations in Middleburg Heights are Office & Administration (947 | 12.0%), and Sales & Related (728 | 9.2%).
Sales and Office Occupations by Sex
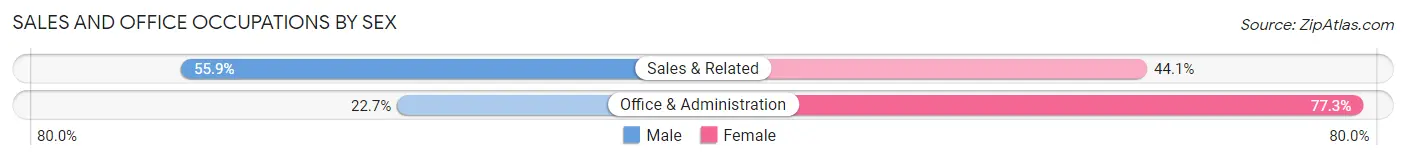
| Occupation | Male | Female |
| Sales & Related | 407 (55.9%) | 321 (44.1%) |
| Office & Administration | 215 (22.7%) | 732 (77.3%) |
| Total (Category) | 622 (37.1%) | 1,053 (62.9%) |
| Total (Overall) | 4,433 (56.1%) | 3,468 (43.9%) |
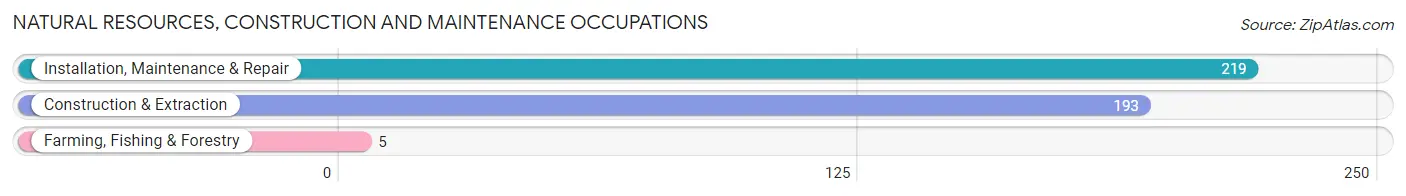
Natural Resources, Construction and Maintenance Occupations
The most common Natural Resources, Construction and Maintenance occupations in Middleburg Heights are Installation, Maintenance & Repair (219 | 2.8%), Construction & Extraction (193 | 2.4%), and Farming, Fishing & Forestry (5 | 0.1%).
Natural Resources, Construction and Maintenance Occupations by Sex
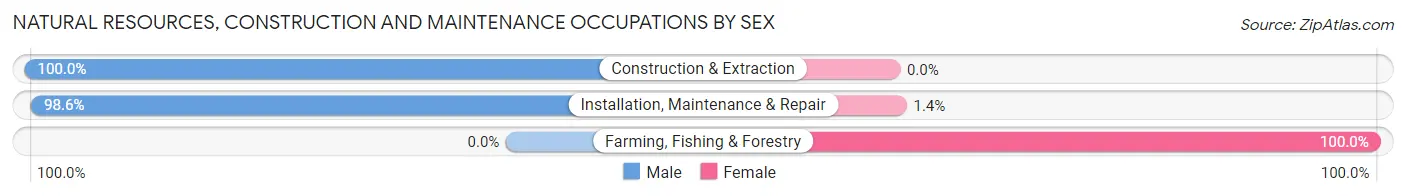
| Occupation | Male | Female |
| Farming, Fishing & Forestry | 0 (0.0%) | 5 (100.0%) |
| Construction & Extraction | 193 (100.0%) | 0 (0.0%) |
| Installation, Maintenance & Repair | 216 (98.6%) | 3 (1.4%) |
| Total (Category) | 409 (98.1%) | 8 (1.9%) |
| Total (Overall) | 4,433 (56.1%) | 3,468 (43.9%) |
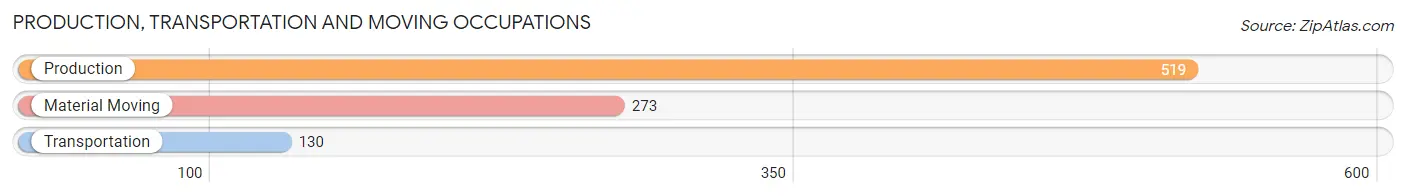
Production, Transportation and Moving Occupations
The most common Production, Transportation and Moving occupations in Middleburg Heights are Production (519 | 6.6%), Material Moving (273 | 3.5%), and Transportation (130 | 1.7%).
Production, Transportation and Moving Occupations by Sex
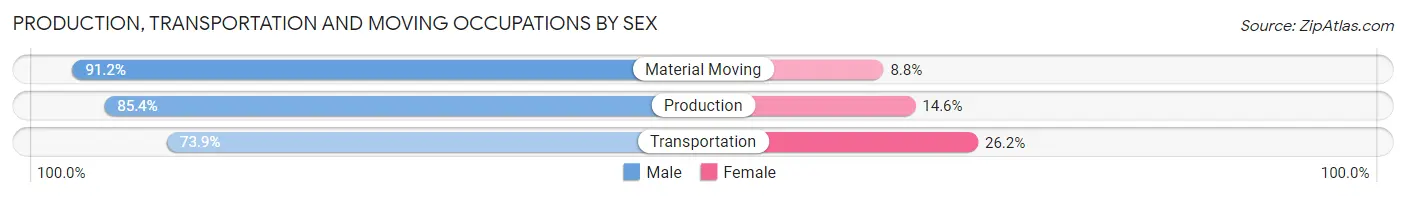
| Occupation | Male | Female |
| Production | 443 (85.4%) | 76 (14.6%) |
| Transportation | 96 (73.9%) | 34 (26.2%) |
| Material Moving | 249 (91.2%) | 24 (8.8%) |
| Total (Category) | 788 (85.5%) | 134 (14.5%) |
| Total (Overall) | 4,433 (56.1%) | 3,468 (43.9%) |
Employment Industries by Sex in Middleburg Heights
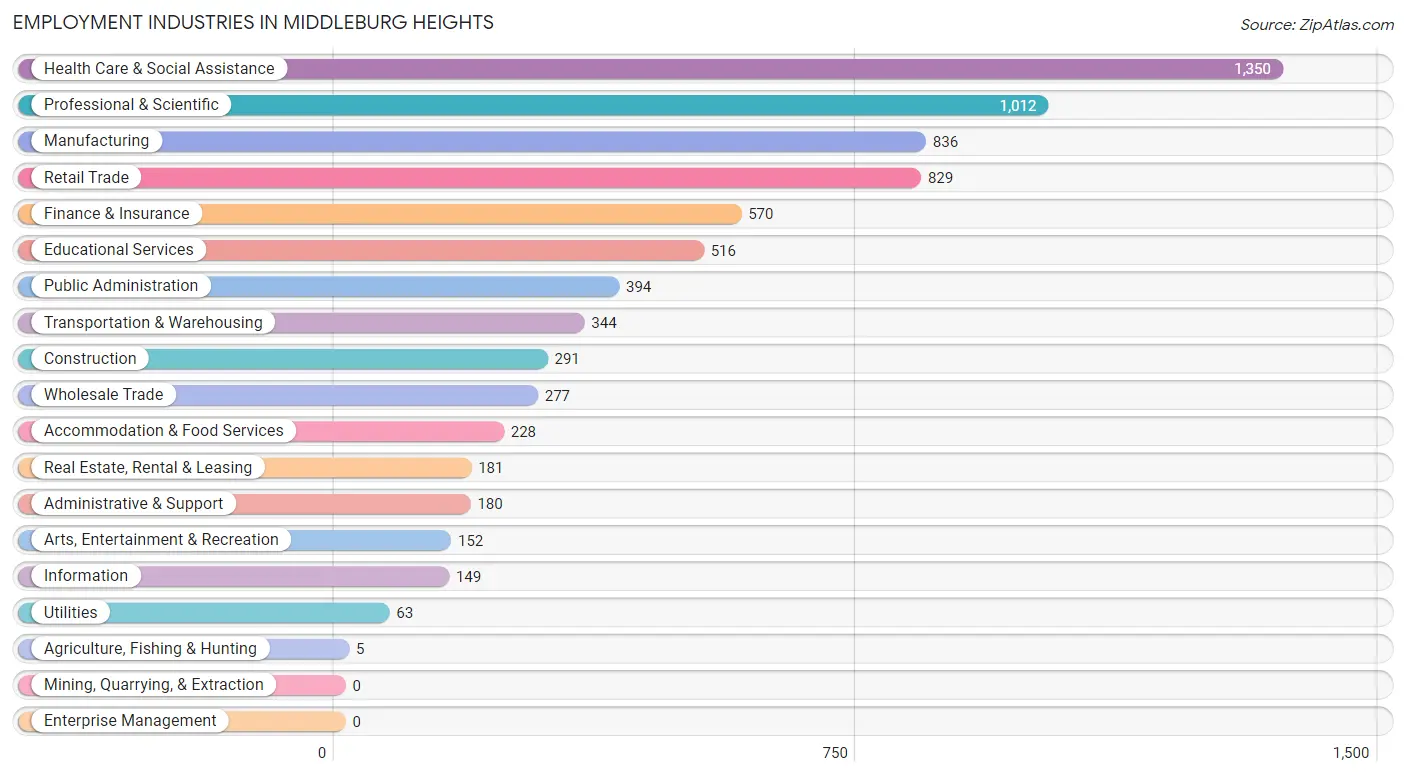
Employment Industries in Middleburg Heights
The major employment industries in Middleburg Heights include Health Care & Social Assistance (1,350 | 17.1%), Professional & Scientific (1,012 | 12.8%), Manufacturing (836 | 10.6%), Retail Trade (829 | 10.5%), and Finance & Insurance (570 | 7.2%).
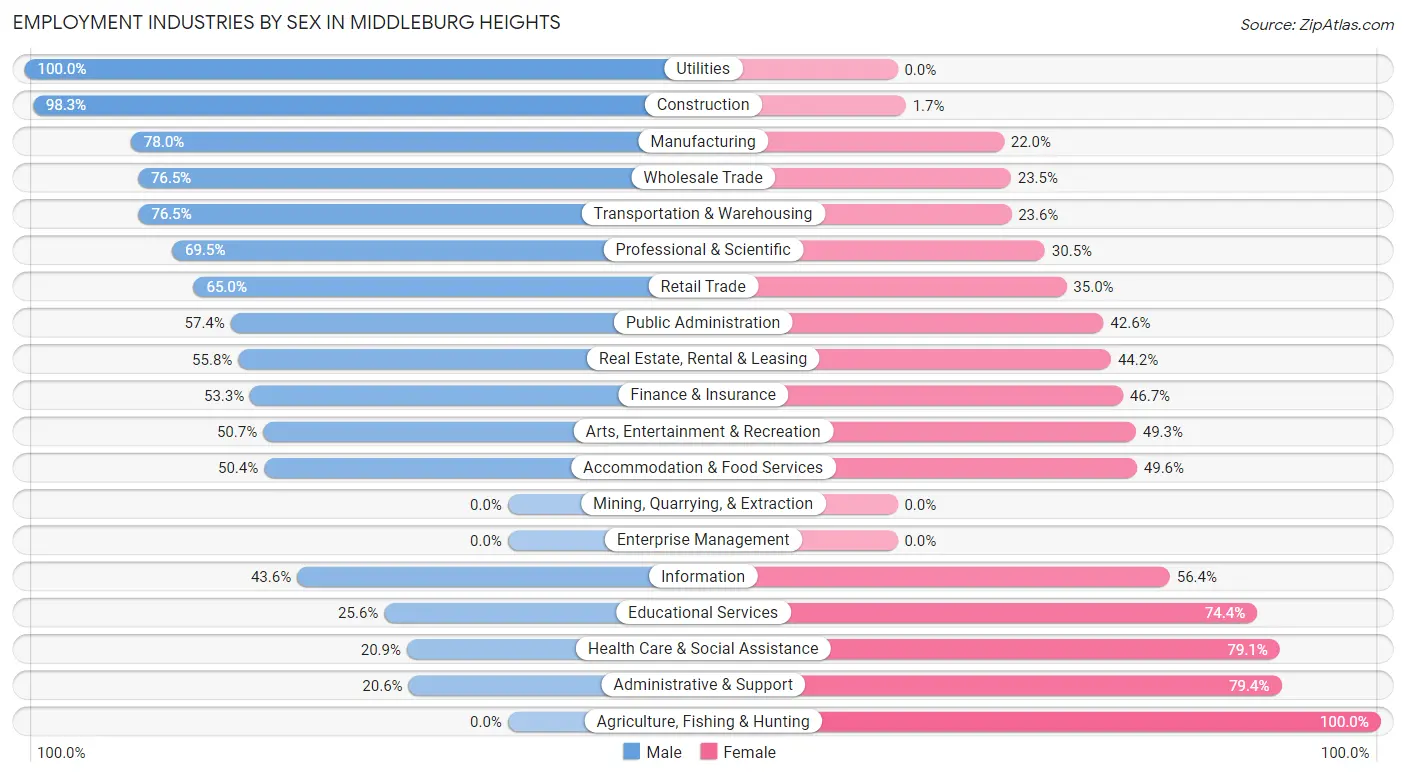
Employment Industries by Sex in Middleburg Heights
The Middleburg Heights industries that see more men than women are Utilities (100.0%), Construction (98.3%), and Manufacturing (78.0%), whereas the industries that tend to have a higher number of women are Agriculture, Fishing & Hunting (100.0%), Administrative & Support (79.4%), and Health Care & Social Assistance (79.1%).
| Industry | Male | Female |
| Agriculture, Fishing & Hunting | 0 (0.0%) | 5 (100.0%) |
| Mining, Quarrying, & Extraction | 0 (0.0%) | 0 (0.0%) |
| Construction | 286 (98.3%) | 5 (1.7%) |
| Manufacturing | 652 (78.0%) | 184 (22.0%) |
| Wholesale Trade | 212 (76.5%) | 65 (23.5%) |
| Retail Trade | 539 (65.0%) | 290 (35.0%) |
| Transportation & Warehousing | 263 (76.4%) | 81 (23.5%) |
| Utilities | 63 (100.0%) | 0 (0.0%) |
| Information | 65 (43.6%) | 84 (56.4%) |
| Finance & Insurance | 304 (53.3%) | 266 (46.7%) |
| Real Estate, Rental & Leasing | 101 (55.8%) | 80 (44.2%) |
| Professional & Scientific | 703 (69.5%) | 309 (30.5%) |
| Enterprise Management | 0 (0.0%) | 0 (0.0%) |
| Administrative & Support | 37 (20.6%) | 143 (79.4%) |
| Educational Services | 132 (25.6%) | 384 (74.4%) |
| Health Care & Social Assistance | 282 (20.9%) | 1,068 (79.1%) |
| Arts, Entertainment & Recreation | 77 (50.7%) | 75 (49.3%) |
| Accommodation & Food Services | 115 (50.4%) | 113 (49.6%) |
| Public Administration | 226 (57.4%) | 168 (42.6%) |
| Total | 4,433 (56.1%) | 3,468 (43.9%) |
Education in Middleburg Heights
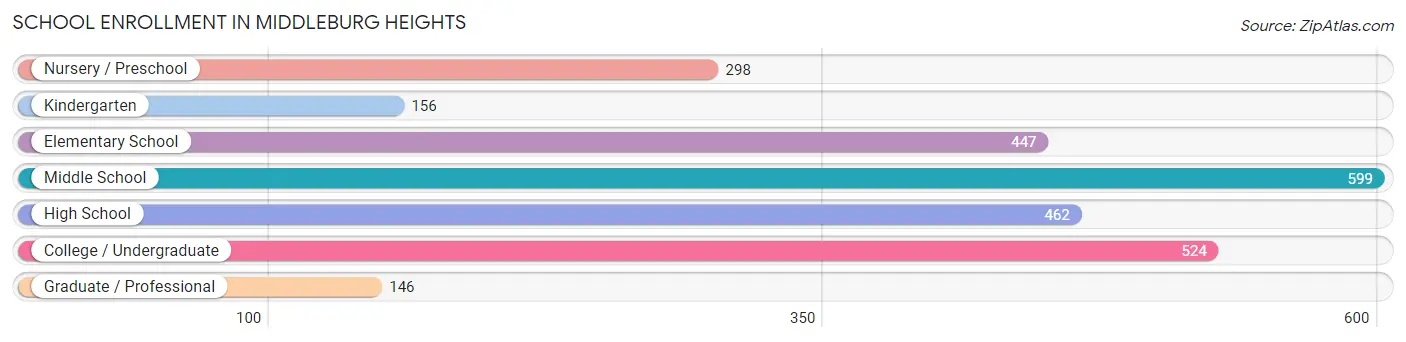
School Enrollment in Middleburg Heights
The most common levels of schooling among the 2,632 students in Middleburg Heights are middle school (599 | 22.8%), college / undergraduate (524 | 19.9%), and high school (462 | 17.5%).
| School Level | # Students | % Students |
| Nursery / Preschool | 298 | 11.3% |
| Kindergarten | 156 | 5.9% |
| Elementary School | 447 | 17.0% |
| Middle School | 599 | 22.8% |
| High School | 462 | 17.5% |
| College / Undergraduate | 524 | 19.9% |
| Graduate / Professional | 146 | 5.6% |
| Total | 2,632 | 100.0% |
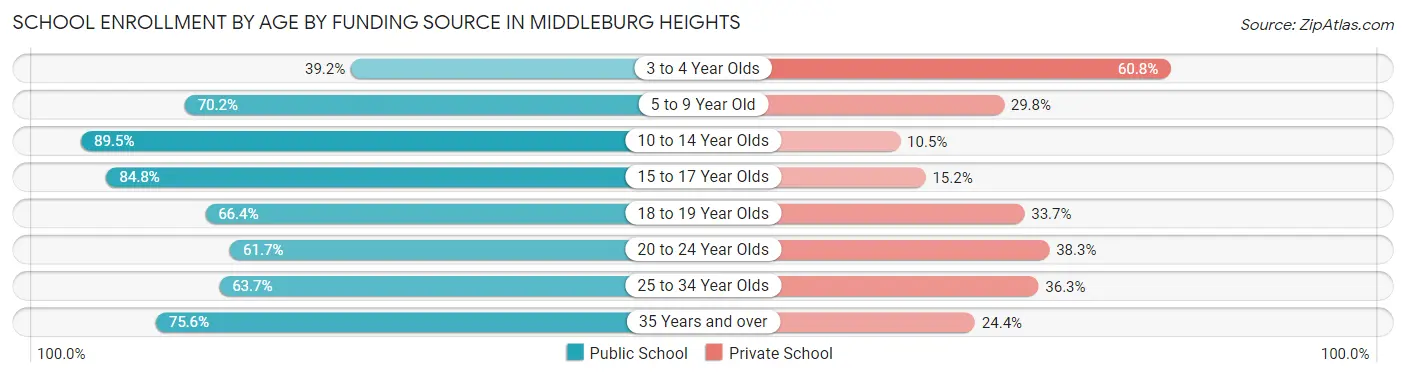
School Enrollment by Age by Funding Source in Middleburg Heights
Out of a total of 2,632 students who are enrolled in schools in Middleburg Heights, 684 (26.0%) attend a private institution, while the remaining 1,948 (74.0%) are enrolled in public schools. The age group of 3 to 4 year olds has the highest likelihood of being enrolled in private schools, with 152 (60.8% in the age bracket) enrolled. Conversely, the age group of 10 to 14 year olds has the lowest likelihood of being enrolled in a private school, with 706 (89.5% in the age bracket) attending a public institution.
| Age Bracket | Public School | Private School |
| 3 to 4 Year Olds | 98 (39.2%) | 152 (60.8%) |
| 5 to 9 Year Old | 381 (70.2%) | 162 (29.8%) |
| 10 to 14 Year Olds | 706 (89.5%) | 83 (10.5%) |
| 15 to 17 Year Olds | 278 (84.8%) | 50 (15.2%) |
| 18 to 19 Year Olds | 69 (66.3%) | 35 (33.7%) |
| 20 to 24 Year Olds | 137 (61.7%) | 85 (38.3%) |
| 25 to 34 Year Olds | 109 (63.7%) | 62 (36.3%) |
| 35 Years and over | 170 (75.6%) | 55 (24.4%) |
| Total | 1,948 (74.0%) | 684 (26.0%) |
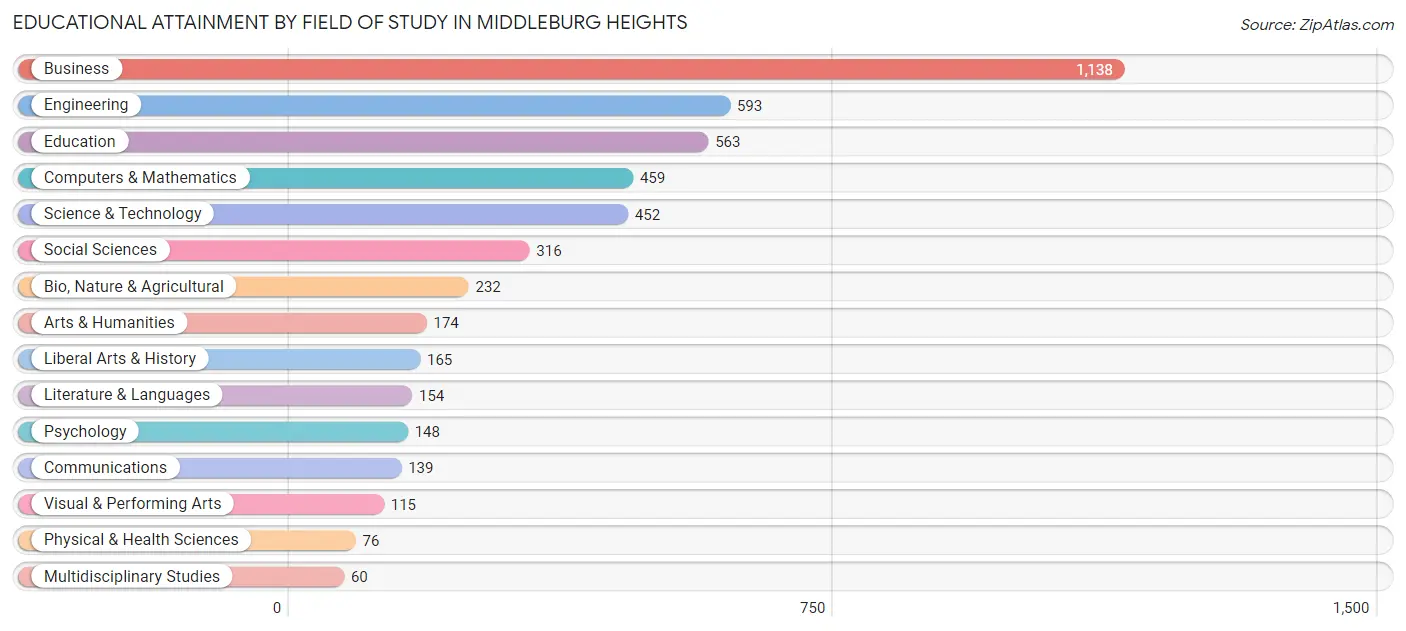
Educational Attainment by Field of Study in Middleburg Heights
Business (1,138 | 23.8%), engineering (593 | 12.4%), education (563 | 11.8%), computers & mathematics (459 | 9.6%), and science & technology (452 | 9.5%) are the most common fields of study among 4,784 individuals in Middleburg Heights who have obtained a bachelor's degree or higher.
| Field of Study | # Graduates | % Graduates |
| Computers & Mathematics | 459 | 9.6% |
| Bio, Nature & Agricultural | 232 | 4.9% |
| Physical & Health Sciences | 76 | 1.6% |
| Psychology | 148 | 3.1% |
| Social Sciences | 316 | 6.6% |
| Engineering | 593 | 12.4% |
| Multidisciplinary Studies | 60 | 1.3% |
| Science & Technology | 452 | 9.5% |
| Business | 1,138 | 23.8% |
| Education | 563 | 11.8% |
| Literature & Languages | 154 | 3.2% |
| Liberal Arts & History | 165 | 3.5% |
| Visual & Performing Arts | 115 | 2.4% |
| Communications | 139 | 2.9% |
| Arts & Humanities | 174 | 3.6% |
| Total | 4,784 | 100.0% |
Transportation & Commute in Middleburg Heights
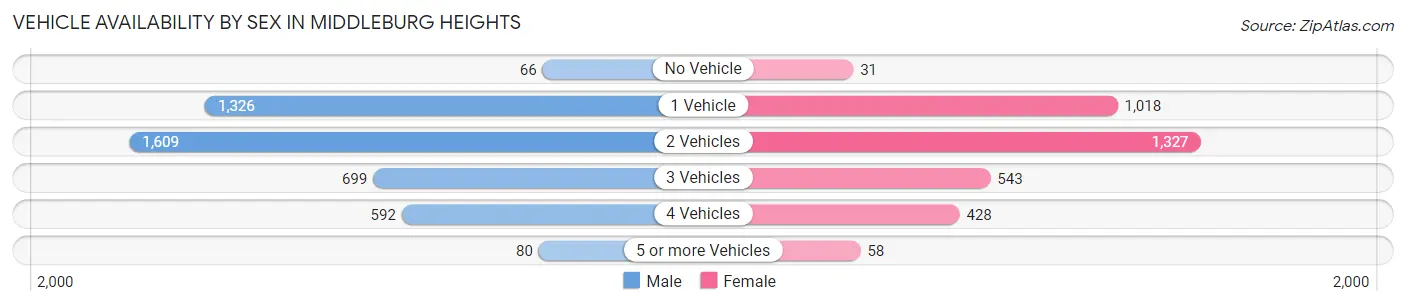
Vehicle Availability by Sex in Middleburg Heights
The most prevalent vehicle ownership categories in Middleburg Heights are males with 2 vehicles (1,609, accounting for 36.8%) and females with 2 vehicles (1,327, making up 47.2%).
| Vehicles Available | Male | Female |
| No Vehicle | 66 (1.5%) | 31 (0.9%) |
| 1 Vehicle | 1,326 (30.3%) | 1,018 (29.9%) |
| 2 Vehicles | 1,609 (36.8%) | 1,327 (39.0%) |
| 3 Vehicles | 699 (16.0%) | 543 (16.0%) |
| 4 Vehicles | 592 (13.5%) | 428 (12.6%) |
| 5 or more Vehicles | 80 (1.8%) | 58 (1.7%) |
| Total | 4,372 (100.0%) | 3,405 (100.0%) |
Commute Time in Middleburg Heights
The most frequently occuring commute durations in Middleburg Heights are 20 to 24 minutes (1,406 commuters, 20.0%), 30 to 34 minutes (999 commuters, 14.2%), and 10 to 14 minutes (990 commuters, 14.1%).
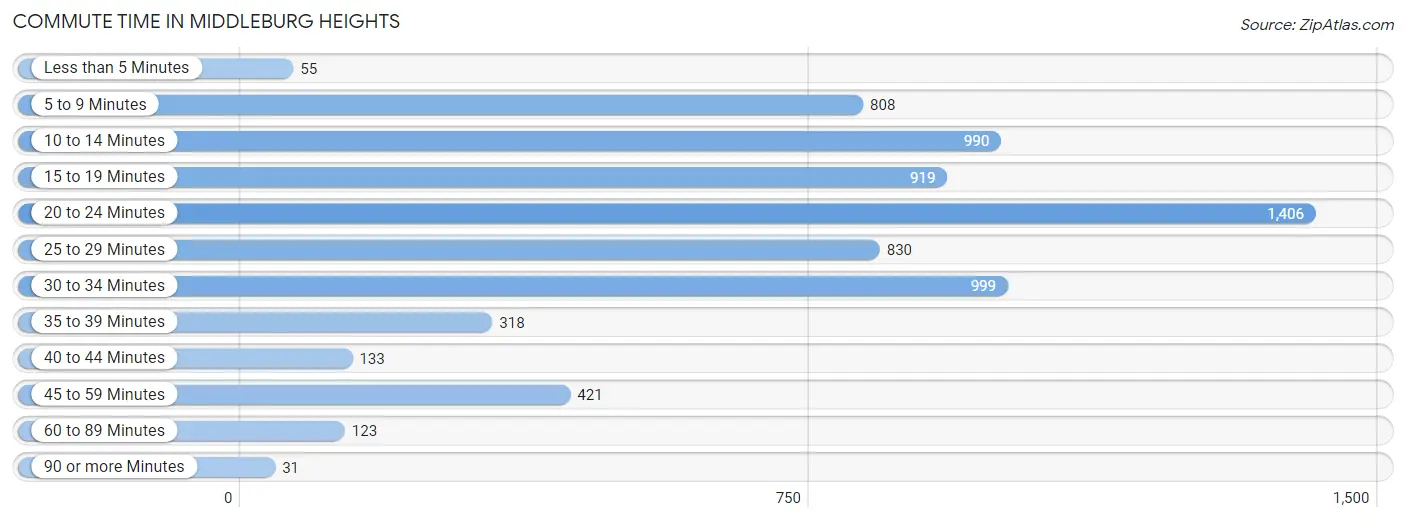
| Commute Time | # Commuters | % Commuters |
| Less than 5 Minutes | 55 | 0.8% |
| 5 to 9 Minutes | 808 | 11.5% |
| 10 to 14 Minutes | 990 | 14.1% |
| 15 to 19 Minutes | 919 | 13.1% |
| 20 to 24 Minutes | 1,406 | 20.0% |
| 25 to 29 Minutes | 830 | 11.8% |
| 30 to 34 Minutes | 999 | 14.2% |
| 35 to 39 Minutes | 318 | 4.5% |
| 40 to 44 Minutes | 133 | 1.9% |
| 45 to 59 Minutes | 421 | 6.0% |
| 60 to 89 Minutes | 123 | 1.8% |
| 90 or more Minutes | 31 | 0.4% |
Commute Time by Sex in Middleburg Heights
The most common commute times in Middleburg Heights are 20 to 24 minutes (802 commuters, 20.5%) for males and 20 to 24 minutes (604 commuters, 19.3%) for females.
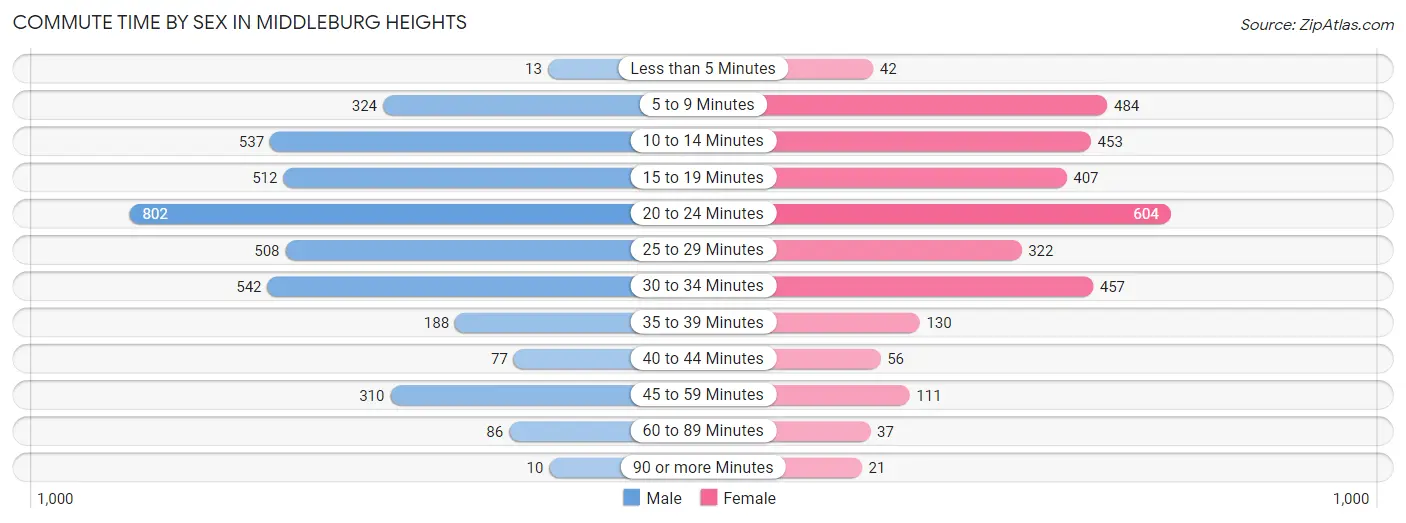
| Commute Time | Male | Female |
| Less than 5 Minutes | 13 (0.3%) | 42 (1.3%) |
| 5 to 9 Minutes | 324 (8.3%) | 484 (15.5%) |
| 10 to 14 Minutes | 537 (13.7%) | 453 (14.5%) |
| 15 to 19 Minutes | 512 (13.1%) | 407 (13.0%) |
| 20 to 24 Minutes | 802 (20.5%) | 604 (19.3%) |
| 25 to 29 Minutes | 508 (13.0%) | 322 (10.3%) |
| 30 to 34 Minutes | 542 (13.9%) | 457 (14.6%) |
| 35 to 39 Minutes | 188 (4.8%) | 130 (4.2%) |
| 40 to 44 Minutes | 77 (2.0%) | 56 (1.8%) |
| 45 to 59 Minutes | 310 (7.9%) | 111 (3.5%) |
| 60 to 89 Minutes | 86 (2.2%) | 37 (1.2%) |
| 90 or more Minutes | 10 (0.3%) | 21 (0.7%) |
Time of Departure to Work by Sex in Middleburg Heights
The most frequent times of departure to work in Middleburg Heights are 6:30 AM to 6:59 AM (589, 15.1%) for males and 7:30 AM to 7:59 AM (584, 18.7%) for females.
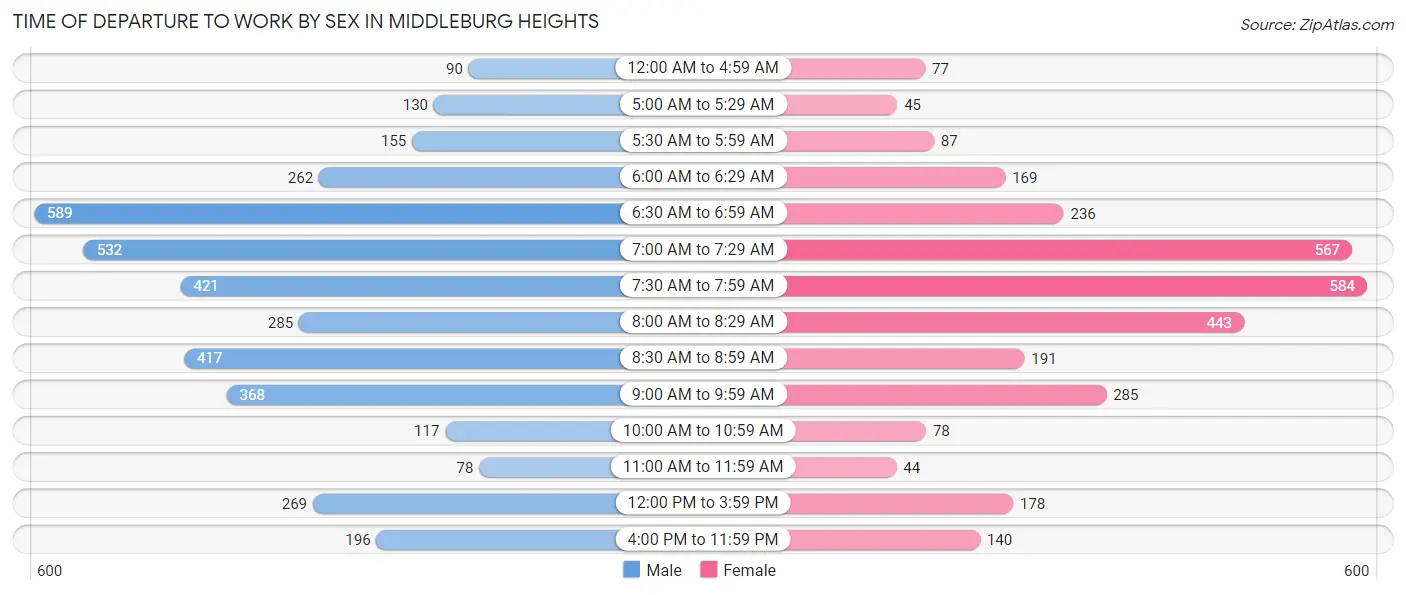
| Time of Departure | Male | Female |
| 12:00 AM to 4:59 AM | 90 (2.3%) | 77 (2.5%) |
| 5:00 AM to 5:29 AM | 130 (3.3%) | 45 (1.4%) |
| 5:30 AM to 5:59 AM | 155 (4.0%) | 87 (2.8%) |
| 6:00 AM to 6:29 AM | 262 (6.7%) | 169 (5.4%) |
| 6:30 AM to 6:59 AM | 589 (15.1%) | 236 (7.5%) |
| 7:00 AM to 7:29 AM | 532 (13.6%) | 567 (18.1%) |
| 7:30 AM to 7:59 AM | 421 (10.8%) | 584 (18.7%) |
| 8:00 AM to 8:29 AM | 285 (7.3%) | 443 (14.2%) |
| 8:30 AM to 8:59 AM | 417 (10.7%) | 191 (6.1%) |
| 9:00 AM to 9:59 AM | 368 (9.4%) | 285 (9.1%) |
| 10:00 AM to 10:59 AM | 117 (3.0%) | 78 (2.5%) |
| 11:00 AM to 11:59 AM | 78 (2.0%) | 44 (1.4%) |
| 12:00 PM to 3:59 PM | 269 (6.9%) | 178 (5.7%) |
| 4:00 PM to 11:59 PM | 196 (5.0%) | 140 (4.5%) |
| Total | 3,909 (100.0%) | 3,124 (100.0%) |
Housing Occupancy in Middleburg Heights
Occupancy by Ownership in Middleburg Heights
Of the total 7,474 dwellings in Middleburg Heights, owner-occupied units account for 5,168 (69.2%), while renter-occupied units make up 2,306 (30.8%).
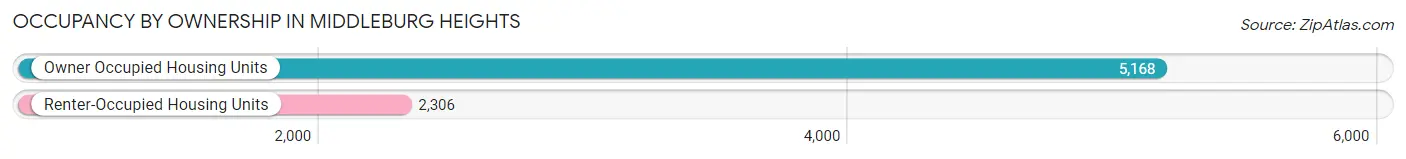
| Occupancy | # Housing Units | % Housing Units |
| Owner Occupied Housing Units | 5,168 | 69.2% |
| Renter-Occupied Housing Units | 2,306 | 30.8% |
| Total Occupied Housing Units | 7,474 | 100.0% |
Occupancy by Household Size in Middleburg Heights
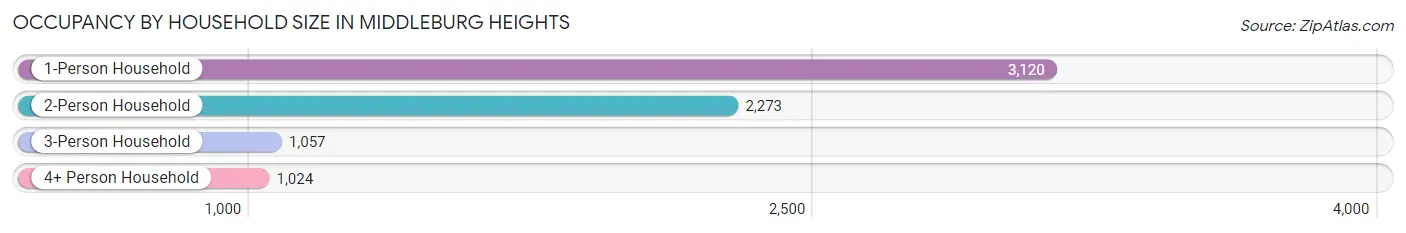
| Household Size | # Housing Units | % Housing Units |
| 1-Person Household | 3,120 | 41.7% |
| 2-Person Household | 2,273 | 30.4% |
| 3-Person Household | 1,057 | 14.1% |
| 4+ Person Household | 1,024 | 13.7% |
| Total Housing Units | 7,474 | 100.0% |
Occupancy by Ownership by Household Size in Middleburg Heights
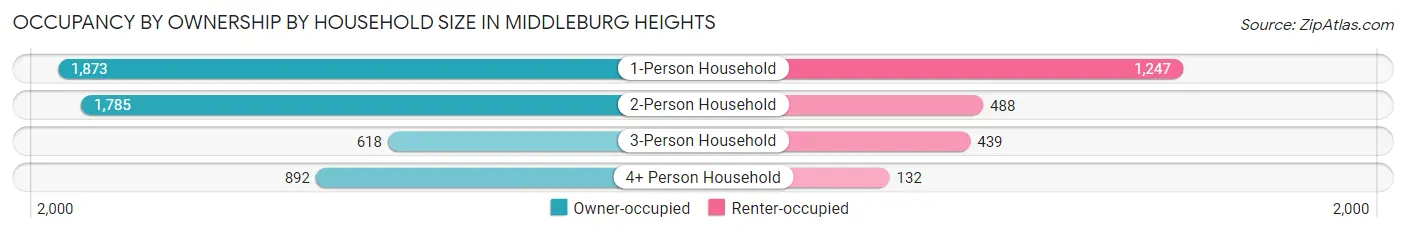
| Household Size | Owner-occupied | Renter-occupied |
| 1-Person Household | 1,873 (60.0%) | 1,247 (40.0%) |
| 2-Person Household | 1,785 (78.5%) | 488 (21.5%) |
| 3-Person Household | 618 (58.5%) | 439 (41.5%) |
| 4+ Person Household | 892 (87.1%) | 132 (12.9%) |
| Total Housing Units | 5,168 (69.2%) | 2,306 (30.8%) |
Occupancy by Educational Attainment in Middleburg Heights
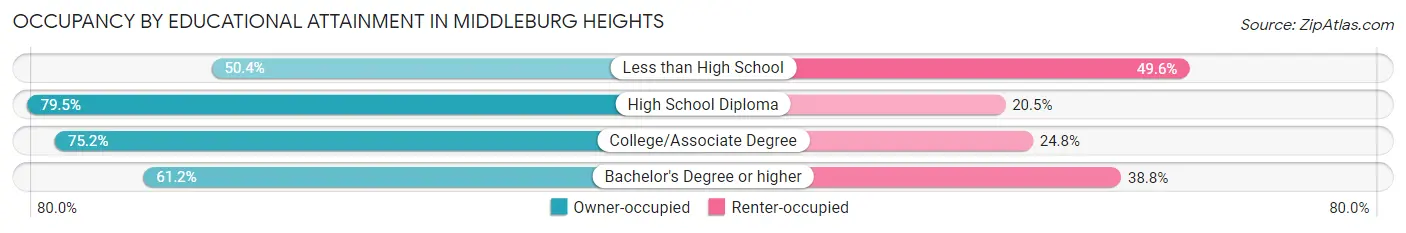
| Household Size | Owner-occupied | Renter-occupied |
| Less than High School | 280 (50.4%) | 276 (49.6%) |
| High School Diploma | 1,519 (79.5%) | 391 (20.5%) |
| College/Associate Degree | 1,643 (75.2%) | 543 (24.8%) |
| Bachelor's Degree or higher | 1,726 (61.2%) | 1,096 (38.8%) |
Occupancy by Age of Householder in Middleburg Heights
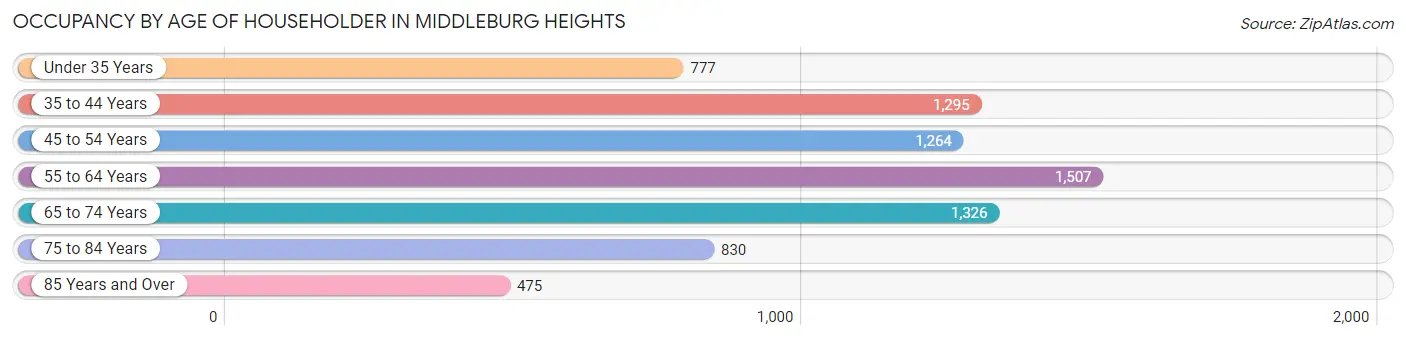
| Age Bracket | # Households | % Households |
| Under 35 Years | 777 | 10.4% |
| 35 to 44 Years | 1,295 | 17.3% |
| 45 to 54 Years | 1,264 | 16.9% |
| 55 to 64 Years | 1,507 | 20.2% |
| 65 to 74 Years | 1,326 | 17.7% |
| 75 to 84 Years | 830 | 11.1% |
| 85 Years and Over | 475 | 6.4% |
| Total | 7,474 | 100.0% |
Housing Finances in Middleburg Heights
Median Income by Occupancy in Middleburg Heights
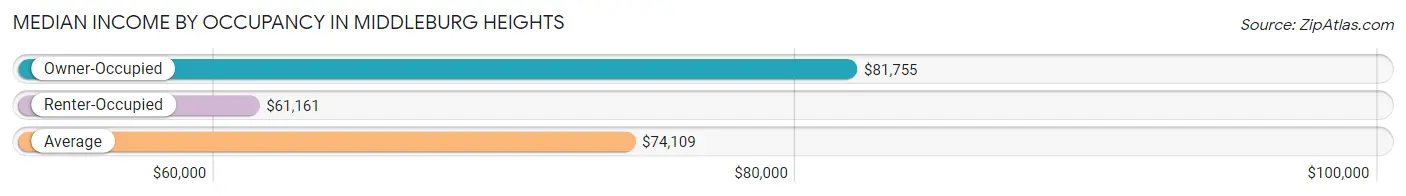
| Occupancy Type | # Households | Median Income |
| Owner-Occupied | 5,168 (69.2%) | $81,755 |
| Renter-Occupied | 2,306 (30.8%) | $61,161 |
| Average | 7,474 (100.0%) | $74,109 |
Occupancy by Householder Income Bracket in Middleburg Heights
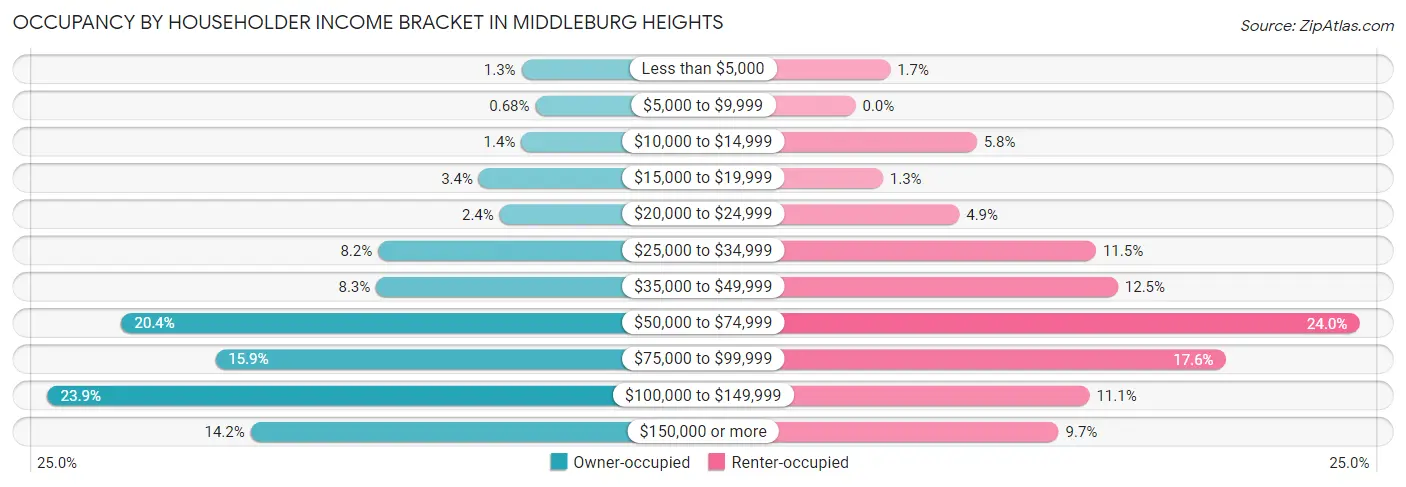
| Income Bracket | Owner-occupied | Renter-occupied |
| Less than $5,000 | 69 (1.3%) | 38 (1.7%) |
| $5,000 to $9,999 | 35 (0.7%) | 0 (0.0%) |
| $10,000 to $14,999 | 70 (1.3%) | 133 (5.8%) |
| $15,000 to $19,999 | 174 (3.4%) | 30 (1.3%) |
| $20,000 to $24,999 | 123 (2.4%) | 114 (4.9%) |
| $25,000 to $34,999 | 422 (8.2%) | 264 (11.5%) |
| $35,000 to $49,999 | 427 (8.3%) | 288 (12.5%) |
| $50,000 to $74,999 | 1,054 (20.4%) | 553 (24.0%) |
| $75,000 to $99,999 | 823 (15.9%) | 406 (17.6%) |
| $100,000 to $149,999 | 1,235 (23.9%) | 257 (11.1%) |
| $150,000 or more | 736 (14.2%) | 223 (9.7%) |
| Total | 5,168 (100.0%) | 2,306 (100.0%) |
Monthly Housing Cost Tiers in Middleburg Heights
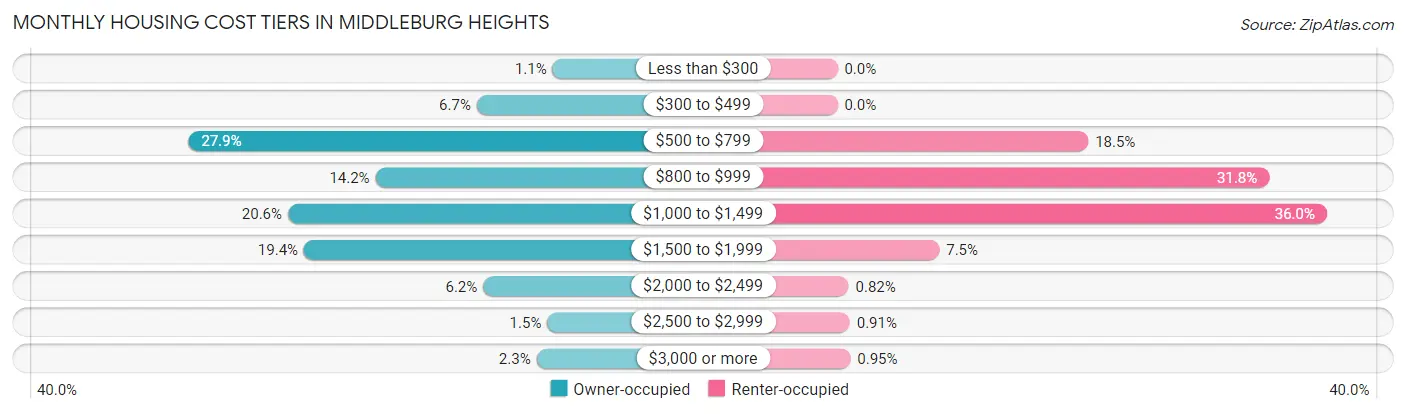
| Monthly Cost | Owner-occupied | Renter-occupied |
| Less than $300 | 58 (1.1%) | 0 (0.0%) |
| $300 to $499 | 346 (6.7%) | 0 (0.0%) |
| $500 to $799 | 1,444 (27.9%) | 426 (18.5%) |
| $800 to $999 | 732 (14.2%) | 733 (31.8%) |
| $1,000 to $1,499 | 1,065 (20.6%) | 831 (36.0%) |
| $1,500 to $1,999 | 1,004 (19.4%) | 173 (7.5%) |
| $2,000 to $2,499 | 322 (6.2%) | 19 (0.8%) |
| $2,500 to $2,999 | 78 (1.5%) | 21 (0.9%) |
| $3,000 or more | 119 (2.3%) | 22 (0.9%) |
| Total | 5,168 (100.0%) | 2,306 (100.0%) |
Physical Housing Characteristics in Middleburg Heights
Housing Structures in Middleburg Heights
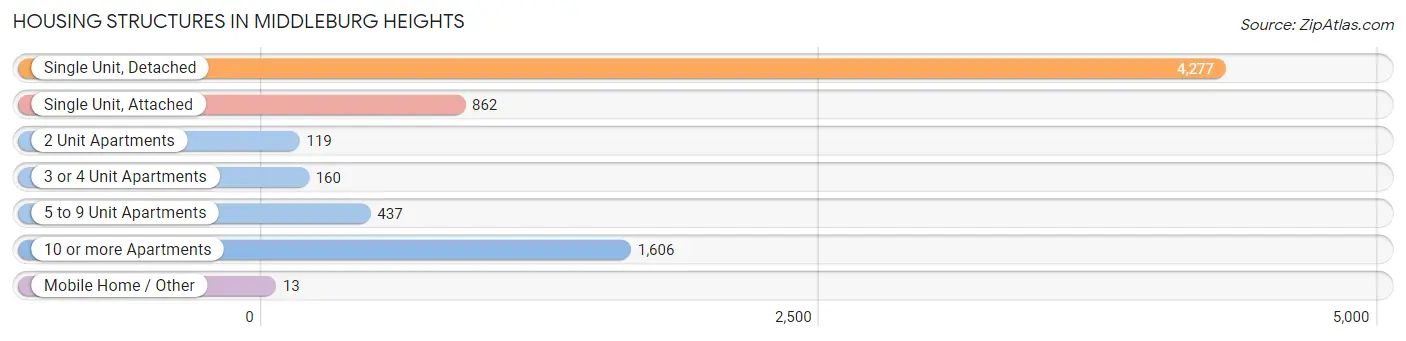
| Structure Type | # Housing Units | % Housing Units |
| Single Unit, Detached | 4,277 | 57.2% |
| Single Unit, Attached | 862 | 11.5% |
| 2 Unit Apartments | 119 | 1.6% |
| 3 or 4 Unit Apartments | 160 | 2.1% |
| 5 to 9 Unit Apartments | 437 | 5.9% |
| 10 or more Apartments | 1,606 | 21.5% |
| Mobile Home / Other | 13 | 0.2% |
| Total | 7,474 | 100.0% |
Housing Structures by Occupancy in Middleburg Heights
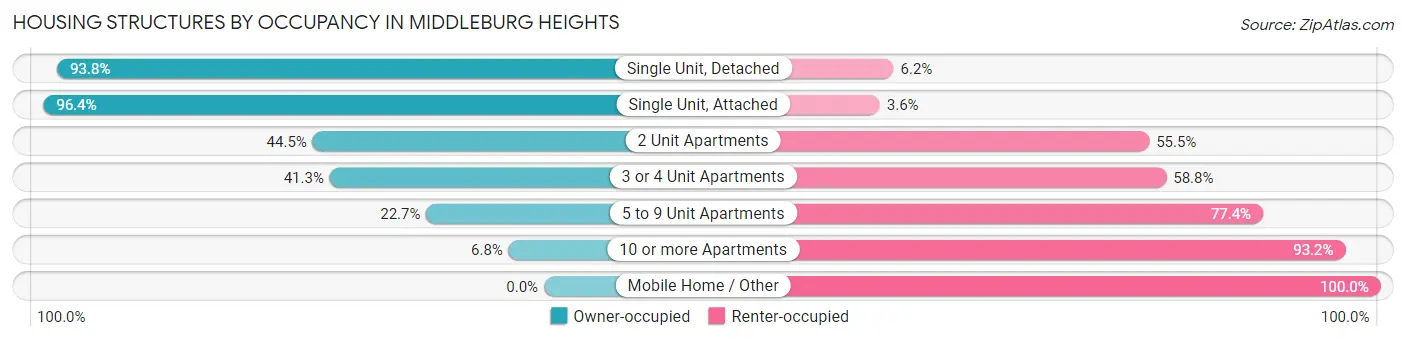
| Structure Type | Owner-occupied | Renter-occupied |
| Single Unit, Detached | 4,010 (93.8%) | 267 (6.2%) |
| Single Unit, Attached | 831 (96.4%) | 31 (3.6%) |
| 2 Unit Apartments | 53 (44.5%) | 66 (55.5%) |
| 3 or 4 Unit Apartments | 66 (41.2%) | 94 (58.8%) |
| 5 to 9 Unit Apartments | 99 (22.7%) | 338 (77.3%) |
| 10 or more Apartments | 109 (6.8%) | 1,497 (93.2%) |
| Mobile Home / Other | 0 (0.0%) | 13 (100.0%) |
| Total | 5,168 (69.2%) | 2,306 (30.8%) |
Housing Structures by Number of Rooms in Middleburg Heights
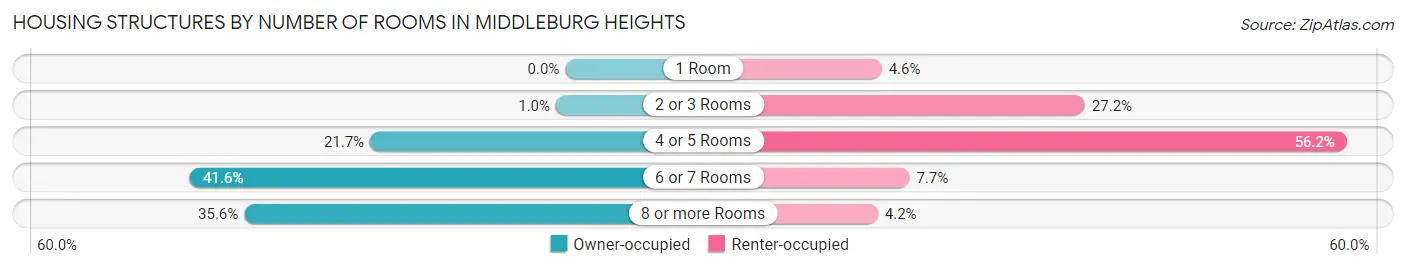
| Number of Rooms | Owner-occupied | Renter-occupied |
| 1 Room | 0 (0.0%) | 107 (4.6%) |
| 2 or 3 Rooms | 54 (1.0%) | 627 (27.2%) |
| 4 or 5 Rooms | 1,120 (21.7%) | 1,297 (56.2%) |
| 6 or 7 Rooms | 2,152 (41.6%) | 178 (7.7%) |
| 8 or more Rooms | 1,842 (35.6%) | 97 (4.2%) |
| Total | 5,168 (100.0%) | 2,306 (100.0%) |
Housing Structure by Heating Type in Middleburg Heights
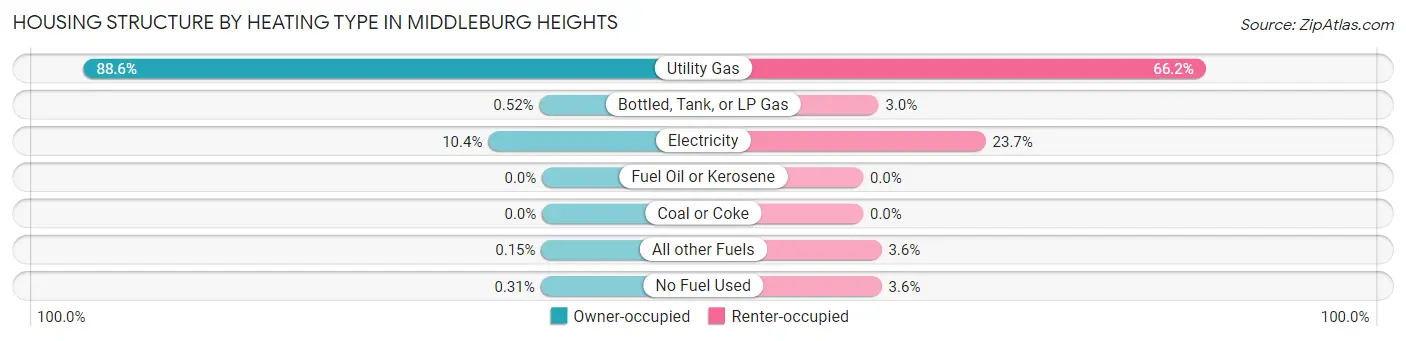
| Heating Type | Owner-occupied | Renter-occupied |
| Utility Gas | 4,579 (88.6%) | 1,526 (66.2%) |
| Bottled, Tank, or LP Gas | 27 (0.5%) | 69 (3.0%) |
| Electricity | 538 (10.4%) | 546 (23.7%) |
| Fuel Oil or Kerosene | 0 (0.0%) | 0 (0.0%) |
| Coal or Coke | 0 (0.0%) | 0 (0.0%) |
| All other Fuels | 8 (0.2%) | 82 (3.6%) |
| No Fuel Used | 16 (0.3%) | 83 (3.6%) |
| Total | 5,168 (100.0%) | 2,306 (100.0%) |
Household Vehicle Usage in Middleburg Heights
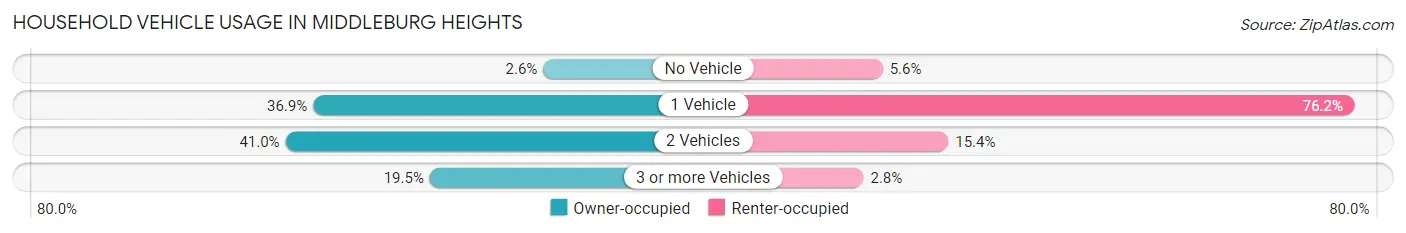
| Vehicles per Household | Owner-occupied | Renter-occupied |
| No Vehicle | 132 (2.5%) | 130 (5.6%) |
| 1 Vehicle | 1,908 (36.9%) | 1,756 (76.1%) |
| 2 Vehicles | 2,121 (41.0%) | 356 (15.4%) |
| 3 or more Vehicles | 1,007 (19.5%) | 64 (2.8%) |
| Total | 5,168 (100.0%) | 2,306 (100.0%) |
Real Estate & Mortgages in Middleburg Heights
Real Estate and Mortgage Overview in Middleburg Heights
| Characteristic | Without Mortgage | With Mortgage |
| Housing Units | 2,310 | 2,858 |
| Median Property Value | $195,900 | $205,800 |
| Median Household Income | $61,786 | $535 |
| Monthly Housing Costs | $656 | $110 |
| Real Estate Taxes | $4,083 | $56 |
Property Value by Mortgage Status in Middleburg Heights
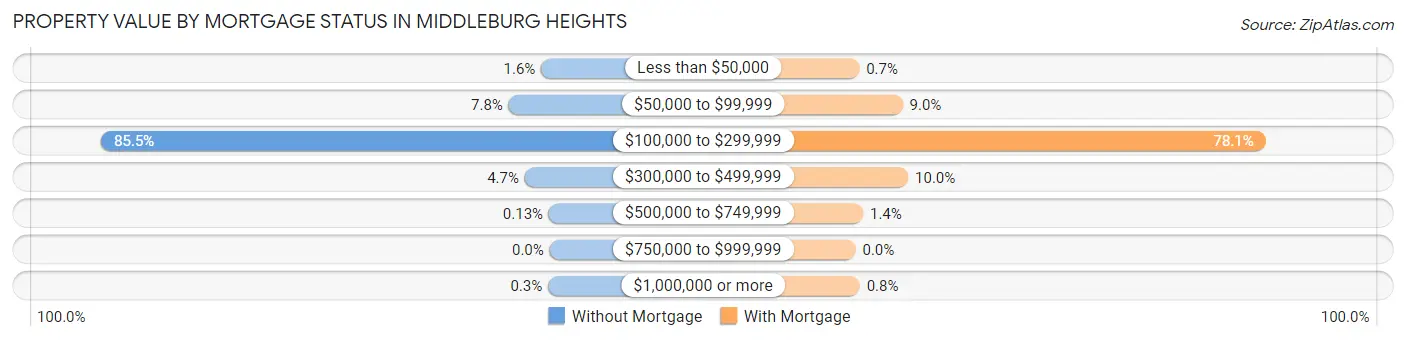
| Property Value | Without Mortgage | With Mortgage |
| Less than $50,000 | 37 (1.6%) | 20 (0.7%) |
| $50,000 to $99,999 | 180 (7.8%) | 256 (9.0%) |
| $100,000 to $299,999 | 1,974 (85.5%) | 2,232 (78.1%) |
| $300,000 to $499,999 | 109 (4.7%) | 286 (10.0%) |
| $500,000 to $749,999 | 3 (0.1%) | 41 (1.4%) |
| $750,000 to $999,999 | 0 (0.0%) | 0 (0.0%) |
| $1,000,000 or more | 7 (0.3%) | 23 (0.8%) |
| Total | 2,310 (100.0%) | 2,858 (100.0%) |
Household Income by Mortgage Status in Middleburg Heights
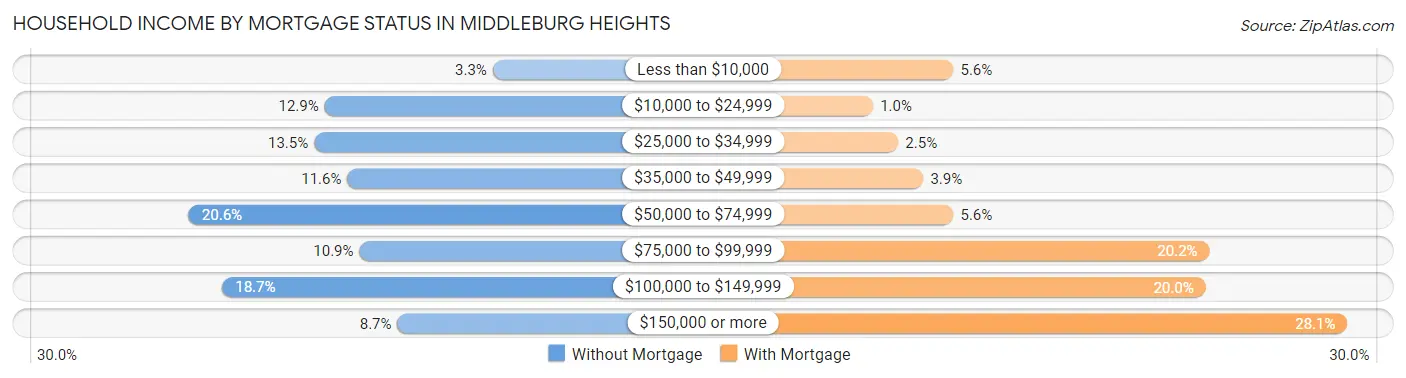
| Household Income | Without Mortgage | With Mortgage |
| Less than $10,000 | 75 (3.3%) | 160 (5.6%) |
| $10,000 to $24,999 | 297 (12.9%) | 29 (1.0%) |
| $25,000 to $34,999 | 311 (13.5%) | 70 (2.5%) |
| $35,000 to $49,999 | 267 (11.6%) | 111 (3.9%) |
| $50,000 to $74,999 | 476 (20.6%) | 160 (5.6%) |
| $75,000 to $99,999 | 251 (10.9%) | 578 (20.2%) |
| $100,000 to $149,999 | 432 (18.7%) | 572 (20.0%) |
| $150,000 or more | 201 (8.7%) | 803 (28.1%) |
| Total | 2,310 (100.0%) | 2,858 (100.0%) |
Property Value to Household Income Ratio in Middleburg Heights
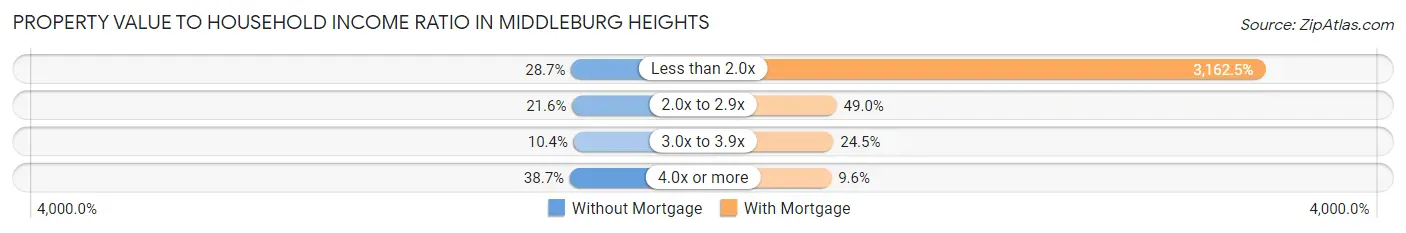
| Value-to-Income Ratio | Without Mortgage | With Mortgage |
| Less than 2.0x | 664 (28.7%) | 90,385 (3,162.5%) |
| 2.0x to 2.9x | 499 (21.6%) | 1,401 (49.0%) |
| 3.0x to 3.9x | 239 (10.3%) | 700 (24.5%) |
| 4.0x or more | 893 (38.7%) | 273 (9.6%) |
| Total | 2,310 (100.0%) | 2,858 (100.0%) |
Real Estate Taxes by Mortgage Status in Middleburg Heights
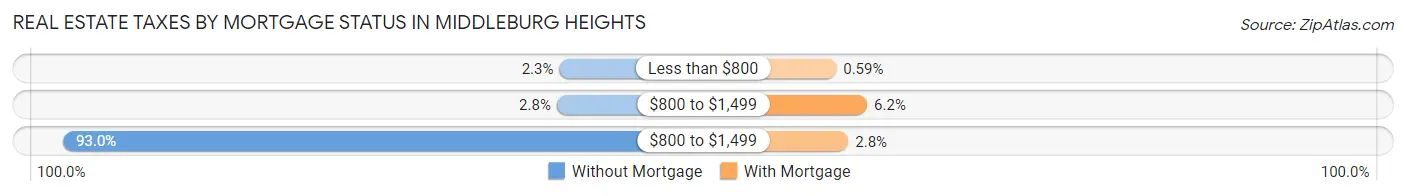
| Property Taxes | Without Mortgage | With Mortgage |
| Less than $800 | 54 (2.3%) | 17 (0.6%) |
| $800 to $1,499 | 65 (2.8%) | 178 (6.2%) |
| $800 to $1,499 | 2,148 (93.0%) | 80 (2.8%) |
| Total | 2,310 (100.0%) | 2,858 (100.0%) |
Health & Disability in Middleburg Heights
Health Insurance Coverage by Age in Middleburg Heights
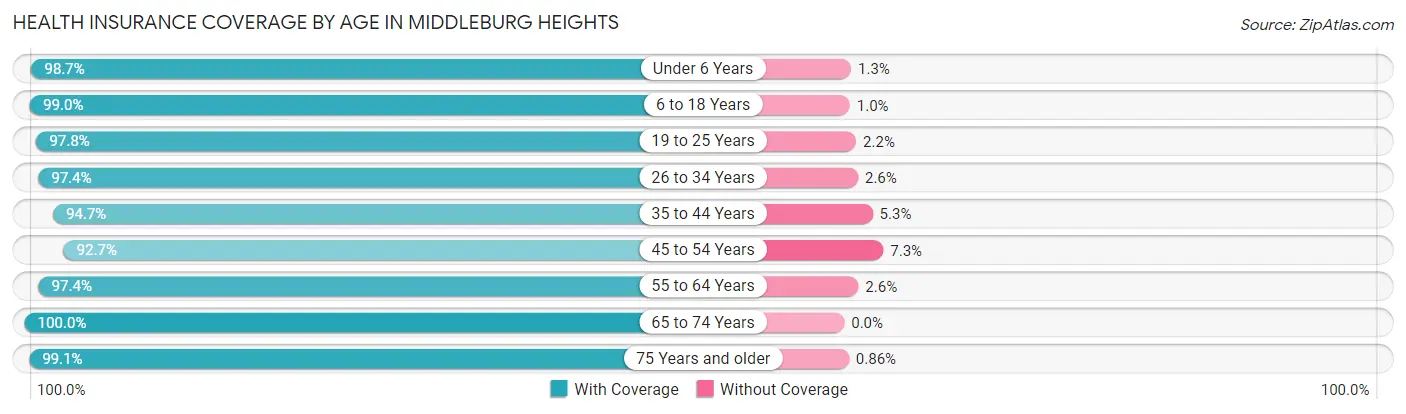
| Age Bracket | With Coverage | Without Coverage |
| Under 6 Years | 1,014 (98.7%) | 13 (1.3%) |
| 6 to 18 Years | 1,632 (99.0%) | 17 (1.0%) |
| 19 to 25 Years | 840 (97.8%) | 19 (2.2%) |
| 26 to 34 Years | 1,561 (97.4%) | 41 (2.6%) |
| 35 to 44 Years | 2,039 (94.7%) | 114 (5.3%) |
| 45 to 54 Years | 1,796 (92.7%) | 141 (7.3%) |
| 55 to 64 Years | 2,514 (97.4%) | 68 (2.6%) |
| 65 to 74 Years | 1,961 (100.0%) | 0 (0.0%) |
| 75 Years and older | 1,725 (99.1%) | 15 (0.9%) |
| Total | 15,082 (97.2%) | 428 (2.8%) |
Health Insurance Coverage by Citizenship Status in Middleburg Heights
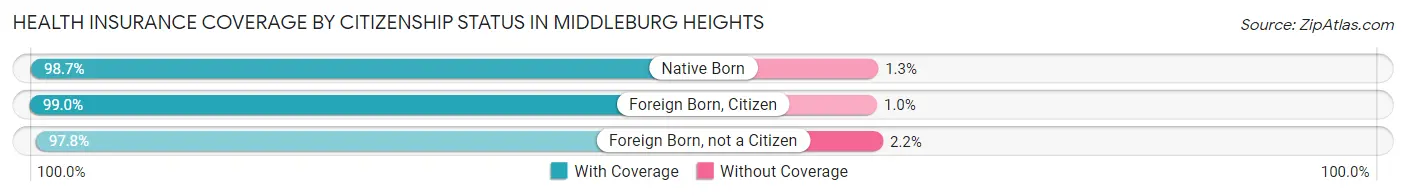
| Citizenship Status | With Coverage | Without Coverage |
| Native Born | 1,014 (98.7%) | 13 (1.3%) |
| Foreign Born, Citizen | 1,632 (99.0%) | 17 (1.0%) |
| Foreign Born, not a Citizen | 840 (97.8%) | 19 (2.2%) |
Health Insurance Coverage by Household Income in Middleburg Heights
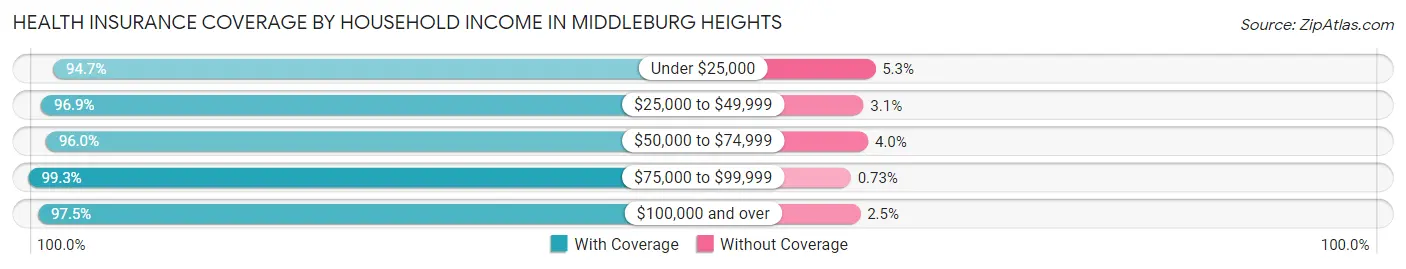
| Household Income | With Coverage | Without Coverage |
| Under $25,000 | 871 (94.7%) | 49 (5.3%) |
| $25,000 to $49,999 | 2,057 (96.9%) | 66 (3.1%) |
| $50,000 to $74,999 | 2,918 (96.0%) | 121 (4.0%) |
| $75,000 to $99,999 | 2,462 (99.3%) | 18 (0.7%) |
| $100,000 and over | 6,755 (97.5%) | 174 (2.5%) |
Public vs Private Health Insurance Coverage by Age in Middleburg Heights
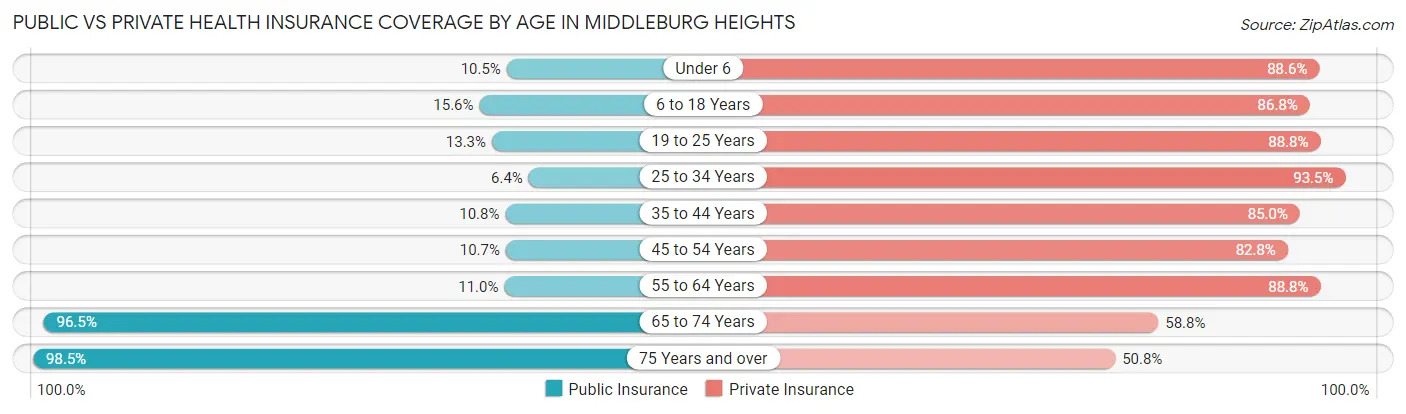
| Age Bracket | Public Insurance | Private Insurance |
| Under 6 | 108 (10.5%) | 910 (88.6%) |
| 6 to 18 Years | 257 (15.6%) | 1,432 (86.8%) |
| 19 to 25 Years | 114 (13.3%) | 763 (88.8%) |
| 25 to 34 Years | 103 (6.4%) | 1,497 (93.4%) |
| 35 to 44 Years | 232 (10.8%) | 1,830 (85.0%) |
| 45 to 54 Years | 207 (10.7%) | 1,603 (82.8%) |
| 55 to 64 Years | 283 (11.0%) | 2,293 (88.8%) |
| 65 to 74 Years | 1,892 (96.5%) | 1,152 (58.8%) |
| 75 Years and over | 1,713 (98.5%) | 883 (50.7%) |
| Total | 4,909 (31.7%) | 12,363 (79.7%) |
Disability Status by Sex by Age in Middleburg Heights
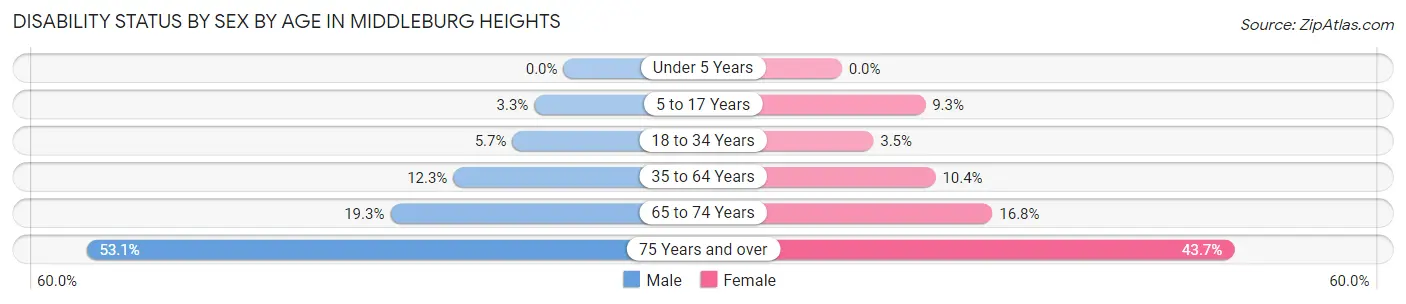
| Age Bracket | Male | Female |
| Under 5 Years | 0 (0.0%) | 0 (0.0%) |
| 5 to 17 Years | 27 (3.3%) | 81 (9.3%) |
| 18 to 34 Years | 79 (5.7%) | 40 (3.5%) |
| 35 to 64 Years | 415 (12.3%) | 343 (10.4%) |
| 65 to 74 Years | 155 (19.3%) | 194 (16.8%) |
| 75 Years and over | 444 (53.1%) | 395 (43.7%) |
Disability Class by Sex by Age in Middleburg Heights
Disability Class: Hearing Difficulty
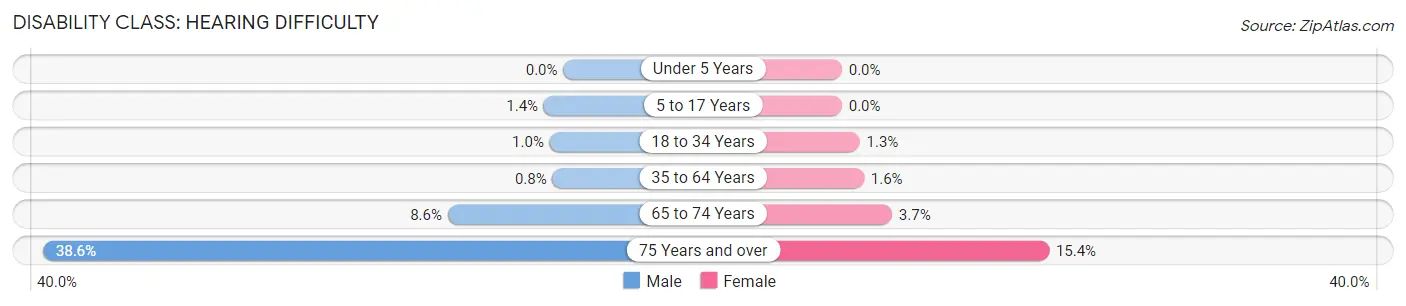
| Age Bracket | Male | Female |
| Under 5 Years | 0 (0.0%) | 0 (0.0%) |
| 5 to 17 Years | 12 (1.4%) | 0 (0.0%) |
| 18 to 34 Years | 14 (1.0%) | 15 (1.3%) |
| 35 to 64 Years | 27 (0.8%) | 54 (1.6%) |
| 65 to 74 Years | 69 (8.6%) | 43 (3.7%) |
| 75 Years and over | 323 (38.6%) | 139 (15.4%) |
Disability Class: Vision Difficulty
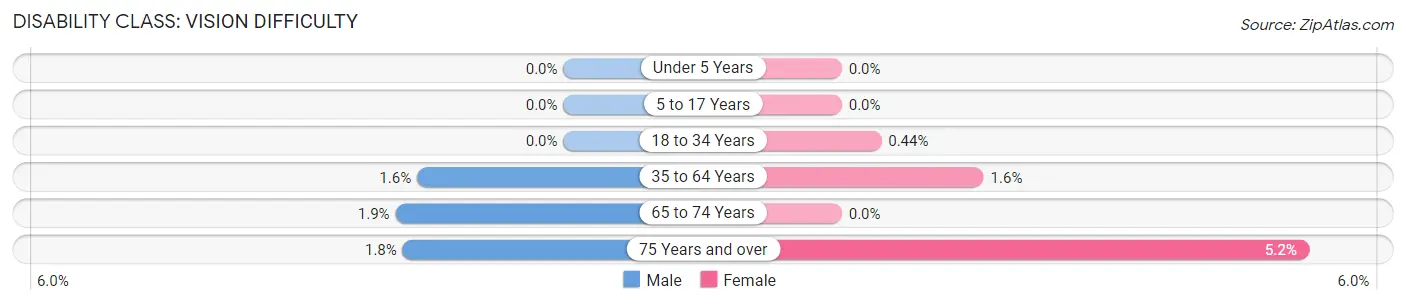
| Age Bracket | Male | Female |
| Under 5 Years | 0 (0.0%) | 0 (0.0%) |
| 5 to 17 Years | 0 (0.0%) | 0 (0.0%) |
| 18 to 34 Years | 0 (0.0%) | 5 (0.4%) |
| 35 to 64 Years | 55 (1.6%) | 52 (1.6%) |
| 65 to 74 Years | 15 (1.9%) | 0 (0.0%) |
| 75 Years and over | 15 (1.8%) | 47 (5.2%) |
Disability Class: Cognitive Difficulty
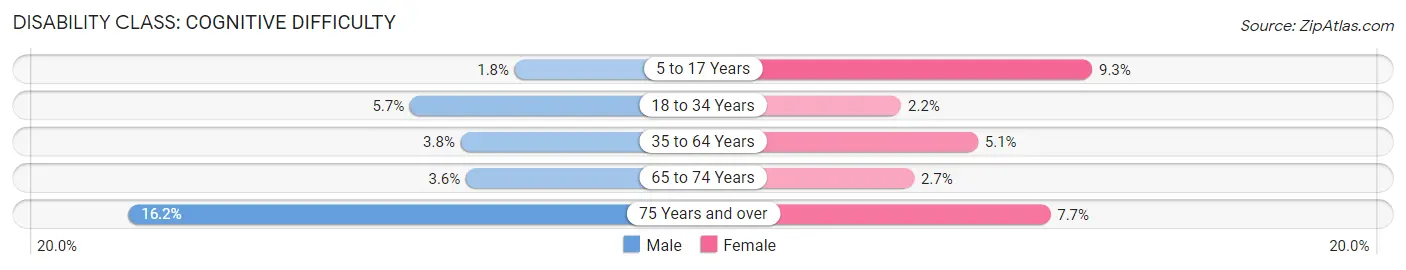
| Age Bracket | Male | Female |
| 5 to 17 Years | 15 (1.8%) | 81 (9.3%) |
| 18 to 34 Years | 79 (5.7%) | 25 (2.2%) |
| 35 to 64 Years | 129 (3.8%) | 166 (5.1%) |
| 65 to 74 Years | 29 (3.6%) | 31 (2.7%) |
| 75 Years and over | 135 (16.2%) | 70 (7.7%) |
Disability Class: Ambulatory Difficulty
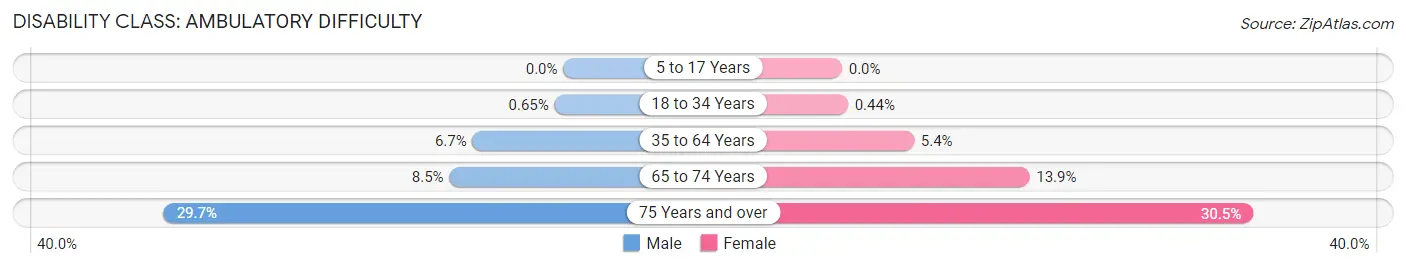
| Age Bracket | Male | Female |
| 5 to 17 Years | 0 (0.0%) | 0 (0.0%) |
| 18 to 34 Years | 9 (0.6%) | 5 (0.4%) |
| 35 to 64 Years | 228 (6.7%) | 176 (5.3%) |
| 65 to 74 Years | 68 (8.5%) | 161 (13.9%) |
| 75 Years and over | 248 (29.7%) | 276 (30.5%) |
Disability Class: Self-Care Difficulty
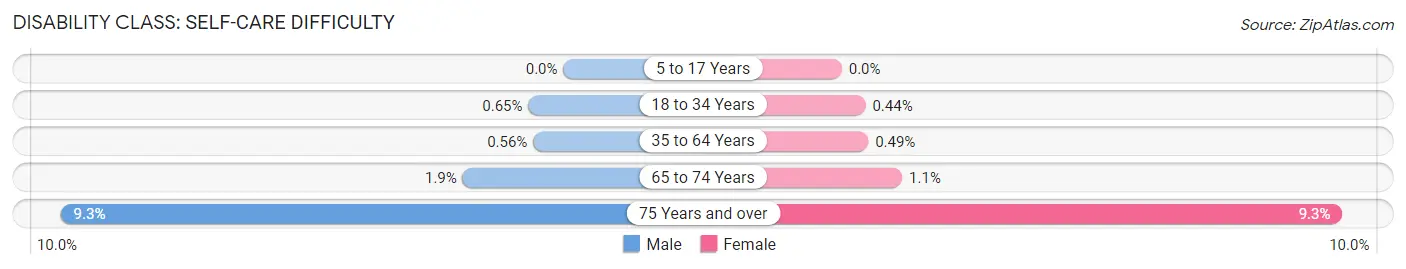
| Age Bracket | Male | Female |
| 5 to 17 Years | 0 (0.0%) | 0 (0.0%) |
| 18 to 34 Years | 9 (0.6%) | 5 (0.4%) |
| 35 to 64 Years | 19 (0.6%) | 16 (0.5%) |
| 65 to 74 Years | 15 (1.9%) | 13 (1.1%) |
| 75 Years and over | 78 (9.3%) | 84 (9.3%) |
Technology Access in Middleburg Heights
Computing Device Access in Middleburg Heights
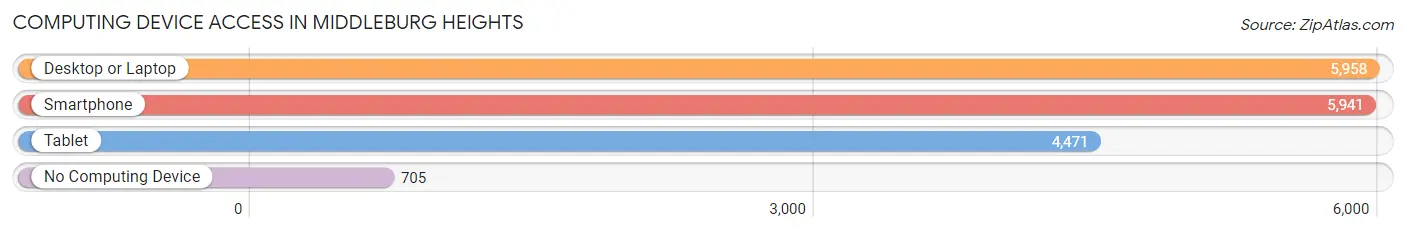
| Device Type | # Households | % Households |
| Desktop or Laptop | 5,958 | 79.7% |
| Smartphone | 5,941 | 79.5% |
| Tablet | 4,471 | 59.8% |
| No Computing Device | 705 | 9.4% |
| Total | 7,474 | 100.0% |
Internet Access in Middleburg Heights
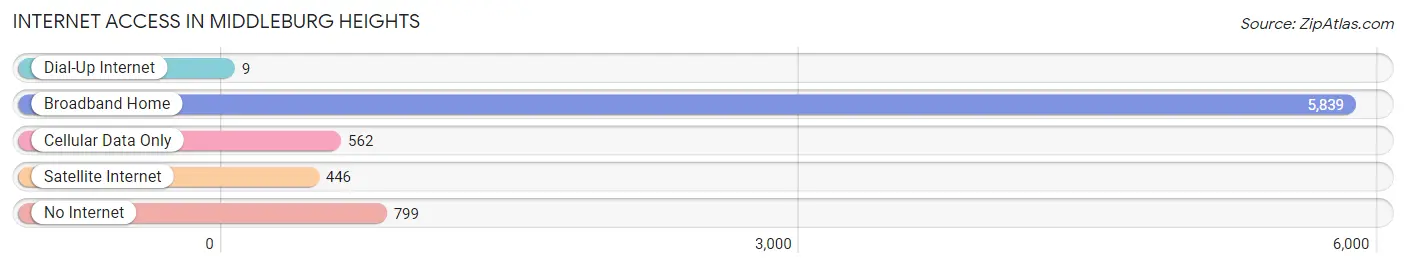
| Internet Type | # Households | % Households |
| Dial-Up Internet | 9 | 0.1% |
| Broadband Home | 5,839 | 78.1% |
| Cellular Data Only | 562 | 7.5% |
| Satellite Internet | 446 | 6.0% |
| No Internet | 799 | 10.7% |
| Total | 7,474 | 100.0% |
Middleburg Heights Summary
History
The city of Middleburg Heights, Ohio is located in Cuyahoga County, approximately 15 miles southwest of Cleveland. The city was founded in 1818 by a group of settlers from Connecticut, and was originally known as “Middleburgh”. The name was changed to Middleburg Heights in 1871. The city was incorporated in 1960, and has since grown to a population of over 17,000.
Middleburg Heights has a rich history of industry and agriculture. In the early 19th century, the city was home to a number of mills, including a grist mill, a saw mill, and a woolen mill. The city was also home to a number of farms, which produced a variety of crops, including wheat, corn, and hay.
In the late 19th century, the city began to transition from an agricultural economy to an industrial one. The city was home to a number of factories, including a brickyard, a paper mill, and a steel mill. The city also became home to a number of businesses, including a hotel, a bank, and a number of stores.
In the early 20th century, the city continued to grow and develop. The city was home to a number of schools, churches, and other institutions. The city also became home to a number of parks, including the Middleburg Heights Community Park, which was established in 1921.
Geography
Middleburg Heights is located in Cuyahoga County, Ohio, approximately 15 miles southwest of Cleveland. The city is situated on the northern edge of the Cleveland metropolitan area. The city is bordered by the cities of Berea, Brook Park, and Parma.
The city has a total area of 8.3 square miles, of which 8.2 square miles is land and 0.1 square miles is water. The city is located in the Cuyahoga Valley, and is surrounded by a number of small lakes and ponds. The city is also home to a number of parks, including the Middleburg Heights Community Park.
Economy
The economy of Middleburg Heights is largely based on the service industry. The city is home to a number of retail stores, restaurants, and other businesses. The city is also home to a number of corporate offices, including those of the Cleveland Clinic, the Cleveland Browns, and the Cleveland Indians.
The city is also home to a number of manufacturing companies, including the Middleburg Heights Manufacturing Company, which produces a variety of products, including automotive parts, medical equipment, and industrial machinery.
Demographics
As of the 2010 census, the population of Middleburg Heights was 17,351. The racial makeup of the city was 87.3% White, 8.2% African American, 0.5% Native American, 1.3% Asian, 0.1% Pacific Islander, 0.7% from other races, and 1.9% from two or more races. Hispanic or Latino of any race were 2.3% of the population.
The median household income in Middleburg Heights was $60,945, and the median family income was $68,945. The per capita income for the city was $27,945. About 4.3% of families and 5.7% of the population were below the poverty line, including 7.2% of those under age 18 and 4.2% of those age 65 or over.
Common Questions
What is Per Capita Income in Middleburg Heights?
Per Capita income in Middleburg Heights is $41,198.
What is the Median Family Income in Middleburg Heights?
Median Family Income in Middleburg Heights is $93,514.
What is the Median Household income in Middleburg Heights?
Median Household Income in Middleburg Heights is $74,109.
What is Income or Wage Gap in Middleburg Heights?
Income or Wage Gap in Middleburg Heights is 24.0%.
Women in Middleburg Heights earn 76.0 cents for every dollar earned by a man.
What is Family Income Deficit in Middleburg Heights?
Family Income Deficit in Middleburg Heights is $6,535.
Families that are below poverty line in Middleburg Heights earn $6,535 less on average than the poverty threshold level.
What is Inequality or Gini Index in Middleburg Heights?
Inequality or Gini Index in Middleburg Heights is 0.36.
What is the Total Population of Middleburg Heights?
Total Population of Middleburg Heights is 15,918.
What is the Total Male Population of Middleburg Heights?
Total Male Population of Middleburg Heights is 7,911.
What is the Total Female Population of Middleburg Heights?
Total Female Population of Middleburg Heights is 8,007.
What is the Ratio of Males per 100 Females in Middleburg Heights?
There are 98.80 Males per 100 Females in Middleburg Heights.
What is the Ratio of Females per 100 Males in Middleburg Heights?
There are 101.21 Females per 100 Males in Middleburg Heights.
What is the Median Population Age in Middleburg Heights?
Median Population Age in Middleburg Heights is 47.9 Years.
What is the Average Family Size in Middleburg Heights
Average Family Size in Middleburg Heights is 2.9 People.
What is the Average Household Size in Middleburg Heights
Average Household Size in Middleburg Heights is 2.1 People.
How Large is the Labor Force in Middleburg Heights?
There are 8,065 People in the Labor Forcein in Middleburg Heights.
What is the Percentage of People in the Labor Force in Middleburg Heights?
59.4% of People are in the Labor Force in Middleburg Heights.
What is the Unemployment Rate in Middleburg Heights?
Unemployment Rate in Middleburg Heights is 2.0%.