Mineola, NY Map & Demographics
Mineola Map
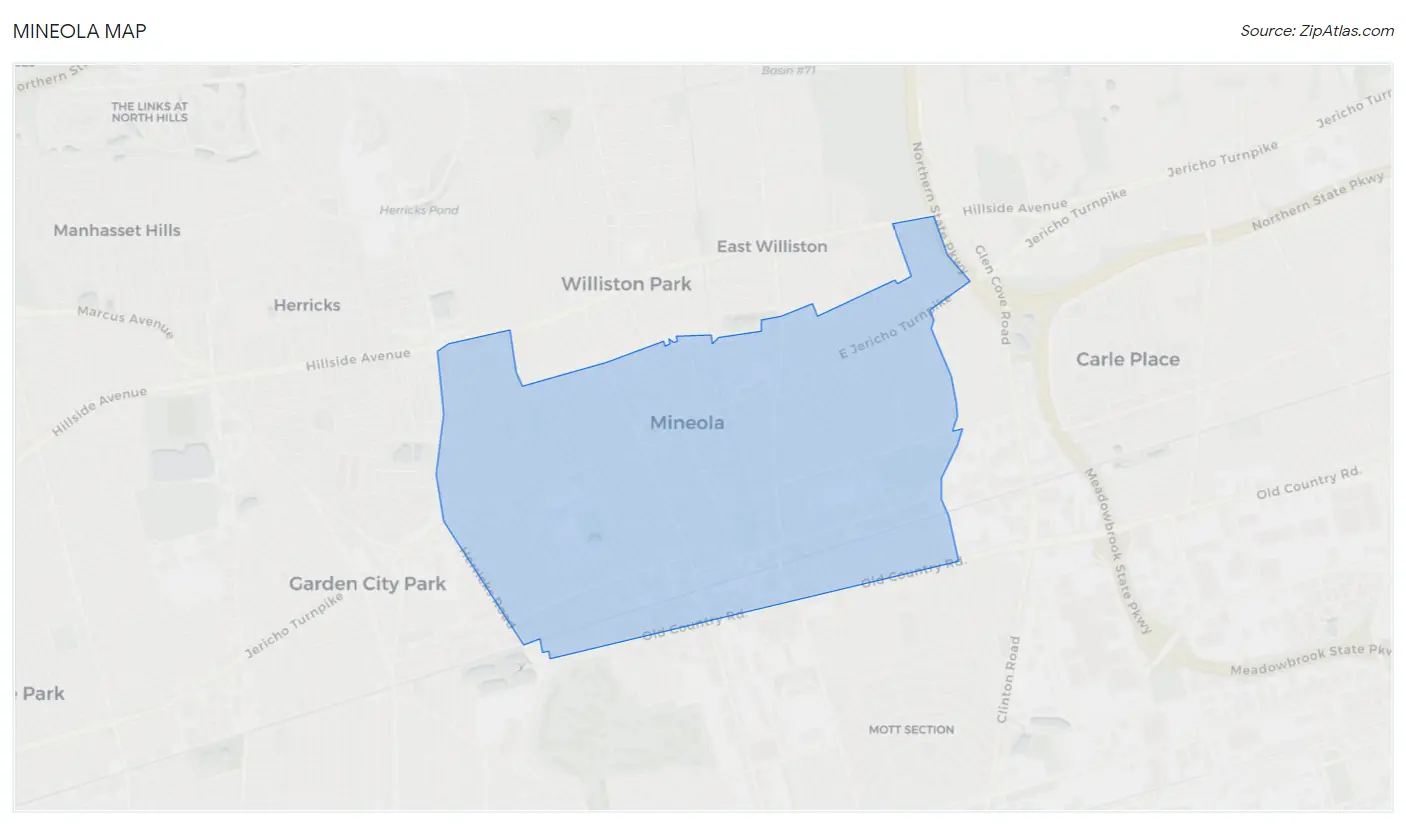
Mineola Overview
$61,837
PER CAPITA INCOME
$160,754
AVG FAMILY INCOME
$130,111
AVG HOUSEHOLD INCOME
25.2%
WAGE / INCOME GAP [ % ]
74.8¢/ $1
WAGE / INCOME GAP [ $ ]
0.40
INEQUALITY / GINI INDEX
20,940
TOTAL POPULATION
10,861
MALE POPULATION
10,079
FEMALE POPULATION
107.76
MALES / 100 FEMALES
92.80
FEMALES / 100 MALES
41.2
MEDIAN AGE
3.1
AVG FAMILY SIZE
2.5
AVG HOUSEHOLD SIZE
13,092
LABOR FORCE [ PEOPLE ]
74.5%
PERCENT IN LABOR FORCE
3.7%
UNEMPLOYMENT RATE
Mineola Zip Codes
Mineola Area Codes
Income in Mineola
Income Overview in Mineola
Per Capita Income in Mineola is $61,837, while median incomes of families and households are $160,754 and $130,111 respectively.
| Characteristic | Number | Measure |
| Per Capita Income | 20,940 | $61,837 |
| Median Family Income | 5,325 | $160,754 |
| Mean Family Income | 5,325 | $183,090 |
| Median Household Income | 8,427 | $130,111 |
| Mean Household Income | 8,427 | $153,995 |
| Income Deficit | 5,325 | $0 |
| Wage / Income Gap (%) | 20,940 | 25.21% |
| Wage / Income Gap ($) | 20,940 | 74.79¢ per $1 |
| Gini / Inequality Index | 20,940 | 0.40 |
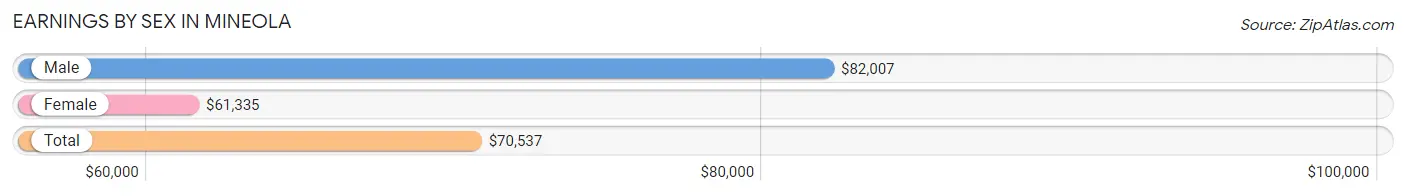
Earnings by Sex in Mineola
Average Earnings in Mineola are $70,537, $82,007 for men and $61,335 for women, a difference of 25.2%.
| Sex | Number | Average Earnings |
| Male | 7,018 (53.5%) | $82,007 |
| Female | 6,094 (46.5%) | $61,335 |
| Total | 13,112 (100.0%) | $70,537 |
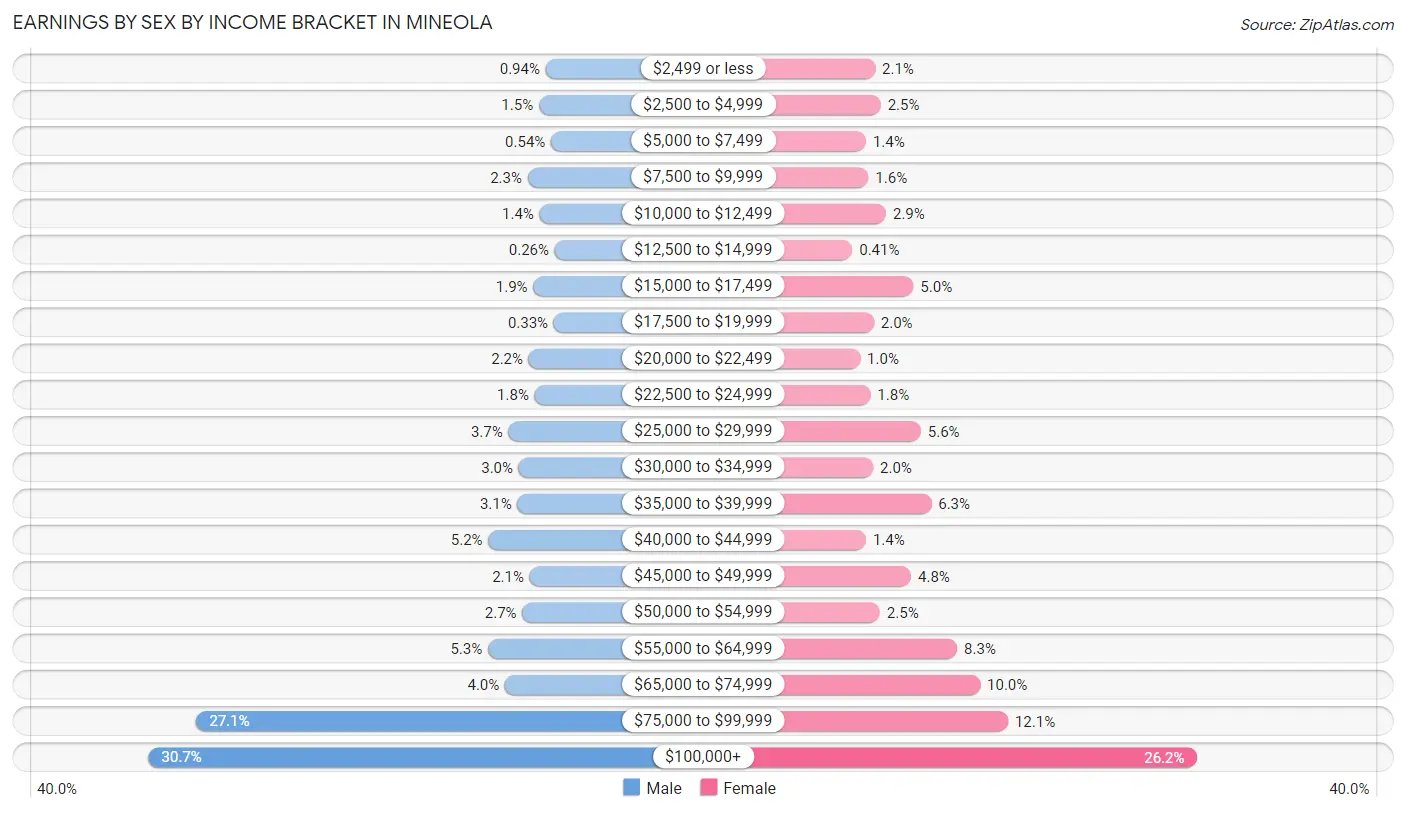
Earnings by Sex by Income Bracket in Mineola
The most common earnings brackets in Mineola are $100,000+ for men (2,156 | 30.7%) and $100,000+ for women (1,596 | 26.2%).
| Income | Male | Female |
| $2,499 or less | 66 (0.9%) | 129 (2.1%) |
| $2,500 to $4,999 | 102 (1.5%) | 155 (2.5%) |
| $5,000 to $7,499 | 38 (0.5%) | 88 (1.4%) |
| $7,500 to $9,999 | 161 (2.3%) | 99 (1.6%) |
| $10,000 to $12,499 | 98 (1.4%) | 179 (2.9%) |
| $12,500 to $14,999 | 18 (0.3%) | 25 (0.4%) |
| $15,000 to $17,499 | 131 (1.9%) | 304 (5.0%) |
| $17,500 to $19,999 | 23 (0.3%) | 124 (2.0%) |
| $20,000 to $22,499 | 155 (2.2%) | 61 (1.0%) |
| $22,500 to $24,999 | 124 (1.8%) | 108 (1.8%) |
| $25,000 to $29,999 | 262 (3.7%) | 338 (5.6%) |
| $30,000 to $34,999 | 208 (3.0%) | 120 (2.0%) |
| $35,000 to $39,999 | 215 (3.1%) | 386 (6.3%) |
| $40,000 to $44,999 | 368 (5.2%) | 88 (1.4%) |
| $45,000 to $49,999 | 150 (2.1%) | 294 (4.8%) |
| $50,000 to $54,999 | 189 (2.7%) | 151 (2.5%) |
| $55,000 to $64,999 | 370 (5.3%) | 504 (8.3%) |
| $65,000 to $74,999 | 280 (4.0%) | 609 (10.0%) |
| $75,000 to $99,999 | 1,904 (27.1%) | 736 (12.1%) |
| $100,000+ | 2,156 (30.7%) | 1,596 (26.2%) |
| Total | 7,018 (100.0%) | 6,094 (100.0%) |
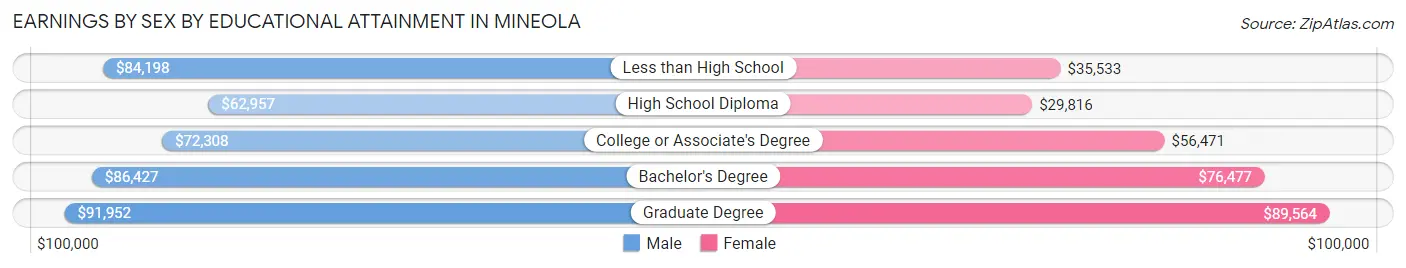
Earnings by Sex by Educational Attainment in Mineola
Average earnings in Mineola are $83,346 for men and $66,148 for women, a difference of 20.6%. Men with an educational attainment of graduate degree enjoy the highest average annual earnings of $91,952, while those with high school diploma education earn the least with $62,957. Women with an educational attainment of graduate degree earn the most with the average annual earnings of $89,564, while those with high school diploma education have the smallest earnings of $29,816.
| Educational Attainment | Male Income | Female Income |
| Less than High School | $84,198 | $35,533 |
| High School Diploma | $62,957 | $29,816 |
| College or Associate's Degree | $72,308 | $56,471 |
| Bachelor's Degree | $86,427 | $76,477 |
| Graduate Degree | $91,952 | $89,564 |
| Total | $83,346 | $66,148 |
Family Income in Mineola
Family Income Brackets in Mineola
According to the Mineola family income data, there are 1,779 families falling into the $200,000+ income range, which is the most common income bracket and makes up 33.4% of all families. Conversely, the $10,000 to $14,999 income bracket is the least frequent group with only 11 families (0.2%) belonging to this category.
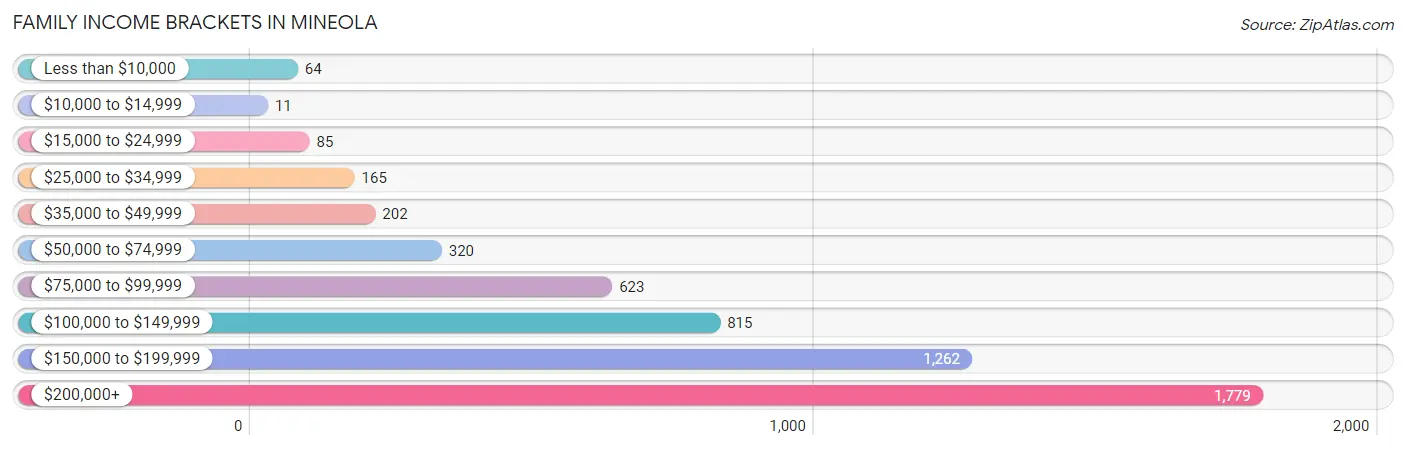
| Income Bracket | # Families | % Families |
| Less than $10,000 | 64 | 1.2% |
| $10,000 to $14,999 | 11 | 0.2% |
| $15,000 to $24,999 | 85 | 1.6% |
| $25,000 to $34,999 | 165 | 3.1% |
| $35,000 to $49,999 | 202 | 3.8% |
| $50,000 to $74,999 | 320 | 6.0% |
| $75,000 to $99,999 | 623 | 11.7% |
| $100,000 to $149,999 | 815 | 15.3% |
| $150,000 to $199,999 | 1,262 | 23.7% |
| $200,000+ | 1,779 | 33.4% |
Family Income by Famaliy Size in Mineola
4-person families (1,207 | 22.7%) account for the highest median family income in Mineola with $207,083 per family, while 2-person families (2,350 | 44.1%) have the highest median income of $76,931 per family member.
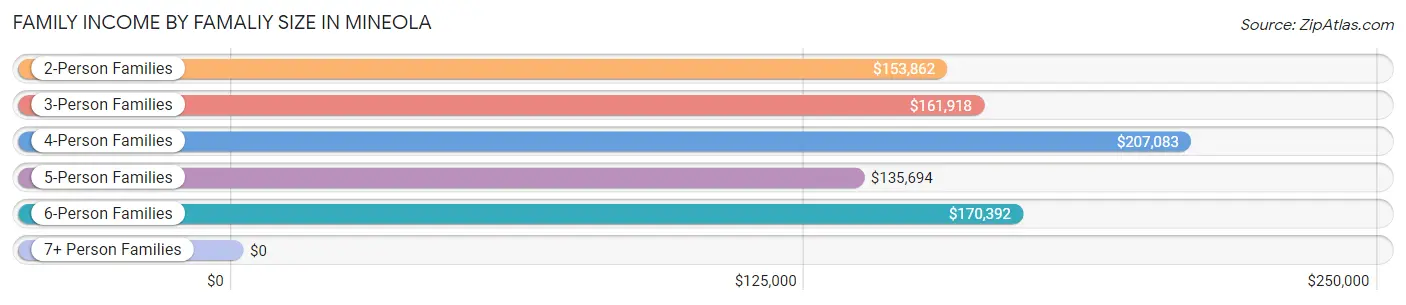
| Income Bracket | # Families | Median Income |
| 2-Person Families | 2,350 (44.1%) | $153,862 |
| 3-Person Families | 1,071 (20.1%) | $161,918 |
| 4-Person Families | 1,207 (22.7%) | $207,083 |
| 5-Person Families | 486 (9.1%) | $135,694 |
| 6-Person Families | 173 (3.3%) | $170,392 |
| 7+ Person Families | 38 (0.7%) | $0 |
| Total | 5,325 (100.0%) | $160,754 |
Family Income by Number of Earners in Mineola
The median family income in Mineola is $160,754, with families comprising 2 earners (2,888) having the highest median family income of $181,640, while families with no earners (465) have the lowest median family income of $64,388, accounting for 54.2% and 8.7% of families, respectively.
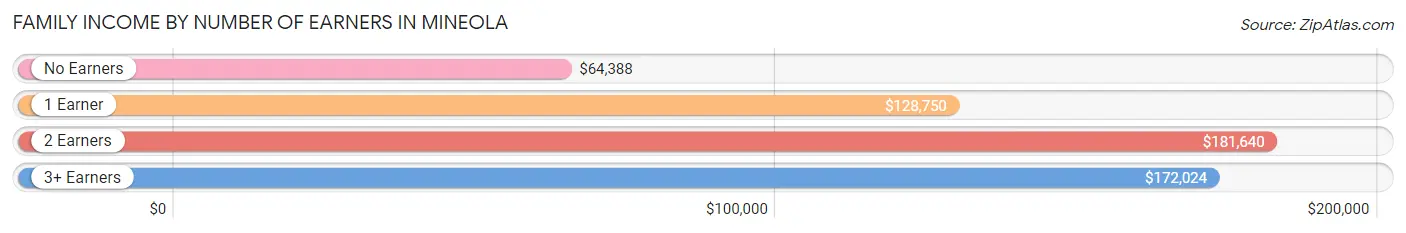
| Number of Earners | # Families | Median Income |
| No Earners | 465 (8.7%) | $64,388 |
| 1 Earner | 1,096 (20.6%) | $128,750 |
| 2 Earners | 2,888 (54.2%) | $181,640 |
| 3+ Earners | 876 (16.5%) | $172,024 |
| Total | 5,325 (100.0%) | $160,754 |
Household Income in Mineola
Household Income Brackets in Mineola
With 2,073 households falling in the category, the $200,000+ income range is the most frequent in Mineola, accounting for 24.6% of all households. In contrast, only 42 households (0.5%) fall into the $10,000 to $14,999 income bracket, making it the least populous group.
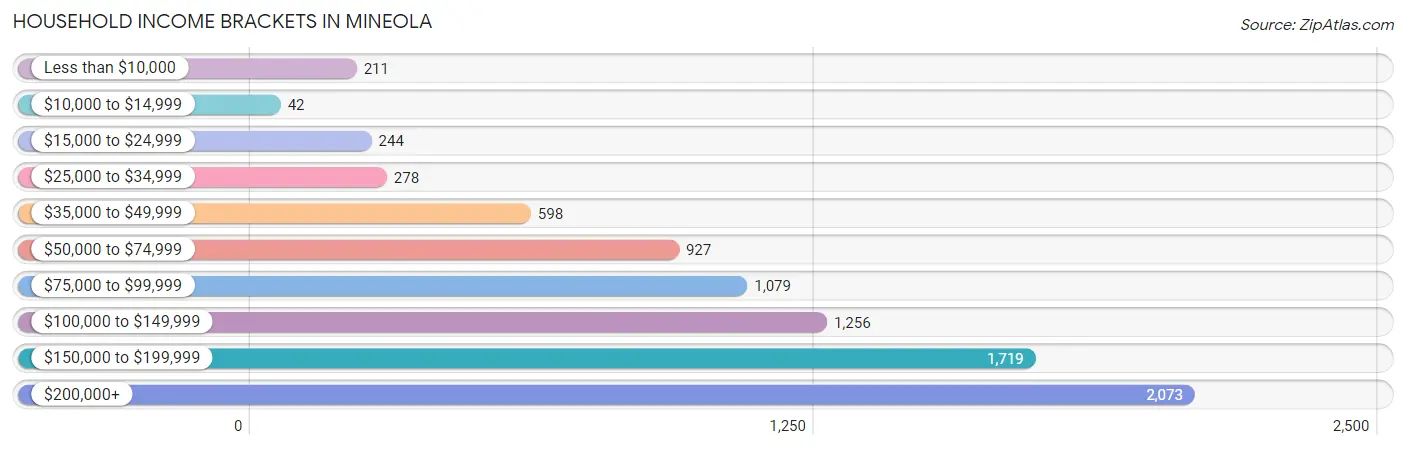
| Income Bracket | # Households | % Households |
| Less than $10,000 | 211 | 2.5% |
| $10,000 to $14,999 | 42 | 0.5% |
| $15,000 to $24,999 | 244 | 2.9% |
| $25,000 to $34,999 | 278 | 3.3% |
| $35,000 to $49,999 | 598 | 7.1% |
| $50,000 to $74,999 | 927 | 11.0% |
| $75,000 to $99,999 | 1,079 | 12.8% |
| $100,000 to $149,999 | 1,256 | 14.9% |
| $150,000 to $199,999 | 1,719 | 20.4% |
| $200,000+ | 2,073 | 24.6% |
Household Income by Householder Age in Mineola
The median household income in Mineola is $130,111, with the highest median household income of $152,618 found in the 45 to 64 years age bracket for the primary householder. A total of 3,322 households (39.4%) fall into this category. Meanwhile, the 15 to 24 years age bracket for the primary householder has the lowest median household income of $0, with 20 households (0.2%) in this group.
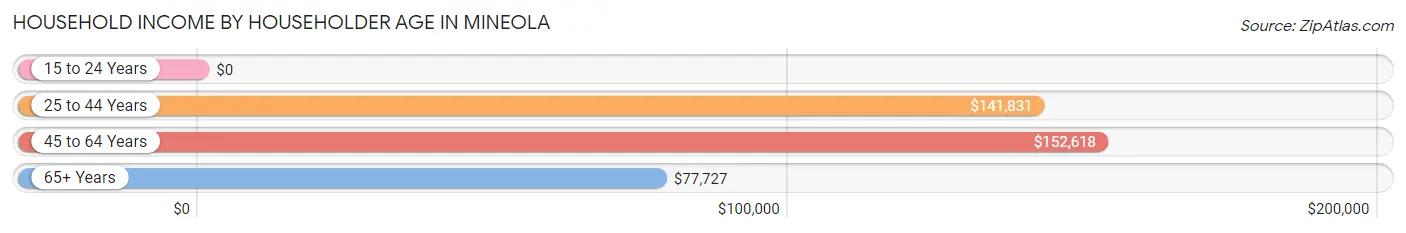
| Income Bracket | # Households | Median Income |
| 15 to 24 Years | 20 (0.2%) | $0 |
| 25 to 44 Years | 3,081 (36.6%) | $141,831 |
| 45 to 64 Years | 3,322 (39.4%) | $152,618 |
| 65+ Years | 2,004 (23.8%) | $77,727 |
| Total | 8,427 (100.0%) | $130,111 |
Poverty in Mineola
Income Below Poverty by Sex and Age in Mineola
With 5.4% poverty level for males and 5.3% for females among the residents of Mineola, 16 and 17 year old males and 75 year old and over females are the most vulnerable to poverty, with 27 males (13.4%) and 92 females (9.8%) in their respective age groups living below the poverty level.
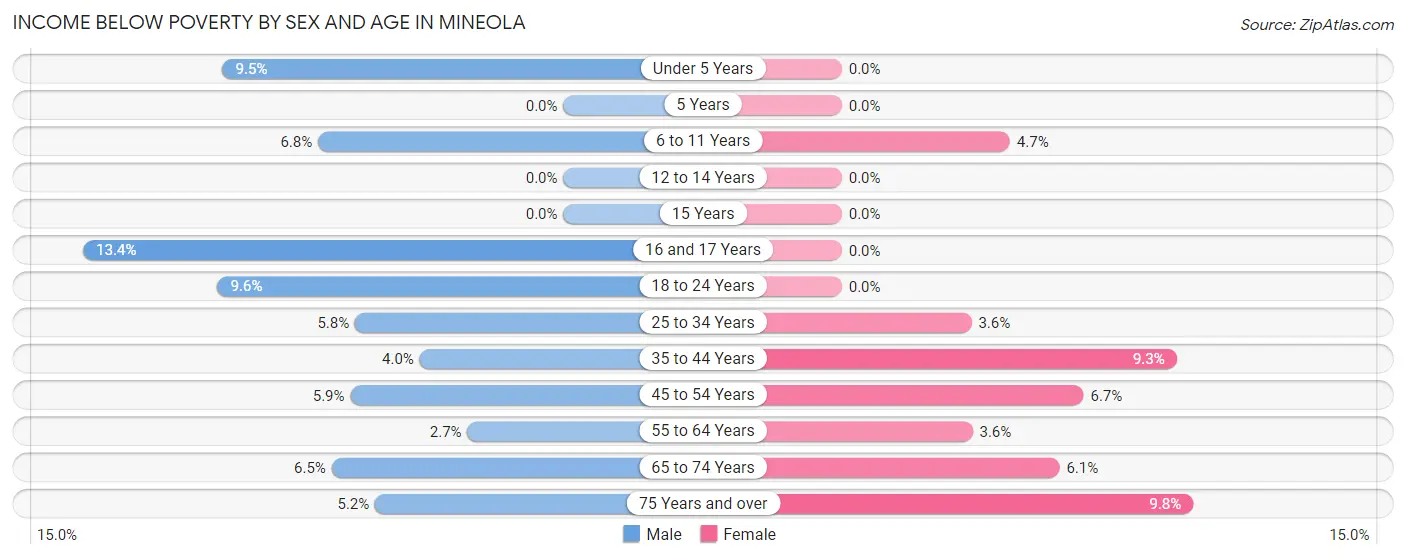
| Age Bracket | Male | Female |
| Under 5 Years | 48 (9.5%) | 0 (0.0%) |
| 5 Years | 0 (0.0%) | 0 (0.0%) |
| 6 to 11 Years | 45 (6.8%) | 36 (4.7%) |
| 12 to 14 Years | 0 (0.0%) | 0 (0.0%) |
| 15 Years | 0 (0.0%) | 0 (0.0%) |
| 16 and 17 Years | 27 (13.4%) | 0 (0.0%) |
| 18 to 24 Years | 49 (9.6%) | 0 (0.0%) |
| 25 to 34 Years | 128 (5.8%) | 61 (3.6%) |
| 35 to 44 Years | 67 (4.0%) | 129 (9.3%) |
| 45 to 54 Years | 72 (5.9%) | 92 (6.7%) |
| 55 to 64 Years | 44 (2.7%) | 62 (3.6%) |
| 65 to 74 Years | 59 (6.5%) | 57 (6.1%) |
| 75 Years and over | 30 (5.2%) | 92 (9.8%) |
| Total | 569 (5.4%) | 529 (5.3%) |
Income Above Poverty by Sex and Age in Mineola
According to the poverty statistics in Mineola, males aged 5 years and females aged under 5 years are the age groups that are most secure financially, with 100.0% of males and 100.0% of females in these age groups living above the poverty line.
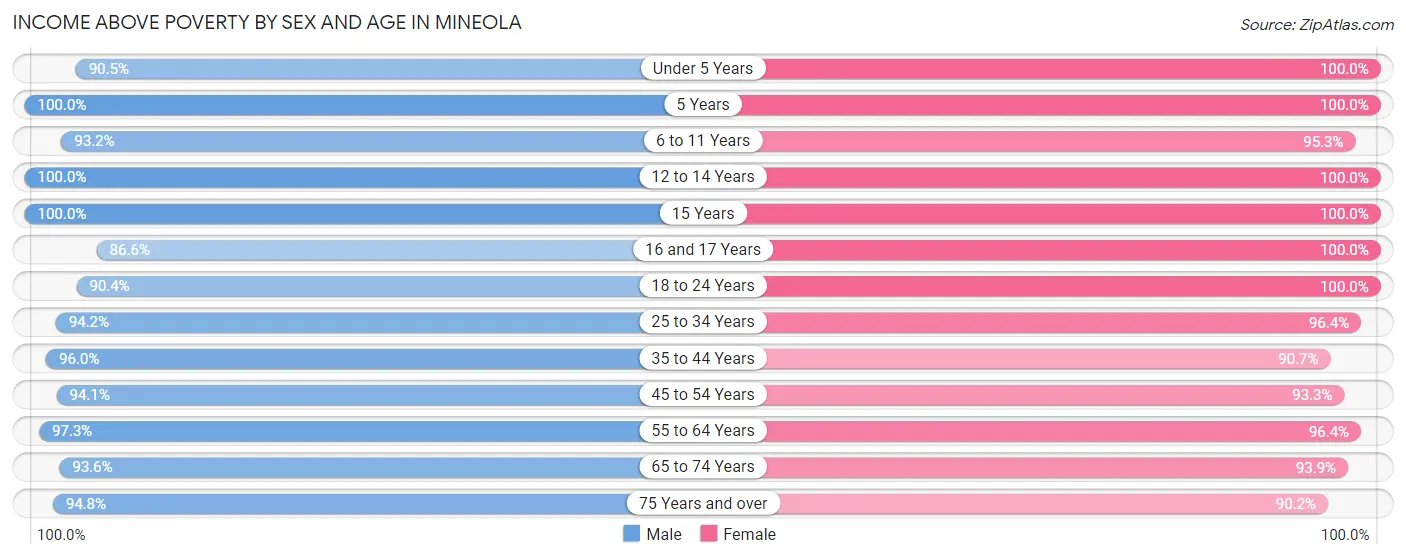
| Age Bracket | Male | Female |
| Under 5 Years | 458 (90.5%) | 440 (100.0%) |
| 5 Years | 170 (100.0%) | 77 (100.0%) |
| 6 to 11 Years | 614 (93.2%) | 733 (95.3%) |
| 12 to 14 Years | 245 (100.0%) | 115 (100.0%) |
| 15 Years | 92 (100.0%) | 22 (100.0%) |
| 16 and 17 Years | 175 (86.6%) | 171 (100.0%) |
| 18 to 24 Years | 460 (90.4%) | 437 (100.0%) |
| 25 to 34 Years | 2,078 (94.2%) | 1,630 (96.4%) |
| 35 to 44 Years | 1,607 (96.0%) | 1,255 (90.7%) |
| 45 to 54 Years | 1,143 (94.1%) | 1,274 (93.3%) |
| 55 to 64 Years | 1,604 (97.3%) | 1,639 (96.4%) |
| 65 to 74 Years | 856 (93.5%) | 883 (93.9%) |
| 75 Years and over | 543 (94.8%) | 849 (90.2%) |
| Total | 10,045 (94.6%) | 9,525 (94.7%) |
Income Below Poverty Among Married-Couple Families in Mineola
The poverty statistics for married-couple families in Mineola show that 1.7% or 73 of the total 4,406 families live below the poverty line. Families with no children have the highest poverty rate of 2.1%, comprising of 56 families. On the other hand, families with 3 or 4 children have the lowest poverty rate of 0.0%, which includes 0 families.
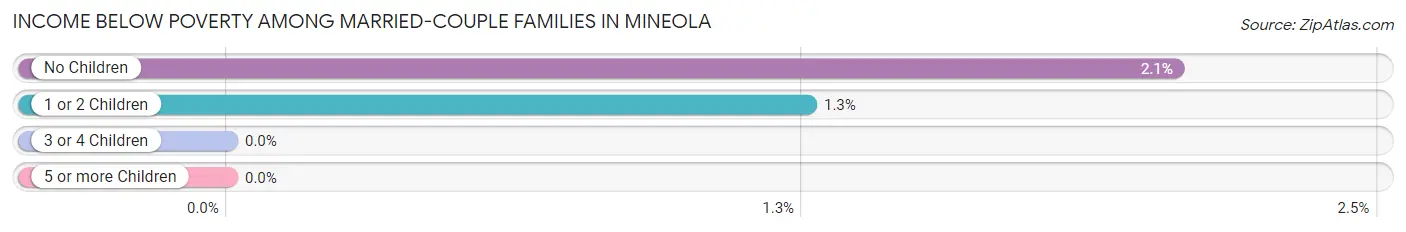
| Children | Above Poverty | Below Poverty |
| No Children | 2,668 (97.9%) | 56 (2.1%) |
| 1 or 2 Children | 1,328 (98.7%) | 17 (1.3%) |
| 3 or 4 Children | 323 (100.0%) | 0 (0.0%) |
| 5 or more Children | 14 (100.0%) | 0 (0.0%) |
| Total | 4,333 (98.3%) | 73 (1.7%) |
Income Below Poverty Among Single-Parent Households in Mineola
According to the poverty data in Mineola, 16.2% or 61 single-father households and 7.0% or 38 single-mother households are living below the poverty line. Among single-father households, those with 1 or 2 children have the highest poverty rate, with 61 households (74.4%) experiencing poverty. Likewise, among single-mother households, those with 1 or 2 children have the highest poverty rate, with 38 households (18.3%) falling below the poverty line.
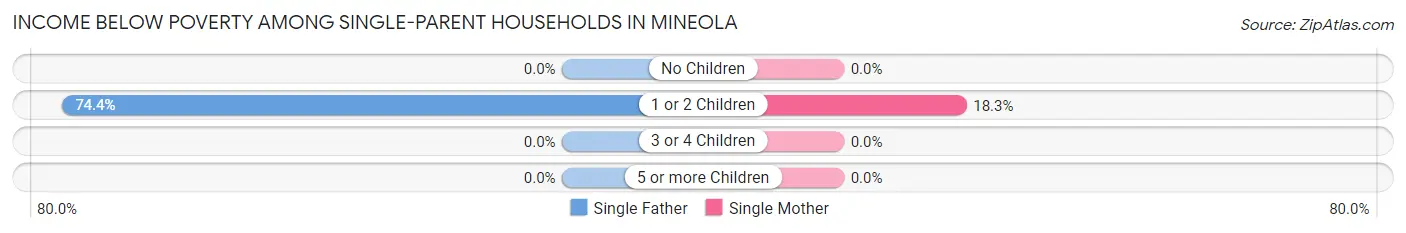
| Children | Single Father | Single Mother |
| No Children | 0 (0.0%) | 0 (0.0%) |
| 1 or 2 Children | 61 (74.4%) | 38 (18.3%) |
| 3 or 4 Children | 0 (0.0%) | 0 (0.0%) |
| 5 or more Children | 0 (0.0%) | 0 (0.0%) |
| Total | 61 (16.2%) | 38 (7.0%) |
Income Below Poverty Among Married-Couple vs Single-Parent Households in Mineola
The poverty data for Mineola shows that 73 of the married-couple family households (1.7%) and 99 of the single-parent households (10.8%) are living below the poverty level. Within the married-couple family households, those with no children have the highest poverty rate, with 56 households (2.1%) falling below the poverty line. Among the single-parent households, those with 1 or 2 children have the highest poverty rate, with 99 household (34.1%) living below poverty.
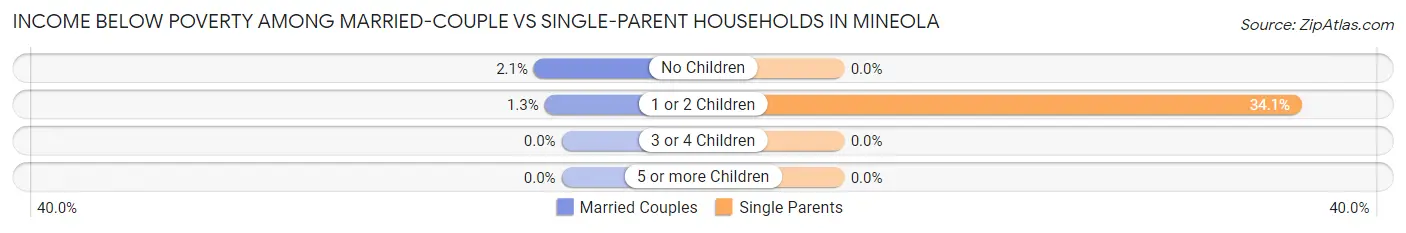
| Children | Married-Couple Families | Single-Parent Households |
| No Children | 56 (2.1%) | 0 (0.0%) |
| 1 or 2 Children | 17 (1.3%) | 99 (34.1%) |
| 3 or 4 Children | 0 (0.0%) | 0 (0.0%) |
| 5 or more Children | 0 (0.0%) | 0 (0.0%) |
| Total | 73 (1.7%) | 99 (10.8%) |
Race in Mineola
The most populous races in Mineola are White / Caucasian (14,004 | 66.9%), Asian (3,631 | 17.3%), and Hispanic or Latino (2,624 | 12.5%).
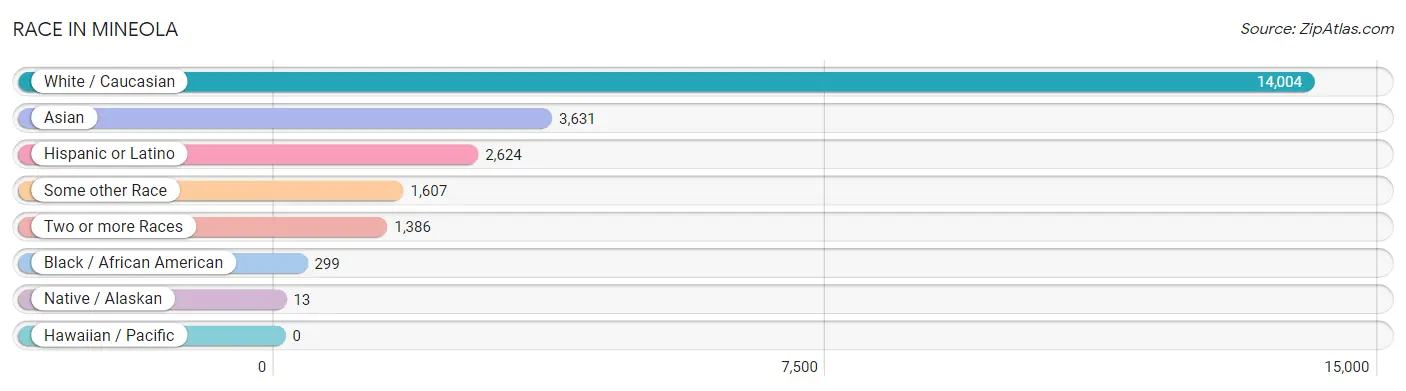
| Race | # Population | % Population |
| Asian | 3,631 | 17.3% |
| Black / African American | 299 | 1.4% |
| Hawaiian / Pacific | 0 | 0.0% |
| Hispanic or Latino | 2,624 | 12.5% |
| Native / Alaskan | 13 | 0.1% |
| White / Caucasian | 14,004 | 66.9% |
| Two or more Races | 1,386 | 6.6% |
| Some other Race | 1,607 | 7.7% |
| Total | 20,940 | 100.0% |
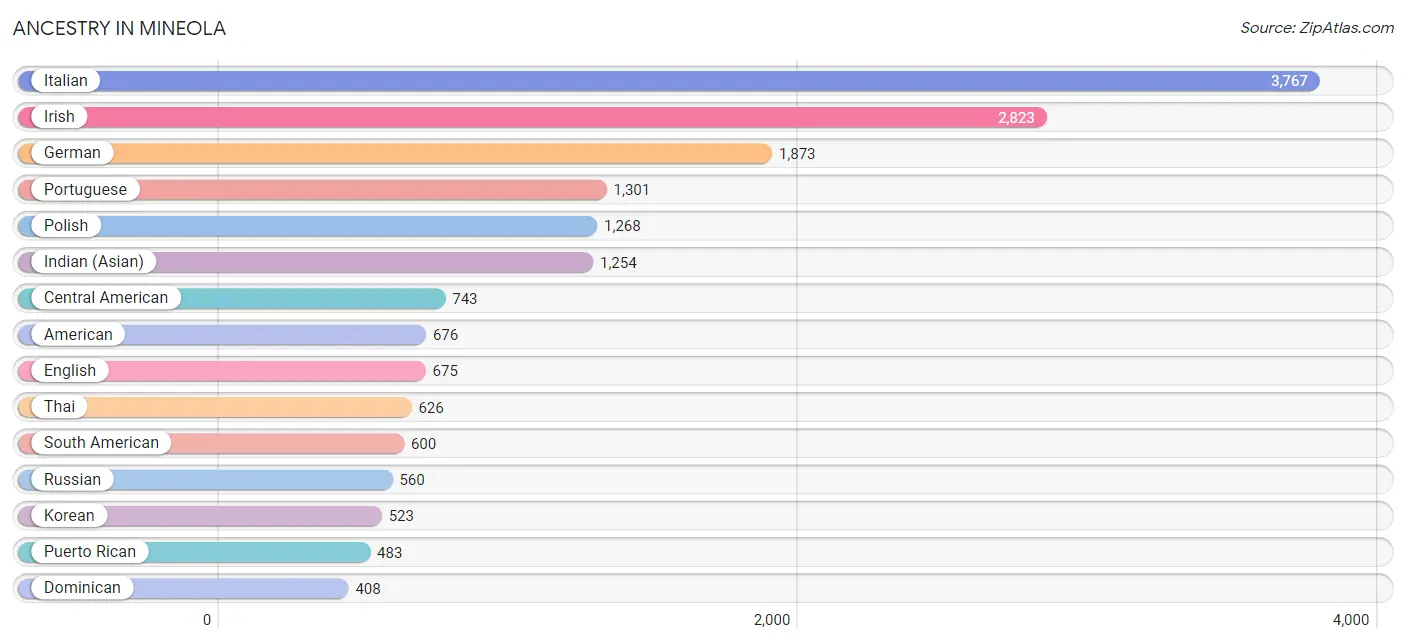
Ancestry in Mineola
The most populous ancestries reported in Mineola are Italian (3,767 | 18.0%), Irish (2,823 | 13.5%), German (1,873 | 8.9%), Portuguese (1,301 | 6.2%), and Polish (1,268 | 6.1%), together accounting for 52.7% of all Mineola residents.
| Ancestry | # Population | % Population |
| Afghan | 37 | 0.2% |
| American | 676 | 3.2% |
| Arab | 377 | 1.8% |
| Argentinean | 46 | 0.2% |
| Armenian | 10 | 0.1% |
| Austrian | 38 | 0.2% |
| Bhutanese | 125 | 0.6% |
| Brazilian | 305 | 1.5% |
| British | 32 | 0.2% |
| British West Indian | 17 | 0.1% |
| Burmese | 249 | 1.2% |
| Cambodian | 23 | 0.1% |
| Central American | 743 | 3.5% |
| Colombian | 280 | 1.3% |
| Costa Rican | 19 | 0.1% |
| Croatian | 72 | 0.3% |
| Cuban | 149 | 0.7% |
| Cypriot | 11 | 0.1% |
| Czech | 42 | 0.2% |
| Czechoslovakian | 29 | 0.1% |
| Danish | 23 | 0.1% |
| Dominican | 408 | 1.9% |
| Dutch | 157 | 0.7% |
| Eastern European | 66 | 0.3% |
| Ecuadorian | 77 | 0.4% |
| Egyptian | 41 | 0.2% |
| English | 675 | 3.2% |
| European | 219 | 1.1% |
| Filipino | 31 | 0.2% |
| French | 152 | 0.7% |
| German | 1,873 | 8.9% |
| Greek | 299 | 1.4% |
| Guatemalan | 58 | 0.3% |
| Guyanese | 64 | 0.3% |
| Honduran | 313 | 1.5% |
| Hungarian | 173 | 0.8% |
| Indian (Asian) | 1,254 | 6.0% |
| Iranian | 12 | 0.1% |
| Irish | 2,823 | 13.5% |
| Israeli | 19 | 0.1% |
| Italian | 3,767 | 18.0% |
| Jamaican | 69 | 0.3% |
| Korean | 523 | 2.5% |
| Laotian | 165 | 0.8% |
| Lebanese | 60 | 0.3% |
| Maltese | 5 | 0.0% |
| Mexican | 33 | 0.2% |
| Mongolian | 14 | 0.1% |
| Moroccan | 276 | 1.3% |
| Native Hawaiian | 21 | 0.1% |
| Nicaraguan | 59 | 0.3% |
| Nigerian | 70 | 0.3% |
| Norwegian | 25 | 0.1% |
| Okinawan | 48 | 0.2% |
| Paraguayan | 57 | 0.3% |
| Peruvian | 140 | 0.7% |
| Polish | 1,268 | 6.1% |
| Portuguese | 1,301 | 6.2% |
| Puerto Rican | 483 | 2.3% |
| Romanian | 50 | 0.2% |
| Russian | 560 | 2.7% |
| Salvadoran | 294 | 1.4% |
| Samoan | 11 | 0.1% |
| Scandinavian | 14 | 0.1% |
| Scotch-Irish | 74 | 0.4% |
| Scottish | 153 | 0.7% |
| Serbian | 204 | 1.0% |
| Slovak | 22 | 0.1% |
| South American | 600 | 2.9% |
| Spaniard | 20 | 0.1% |
| Spanish | 96 | 0.5% |
| Sri Lankan | 95 | 0.4% |
| Subsaharan African | 76 | 0.4% |
| Sudanese | 6 | 0.0% |
| Swedish | 57 | 0.3% |
| Thai | 626 | 3.0% |
| Turkish | 25 | 0.1% |
| Ukrainian | 22 | 0.1% |
| Welsh | 12 | 0.1% |
| Yugoslavian | 65 | 0.3% | View All 80 Rows |
Immigrants in Mineola
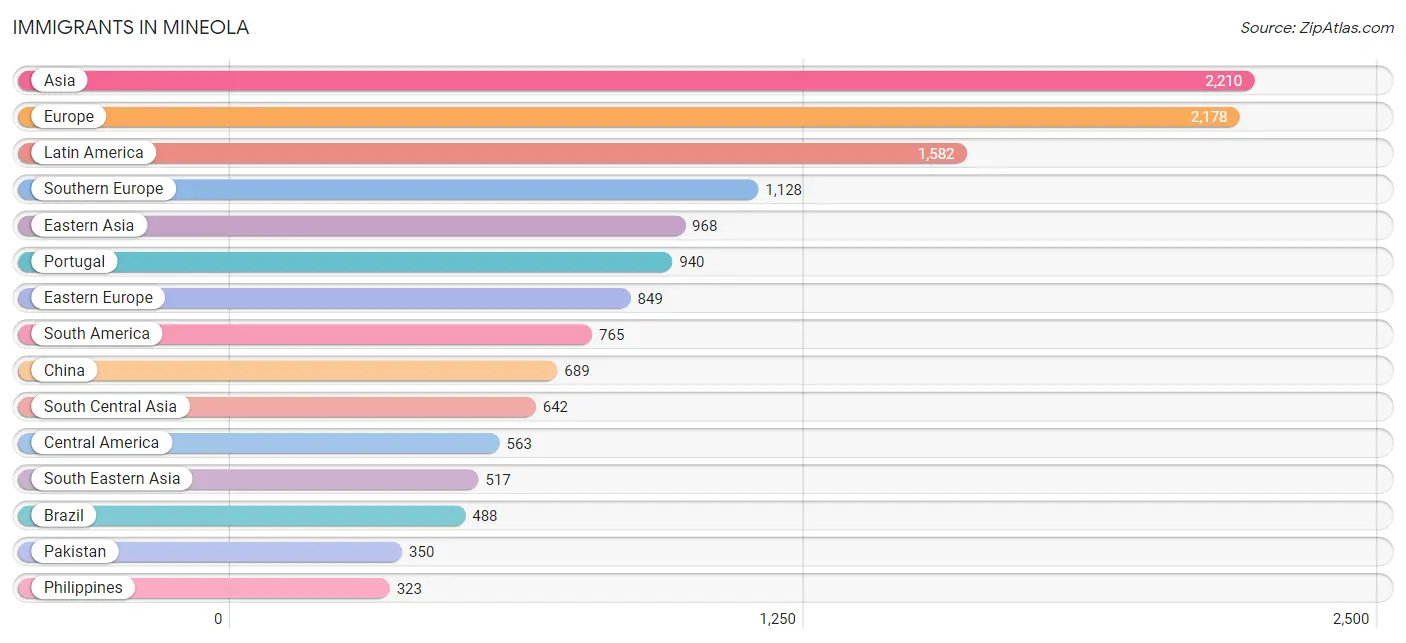
The most numerous immigrant groups reported in Mineola came from Asia (2,210 | 10.5%), Europe (2,178 | 10.4%), Latin America (1,582 | 7.5%), Southern Europe (1,128 | 5.4%), and Eastern Asia (968 | 4.6%), together accounting for 38.5% of all Mineola residents.
| Immigration Origin | # Population | % Population |
| Africa | 196 | 0.9% |
| Argentina | 33 | 0.2% |
| Asia | 2,210 | 10.5% |
| Bangladesh | 40 | 0.2% |
| Belarus | 118 | 0.6% |
| Brazil | 488 | 2.3% |
| Canada | 20 | 0.1% |
| Caribbean | 254 | 1.2% |
| Central America | 563 | 2.7% |
| China | 689 | 3.3% |
| Colombia | 97 | 0.5% |
| Cuba | 28 | 0.1% |
| Czechoslovakia | 17 | 0.1% |
| Dominican Republic | 174 | 0.8% |
| Eastern Asia | 968 | 4.6% |
| Eastern Europe | 849 | 4.1% |
| Ecuador | 43 | 0.2% |
| Egypt | 41 | 0.2% |
| El Salvador | 181 | 0.9% |
| England | 48 | 0.2% |
| Europe | 2,178 | 10.4% |
| France | 17 | 0.1% |
| Germany | 50 | 0.2% |
| Greece | 58 | 0.3% |
| Guatemala | 58 | 0.3% |
| Guyana | 82 | 0.4% |
| Honduras | 269 | 1.3% |
| Hong Kong | 270 | 1.3% |
| Hungary | 92 | 0.4% |
| India | 240 | 1.1% |
| Indonesia | 152 | 0.7% |
| Iran | 12 | 0.1% |
| Ireland | 43 | 0.2% |
| Israel | 23 | 0.1% |
| Italy | 130 | 0.6% |
| Jamaica | 31 | 0.2% |
| Japan | 125 | 0.6% |
| Korea | 154 | 0.7% |
| Latin America | 1,582 | 7.5% |
| Lebanon | 60 | 0.3% |
| Malaysia | 14 | 0.1% |
| Morocco | 54 | 0.3% |
| Nigeria | 83 | 0.4% |
| Northern Africa | 113 | 0.5% |
| Northern Europe | 134 | 0.6% |
| Pakistan | 350 | 1.7% |
| Panama | 55 | 0.3% |
| Peru | 22 | 0.1% |
| Philippines | 323 | 1.5% |
| Poland | 222 | 1.1% |
| Portugal | 940 | 4.5% |
| Russia | 91 | 0.4% |
| Scotland | 8 | 0.0% |
| Serbia | 204 | 1.0% |
| South America | 765 | 3.6% |
| South Central Asia | 642 | 3.1% |
| South Eastern Asia | 517 | 2.5% |
| Southern Europe | 1,128 | 5.4% |
| Sweden | 16 | 0.1% |
| Taiwan | 129 | 0.6% |
| Vietnam | 28 | 0.1% |
| Western Africa | 83 | 0.4% |
| Western Asia | 83 | 0.4% |
| Western Europe | 67 | 0.3% | View All 64 Rows |
Sex and Age in Mineola
Sex and Age in Mineola
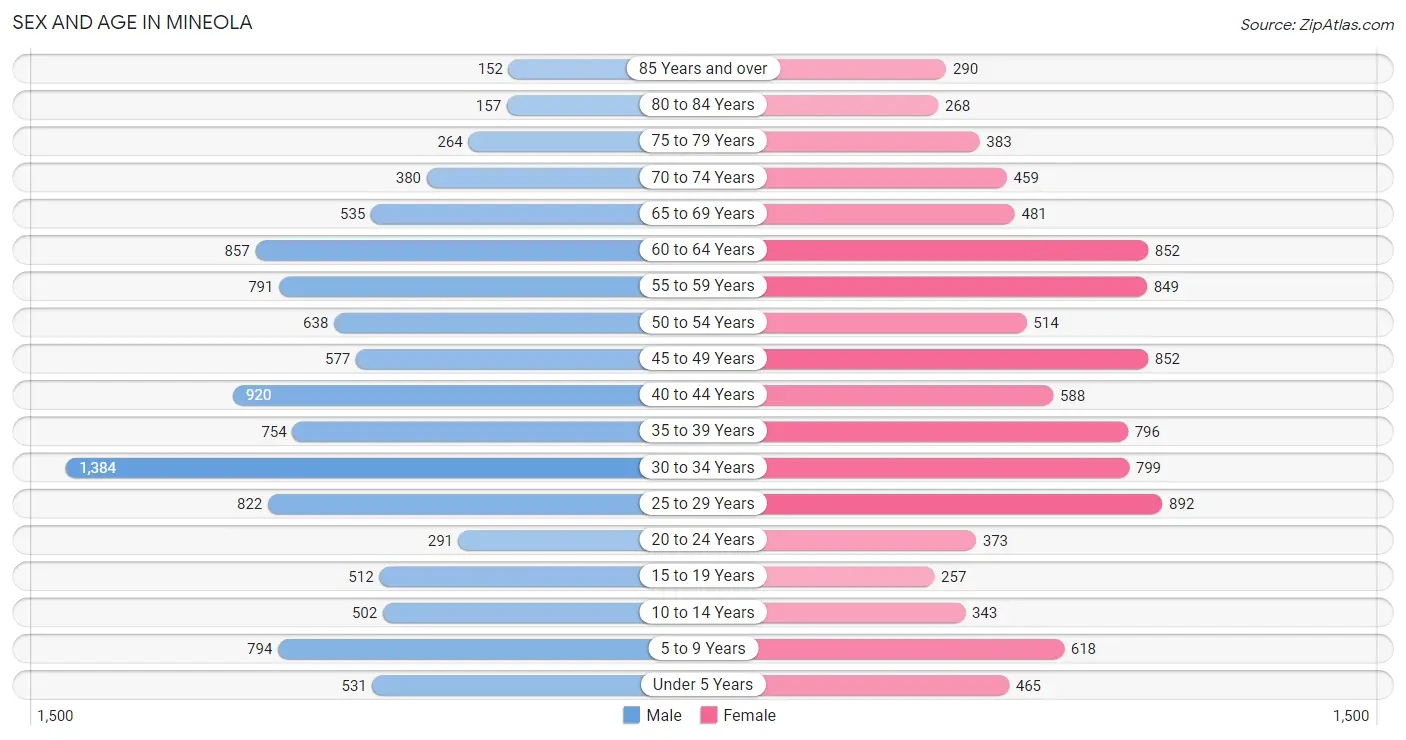
The most populous age groups in Mineola are 30 to 34 Years (1,384 | 12.7%) for men and 25 to 29 Years (892 | 8.8%) for women.
| Age Bracket | Male | Female |
| Under 5 Years | 531 (4.9%) | 465 (4.6%) |
| 5 to 9 Years | 794 (7.3%) | 618 (6.1%) |
| 10 to 14 Years | 502 (4.6%) | 343 (3.4%) |
| 15 to 19 Years | 512 (4.7%) | 257 (2.5%) |
| 20 to 24 Years | 291 (2.7%) | 373 (3.7%) |
| 25 to 29 Years | 822 (7.6%) | 892 (8.8%) |
| 30 to 34 Years | 1,384 (12.7%) | 799 (7.9%) |
| 35 to 39 Years | 754 (6.9%) | 796 (7.9%) |
| 40 to 44 Years | 920 (8.5%) | 588 (5.8%) |
| 45 to 49 Years | 577 (5.3%) | 852 (8.5%) |
| 50 to 54 Years | 638 (5.9%) | 514 (5.1%) |
| 55 to 59 Years | 791 (7.3%) | 849 (8.4%) |
| 60 to 64 Years | 857 (7.9%) | 852 (8.5%) |
| 65 to 69 Years | 535 (4.9%) | 481 (4.8%) |
| 70 to 74 Years | 380 (3.5%) | 459 (4.5%) |
| 75 to 79 Years | 264 (2.4%) | 383 (3.8%) |
| 80 to 84 Years | 157 (1.5%) | 268 (2.7%) |
| 85 Years and over | 152 (1.4%) | 290 (2.9%) |
| Total | 10,861 (100.0%) | 10,079 (100.0%) |
Families and Households in Mineola
Median Family Size in Mineola
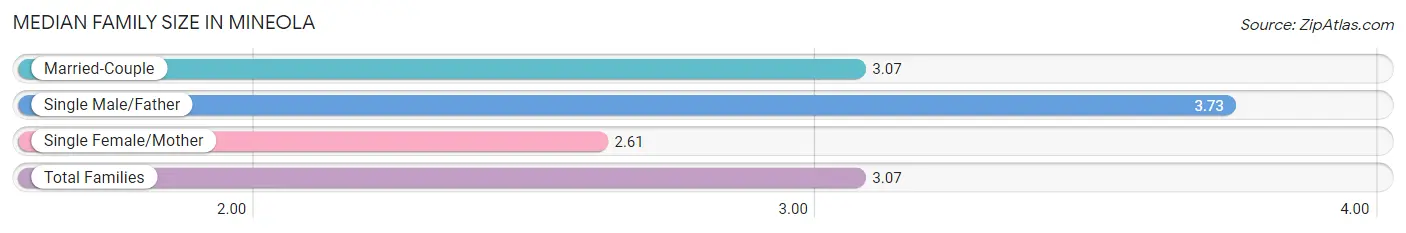
The median family size in Mineola is 3.07 persons per family, with single male/father families (376 | 7.1%) accounting for the largest median family size of 3.73 persons per family. On the other hand, single female/mother families (543 | 10.2%) represent the smallest median family size with 2.61 persons per family.
| Family Type | # Families | Family Size |
| Married-Couple | 4,406 (82.7%) | 3.07 |
| Single Male/Father | 376 (7.1%) | 3.73 |
| Single Female/Mother | 543 (10.2%) | 2.61 |
| Total Families | 5,325 (100.0%) | 3.07 |
Median Household Size in Mineola
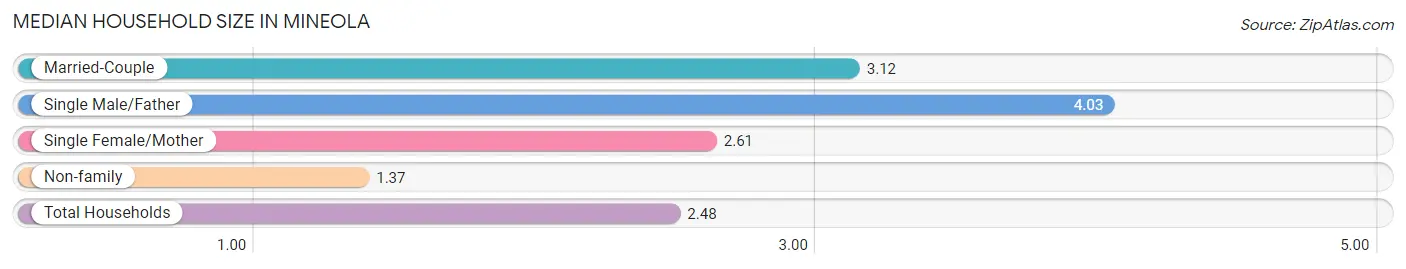
The median household size in Mineola is 2.48 persons per household, with single male/father households (376 | 4.5%) accounting for the largest median household size of 4.03 persons per household. non-family households (3,102 | 36.8%) represent the smallest median household size with 1.37 persons per household.
| Household Type | # Households | Household Size |
| Married-Couple | 4,406 (52.3%) | 3.12 |
| Single Male/Father | 376 (4.5%) | 4.03 |
| Single Female/Mother | 543 (6.4%) | 2.61 |
| Non-family | 3,102 (36.8%) | 1.37 |
| Total Households | 8,427 (100.0%) | 2.48 |
Household Size by Marriage Status in Mineola
Out of a total of 8,427 households in Mineola, 5,325 (63.2%) are family households, while 3,102 (36.8%) are nonfamily households. The most numerous type of family households are 2-person households, comprising 2,332, and the most common type of nonfamily households are 1-person households, comprising 2,304.
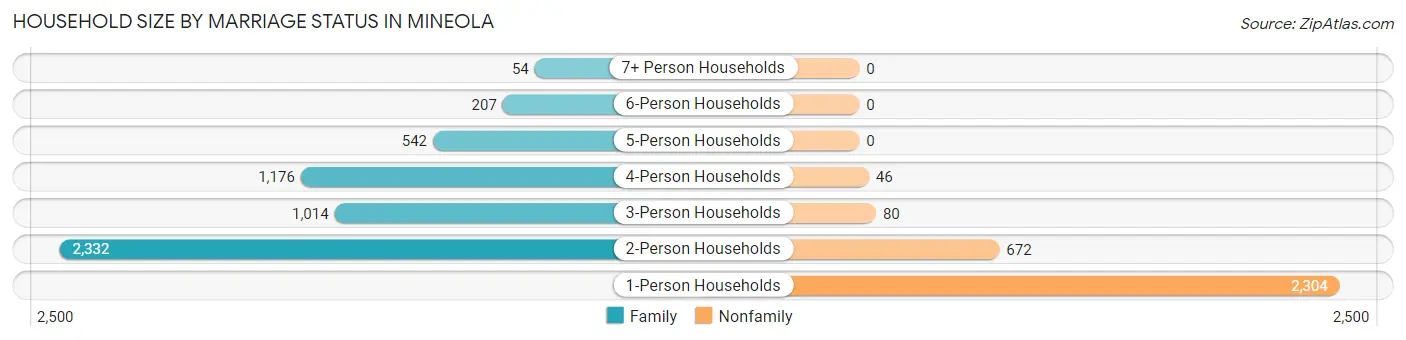
| Household Size | Family Households | Nonfamily Households |
| 1-Person Households | - | 2,304 (27.3%) |
| 2-Person Households | 2,332 (27.7%) | 672 (8.0%) |
| 3-Person Households | 1,014 (12.0%) | 80 (0.9%) |
| 4-Person Households | 1,176 (14.0%) | 46 (0.5%) |
| 5-Person Households | 542 (6.4%) | 0 (0.0%) |
| 6-Person Households | 207 (2.5%) | 0 (0.0%) |
| 7+ Person Households | 54 (0.6%) | 0 (0.0%) |
| Total | 5,325 (63.2%) | 3,102 (36.8%) |
Female Fertility in Mineola
Fertility by Age in Mineola
Average fertility rate in Mineola is 64.0 births per 1,000 women. Women in the age bracket of 35 to 50 years have the highest fertility rate with 79.0 births per 1,000 women. Women in the age bracket of 35 to 50 years acount for 62.1% of all women with births.
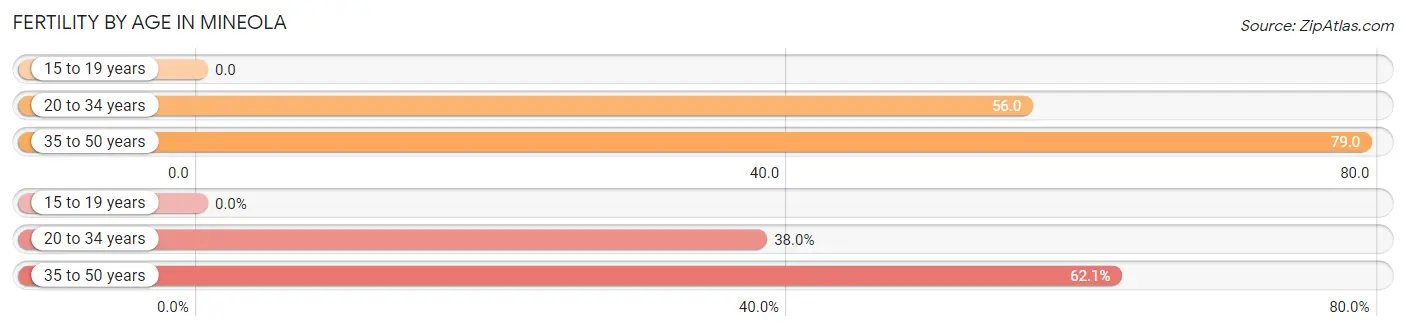
| Age Bracket | Women with Births | Births / 1,000 Women |
| 15 to 19 years | 0 (0.0%) | 0.0 |
| 20 to 34 years | 115 (38.0%) | 56.0 |
| 35 to 50 years | 188 (62.1%) | 79.0 |
| Total | 303 (100.0%) | 64.0 |
Fertility by Age by Marriage Status in Mineola
92.1% of women with births (303) in Mineola are married. The highest percentage of unmarried women with births falls into 35 to 50 years age bracket with 12.8% of them unmarried at the time of birth, while the lowest percentage of unmarried women with births belong to 20 to 34 years age bracket with 0.0% of them unmarried.
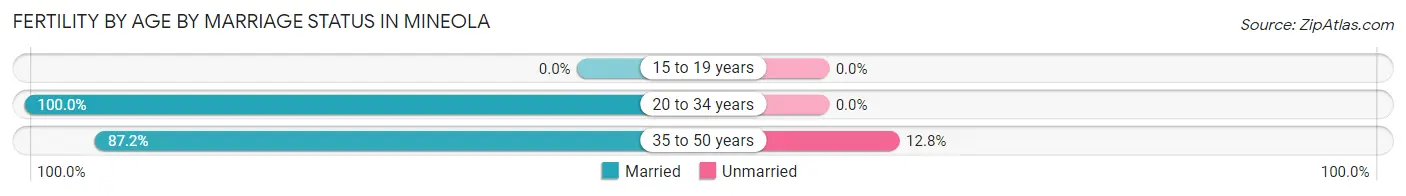
| Age Bracket | Married | Unmarried |
| 15 to 19 years | 0 (0.0%) | 0 (0.0%) |
| 20 to 34 years | 115 (100.0%) | 0 (0.0%) |
| 35 to 50 years | 164 (87.2%) | 24 (12.8%) |
| Total | 279 (92.1%) | 24 (7.9%) |
Fertility by Education in Mineola
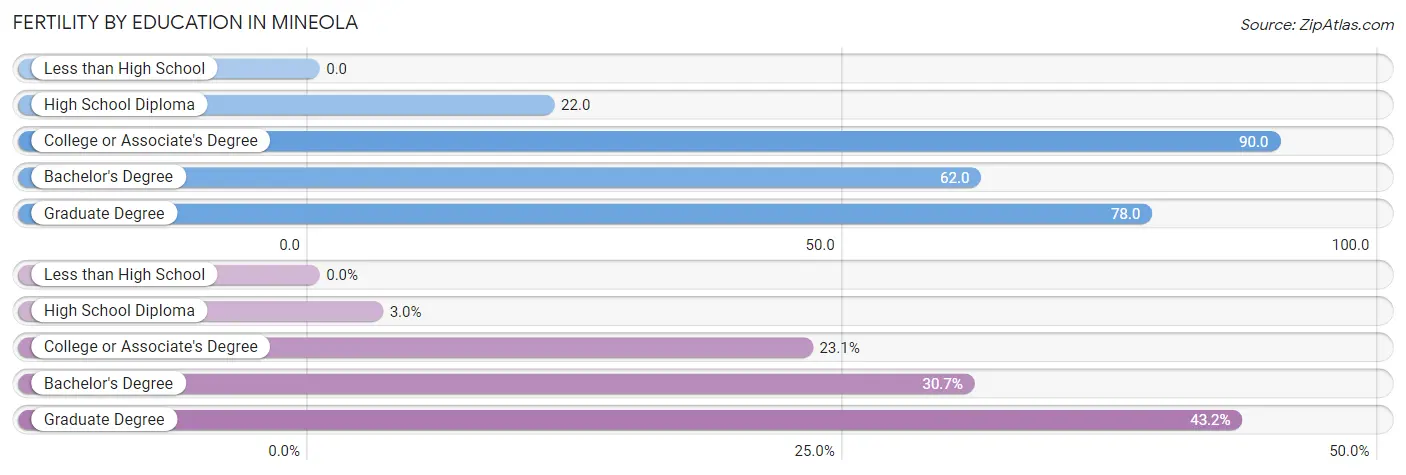
| Educational Attainment | Women with Births | Births / 1,000 Women |
| Less than High School | 0 (0.0%) | 0.0 |
| High School Diploma | 9 (3.0%) | 22.0 |
| College or Associate's Degree | 70 (23.1%) | 90.0 |
| Bachelor's Degree | 93 (30.7%) | 62.0 |
| Graduate Degree | 131 (43.2%) | 78.0 |
| Total | 303 (100.0%) | 64.0 |
Fertility by Education by Marriage Status in Mineola
7.9% of women with births in Mineola are unmarried. Women with the educational attainment of high school diploma are most likely to be married with 100.0% of them married at childbirth, while women with the educational attainment of college or associate's degree are least likely to be married with 34.3% of them unmarried at childbirth.
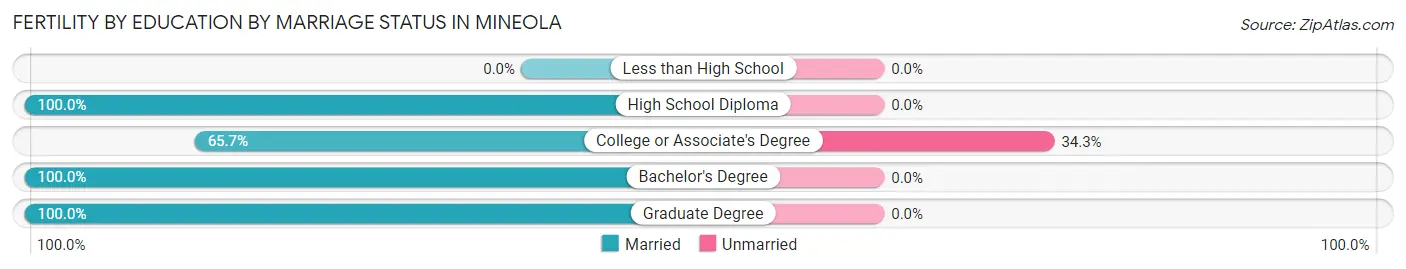
| Educational Attainment | Married | Unmarried |
| Less than High School | 0 (0.0%) | 0 (0.0%) |
| High School Diploma | 9 (100.0%) | 0 (0.0%) |
| College or Associate's Degree | 46 (65.7%) | 24 (34.3%) |
| Bachelor's Degree | 93 (100.0%) | 0 (0.0%) |
| Graduate Degree | 131 (100.0%) | 0 (0.0%) |
| Total | 279 (92.1%) | 24 (7.9%) |
Employment Characteristics in Mineola
Employment by Class of Employer in Mineola
Among the 12,426 employed individuals in Mineola, private company employees (7,144 | 57.5%), not-for-profit organizations (1,530 | 12.3%), and local government employees (1,323 | 10.6%) make up the most common classes of employment.
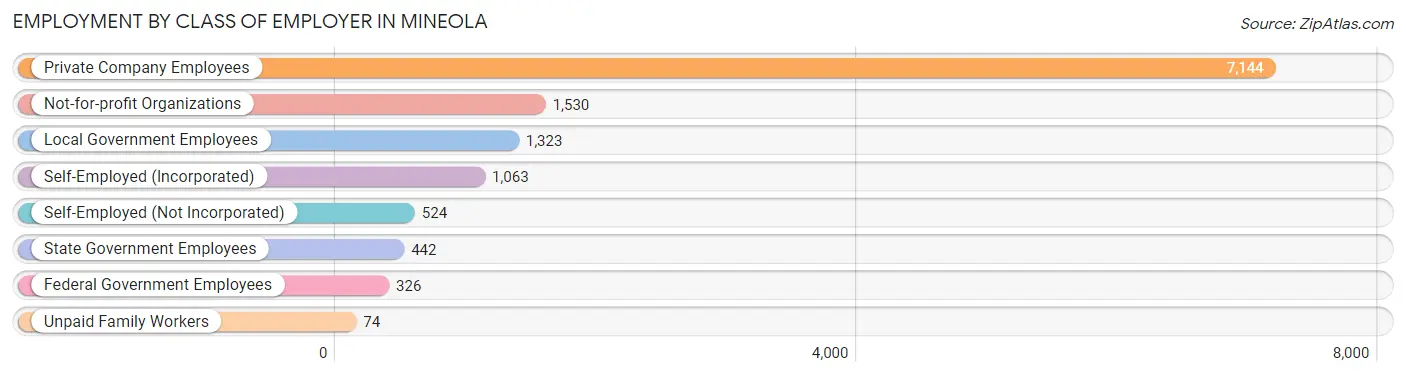
| Employer Class | # Employees | % Employees |
| Private Company Employees | 7,144 | 57.5% |
| Self-Employed (Incorporated) | 1,063 | 8.6% |
| Self-Employed (Not Incorporated) | 524 | 4.2% |
| Not-for-profit Organizations | 1,530 | 12.3% |
| Local Government Employees | 1,323 | 10.6% |
| State Government Employees | 442 | 3.6% |
| Federal Government Employees | 326 | 2.6% |
| Unpaid Family Workers | 74 | 0.6% |
| Total | 12,426 | 100.0% |
Employment Status by Age in Mineola
According to the labor force statistics for Mineola, out of the total population over 16 years of age (17,573), 74.5% or 13,092 individuals are in the labor force, with 3.7% or 484 of them unemployed. The age group with the highest labor force participation rate is 35 to 44 years, with 95.0% or 2,905 individuals in the labor force. Within the labor force, the 16 to 19 years age range has the highest percentage of unemployed individuals, with 23.6% or 41 of them being unemployed.
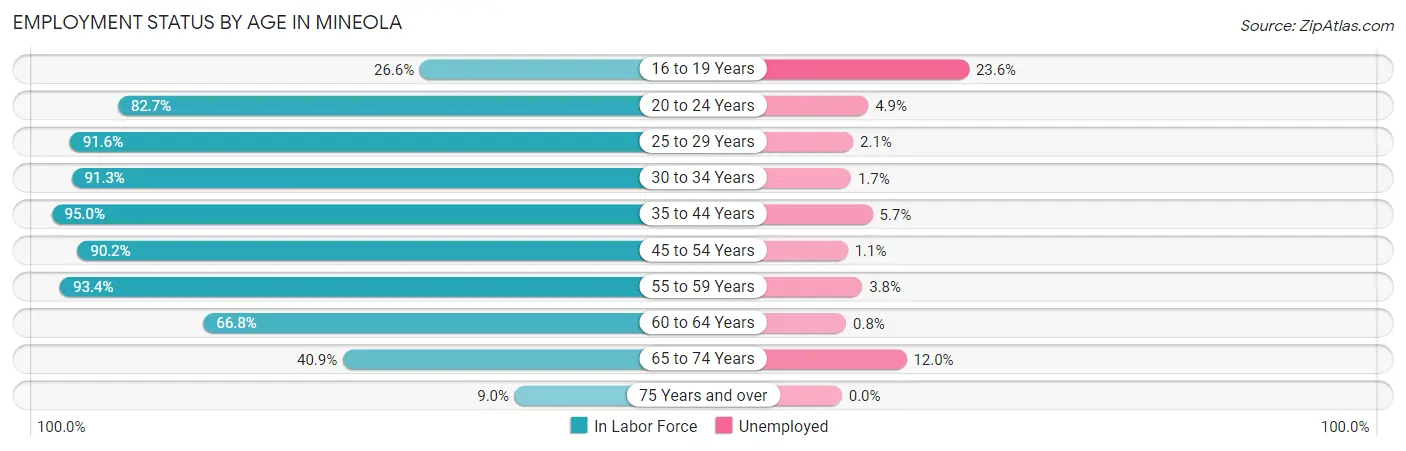
| Age Bracket | In Labor Force | Unemployed |
| 16 to 19 Years | 174 (26.6%) | 41 (23.6%) |
| 20 to 24 Years | 549 (82.7%) | 27 (4.9%) |
| 25 to 29 Years | 1,570 (91.6%) | 33 (2.1%) |
| 30 to 34 Years | 1,993 (91.3%) | 34 (1.7%) |
| 35 to 44 Years | 2,905 (95.0%) | 166 (5.7%) |
| 45 to 54 Years | 2,328 (90.2%) | 26 (1.1%) |
| 55 to 59 Years | 1,532 (93.4%) | 58 (3.8%) |
| 60 to 64 Years | 1,142 (66.8%) | 9 (0.8%) |
| 65 to 74 Years | 759 (40.9%) | 91 (12.0%) |
| 75 Years and over | 136 (9.0%) | 0 (0.0%) |
| Total | 13,092 (74.5%) | 484 (3.7%) |
Employment Status by Educational Attainment in Mineola
According to labor force statistics for Mineola, 89.0% of individuals (11,468) out of the total population between 25 and 64 years of age (12,885) are in the labor force, with 2.9% or 333 of them being unemployed. The group with the highest labor force participation rate are those with the educational attainment of bachelor's degree or higher, with 94.6% or 7,163 individuals in the labor force. Within the labor force, individuals with college / associate degree education have the highest percentage of unemployment, with 4.8% or 95 of them being unemployed.
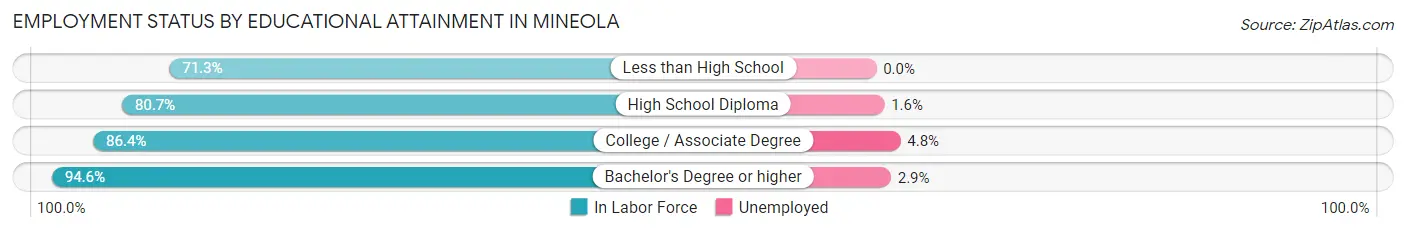
| Educational Attainment | In Labor Force | Unemployed |
| Less than High School | 847 (71.3%) | 0 (0.0%) |
| High School Diploma | 1,471 (80.7%) | 29 (1.6%) |
| College / Associate Degree | 1,989 (86.4%) | 110 (4.8%) |
| Bachelor's Degree or higher | 7,163 (94.6%) | 220 (2.9%) |
| Total | 11,468 (89.0%) | 374 (2.9%) |
Employment Occupations by Sex in Mineola
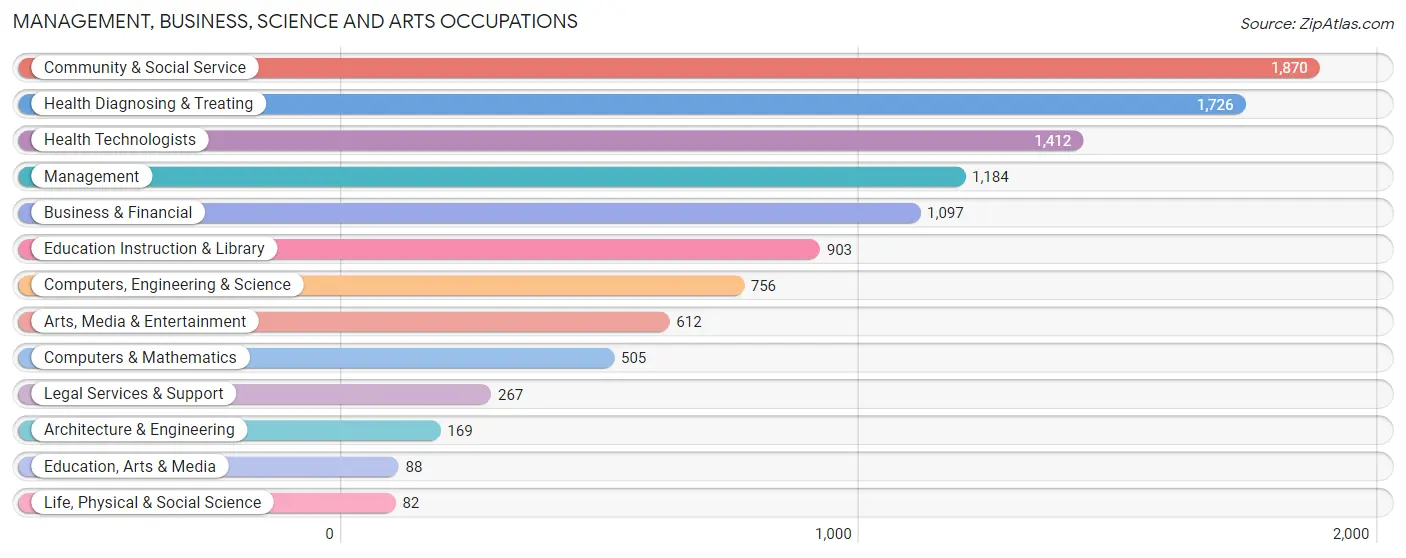
Management, Business, Science and Arts Occupations
The most common Management, Business, Science and Arts occupations in Mineola are Community & Social Service (1,870 | 14.8%), Health Diagnosing & Treating (1,726 | 13.7%), Health Technologists (1,412 | 11.2%), Management (1,184 | 9.4%), and Business & Financial (1,097 | 8.7%).
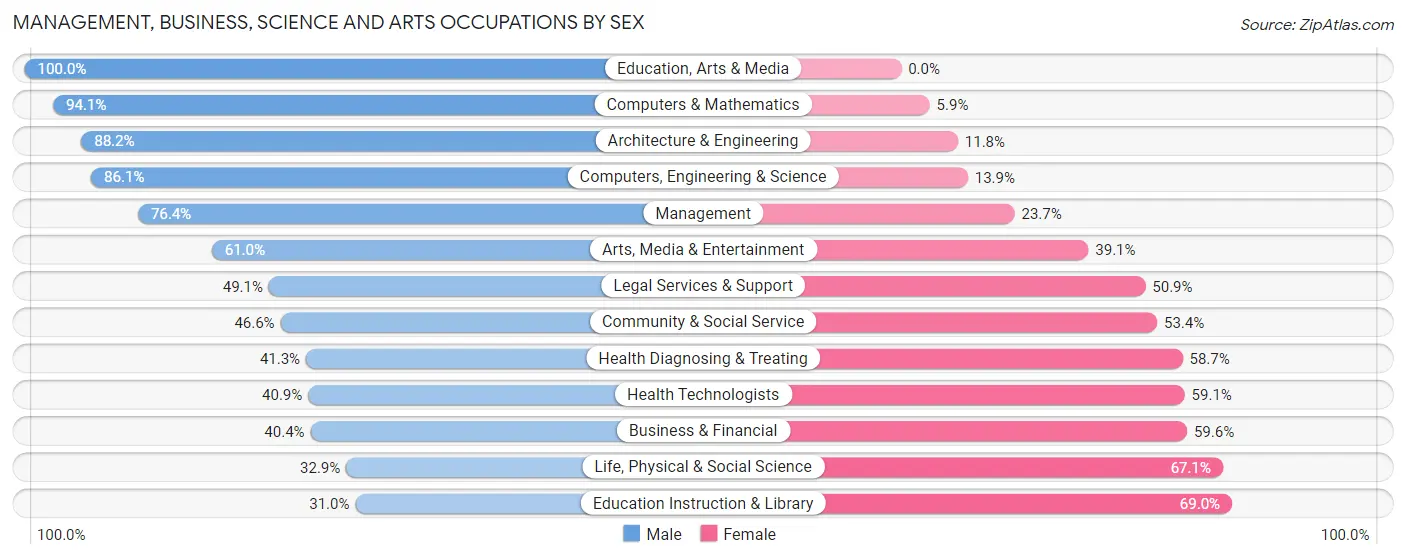
Management, Business, Science and Arts Occupations by Sex
Within the Management, Business, Science and Arts occupations in Mineola, the most male-oriented occupations are Education, Arts & Media (100.0%), Computers & Mathematics (94.1%), and Architecture & Engineering (88.2%), while the most female-oriented occupations are Education Instruction & Library (69.0%), Life, Physical & Social Science (67.1%), and Business & Financial (59.6%).
| Occupation | Male | Female |
| Management | 904 (76.3%) | 280 (23.6%) |
| Business & Financial | 443 (40.4%) | 654 (59.6%) |
| Computers, Engineering & Science | 651 (86.1%) | 105 (13.9%) |
| Computers & Mathematics | 475 (94.1%) | 30 (5.9%) |
| Architecture & Engineering | 149 (88.2%) | 20 (11.8%) |
| Life, Physical & Social Science | 27 (32.9%) | 55 (67.1%) |
| Community & Social Service | 872 (46.6%) | 998 (53.4%) |
| Education, Arts & Media | 88 (100.0%) | 0 (0.0%) |
| Legal Services & Support | 131 (49.1%) | 136 (50.9%) |
| Education Instruction & Library | 280 (31.0%) | 623 (69.0%) |
| Arts, Media & Entertainment | 373 (61.0%) | 239 (39.1%) |
| Health Diagnosing & Treating | 713 (41.3%) | 1,013 (58.7%) |
| Health Technologists | 577 (40.9%) | 835 (59.1%) |
| Total (Category) | 3,583 (54.0%) | 3,050 (46.0%) |
| Total (Overall) | 6,826 (54.1%) | 5,779 (45.9%) |
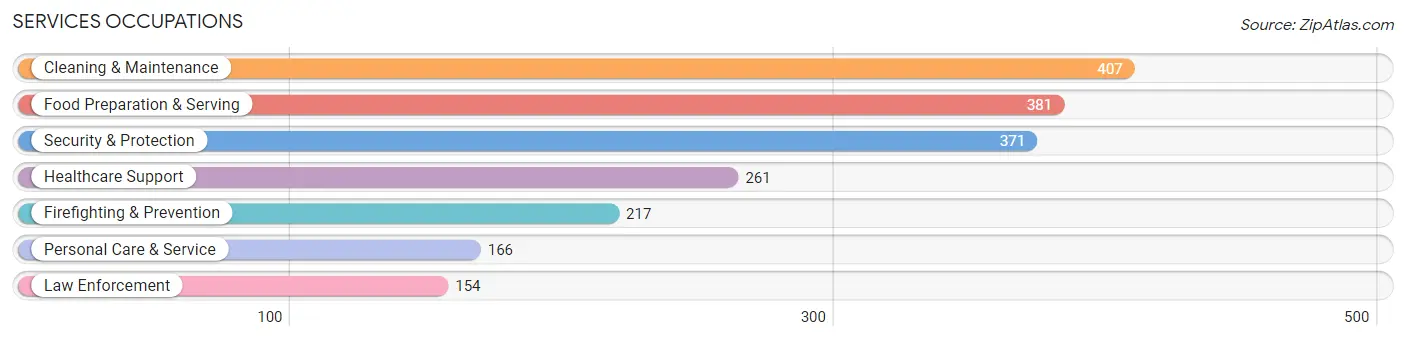
Services Occupations
The most common Services occupations in Mineola are Cleaning & Maintenance (407 | 3.2%), Food Preparation & Serving (381 | 3.0%), Security & Protection (371 | 2.9%), Healthcare Support (261 | 2.1%), and Firefighting & Prevention (217 | 1.7%).
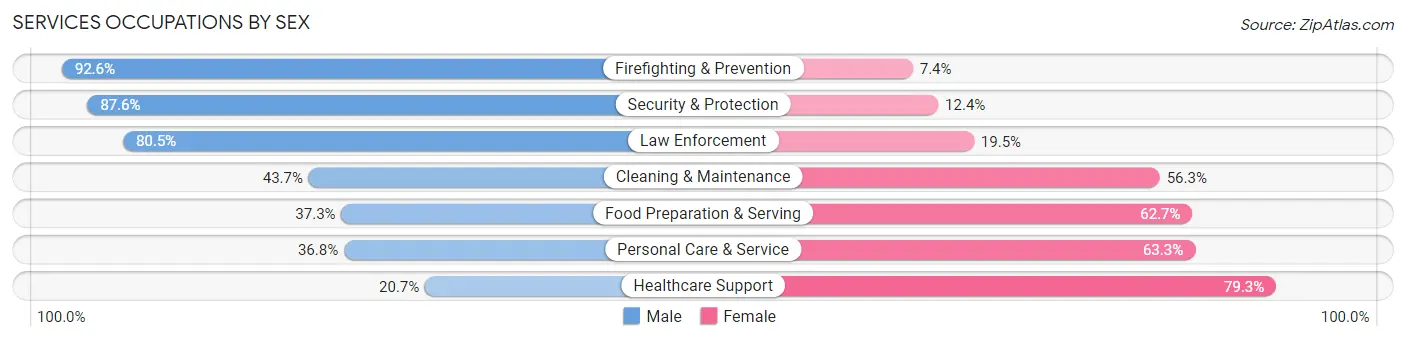
Services Occupations by Sex
Within the Services occupations in Mineola, the most male-oriented occupations are Firefighting & Prevention (92.6%), Security & Protection (87.6%), and Law Enforcement (80.5%), while the most female-oriented occupations are Healthcare Support (79.3%), Personal Care & Service (63.2%), and Food Preparation & Serving (62.7%).
| Occupation | Male | Female |
| Healthcare Support | 54 (20.7%) | 207 (79.3%) |
| Security & Protection | 325 (87.6%) | 46 (12.4%) |
| Firefighting & Prevention | 201 (92.6%) | 16 (7.4%) |
| Law Enforcement | 124 (80.5%) | 30 (19.5%) |
| Food Preparation & Serving | 142 (37.3%) | 239 (62.7%) |
| Cleaning & Maintenance | 178 (43.7%) | 229 (56.3%) |
| Personal Care & Service | 61 (36.7%) | 105 (63.2%) |
| Total (Category) | 760 (47.9%) | 826 (52.1%) |
| Total (Overall) | 6,826 (54.1%) | 5,779 (45.9%) |
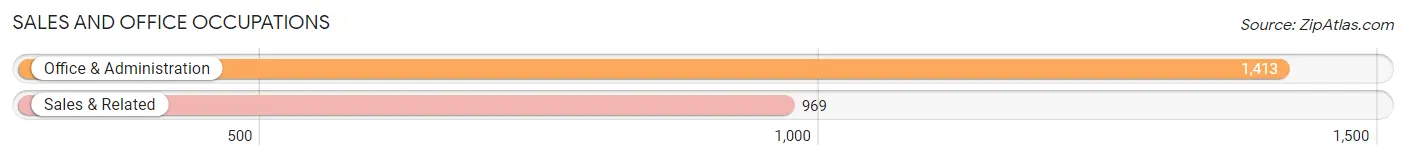
Sales and Office Occupations
The most common Sales and Office occupations in Mineola are Office & Administration (1,413 | 11.2%), and Sales & Related (969 | 7.7%).
Sales and Office Occupations by Sex
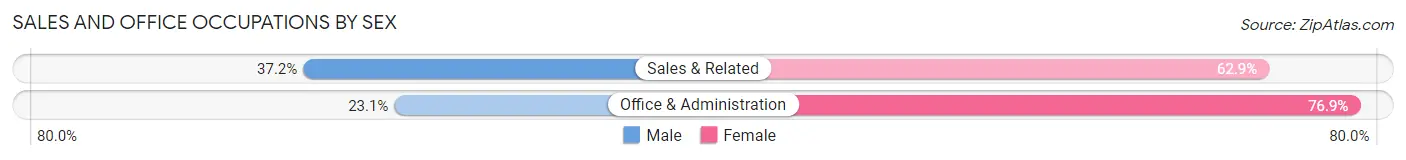
| Occupation | Male | Female |
| Sales & Related | 360 (37.1%) | 609 (62.8%) |
| Office & Administration | 327 (23.1%) | 1,086 (76.9%) |
| Total (Category) | 687 (28.8%) | 1,695 (71.2%) |
| Total (Overall) | 6,826 (54.1%) | 5,779 (45.9%) |
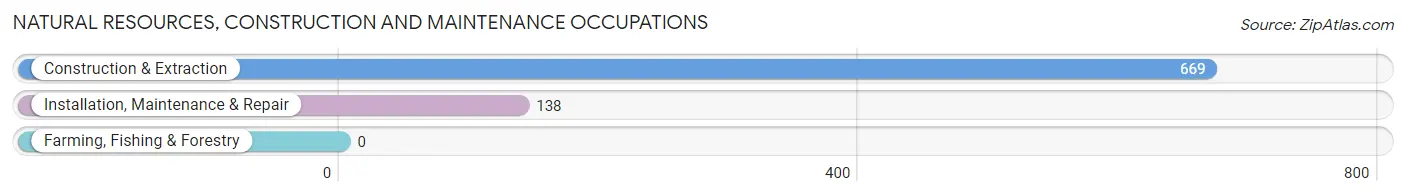
Natural Resources, Construction and Maintenance Occupations
The most common Natural Resources, Construction and Maintenance occupations in Mineola are Construction & Extraction (669 | 5.3%), and Installation, Maintenance & Repair (138 | 1.1%).
Natural Resources, Construction and Maintenance Occupations by Sex
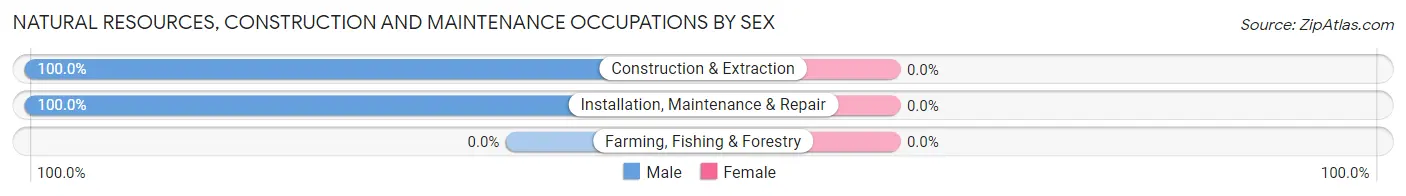
| Occupation | Male | Female |
| Farming, Fishing & Forestry | 0 (0.0%) | 0 (0.0%) |
| Construction & Extraction | 669 (100.0%) | 0 (0.0%) |
| Installation, Maintenance & Repair | 138 (100.0%) | 0 (0.0%) |
| Total (Category) | 807 (100.0%) | 0 (0.0%) |
| Total (Overall) | 6,826 (54.1%) | 5,779 (45.9%) |
Production, Transportation and Moving Occupations
The most common Production, Transportation and Moving occupations in Mineola are Transportation (701 | 5.6%), Production (398 | 3.2%), and Material Moving (98 | 0.8%).
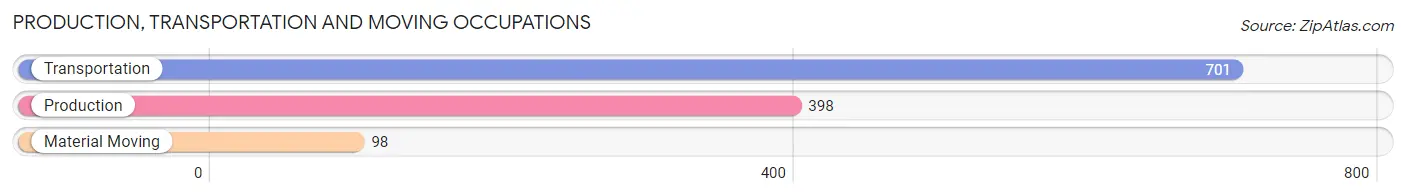
Production, Transportation and Moving Occupations by Sex
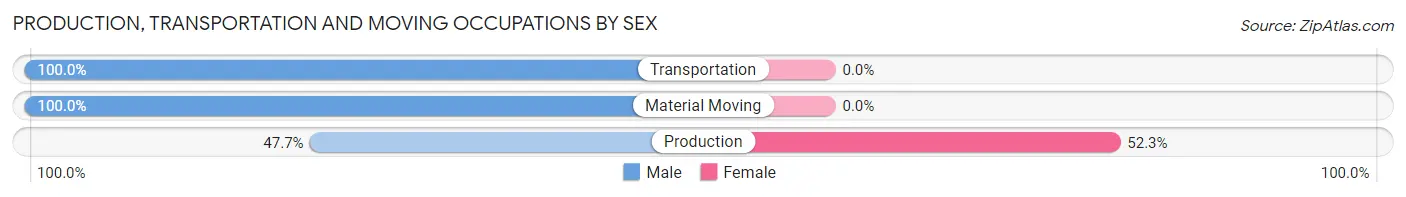
| Occupation | Male | Female |
| Production | 190 (47.7%) | 208 (52.3%) |
| Transportation | 701 (100.0%) | 0 (0.0%) |
| Material Moving | 98 (100.0%) | 0 (0.0%) |
| Total (Category) | 989 (82.6%) | 208 (17.4%) |
| Total (Overall) | 6,826 (54.1%) | 5,779 (45.9%) |
Employment Industries by Sex in Mineola
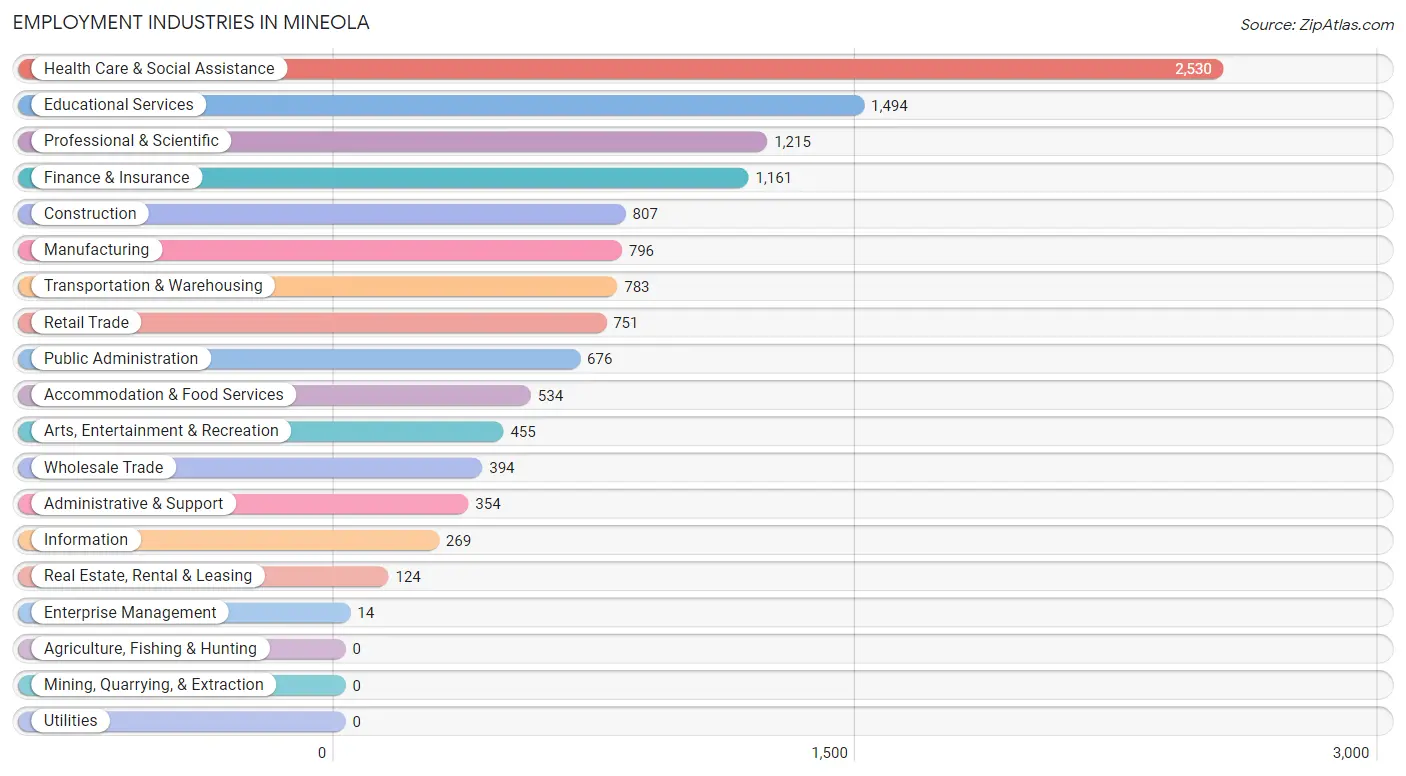
Employment Industries in Mineola
The major employment industries in Mineola include Health Care & Social Assistance (2,530 | 20.1%), Educational Services (1,494 | 11.8%), Professional & Scientific (1,215 | 9.6%), Finance & Insurance (1,161 | 9.2%), and Construction (807 | 6.4%).
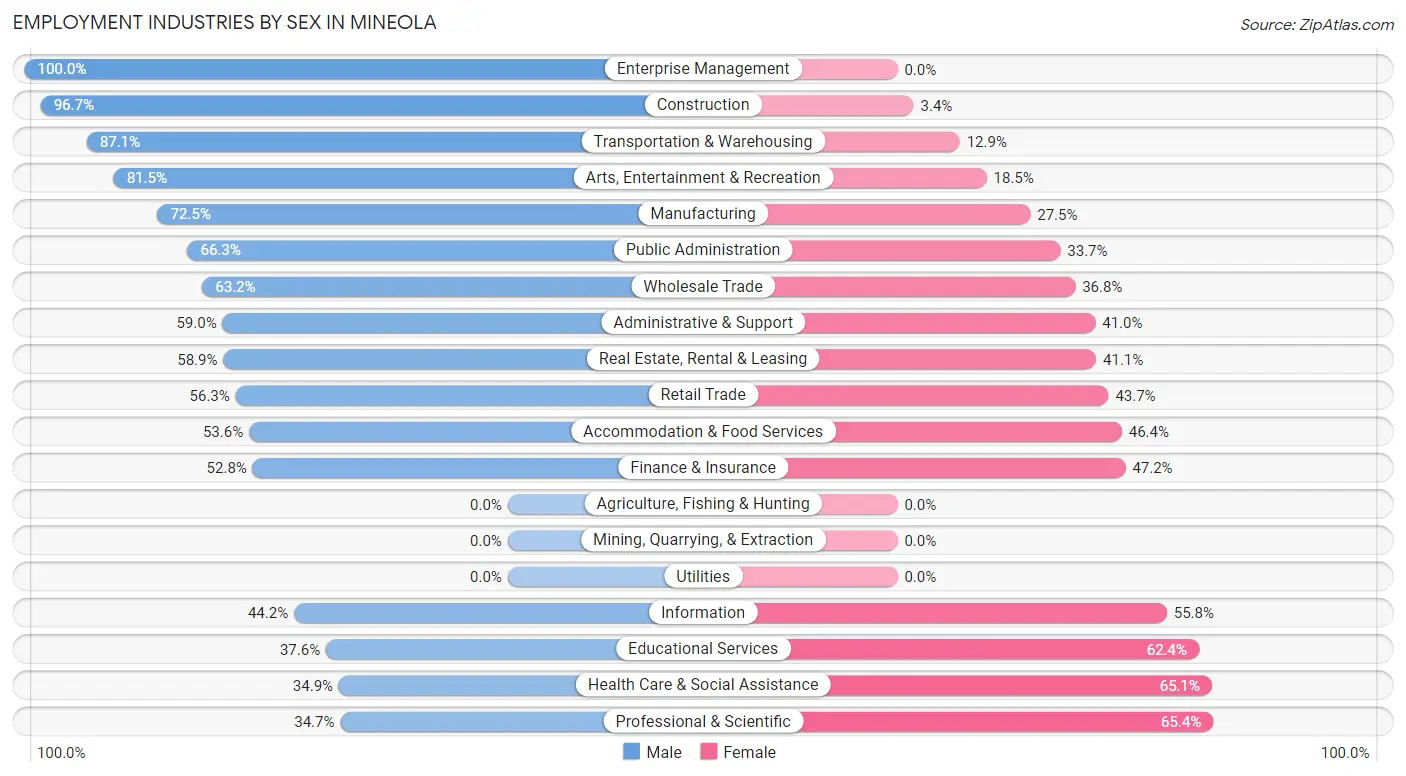
Employment Industries by Sex in Mineola
The Mineola industries that see more men than women are Enterprise Management (100.0%), Construction (96.7%), and Transportation & Warehousing (87.1%), whereas the industries that tend to have a higher number of women are Professional & Scientific (65.3%), Health Care & Social Assistance (65.1%), and Educational Services (62.4%).
| Industry | Male | Female |
| Agriculture, Fishing & Hunting | 0 (0.0%) | 0 (0.0%) |
| Mining, Quarrying, & Extraction | 0 (0.0%) | 0 (0.0%) |
| Construction | 780 (96.7%) | 27 (3.4%) |
| Manufacturing | 577 (72.5%) | 219 (27.5%) |
| Wholesale Trade | 249 (63.2%) | 145 (36.8%) |
| Retail Trade | 423 (56.3%) | 328 (43.7%) |
| Transportation & Warehousing | 682 (87.1%) | 101 (12.9%) |
| Utilities | 0 (0.0%) | 0 (0.0%) |
| Information | 119 (44.2%) | 150 (55.8%) |
| Finance & Insurance | 613 (52.8%) | 548 (47.2%) |
| Real Estate, Rental & Leasing | 73 (58.9%) | 51 (41.1%) |
| Professional & Scientific | 421 (34.6%) | 794 (65.3%) |
| Enterprise Management | 14 (100.0%) | 0 (0.0%) |
| Administrative & Support | 209 (59.0%) | 145 (41.0%) |
| Educational Services | 562 (37.6%) | 932 (62.4%) |
| Health Care & Social Assistance | 884 (34.9%) | 1,646 (65.1%) |
| Arts, Entertainment & Recreation | 371 (81.5%) | 84 (18.5%) |
| Accommodation & Food Services | 286 (53.6%) | 248 (46.4%) |
| Public Administration | 448 (66.3%) | 228 (33.7%) |
| Total | 6,826 (54.1%) | 5,779 (45.9%) |
Education in Mineola
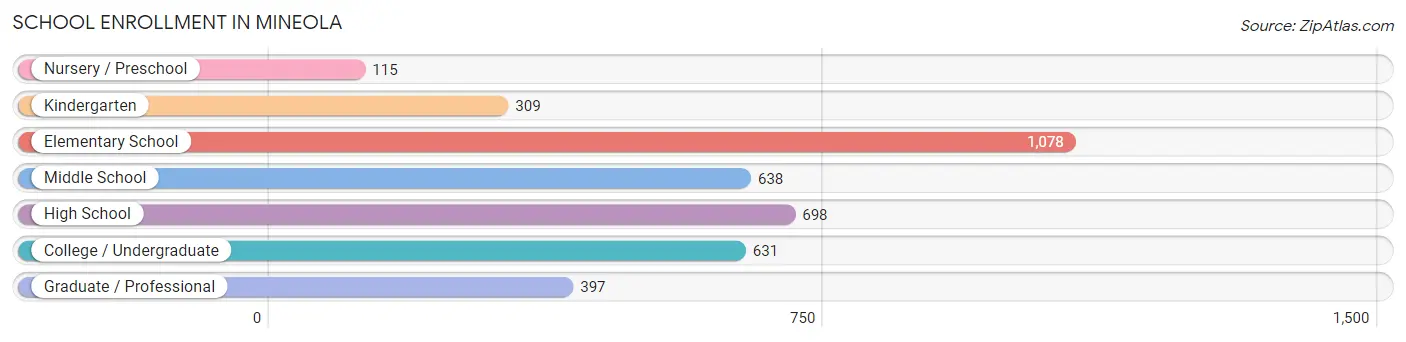
School Enrollment in Mineola
The most common levels of schooling among the 3,866 students in Mineola are elementary school (1,078 | 27.9%), high school (698 | 18.0%), and middle school (638 | 16.5%).
| School Level | # Students | % Students |
| Nursery / Preschool | 115 | 3.0% |
| Kindergarten | 309 | 8.0% |
| Elementary School | 1,078 | 27.9% |
| Middle School | 638 | 16.5% |
| High School | 698 | 18.0% |
| College / Undergraduate | 631 | 16.3% |
| Graduate / Professional | 397 | 10.3% |
| Total | 3,866 | 100.0% |
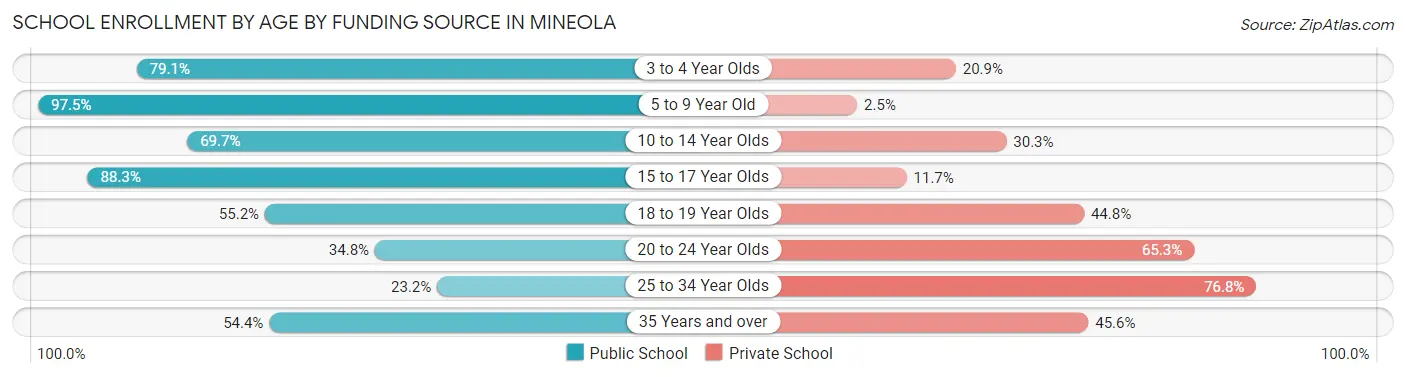
School Enrollment by Age by Funding Source in Mineola
Out of a total of 3,866 students who are enrolled in schools in Mineola, 997 (25.8%) attend a private institution, while the remaining 2,869 (74.2%) are enrolled in public schools. The age group of 25 to 34 year olds has the highest likelihood of being enrolled in private schools, with 242 (76.8% in the age bracket) enrolled. Conversely, the age group of 5 to 9 year old has the lowest likelihood of being enrolled in a private school, with 1,362 (97.5% in the age bracket) attending a public institution.
| Age Bracket | Public School | Private School |
| 3 to 4 Year Olds | 72 (79.1%) | 19 (20.9%) |
| 5 to 9 Year Old | 1,362 (97.5%) | 35 (2.5%) |
| 10 to 14 Year Olds | 589 (69.7%) | 256 (30.3%) |
| 15 to 17 Year Olds | 422 (88.3%) | 56 (11.7%) |
| 18 to 19 Year Olds | 116 (55.2%) | 94 (44.8%) |
| 20 to 24 Year Olds | 98 (34.7%) | 184 (65.2%) |
| 25 to 34 Year Olds | 73 (23.2%) | 242 (76.8%) |
| 35 Years and over | 135 (54.4%) | 113 (45.6%) |
| Total | 2,869 (74.2%) | 997 (25.8%) |
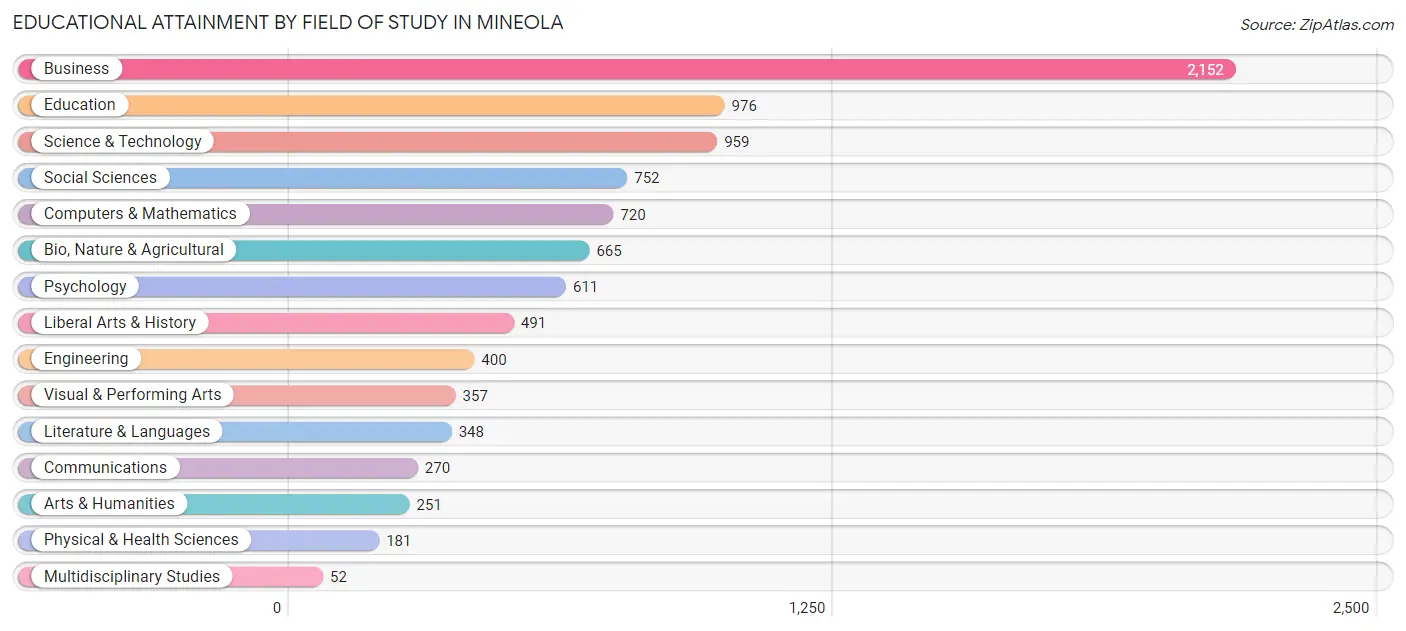
Educational Attainment by Field of Study in Mineola
Business (2,152 | 23.4%), education (976 | 10.6%), science & technology (959 | 10.4%), social sciences (752 | 8.2%), and computers & mathematics (720 | 7.8%) are the most common fields of study among 9,185 individuals in Mineola who have obtained a bachelor's degree or higher.
| Field of Study | # Graduates | % Graduates |
| Computers & Mathematics | 720 | 7.8% |
| Bio, Nature & Agricultural | 665 | 7.2% |
| Physical & Health Sciences | 181 | 2.0% |
| Psychology | 611 | 6.7% |
| Social Sciences | 752 | 8.2% |
| Engineering | 400 | 4.3% |
| Multidisciplinary Studies | 52 | 0.6% |
| Science & Technology | 959 | 10.4% |
| Business | 2,152 | 23.4% |
| Education | 976 | 10.6% |
| Literature & Languages | 348 | 3.8% |
| Liberal Arts & History | 491 | 5.3% |
| Visual & Performing Arts | 357 | 3.9% |
| Communications | 270 | 2.9% |
| Arts & Humanities | 251 | 2.7% |
| Total | 9,185 | 100.0% |
Transportation & Commute in Mineola
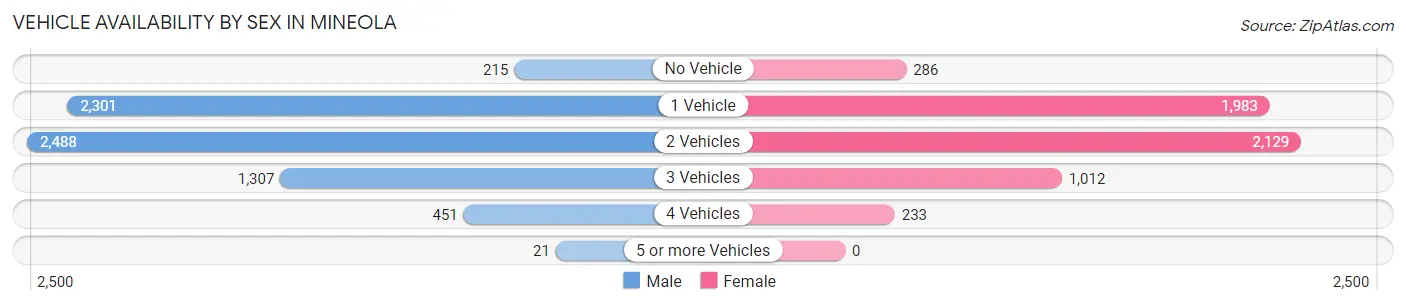
Vehicle Availability by Sex in Mineola
The most prevalent vehicle ownership categories in Mineola are males with 2 vehicles (2,488, accounting for 36.7%) and females with 2 vehicles (2,129, making up 44.1%).
| Vehicles Available | Male | Female |
| No Vehicle | 215 (3.2%) | 286 (5.1%) |
| 1 Vehicle | 2,301 (33.9%) | 1,983 (35.1%) |
| 2 Vehicles | 2,488 (36.7%) | 2,129 (37.7%) |
| 3 Vehicles | 1,307 (19.3%) | 1,012 (17.9%) |
| 4 Vehicles | 451 (6.7%) | 233 (4.1%) |
| 5 or more Vehicles | 21 (0.3%) | 0 (0.0%) |
| Total | 6,783 (100.0%) | 5,643 (100.0%) |
Commute Time in Mineola
The most frequently occuring commute durations in Mineola are 60 to 89 minutes (1,693 commuters, 15.5%), 30 to 34 minutes (1,609 commuters, 14.8%), and 20 to 24 minutes (1,556 commuters, 14.3%).
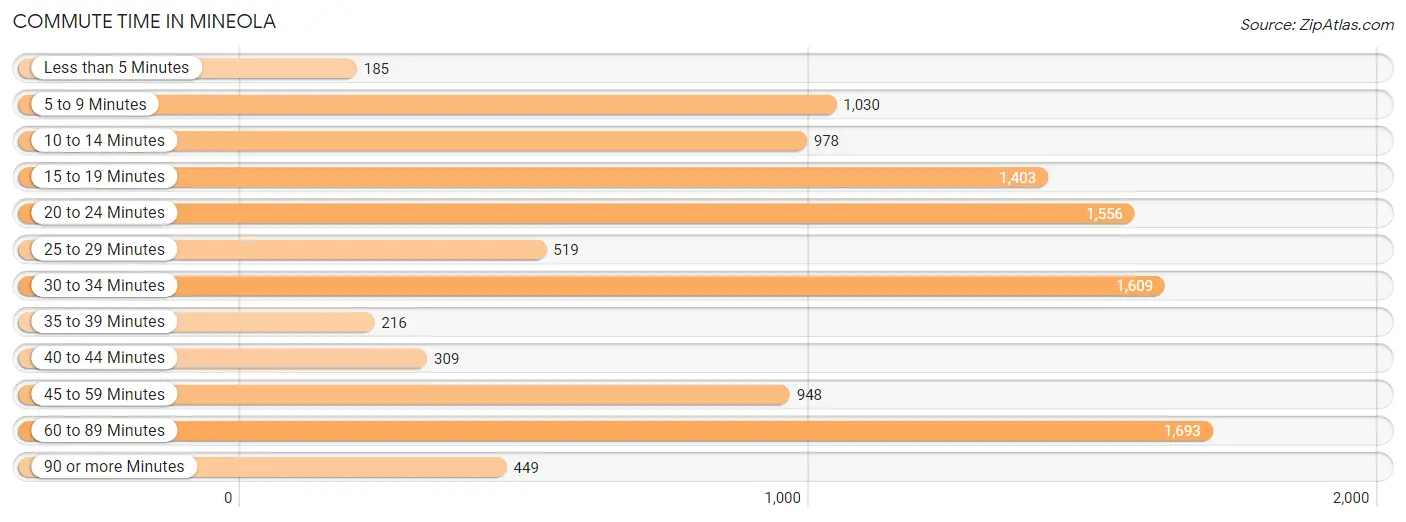
| Commute Time | # Commuters | % Commuters |
| Less than 5 Minutes | 185 | 1.7% |
| 5 to 9 Minutes | 1,030 | 9.5% |
| 10 to 14 Minutes | 978 | 9.0% |
| 15 to 19 Minutes | 1,403 | 12.9% |
| 20 to 24 Minutes | 1,556 | 14.3% |
| 25 to 29 Minutes | 519 | 4.8% |
| 30 to 34 Minutes | 1,609 | 14.8% |
| 35 to 39 Minutes | 216 | 2.0% |
| 40 to 44 Minutes | 309 | 2.8% |
| 45 to 59 Minutes | 948 | 8.7% |
| 60 to 89 Minutes | 1,693 | 15.5% |
| 90 or more Minutes | 449 | 4.1% |
Commute Time by Sex in Mineola
The most common commute times in Mineola are 60 to 89 minutes (991 commuters, 16.2%) for males and 15 to 19 minutes (885 commuters, 18.5%) for females.
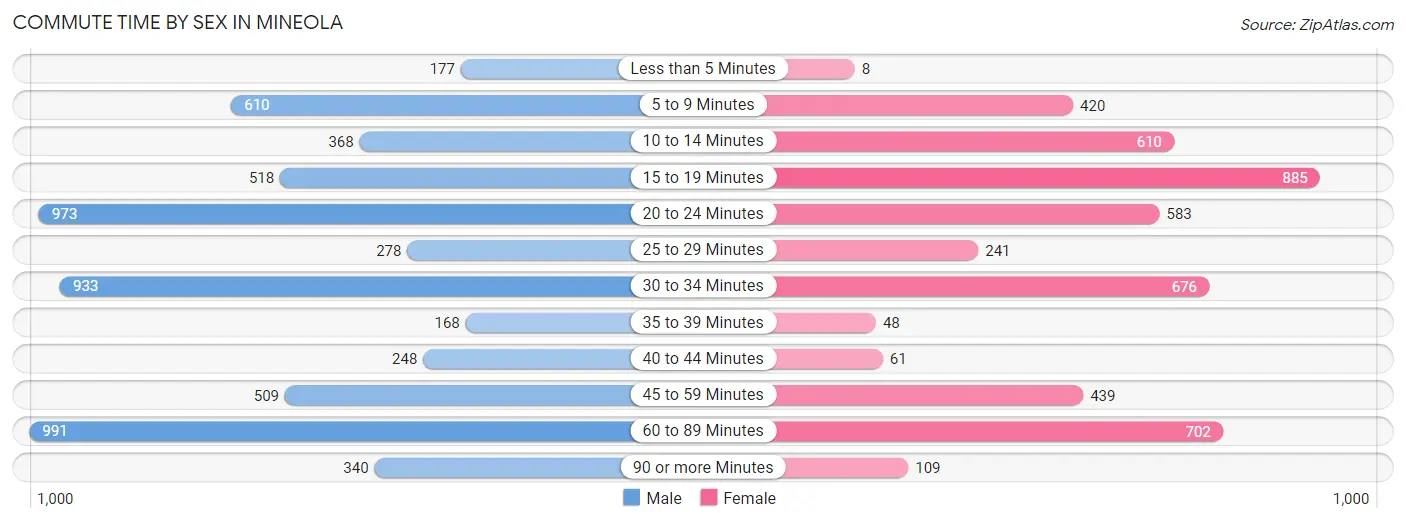
| Commute Time | Male | Female |
| Less than 5 Minutes | 177 (2.9%) | 8 (0.2%) |
| 5 to 9 Minutes | 610 (10.0%) | 420 (8.8%) |
| 10 to 14 Minutes | 368 (6.0%) | 610 (12.8%) |
| 15 to 19 Minutes | 518 (8.5%) | 885 (18.5%) |
| 20 to 24 Minutes | 973 (15.9%) | 583 (12.2%) |
| 25 to 29 Minutes | 278 (4.5%) | 241 (5.0%) |
| 30 to 34 Minutes | 933 (15.3%) | 676 (14.1%) |
| 35 to 39 Minutes | 168 (2.8%) | 48 (1.0%) |
| 40 to 44 Minutes | 248 (4.1%) | 61 (1.3%) |
| 45 to 59 Minutes | 509 (8.3%) | 439 (9.2%) |
| 60 to 89 Minutes | 991 (16.2%) | 702 (14.7%) |
| 90 or more Minutes | 340 (5.6%) | 109 (2.3%) |
Time of Departure to Work by Sex in Mineola
The most frequent times of departure to work in Mineola are 6:30 AM to 6:59 AM (849, 13.9%) for males and 7:00 AM to 7:29 AM (1,042, 21.8%) for females.
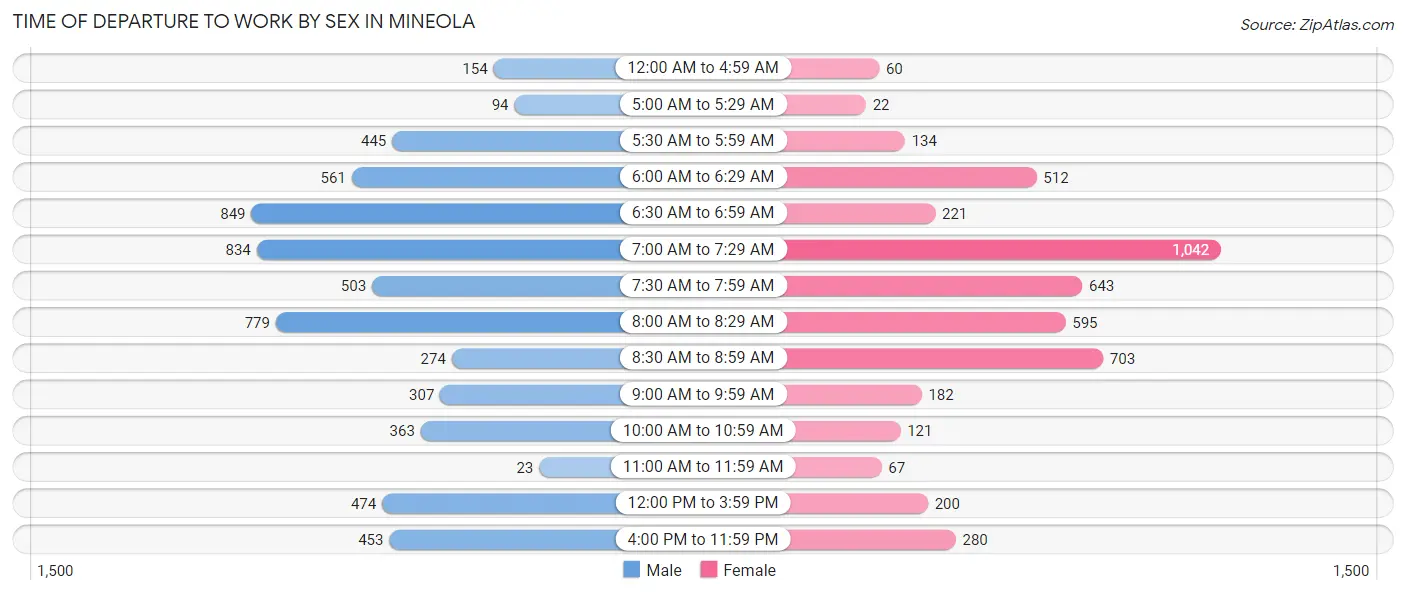
| Time of Departure | Male | Female |
| 12:00 AM to 4:59 AM | 154 (2.5%) | 60 (1.3%) |
| 5:00 AM to 5:29 AM | 94 (1.5%) | 22 (0.5%) |
| 5:30 AM to 5:59 AM | 445 (7.3%) | 134 (2.8%) |
| 6:00 AM to 6:29 AM | 561 (9.2%) | 512 (10.7%) |
| 6:30 AM to 6:59 AM | 849 (13.9%) | 221 (4.6%) |
| 7:00 AM to 7:29 AM | 834 (13.6%) | 1,042 (21.8%) |
| 7:30 AM to 7:59 AM | 503 (8.2%) | 643 (13.5%) |
| 8:00 AM to 8:29 AM | 779 (12.7%) | 595 (12.4%) |
| 8:30 AM to 8:59 AM | 274 (4.5%) | 703 (14.7%) |
| 9:00 AM to 9:59 AM | 307 (5.0%) | 182 (3.8%) |
| 10:00 AM to 10:59 AM | 363 (5.9%) | 121 (2.5%) |
| 11:00 AM to 11:59 AM | 23 (0.4%) | 67 (1.4%) |
| 12:00 PM to 3:59 PM | 474 (7.7%) | 200 (4.2%) |
| 4:00 PM to 11:59 PM | 453 (7.4%) | 280 (5.9%) |
| Total | 6,113 (100.0%) | 4,782 (100.0%) |
Housing Occupancy in Mineola
Occupancy by Ownership in Mineola
Of the total 8,427 dwellings in Mineola, owner-occupied units account for 5,269 (62.5%), while renter-occupied units make up 3,158 (37.5%).
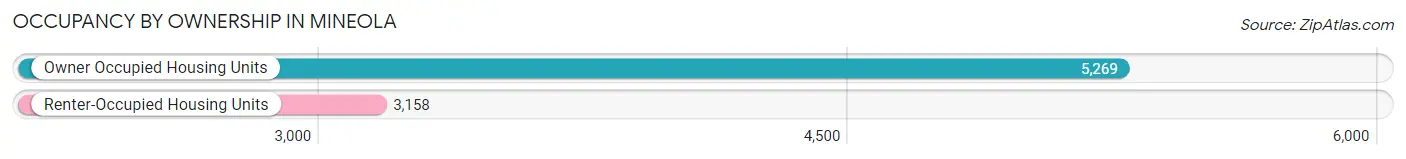
| Occupancy | # Housing Units | % Housing Units |
| Owner Occupied Housing Units | 5,269 | 62.5% |
| Renter-Occupied Housing Units | 3,158 | 37.5% |
| Total Occupied Housing Units | 8,427 | 100.0% |
Occupancy by Household Size in Mineola
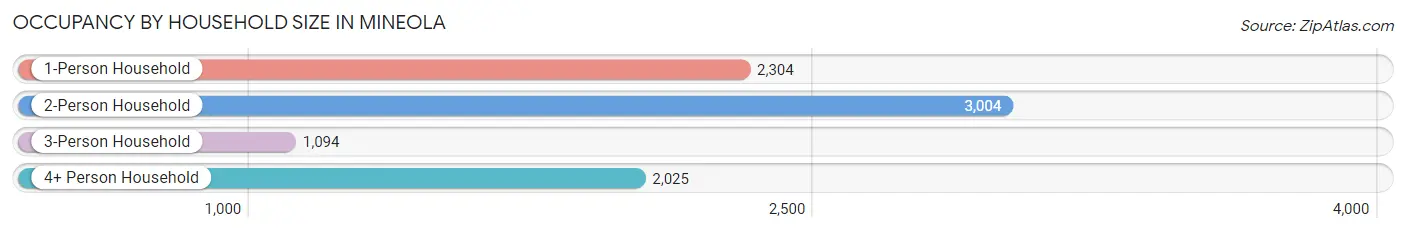
| Household Size | # Housing Units | % Housing Units |
| 1-Person Household | 2,304 | 27.3% |
| 2-Person Household | 3,004 | 35.6% |
| 3-Person Household | 1,094 | 13.0% |
| 4+ Person Household | 2,025 | 24.0% |
| Total Housing Units | 8,427 | 100.0% |
Occupancy by Ownership by Household Size in Mineola
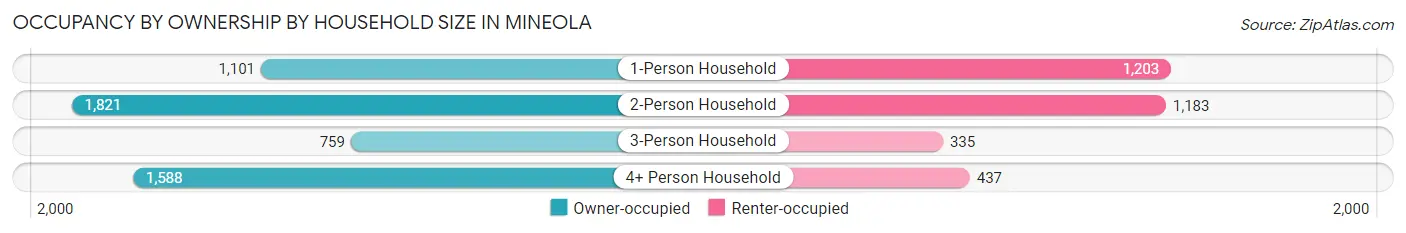
| Household Size | Owner-occupied | Renter-occupied |
| 1-Person Household | 1,101 (47.8%) | 1,203 (52.2%) |
| 2-Person Household | 1,821 (60.6%) | 1,183 (39.4%) |
| 3-Person Household | 759 (69.4%) | 335 (30.6%) |
| 4+ Person Household | 1,588 (78.4%) | 437 (21.6%) |
| Total Housing Units | 5,269 (62.5%) | 3,158 (37.5%) |
Occupancy by Educational Attainment in Mineola
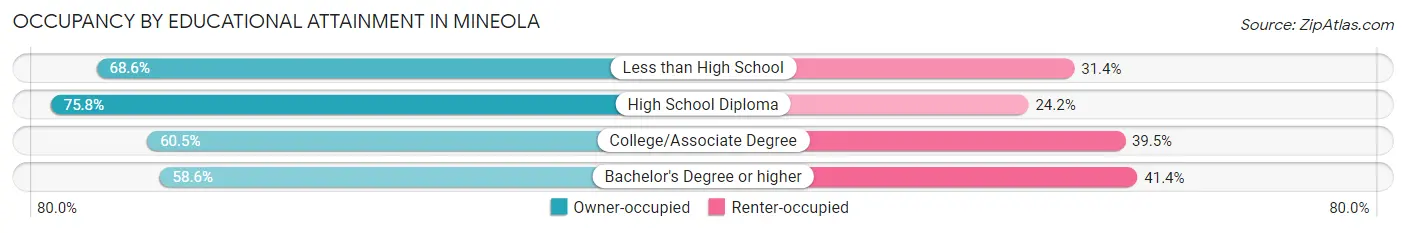
| Household Size | Owner-occupied | Renter-occupied |
| Less than High School | 585 (68.6%) | 268 (31.4%) |
| High School Diploma | 973 (75.8%) | 310 (24.2%) |
| College/Associate Degree | 810 (60.5%) | 528 (39.5%) |
| Bachelor's Degree or higher | 2,901 (58.6%) | 2,052 (41.4%) |
Occupancy by Age of Householder in Mineola
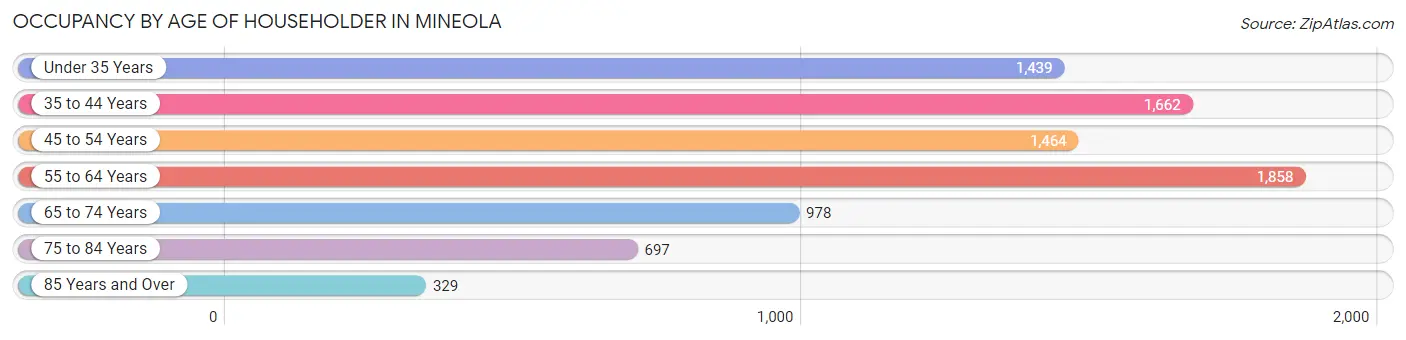
| Age Bracket | # Households | % Households |
| Under 35 Years | 1,439 | 17.1% |
| 35 to 44 Years | 1,662 | 19.7% |
| 45 to 54 Years | 1,464 | 17.4% |
| 55 to 64 Years | 1,858 | 22.1% |
| 65 to 74 Years | 978 | 11.6% |
| 75 to 84 Years | 697 | 8.3% |
| 85 Years and Over | 329 | 3.9% |
| Total | 8,427 | 100.0% |
Housing Finances in Mineola
Median Income by Occupancy in Mineola
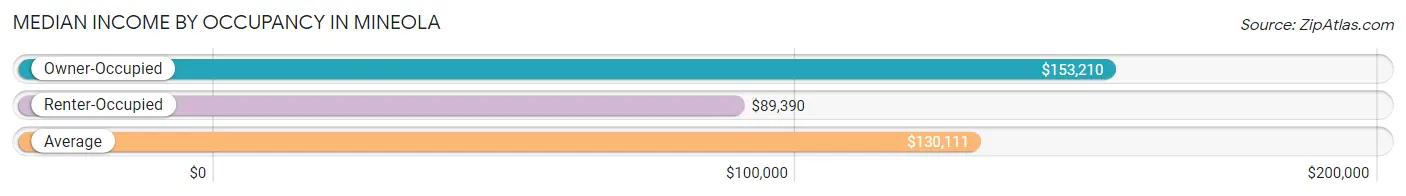
| Occupancy Type | # Households | Median Income |
| Owner-Occupied | 5,269 (62.5%) | $153,210 |
| Renter-Occupied | 3,158 (37.5%) | $89,390 |
| Average | 8,427 (100.0%) | $130,111 |
Occupancy by Householder Income Bracket in Mineola
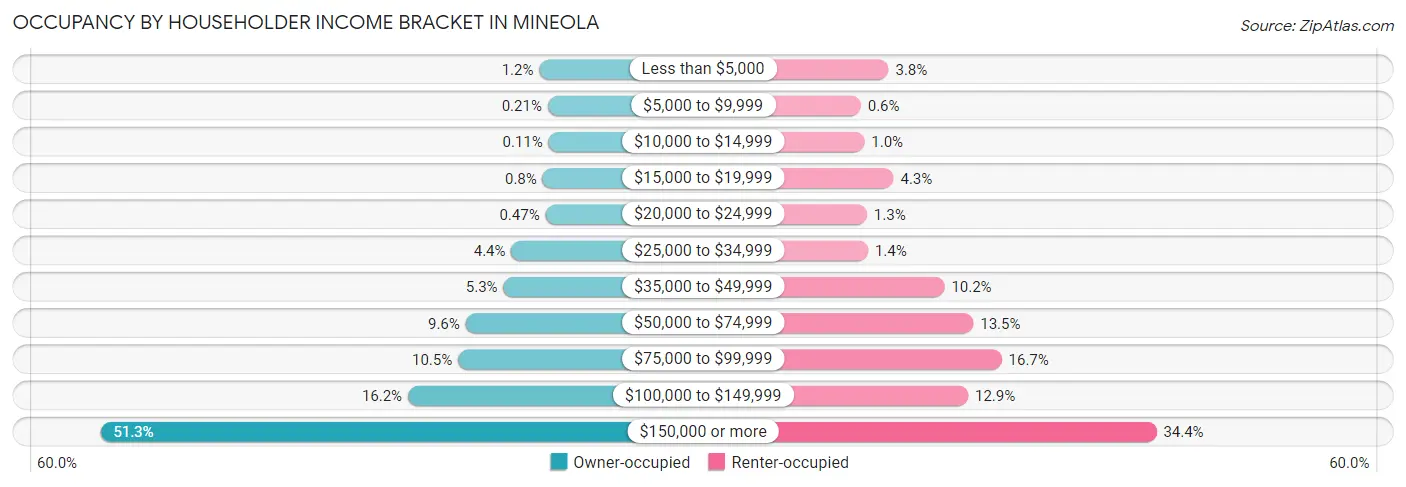
| Income Bracket | Owner-occupied | Renter-occupied |
| Less than $5,000 | 62 (1.2%) | 119 (3.8%) |
| $5,000 to $9,999 | 11 (0.2%) | 19 (0.6%) |
| $10,000 to $14,999 | 6 (0.1%) | 32 (1.0%) |
| $15,000 to $19,999 | 42 (0.8%) | 137 (4.3%) |
| $20,000 to $24,999 | 25 (0.5%) | 41 (1.3%) |
| $25,000 to $34,999 | 230 (4.4%) | 45 (1.4%) |
| $35,000 to $49,999 | 278 (5.3%) | 321 (10.2%) |
| $50,000 to $74,999 | 506 (9.6%) | 425 (13.5%) |
| $75,000 to $99,999 | 551 (10.5%) | 527 (16.7%) |
| $100,000 to $149,999 | 853 (16.2%) | 406 (12.9%) |
| $150,000 or more | 2,705 (51.3%) | 1,086 (34.4%) |
| Total | 5,269 (100.0%) | 3,158 (100.0%) |
Monthly Housing Cost Tiers in Mineola
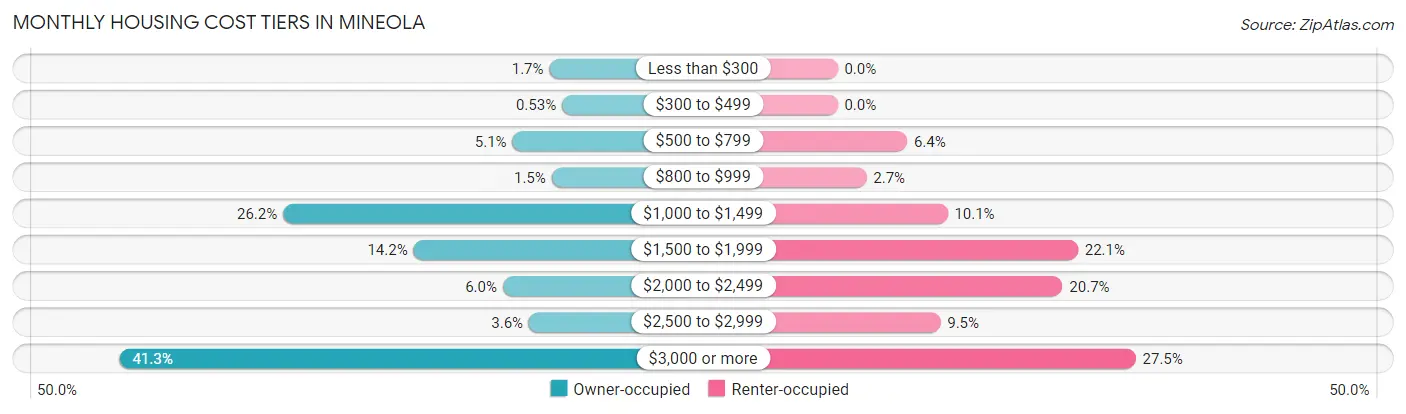
| Monthly Cost | Owner-occupied | Renter-occupied |
| Less than $300 | 89 (1.7%) | 0 (0.0%) |
| $300 to $499 | 28 (0.5%) | 0 (0.0%) |
| $500 to $799 | 268 (5.1%) | 202 (6.4%) |
| $800 to $999 | 78 (1.5%) | 84 (2.7%) |
| $1,000 to $1,499 | 1,381 (26.2%) | 320 (10.1%) |
| $1,500 to $1,999 | 748 (14.2%) | 699 (22.1%) |
| $2,000 to $2,499 | 315 (6.0%) | 654 (20.7%) |
| $2,500 to $2,999 | 188 (3.6%) | 299 (9.5%) |
| $3,000 or more | 2,174 (41.3%) | 867 (27.5%) |
| Total | 5,269 (100.0%) | 3,158 (100.0%) |
Physical Housing Characteristics in Mineola
Housing Structures in Mineola
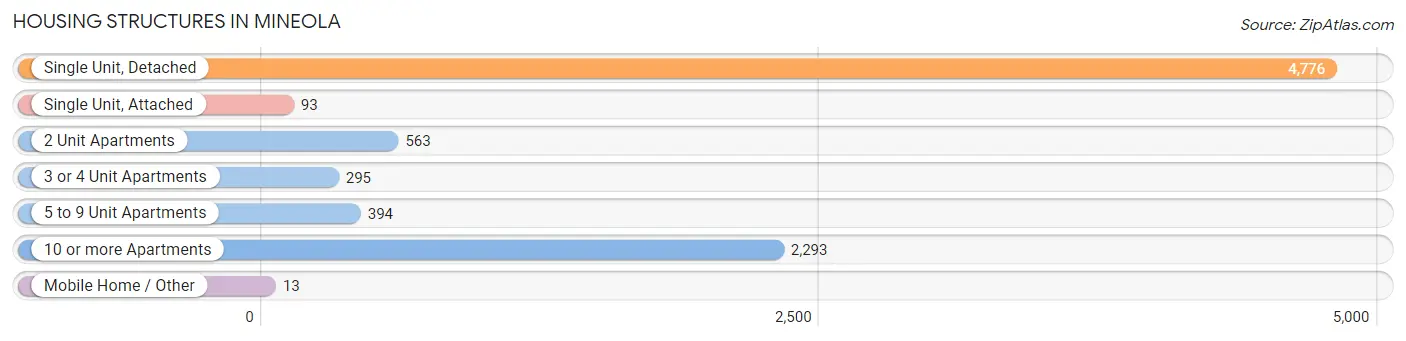
| Structure Type | # Housing Units | % Housing Units |
| Single Unit, Detached | 4,776 | 56.7% |
| Single Unit, Attached | 93 | 1.1% |
| 2 Unit Apartments | 563 | 6.7% |
| 3 or 4 Unit Apartments | 295 | 3.5% |
| 5 to 9 Unit Apartments | 394 | 4.7% |
| 10 or more Apartments | 2,293 | 27.2% |
| Mobile Home / Other | 13 | 0.2% |
| Total | 8,427 | 100.0% |
Housing Structures by Occupancy in Mineola
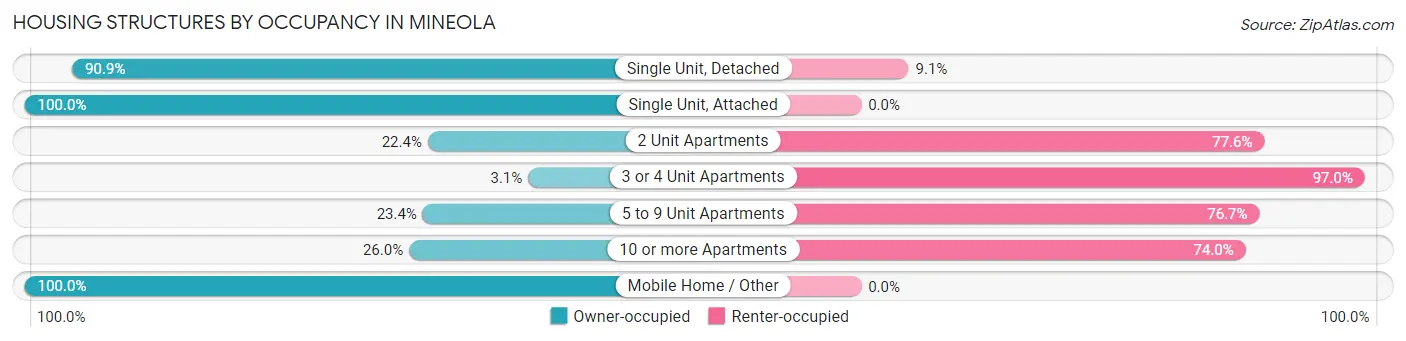
| Structure Type | Owner-occupied | Renter-occupied |
| Single Unit, Detached | 4,340 (90.9%) | 436 (9.1%) |
| Single Unit, Attached | 93 (100.0%) | 0 (0.0%) |
| 2 Unit Apartments | 126 (22.4%) | 437 (77.6%) |
| 3 or 4 Unit Apartments | 9 (3.0%) | 286 (97.0%) |
| 5 to 9 Unit Apartments | 92 (23.4%) | 302 (76.6%) |
| 10 or more Apartments | 596 (26.0%) | 1,697 (74.0%) |
| Mobile Home / Other | 13 (100.0%) | 0 (0.0%) |
| Total | 5,269 (62.5%) | 3,158 (37.5%) |
Housing Structures by Number of Rooms in Mineola
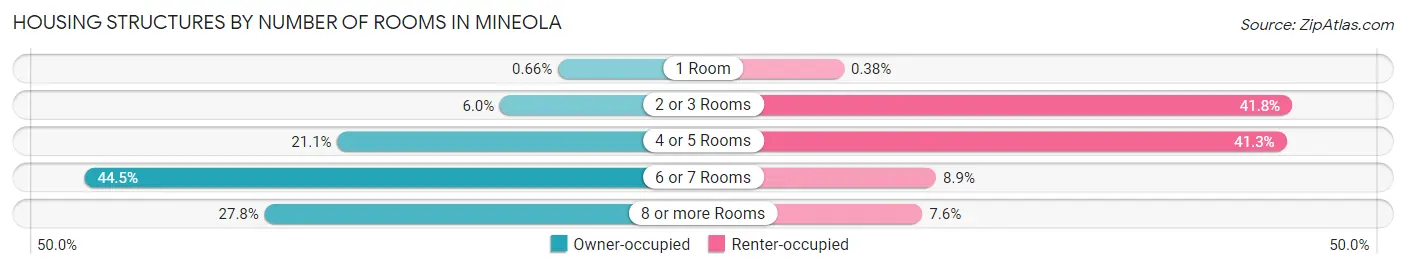
| Number of Rooms | Owner-occupied | Renter-occupied |
| 1 Room | 35 (0.7%) | 12 (0.4%) |
| 2 or 3 Rooms | 317 (6.0%) | 1,320 (41.8%) |
| 4 or 5 Rooms | 1,110 (21.1%) | 1,304 (41.3%) |
| 6 or 7 Rooms | 2,342 (44.5%) | 281 (8.9%) |
| 8 or more Rooms | 1,465 (27.8%) | 241 (7.6%) |
| Total | 5,269 (100.0%) | 3,158 (100.0%) |
Housing Structure by Heating Type in Mineola
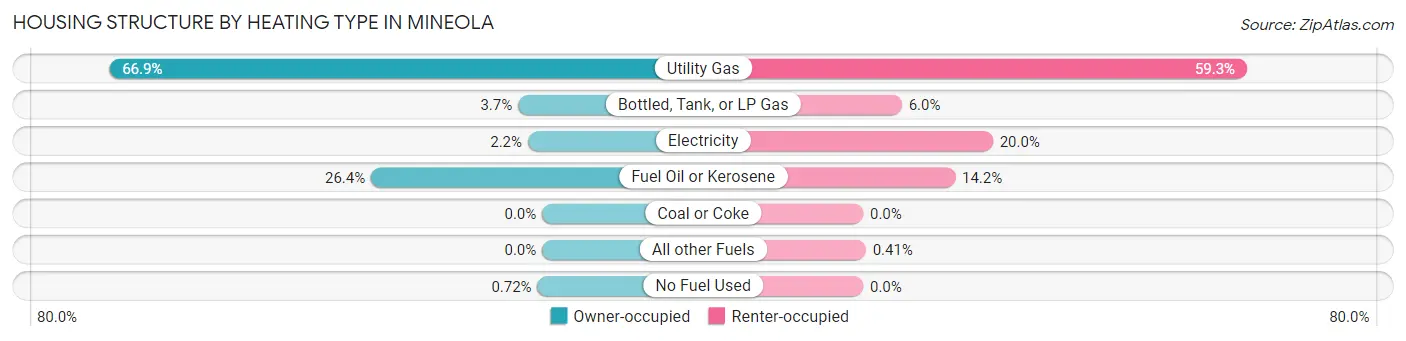
| Heating Type | Owner-occupied | Renter-occupied |
| Utility Gas | 3,526 (66.9%) | 1,874 (59.3%) |
| Bottled, Tank, or LP Gas | 196 (3.7%) | 189 (6.0%) |
| Electricity | 116 (2.2%) | 633 (20.0%) |
| Fuel Oil or Kerosene | 1,393 (26.4%) | 449 (14.2%) |
| Coal or Coke | 0 (0.0%) | 0 (0.0%) |
| All other Fuels | 0 (0.0%) | 13 (0.4%) |
| No Fuel Used | 38 (0.7%) | 0 (0.0%) |
| Total | 5,269 (100.0%) | 3,158 (100.0%) |
Household Vehicle Usage in Mineola
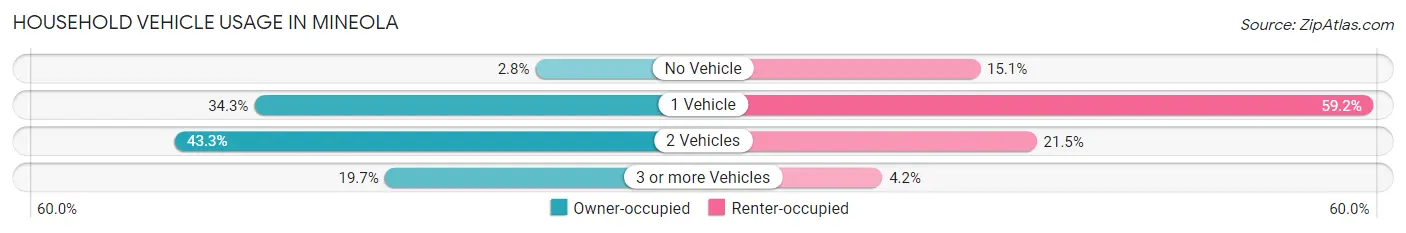
| Vehicles per Household | Owner-occupied | Renter-occupied |
| No Vehicle | 147 (2.8%) | 478 (15.1%) |
| 1 Vehicle | 1,806 (34.3%) | 1,870 (59.2%) |
| 2 Vehicles | 2,279 (43.2%) | 678 (21.5%) |
| 3 or more Vehicles | 1,037 (19.7%) | 132 (4.2%) |
| Total | 5,269 (100.0%) | 3,158 (100.0%) |
Real Estate & Mortgages in Mineola
Real Estate and Mortgage Overview in Mineola
| Characteristic | Without Mortgage | With Mortgage |
| Housing Units | 2,238 | 3,031 |
| Median Property Value | $570,500 | $616,800 |
| Median Household Income | $105,400 | $1,951 |
| Monthly Housing Costs | $1,292 | $2,161 |
| Real Estate Taxes | $10,001 | $170 |
Property Value by Mortgage Status in Mineola
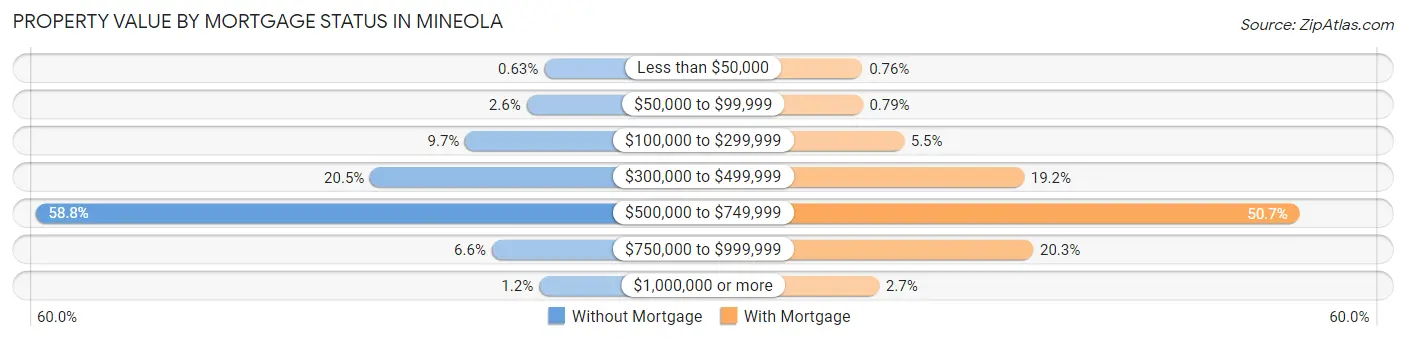
| Property Value | Without Mortgage | With Mortgage |
| Less than $50,000 | 14 (0.6%) | 23 (0.8%) |
| $50,000 to $99,999 | 59 (2.6%) | 24 (0.8%) |
| $100,000 to $299,999 | 216 (9.7%) | 167 (5.5%) |
| $300,000 to $499,999 | 459 (20.5%) | 583 (19.2%) |
| $500,000 to $749,999 | 1,315 (58.8%) | 1,538 (50.7%) |
| $750,000 to $999,999 | 148 (6.6%) | 615 (20.3%) |
| $1,000,000 or more | 27 (1.2%) | 81 (2.7%) |
| Total | 2,238 (100.0%) | 3,031 (100.0%) |
Household Income by Mortgage Status in Mineola
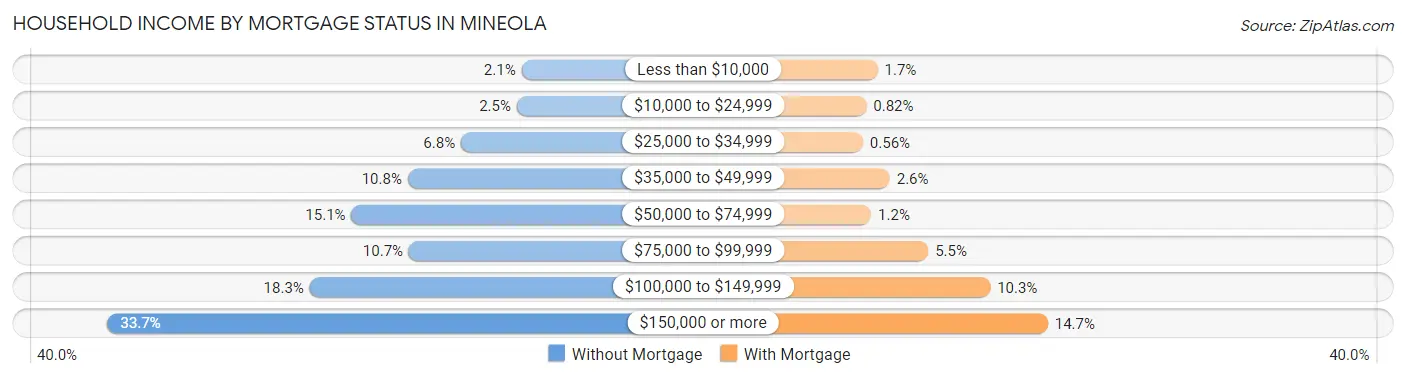
| Household Income | Without Mortgage | With Mortgage |
| Less than $10,000 | 48 (2.1%) | 51 (1.7%) |
| $10,000 to $24,999 | 56 (2.5%) | 25 (0.8%) |
| $25,000 to $34,999 | 151 (6.8%) | 17 (0.6%) |
| $35,000 to $49,999 | 242 (10.8%) | 79 (2.6%) |
| $50,000 to $74,999 | 338 (15.1%) | 36 (1.2%) |
| $75,000 to $99,999 | 240 (10.7%) | 168 (5.5%) |
| $100,000 to $149,999 | 409 (18.3%) | 311 (10.3%) |
| $150,000 or more | 754 (33.7%) | 444 (14.6%) |
| Total | 2,238 (100.0%) | 3,031 (100.0%) |
Property Value to Household Income Ratio in Mineola
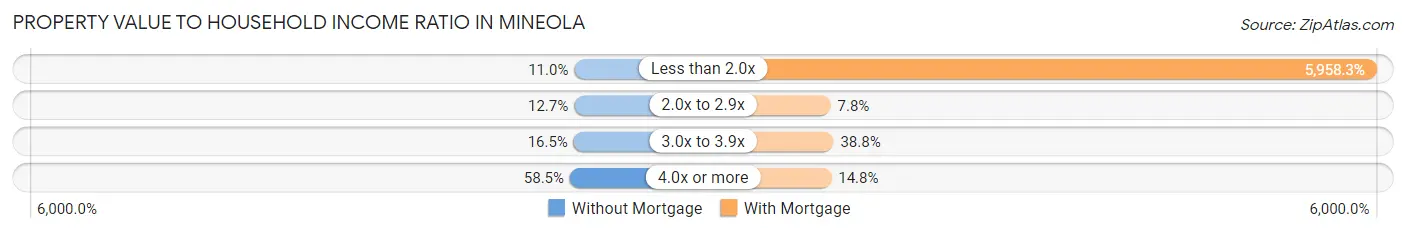
| Value-to-Income Ratio | Without Mortgage | With Mortgage |
| Less than 2.0x | 247 (11.0%) | 180,597 (5,958.3%) |
| 2.0x to 2.9x | 284 (12.7%) | 235 (7.7%) |
| 3.0x to 3.9x | 369 (16.5%) | 1,177 (38.8%) |
| 4.0x or more | 1,309 (58.5%) | 448 (14.8%) |
| Total | 2,238 (100.0%) | 3,031 (100.0%) |
Real Estate Taxes by Mortgage Status in Mineola
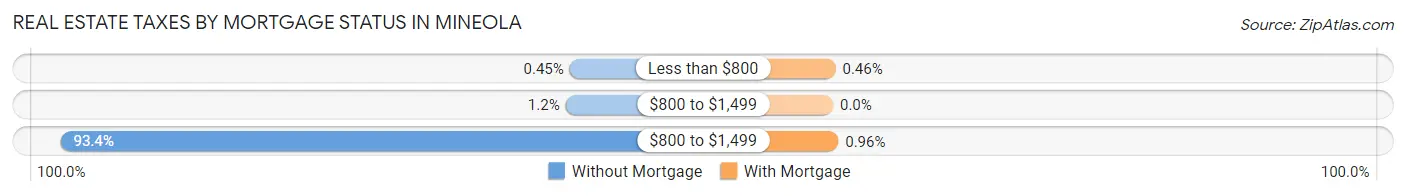
| Property Taxes | Without Mortgage | With Mortgage |
| Less than $800 | 10 (0.4%) | 14 (0.5%) |
| $800 to $1,499 | 27 (1.2%) | 0 (0.0%) |
| $800 to $1,499 | 2,091 (93.4%) | 29 (1.0%) |
| Total | 2,238 (100.0%) | 3,031 (100.0%) |
Health & Disability in Mineola
Health Insurance Coverage by Age in Mineola
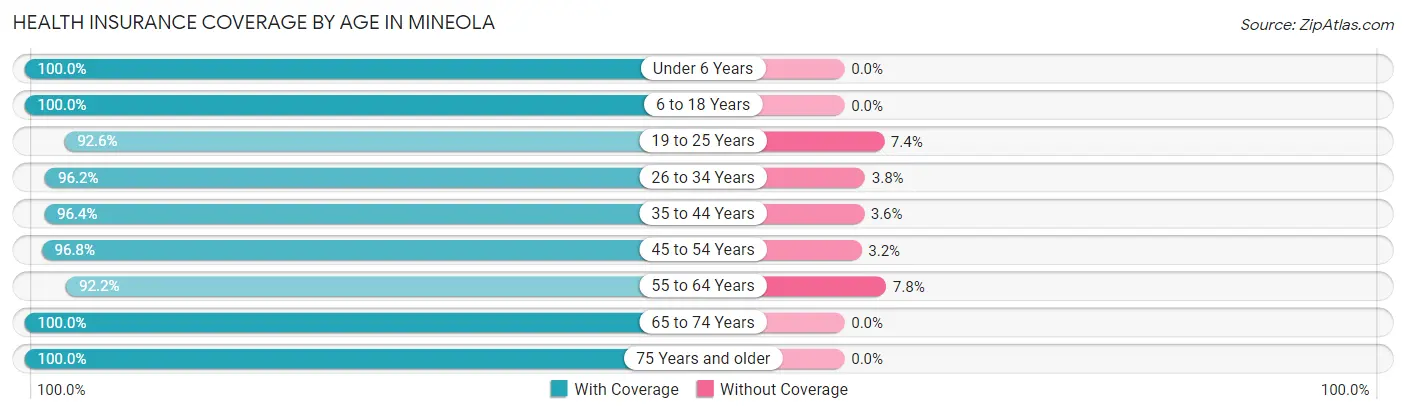
| Age Bracket | With Coverage | Without Coverage |
| Under 6 Years | 1,243 (100.0%) | 0 (0.0%) |
| 6 to 18 Years | 2,707 (100.0%) | 0 (0.0%) |
| 19 to 25 Years | 902 (92.6%) | 72 (7.4%) |
| 26 to 34 Years | 3,519 (96.2%) | 140 (3.8%) |
| 35 to 44 Years | 2,947 (96.4%) | 111 (3.6%) |
| 45 to 54 Years | 2,499 (96.8%) | 82 (3.2%) |
| 55 to 64 Years | 3,089 (92.2%) | 260 (7.8%) |
| 65 to 74 Years | 1,855 (100.0%) | 0 (0.0%) |
| 75 Years and older | 1,514 (100.0%) | 0 (0.0%) |
| Total | 20,275 (96.8%) | 665 (3.2%) |
Health Insurance Coverage by Citizenship Status in Mineola
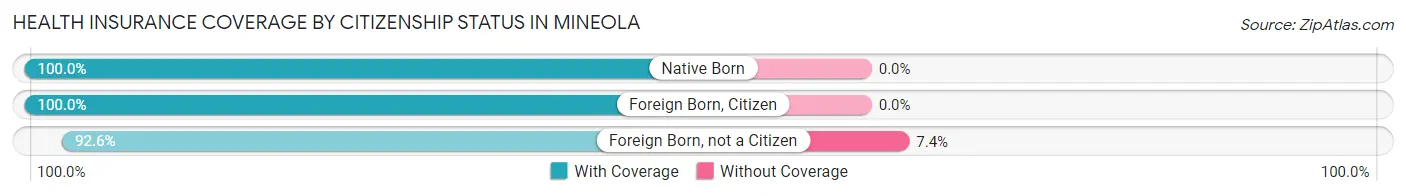
| Citizenship Status | With Coverage | Without Coverage |
| Native Born | 1,243 (100.0%) | 0 (0.0%) |
| Foreign Born, Citizen | 2,707 (100.0%) | 0 (0.0%) |
| Foreign Born, not a Citizen | 902 (92.6%) | 72 (7.4%) |
Health Insurance Coverage by Household Income in Mineola
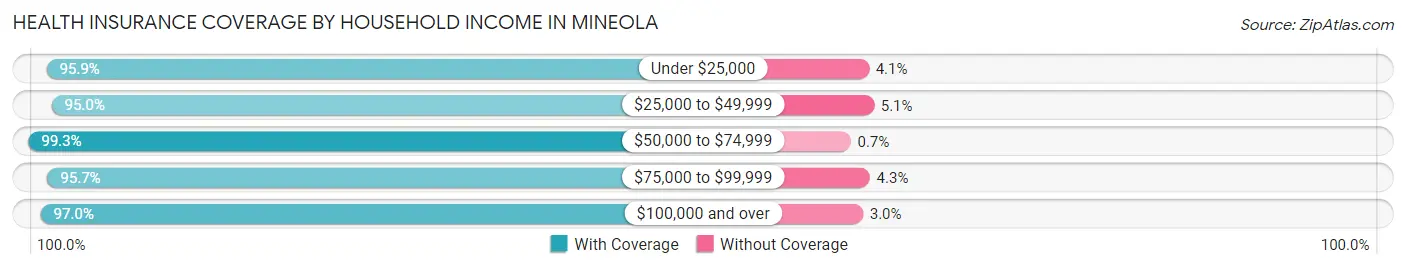
| Household Income | With Coverage | Without Coverage |
| Under $25,000 | 772 (95.9%) | 33 (4.1%) |
| $25,000 to $49,999 | 1,730 (95.0%) | 92 (5.1%) |
| $50,000 to $74,999 | 1,705 (99.3%) | 12 (0.7%) |
| $75,000 to $99,999 | 2,370 (95.7%) | 106 (4.3%) |
| $100,000 and over | 13,687 (97.0%) | 422 (3.0%) |
Public vs Private Health Insurance Coverage by Age in Mineola
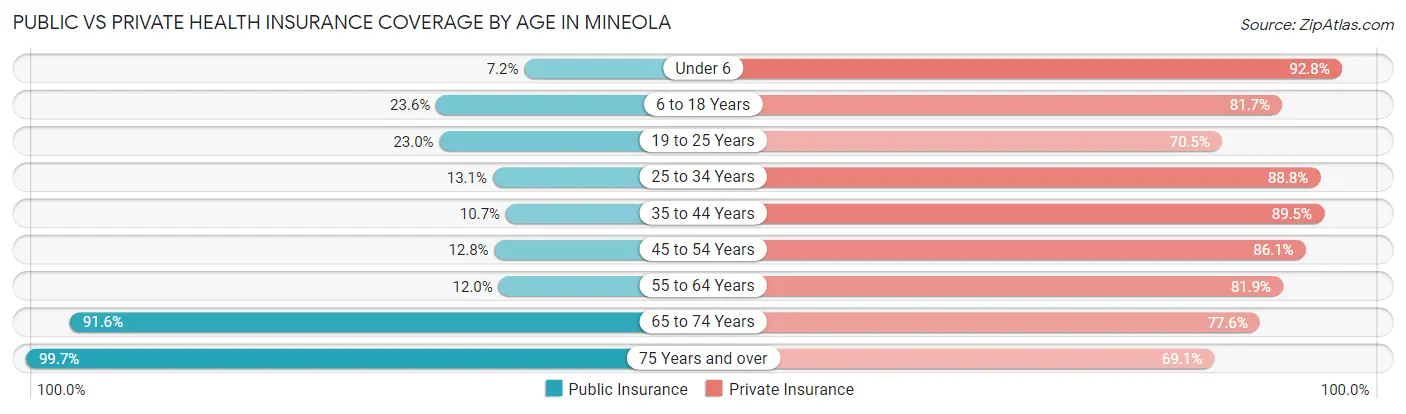
| Age Bracket | Public Insurance | Private Insurance |
| Under 6 | 90 (7.2%) | 1,153 (92.8%) |
| 6 to 18 Years | 639 (23.6%) | 2,211 (81.7%) |
| 19 to 25 Years | 224 (23.0%) | 687 (70.5%) |
| 25 to 34 Years | 479 (13.1%) | 3,248 (88.8%) |
| 35 to 44 Years | 326 (10.7%) | 2,736 (89.5%) |
| 45 to 54 Years | 330 (12.8%) | 2,221 (86.1%) |
| 55 to 64 Years | 403 (12.0%) | 2,742 (81.9%) |
| 65 to 74 Years | 1,699 (91.6%) | 1,439 (77.6%) |
| 75 Years and over | 1,510 (99.7%) | 1,046 (69.1%) |
| Total | 5,700 (27.2%) | 17,483 (83.5%) |
Disability Status by Sex by Age in Mineola
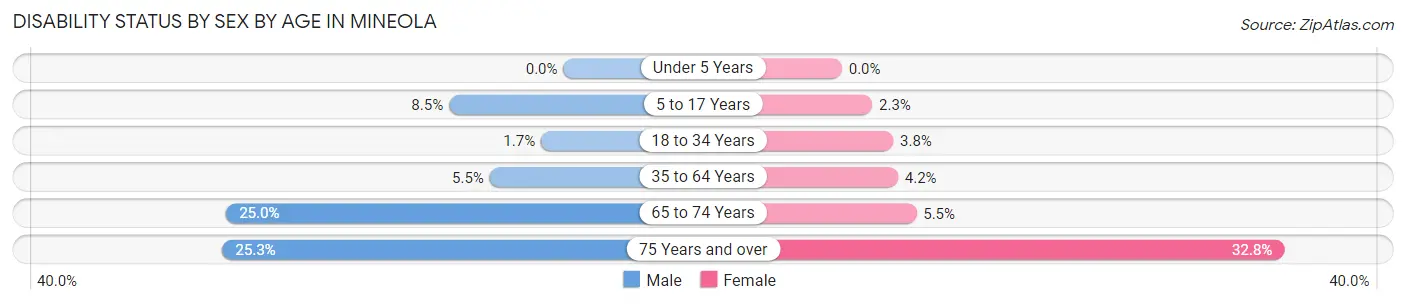
| Age Bracket | Male | Female |
| Under 5 Years | 0 (0.0%) | 0 (0.0%) |
| 5 to 17 Years | 135 (8.5%) | 26 (2.2%) |
| 18 to 34 Years | 45 (1.7%) | 81 (3.8%) |
| 35 to 64 Years | 248 (5.5%) | 185 (4.2%) |
| 65 to 74 Years | 229 (25.0%) | 52 (5.5%) |
| 75 Years and over | 145 (25.3%) | 309 (32.8%) |
Disability Class by Sex by Age in Mineola
Disability Class: Hearing Difficulty
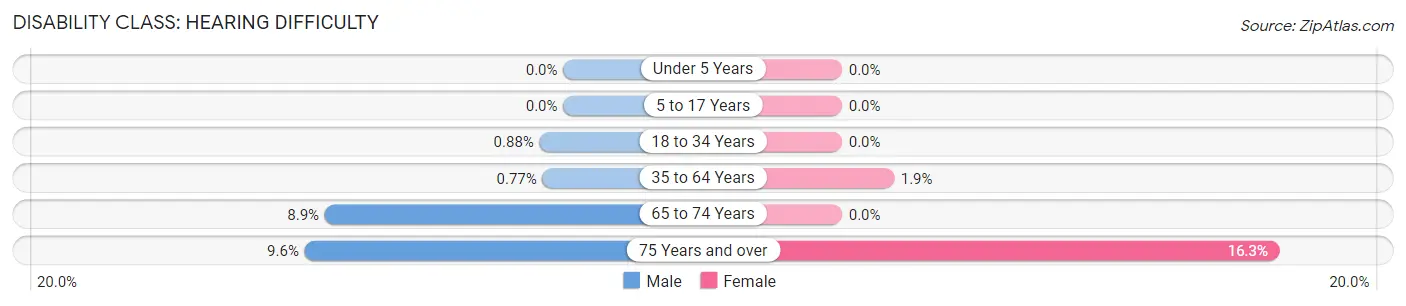
| Age Bracket | Male | Female |
| Under 5 Years | 0 (0.0%) | 0 (0.0%) |
| 5 to 17 Years | 0 (0.0%) | 0 (0.0%) |
| 18 to 34 Years | 24 (0.9%) | 0 (0.0%) |
| 35 to 64 Years | 35 (0.8%) | 86 (1.9%) |
| 65 to 74 Years | 81 (8.8%) | 0 (0.0%) |
| 75 Years and over | 55 (9.6%) | 153 (16.3%) |
Disability Class: Vision Difficulty
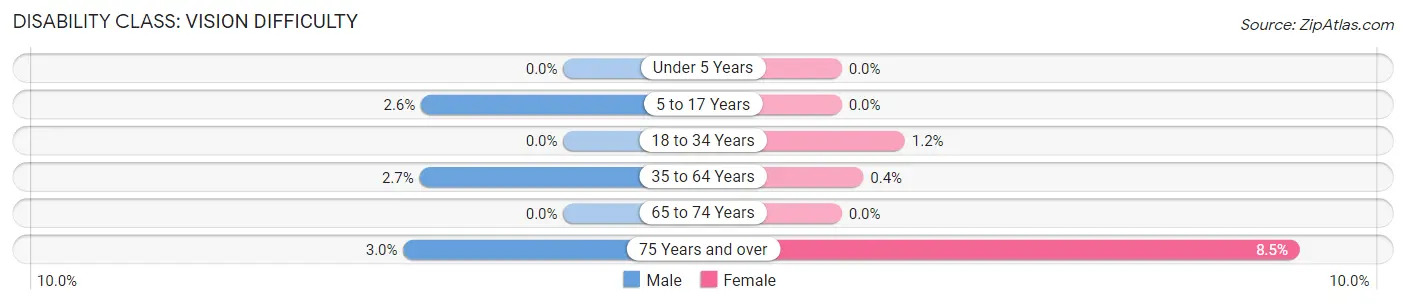
| Age Bracket | Male | Female |
| Under 5 Years | 0 (0.0%) | 0 (0.0%) |
| 5 to 17 Years | 42 (2.6%) | 0 (0.0%) |
| 18 to 34 Years | 0 (0.0%) | 25 (1.2%) |
| 35 to 64 Years | 121 (2.7%) | 18 (0.4%) |
| 65 to 74 Years | 0 (0.0%) | 0 (0.0%) |
| 75 Years and over | 17 (3.0%) | 80 (8.5%) |
Disability Class: Cognitive Difficulty
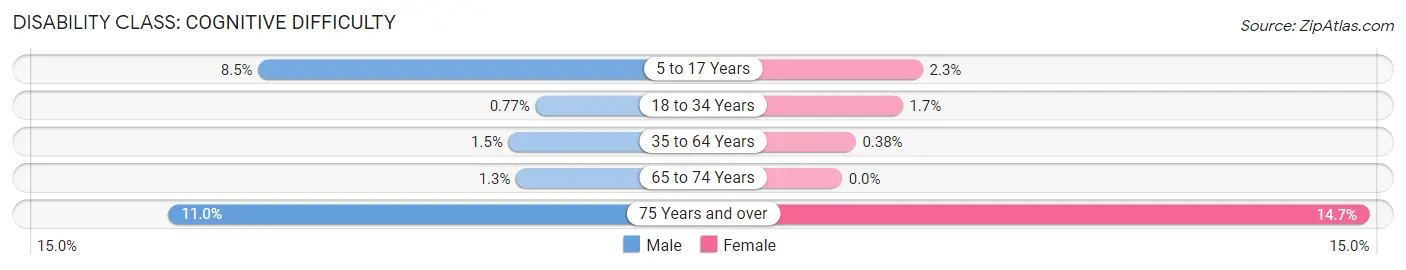
| Age Bracket | Male | Female |
| 5 to 17 Years | 135 (8.5%) | 26 (2.2%) |
| 18 to 34 Years | 21 (0.8%) | 36 (1.7%) |
| 35 to 64 Years | 69 (1.5%) | 17 (0.4%) |
| 65 to 74 Years | 12 (1.3%) | 0 (0.0%) |
| 75 Years and over | 63 (11.0%) | 138 (14.7%) |
Disability Class: Ambulatory Difficulty
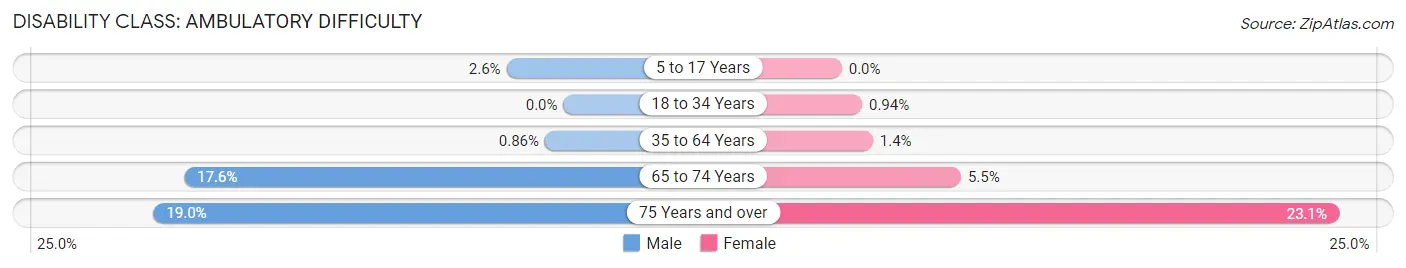
| Age Bracket | Male | Female |
| 5 to 17 Years | 42 (2.6%) | 0 (0.0%) |
| 18 to 34 Years | 0 (0.0%) | 20 (0.9%) |
| 35 to 64 Years | 39 (0.9%) | 64 (1.4%) |
| 65 to 74 Years | 161 (17.6%) | 52 (5.5%) |
| 75 Years and over | 109 (19.0%) | 217 (23.1%) |
Disability Class: Self-Care Difficulty
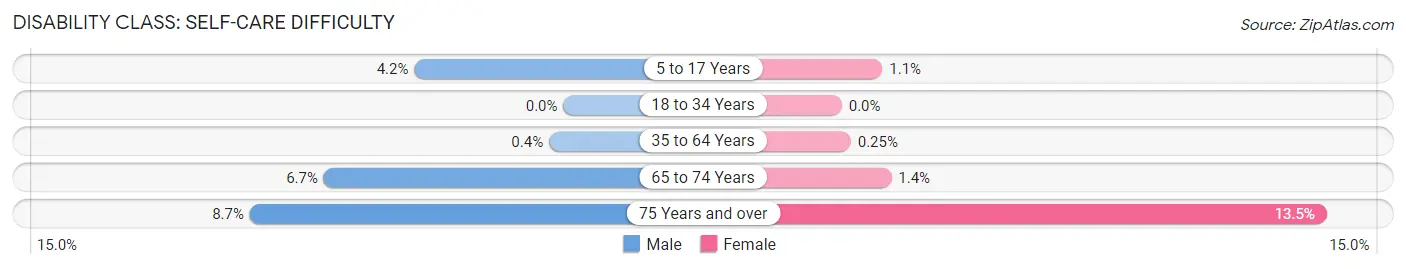
| Age Bracket | Male | Female |
| 5 to 17 Years | 66 (4.2%) | 13 (1.1%) |
| 18 to 34 Years | 0 (0.0%) | 0 (0.0%) |
| 35 to 64 Years | 18 (0.4%) | 11 (0.3%) |
| 65 to 74 Years | 61 (6.7%) | 13 (1.4%) |
| 75 Years and over | 50 (8.7%) | 127 (13.5%) |
Technology Access in Mineola
Computing Device Access in Mineola
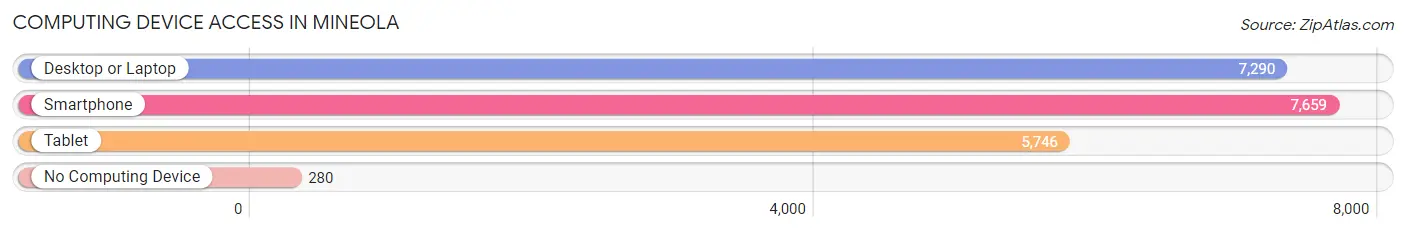
| Device Type | # Households | % Households |
| Desktop or Laptop | 7,290 | 86.5% |
| Smartphone | 7,659 | 90.9% |
| Tablet | 5,746 | 68.2% |
| No Computing Device | 280 | 3.3% |
| Total | 8,427 | 100.0% |
Internet Access in Mineola
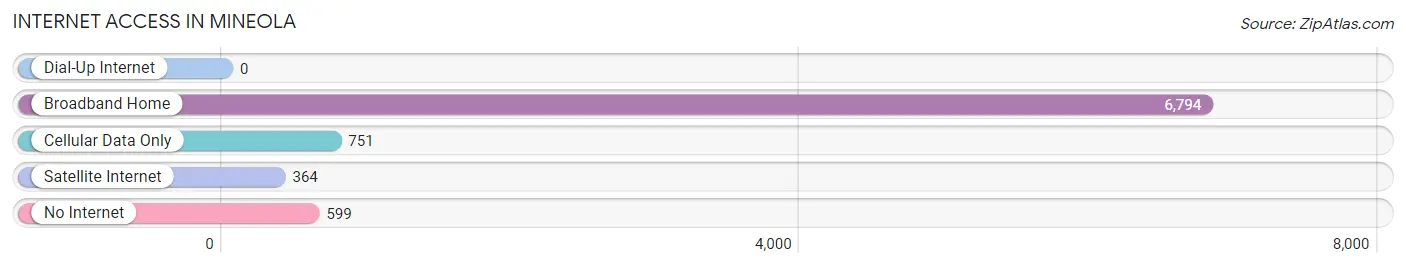
| Internet Type | # Households | % Households |
| Dial-Up Internet | 0 | 0.0% |
| Broadband Home | 6,794 | 80.6% |
| Cellular Data Only | 751 | 8.9% |
| Satellite Internet | 364 | 4.3% |
| No Internet | 599 | 7.1% |
| Total | 8,427 | 100.0% |
Mineola Summary
History
The area now known as Mineola, New York was originally inhabited by the Matinecock Native American tribe. The first European settlers arrived in the area in the late 1600s, and the area was officially established as the Town of Hempstead in 1644. The area was named after Hempstead, England, and was one of the original 12 towns of Nassau County.
In the late 1800s, the area began to develop as a residential community. The Long Island Rail Road was extended to Mineola in 1837, and the area began to attract more and more residents. The Town of Hempstead was divided into two towns in 1899, with the area now known as Mineola becoming part of the Town of North Hempstead.
The area was officially incorporated as the Village of Mineola in 1906. The village was named after an Algonquin Indian chief named Miniolagamika, which means “pleasant village.” The village was primarily a residential community, but it also had a few small businesses, including a post office, a general store, and a blacksmith shop.
In the early 1900s, Mineola began to experience rapid growth. The Long Island Rail Road was extended to the village in 1906, and the village was connected to the rest of Long Island by the Queens-Nassau border in 1910. The village was also home to a number of factories, including a paper mill, a brickyard, and a canning factory.
The village continued to grow throughout the 20th century. The population increased from 1,500 in 1910 to over 10,000 by the 1950s. The village was also home to a number of businesses, including a movie theater, a bowling alley, and a number of restaurants.
Geography
Mineola is located in Nassau County, New York, on the north shore of Long Island. The village is bordered by the villages of Garden City and New Hyde Park to the west, the Town of North Hempstead to the east, and the Town of Hempstead to the south. The village covers an area of 1.7 square miles and has a population of 18,799, according to the 2010 census.
The village is located in the Hempstead Plains, a flat, low-lying area of Long Island. The terrain is mostly flat, with some rolling hills in the northern part of the village. The village is located on the Hempstead Harbor, which is part of the Long Island Sound.
Economy
Mineola is primarily a residential community, but it also has a number of businesses and industries. The village is home to a number of corporate headquarters, including the headquarters of the New York Islanders hockey team and the North Shore-LIJ Health System. The village is also home to a number of retail stores, restaurants, and other businesses.
The village is also home to a number of medical facilities, including the Nassau University Medical Center and the Winthrop-University Hospital. The village is also home to a number of educational institutions, including the Mineola Union Free School District, Nassau Community College, and the New York Institute of Technology.
Demographics
According to the 2010 census, the population of Mineola was 18,799. The population is primarily white (83.3%), with smaller percentages of African Americans (7.2%), Asians (4.7%), and Hispanics (3.7%). The median household income is $90,945, and the median home value is $541,400.
The village is home to a number of religious institutions, including churches, synagogues, and mosques. The village is also home to a number of cultural institutions, including the Mineola Historical Society and the Mineola Public Library. The village is also home to a number of parks and recreational facilities, including the Mineola Nature Preserve and the Mineola Memorial Park.
Common Questions
What is Per Capita Income in Mineola?
Per Capita income in Mineola is $61,837.
What is the Median Family Income in Mineola?
Median Family Income in Mineola is $160,754.
What is the Median Household income in Mineola?
Median Household Income in Mineola is $130,111.
What is Income or Wage Gap in Mineola?
Income or Wage Gap in Mineola is 25.2%.
Women in Mineola earn 74.8 cents for every dollar earned by a man.
What is Inequality or Gini Index in Mineola?
Inequality or Gini Index in Mineola is 0.40.
What is the Total Population of Mineola?
Total Population of Mineola is 20,940.
What is the Total Male Population of Mineola?
Total Male Population of Mineola is 10,861.
What is the Total Female Population of Mineola?
Total Female Population of Mineola is 10,079.
What is the Ratio of Males per 100 Females in Mineola?
There are 107.76 Males per 100 Females in Mineola.
What is the Ratio of Females per 100 Males in Mineola?
There are 92.80 Females per 100 Males in Mineola.
What is the Median Population Age in Mineola?
Median Population Age in Mineola is 41.2 Years.
What is the Average Family Size in Mineola
Average Family Size in Mineola is 3.1 People.
What is the Average Household Size in Mineola
Average Household Size in Mineola is 2.5 People.
How Large is the Labor Force in Mineola?
There are 13,092 People in the Labor Forcein in Mineola.
What is the Percentage of People in the Labor Force in Mineola?
74.5% of People are in the Labor Force in Mineola.
What is the Unemployment Rate in Mineola?
Unemployment Rate in Mineola is 3.7%.