Port Orange, FL Map & Demographics
Port Orange Map
Port Orange Overview
$35,528
PER CAPITA INCOME
$84,851
AVG FAMILY INCOME
$65,026
AVG HOUSEHOLD INCOME
25.4%
WAGE / INCOME GAP [ % ]
74.6¢/ $1
WAGE / INCOME GAP [ $ ]
$6,904
FAMILY INCOME DEFICIT
0.40
INEQUALITY / GINI INDEX
62,849
TOTAL POPULATION
30,590
MALE POPULATION
32,259
FEMALE POPULATION
94.83
MALES / 100 FEMALES
105.46
FEMALES / 100 MALES
46.5
MEDIAN AGE
2.8
AVG FAMILY SIZE
2.2
AVG HOUSEHOLD SIZE
30,450
LABOR FORCE [ PEOPLE ]
56.7%
PERCENT IN LABOR FORCE
3.9%
UNEMPLOYMENT RATE
Port Orange Area Codes
Income in Port Orange
Income Overview in Port Orange
Per Capita Income in Port Orange is $35,528, while median incomes of families and households are $84,851 and $65,026 respectively.
| Characteristic | Number | Measure |
| Per Capita Income | 62,849 | $35,528 |
| Median Family Income | 16,548 | $84,851 |
| Mean Family Income | 16,548 | $95,704 |
| Median Household Income | 27,857 | $65,026 |
| Mean Household Income | 27,857 | $78,474 |
| Income Deficit | 16,548 | $6,904 |
| Wage / Income Gap (%) | 62,849 | 25.36% |
| Wage / Income Gap ($) | 62,849 | 74.64¢ per $1 |
| Gini / Inequality Index | 62,849 | 0.40 |
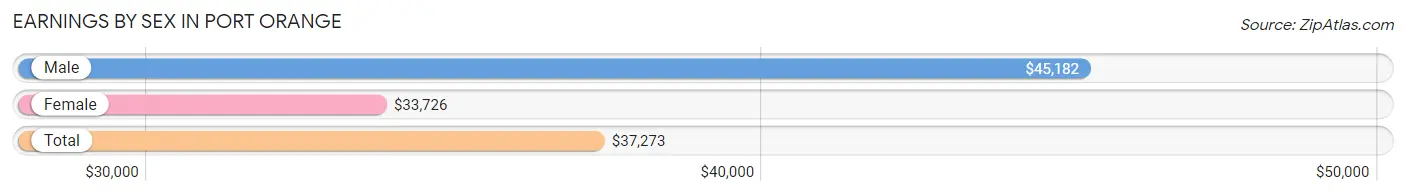
Earnings by Sex in Port Orange
Average Earnings in Port Orange are $37,273, $45,182 for men and $33,726 for women, a difference of 25.4%.
| Sex | Number | Average Earnings |
| Male | 16,392 (52.4%) | $45,182 |
| Female | 14,877 (47.6%) | $33,726 |
| Total | 31,269 (100.0%) | $37,273 |
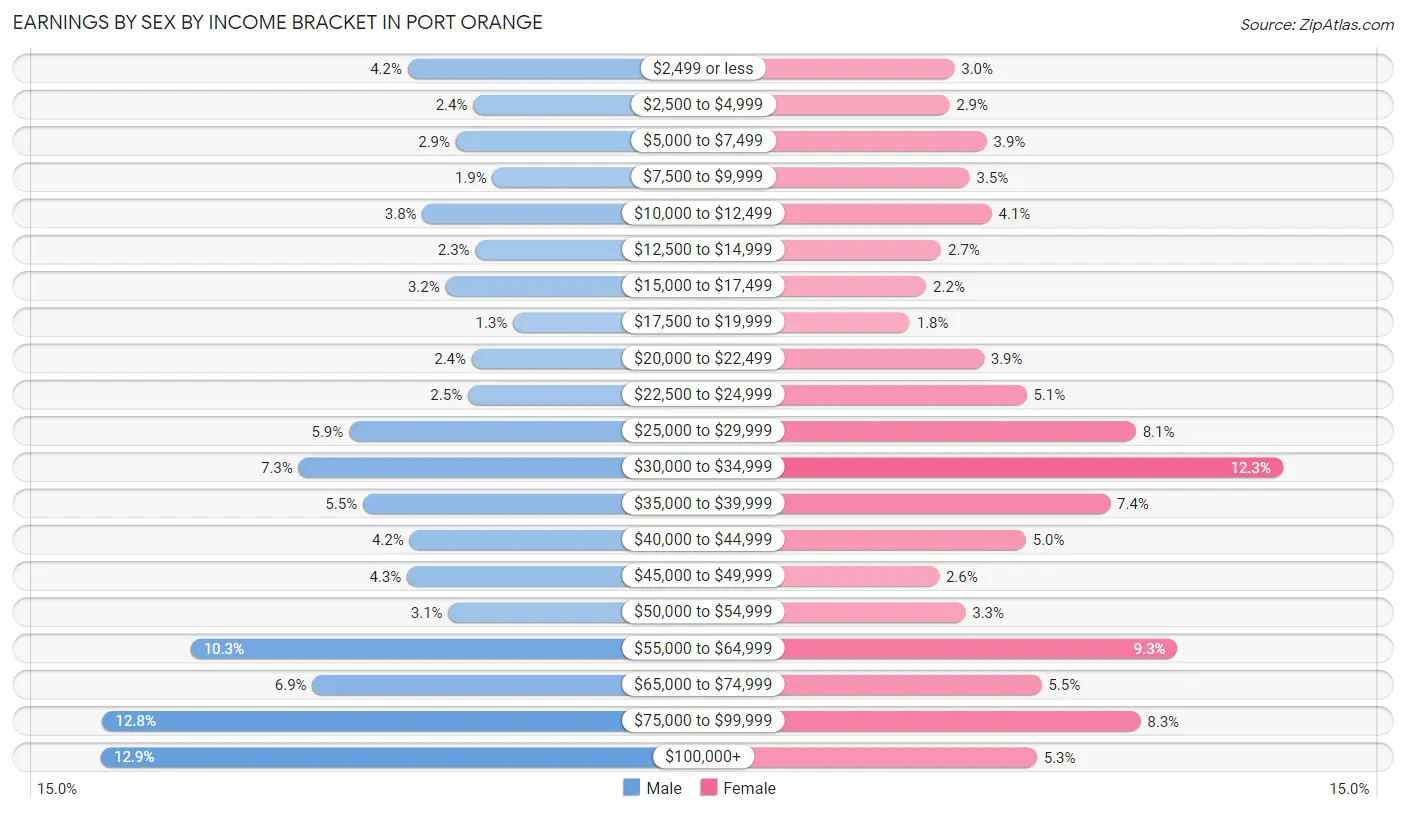
Earnings by Sex by Income Bracket in Port Orange
The most common earnings brackets in Port Orange are $100,000+ for men (2,107 | 12.9%) and $30,000 to $34,999 for women (1,823 | 12.2%).
| Income | Male | Female |
| $2,499 or less | 693 (4.2%) | 450 (3.0%) |
| $2,500 to $4,999 | 392 (2.4%) | 429 (2.9%) |
| $5,000 to $7,499 | 472 (2.9%) | 585 (3.9%) |
| $7,500 to $9,999 | 303 (1.8%) | 513 (3.5%) |
| $10,000 to $12,499 | 626 (3.8%) | 605 (4.1%) |
| $12,500 to $14,999 | 382 (2.3%) | 394 (2.6%) |
| $15,000 to $17,499 | 519 (3.2%) | 332 (2.2%) |
| $17,500 to $19,999 | 208 (1.3%) | 263 (1.8%) |
| $20,000 to $22,499 | 399 (2.4%) | 573 (3.8%) |
| $22,500 to $24,999 | 417 (2.5%) | 751 (5.1%) |
| $25,000 to $29,999 | 964 (5.9%) | 1,208 (8.1%) |
| $30,000 to $34,999 | 1,197 (7.3%) | 1,823 (12.2%) |
| $35,000 to $39,999 | 900 (5.5%) | 1,101 (7.4%) |
| $40,000 to $44,999 | 686 (4.2%) | 749 (5.0%) |
| $45,000 to $49,999 | 696 (4.3%) | 386 (2.6%) |
| $50,000 to $54,999 | 506 (3.1%) | 496 (3.3%) |
| $55,000 to $64,999 | 1,693 (10.3%) | 1,382 (9.3%) |
| $65,000 to $74,999 | 1,132 (6.9%) | 814 (5.5%) |
| $75,000 to $99,999 | 2,100 (12.8%) | 1,228 (8.3%) |
| $100,000+ | 2,107 (12.9%) | 795 (5.3%) |
| Total | 16,392 (100.0%) | 14,877 (100.0%) |
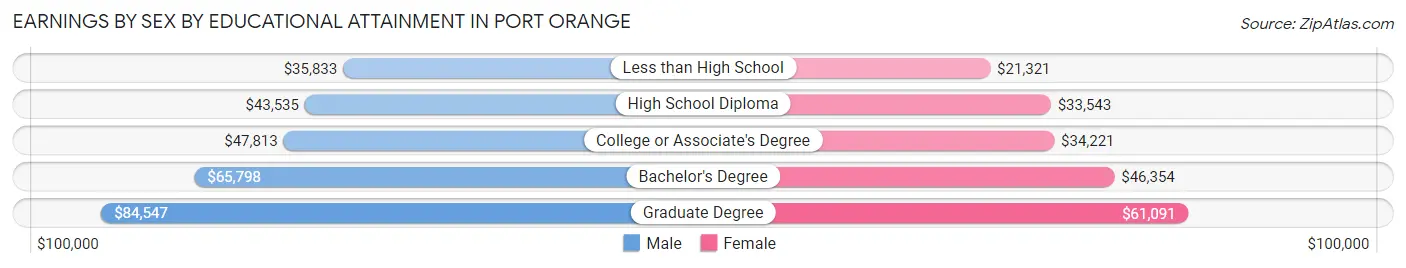
Earnings by Sex by Educational Attainment in Port Orange
Average earnings in Port Orange are $51,973 for men and $36,545 for women, a difference of 29.7%. Men with an educational attainment of graduate degree enjoy the highest average annual earnings of $84,547, while those with less than high school education earn the least with $35,833. Women with an educational attainment of graduate degree earn the most with the average annual earnings of $61,091, while those with less than high school education have the smallest earnings of $21,321.
| Educational Attainment | Male Income | Female Income |
| Less than High School | $35,833 | $21,321 |
| High School Diploma | $43,535 | $33,543 |
| College or Associate's Degree | $47,813 | $34,221 |
| Bachelor's Degree | $65,798 | $46,354 |
| Graduate Degree | $84,547 | $61,091 |
| Total | $51,973 | $36,545 |
Family Income in Port Orange
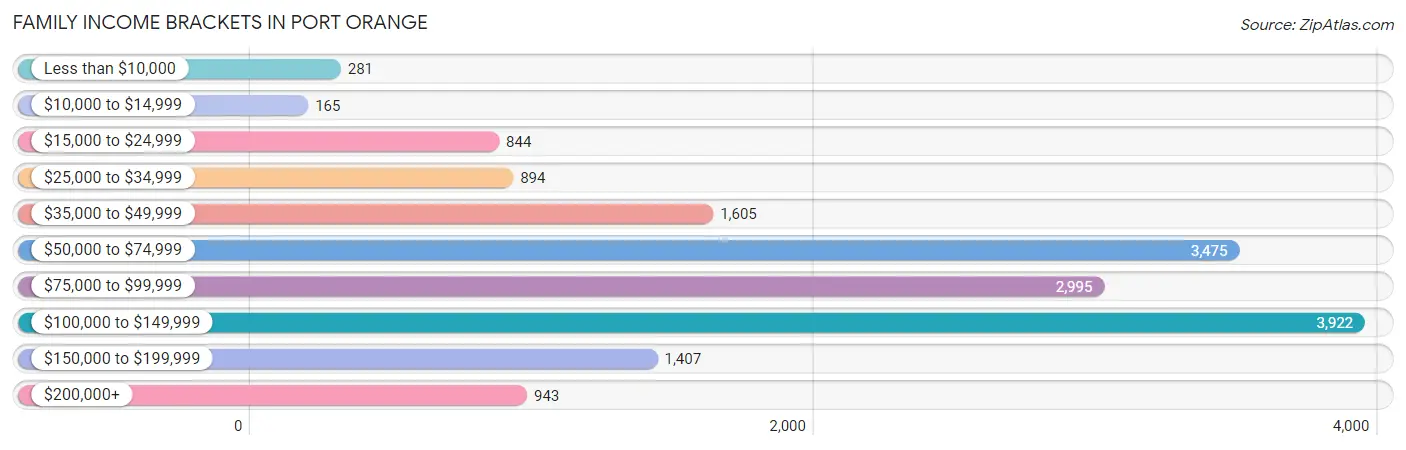
Family Income Brackets in Port Orange
According to the Port Orange family income data, there are 3,922 families falling into the $100,000 to $149,999 income range, which is the most common income bracket and makes up 23.7% of all families. Conversely, the $10,000 to $14,999 income bracket is the least frequent group with only 165 families (1.0%) belonging to this category.
| Income Bracket | # Families | % Families |
| Less than $10,000 | 281 | 1.7% |
| $10,000 to $14,999 | 165 | 1.0% |
| $15,000 to $24,999 | 844 | 5.1% |
| $25,000 to $34,999 | 894 | 5.4% |
| $35,000 to $49,999 | 1,605 | 9.7% |
| $50,000 to $74,999 | 3,475 | 21.0% |
| $75,000 to $99,999 | 2,995 | 18.1% |
| $100,000 to $149,999 | 3,922 | 23.7% |
| $150,000 to $199,999 | 1,407 | 8.5% |
| $200,000+ | 943 | 5.7% |
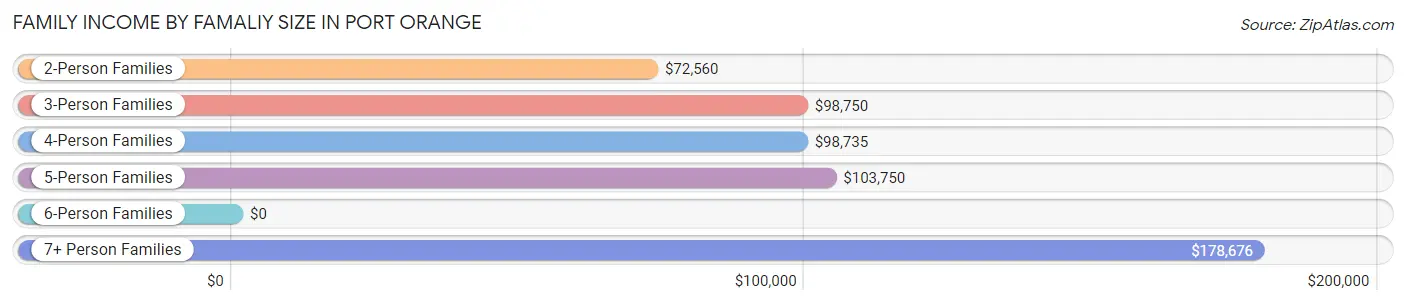
Family Income by Famaliy Size in Port Orange
7+ person families (74 | 0.4%) account for the highest median family income in Port Orange with $178,676 per family, while 2-person families (9,919 | 59.9%) have the highest median income of $36,280 per family member.
| Income Bracket | # Families | Median Income |
| 2-Person Families | 9,919 (59.9%) | $72,560 |
| 3-Person Families | 3,577 (21.6%) | $98,750 |
| 4-Person Families | 1,977 (11.9%) | $98,735 |
| 5-Person Families | 708 (4.3%) | $103,750 |
| 6-Person Families | 293 (1.8%) | $0 |
| 7+ Person Families | 74 (0.4%) | $178,676 |
| Total | 16,548 (100.0%) | $84,851 |
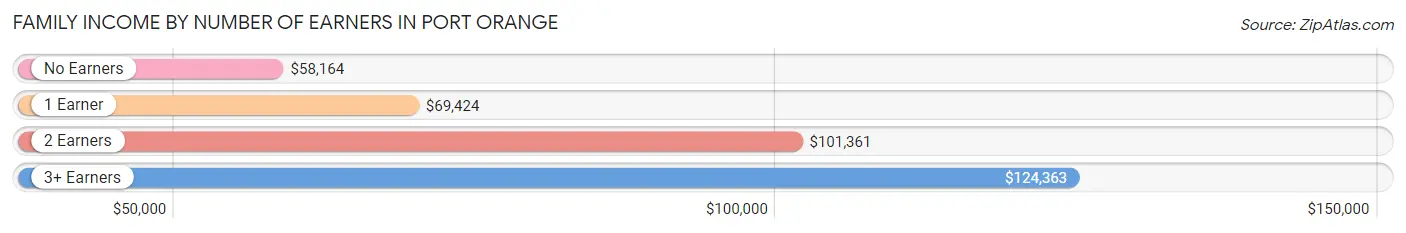
Family Income by Number of Earners in Port Orange
The median family income in Port Orange is $84,851, with families comprising 3+ earners (1,418) having the highest median family income of $124,363, while families with no earners (3,731) have the lowest median family income of $58,164, accounting for 8.6% and 22.6% of families, respectively.
| Number of Earners | # Families | Median Income |
| No Earners | 3,731 (22.6%) | $58,164 |
| 1 Earner | 5,907 (35.7%) | $69,424 |
| 2 Earners | 5,492 (33.2%) | $101,361 |
| 3+ Earners | 1,418 (8.6%) | $124,363 |
| Total | 16,548 (100.0%) | $84,851 |
Household Income in Port Orange
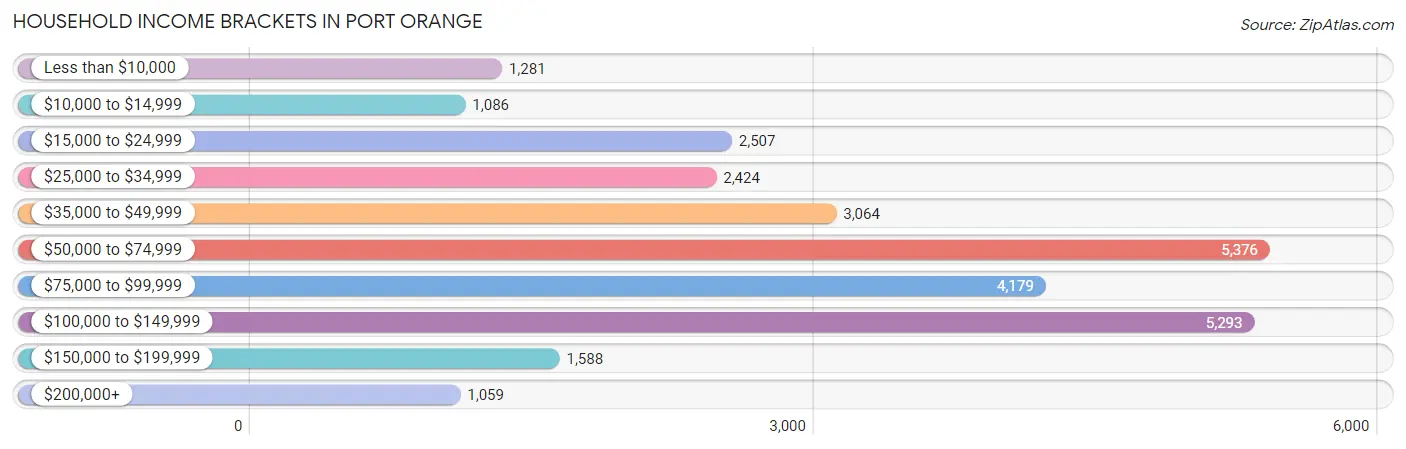
Household Income Brackets in Port Orange
With 5,376 households falling in the category, the $50,000 to $74,999 income range is the most frequent in Port Orange, accounting for 19.3% of all households. In contrast, only 1,059 households (3.8%) fall into the $200,000+ income bracket, making it the least populous group.
| Income Bracket | # Households | % Households |
| Less than $10,000 | 1,281 | 4.6% |
| $10,000 to $14,999 | 1,086 | 3.9% |
| $15,000 to $24,999 | 2,507 | 9.0% |
| $25,000 to $34,999 | 2,424 | 8.7% |
| $35,000 to $49,999 | 3,064 | 11.0% |
| $50,000 to $74,999 | 5,376 | 19.3% |
| $75,000 to $99,999 | 4,179 | 15.0% |
| $100,000 to $149,999 | 5,293 | 19.0% |
| $150,000 to $199,999 | 1,588 | 5.7% |
| $200,000+ | 1,059 | 3.8% |
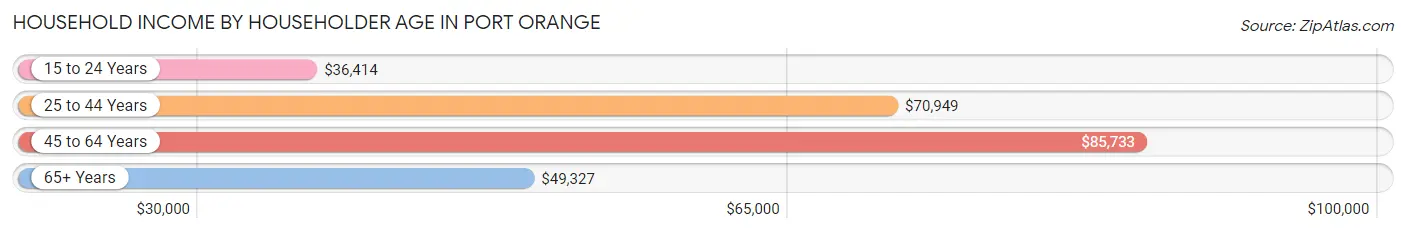
Household Income by Householder Age in Port Orange
The median household income in Port Orange is $65,026, with the highest median household income of $85,733 found in the 45 to 64 years age bracket for the primary householder. A total of 9,916 households (35.6%) fall into this category. Meanwhile, the 15 to 24 years age bracket for the primary householder has the lowest median household income of $36,414, with 1,024 households (3.7%) in this group.
| Income Bracket | # Households | Median Income |
| 15 to 24 Years | 1,024 (3.7%) | $36,414 |
| 25 to 44 Years | 6,557 (23.5%) | $70,949 |
| 45 to 64 Years | 9,916 (35.6%) | $85,733 |
| 65+ Years | 10,360 (37.2%) | $49,327 |
| Total | 27,857 (100.0%) | $65,026 |
Poverty in Port Orange
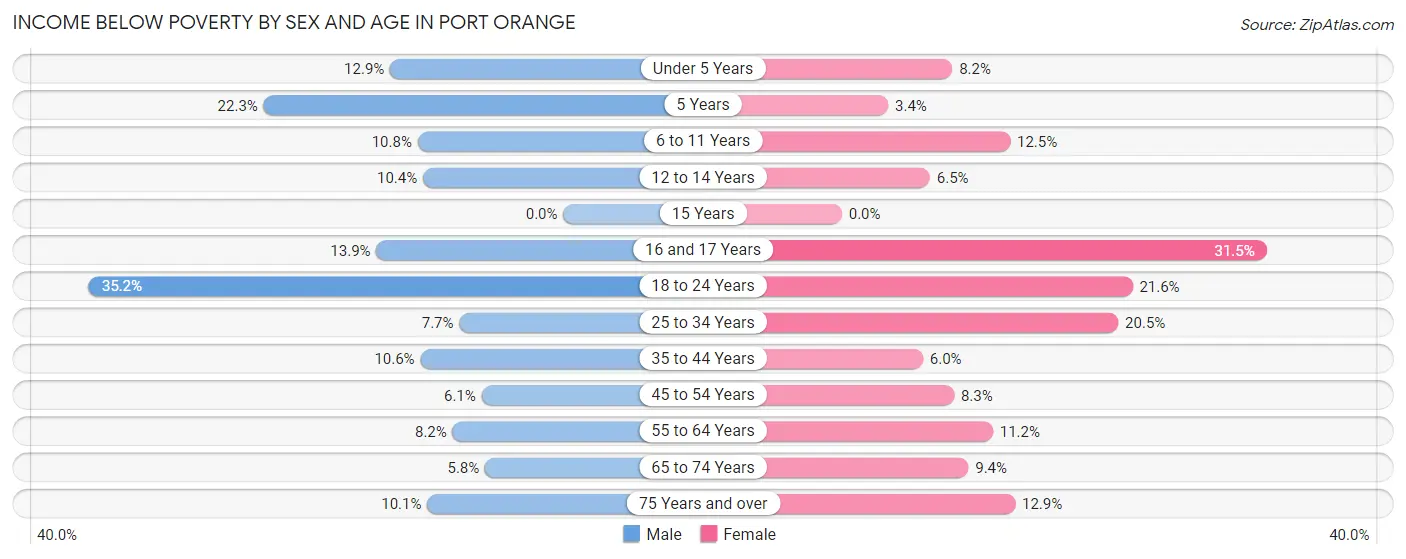
Income Below Poverty by Sex and Age in Port Orange
With 11.2% poverty level for males and 12.2% for females among the residents of Port Orange, 18 to 24 year old males and 16 and 17 year old females are the most vulnerable to poverty, with 1,029 males (35.2%) and 257 females (31.5%) in their respective age groups living below the poverty level.
| Age Bracket | Male | Female |
| Under 5 Years | 161 (12.9%) | 86 (8.2%) |
| 5 Years | 89 (22.3%) | 9 (3.4%) |
| 6 to 11 Years | 158 (10.8%) | 262 (12.5%) |
| 12 to 14 Years | 87 (10.4%) | 75 (6.5%) |
| 15 Years | 0 (0.0%) | 0 (0.0%) |
| 16 and 17 Years | 113 (13.9%) | 257 (31.5%) |
| 18 to 24 Years | 1,029 (35.2%) | 503 (21.6%) |
| 25 to 34 Years | 307 (7.7%) | 712 (20.5%) |
| 35 to 44 Years | 343 (10.6%) | 194 (6.0%) |
| 45 to 54 Years | 228 (6.1%) | 332 (8.3%) |
| 55 to 64 Years | 358 (8.2%) | 570 (11.2%) |
| 65 to 74 Years | 245 (5.8%) | 451 (9.4%) |
| 75 Years and over | 301 (10.1%) | 456 (12.9%) |
| Total | 3,419 (11.2%) | 3,907 (12.2%) |
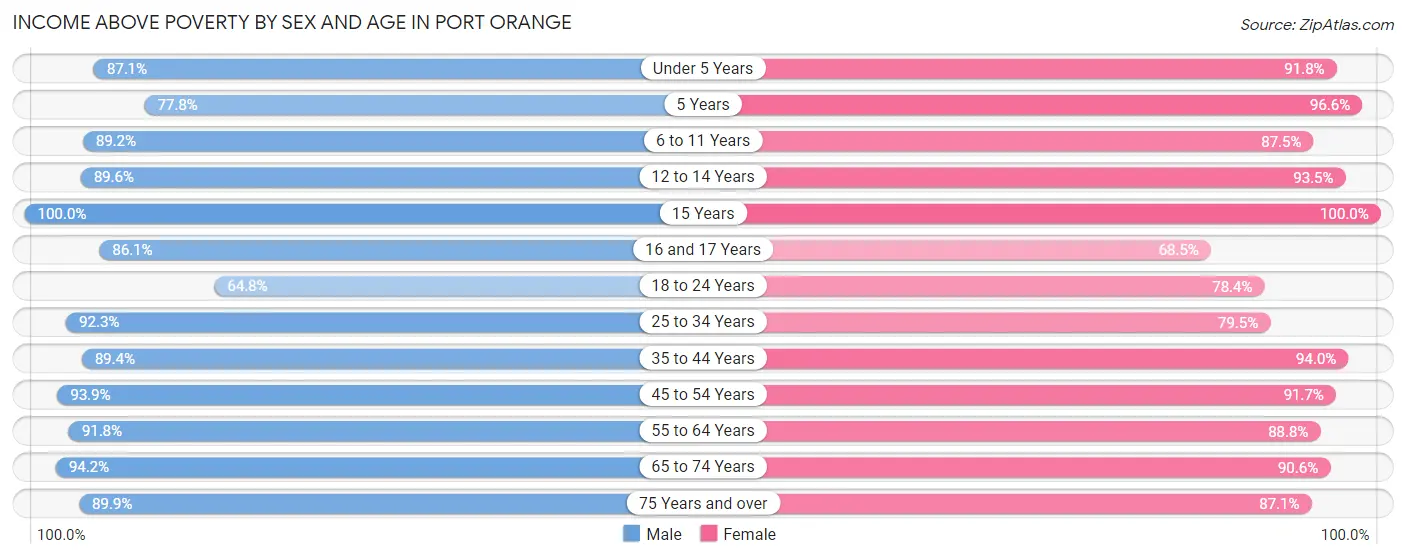
Income Above Poverty by Sex and Age in Port Orange
According to the poverty statistics in Port Orange, males aged 15 years and females aged 15 years are the age groups that are most secure financially, with 100.0% of males and 100.0% of females in these age groups living above the poverty line.
| Age Bracket | Male | Female |
| Under 5 Years | 1,091 (87.1%) | 963 (91.8%) |
| 5 Years | 311 (77.7%) | 253 (96.6%) |
| 6 to 11 Years | 1,304 (89.2%) | 1,835 (87.5%) |
| 12 to 14 Years | 748 (89.6%) | 1,072 (93.5%) |
| 15 Years | 257 (100.0%) | 295 (100.0%) |
| 16 and 17 Years | 701 (86.1%) | 558 (68.5%) |
| 18 to 24 Years | 1,892 (64.8%) | 1,828 (78.4%) |
| 25 to 34 Years | 3,671 (92.3%) | 2,757 (79.5%) |
| 35 to 44 Years | 2,889 (89.4%) | 3,027 (94.0%) |
| 45 to 54 Years | 3,530 (93.9%) | 3,655 (91.7%) |
| 55 to 64 Years | 3,998 (91.8%) | 4,517 (88.8%) |
| 65 to 74 Years | 3,971 (94.2%) | 4,350 (90.6%) |
| 75 Years and over | 2,679 (89.9%) | 3,090 (87.1%) |
| Total | 27,042 (88.8%) | 28,200 (87.8%) |
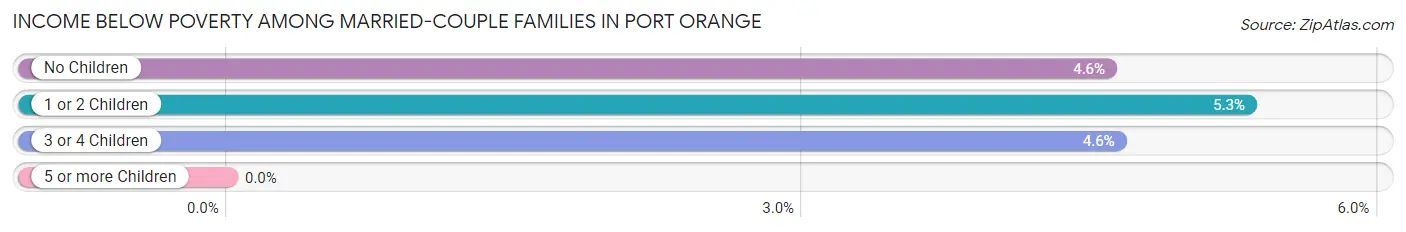
Income Below Poverty Among Married-Couple Families in Port Orange
The poverty statistics for married-couple families in Port Orange show that 4.8% or 588 of the total 12,317 families live below the poverty line. Families with 1 or 2 children have the highest poverty rate of 5.3%, comprising of 165 families. On the other hand, families with no children have the lowest poverty rate of 4.6%, which includes 389 families.
| Children | Above Poverty | Below Poverty |
| No Children | 8,091 (95.4%) | 389 (4.6%) |
| 1 or 2 Children | 2,939 (94.7%) | 165 (5.3%) |
| 3 or 4 Children | 699 (95.4%) | 34 (4.6%) |
| 5 or more Children | 0 (0.0%) | 0 (0.0%) |
| Total | 11,729 (95.2%) | 588 (4.8%) |
Income Below Poverty Among Single-Parent Households in Port Orange
According to the poverty data in Port Orange, 10.8% or 159 single-father households and 9.1% or 252 single-mother households are living below the poverty line. Among single-father households, those with no children have the highest poverty rate, with 58 households (12.3%) experiencing poverty. Likewise, among single-mother households, those with 5 or more children have the highest poverty rate, with 37 households (100.0%) falling below the poverty line.
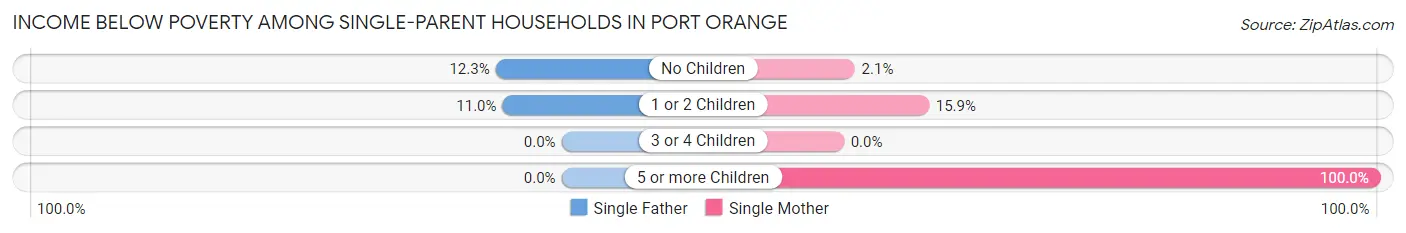
| Children | Single Father | Single Mother |
| No Children | 58 (12.3%) | 30 (2.1%) |
| 1 or 2 Children | 101 (11.0%) | 185 (15.9%) |
| 3 or 4 Children | 0 (0.0%) | 0 (0.0%) |
| 5 or more Children | 0 (0.0%) | 37 (100.0%) |
| Total | 159 (10.8%) | 252 (9.1%) |
Income Below Poverty Among Married-Couple vs Single-Parent Households in Port Orange
The poverty data for Port Orange shows that 588 of the married-couple family households (4.8%) and 411 of the single-parent households (9.7%) are living below the poverty level. Within the married-couple family households, those with 1 or 2 children have the highest poverty rate, with 165 households (5.3%) falling below the poverty line. Among the single-parent households, those with 5 or more children have the highest poverty rate, with 37 household (100.0%) living below poverty.
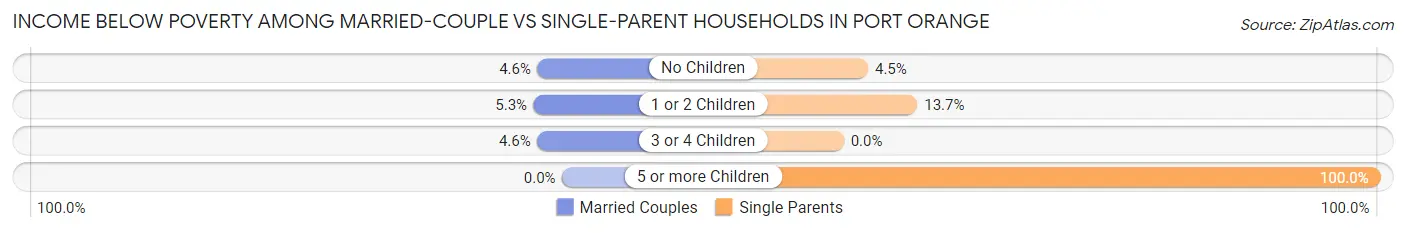
| Children | Married-Couple Families | Single-Parent Households |
| No Children | 389 (4.6%) | 88 (4.5%) |
| 1 or 2 Children | 165 (5.3%) | 286 (13.7%) |
| 3 or 4 Children | 34 (4.6%) | 0 (0.0%) |
| 5 or more Children | 0 (0.0%) | 37 (100.0%) |
| Total | 588 (4.8%) | 411 (9.7%) |
Race in Port Orange
The most populous races in Port Orange are White / Caucasian (55,022 | 87.5%), Hispanic or Latino (3,608 | 5.7%), and Black / African American (2,997 | 4.8%).
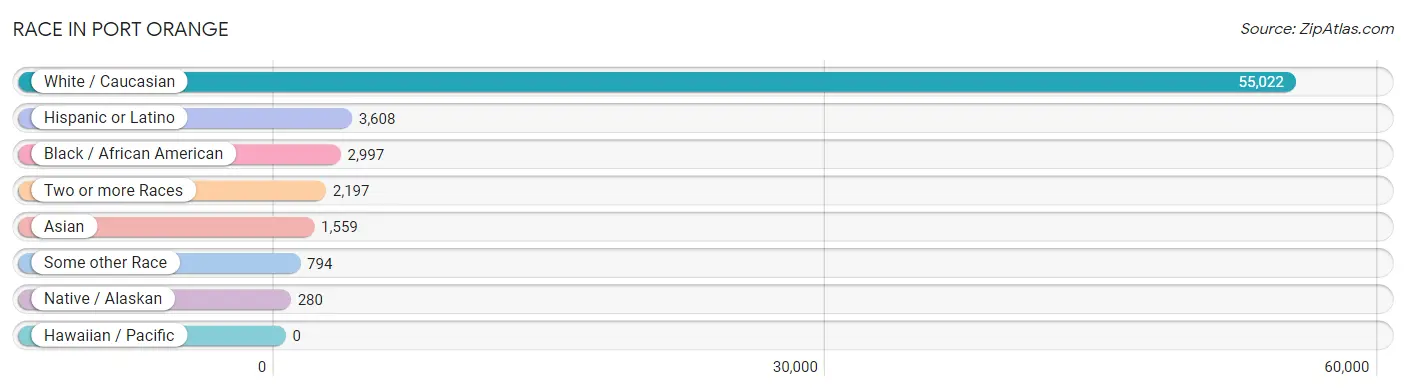
| Race | # Population | % Population |
| Asian | 1,559 | 2.5% |
| Black / African American | 2,997 | 4.8% |
| Hawaiian / Pacific | 0 | 0.0% |
| Hispanic or Latino | 3,608 | 5.7% |
| Native / Alaskan | 280 | 0.4% |
| White / Caucasian | 55,022 | 87.5% |
| Two or more Races | 2,197 | 3.5% |
| Some other Race | 794 | 1.3% |
| Total | 62,849 | 100.0% |
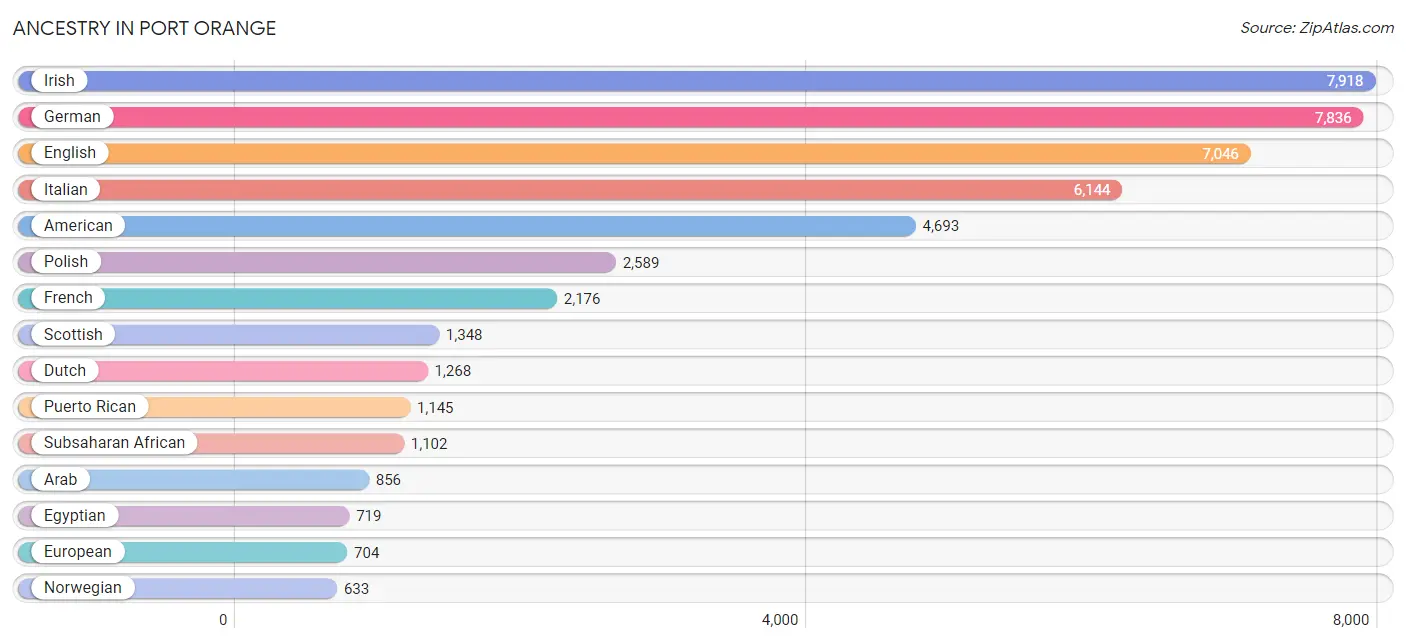
Ancestry in Port Orange
The most populous ancestries reported in Port Orange are Irish (7,918 | 12.6%), German (7,836 | 12.5%), English (7,046 | 11.2%), Italian (6,144 | 9.8%), and American (4,693 | 7.5%), together accounting for 53.5% of all Port Orange residents.
| Ancestry | # Population | % Population |
| African | 182 | 0.3% |
| American | 4,693 | 7.5% |
| Arab | 856 | 1.4% |
| Argentinean | 55 | 0.1% |
| Armenian | 29 | 0.1% |
| Australian | 24 | 0.0% |
| Austrian | 102 | 0.2% |
| Bahamian | 28 | 0.0% |
| Belgian | 18 | 0.0% |
| Bhutanese | 181 | 0.3% |
| Brazilian | 10 | 0.0% |
| British | 399 | 0.6% |
| Bulgarian | 9 | 0.0% |
| Burmese | 333 | 0.5% |
| Canadian | 348 | 0.5% |
| Central American | 115 | 0.2% |
| Central American Indian | 34 | 0.1% |
| Cherokee | 107 | 0.2% |
| Chippewa | 48 | 0.1% |
| Colombian | 269 | 0.4% |
| Costa Rican | 48 | 0.1% |
| Creek | 37 | 0.1% |
| Croatian | 131 | 0.2% |
| Cuban | 341 | 0.5% |
| Czech | 208 | 0.3% |
| Czechoslovakian | 41 | 0.1% |
| Danish | 290 | 0.5% |
| Dominican | 609 | 1.0% |
| Dutch | 1,268 | 2.0% |
| Eastern European | 224 | 0.4% |
| Ecuadorian | 64 | 0.1% |
| Egyptian | 719 | 1.1% |
| English | 7,046 | 11.2% |
| Ethiopian | 9 | 0.0% |
| European | 704 | 1.1% |
| Filipino | 77 | 0.1% |
| Finnish | 51 | 0.1% |
| French | 2,176 | 3.5% |
| French Canadian | 417 | 0.7% |
| German | 7,836 | 12.5% |
| German Russian | 12 | 0.0% |
| Greek | 438 | 0.7% |
| Guatemalan | 4 | 0.0% |
| Honduran | 6 | 0.0% |
| Hungarian | 482 | 0.8% |
| Indian (Asian) | 624 | 1.0% |
| Inupiat | 10 | 0.0% |
| Iranian | 51 | 0.1% |
| Irish | 7,918 | 12.6% |
| Iroquois | 35 | 0.1% |
| Israeli | 28 | 0.0% |
| Italian | 6,144 | 9.8% |
| Jamaican | 296 | 0.5% |
| Japanese | 29 | 0.1% |
| Korean | 219 | 0.4% |
| Lebanese | 44 | 0.1% |
| Lithuanian | 105 | 0.2% |
| Maltese | 38 | 0.1% |
| Mexican | 627 | 1.0% |
| Mexican American Indian | 101 | 0.2% |
| Moroccan | 50 | 0.1% |
| Native Hawaiian | 84 | 0.1% |
| Navajo | 19 | 0.0% |
| Nicaraguan | 26 | 0.0% |
| Nigerian | 420 | 0.7% |
| Northern European | 56 | 0.1% |
| Norwegian | 633 | 1.0% |
| Palestinian | 15 | 0.0% |
| Pennsylvania German | 143 | 0.2% |
| Peruvian | 131 | 0.2% |
| Polish | 2,589 | 4.1% |
| Portuguese | 265 | 0.4% |
| Puerto Rican | 1,145 | 1.8% |
| Romanian | 109 | 0.2% |
| Russian | 345 | 0.5% |
| Salvadoran | 31 | 0.1% |
| Scandinavian | 128 | 0.2% |
| Scotch-Irish | 597 | 0.9% |
| Scottish | 1,348 | 2.1% |
| Seminole | 3 | 0.0% |
| Serbian | 29 | 0.1% |
| Sioux | 8 | 0.0% |
| Slavic | 28 | 0.0% |
| Slovak | 229 | 0.4% |
| Slovene | 81 | 0.1% |
| South African | 491 | 0.8% |
| South American | 526 | 0.8% |
| South American Indian | 14 | 0.0% |
| Spaniard | 41 | 0.1% |
| Spanish | 78 | 0.1% |
| Sri Lankan | 293 | 0.5% |
| Subsaharan African | 1,102 | 1.8% |
| Swedish | 573 | 0.9% |
| Swiss | 198 | 0.3% |
| Syrian | 10 | 0.0% |
| Thai | 238 | 0.4% |
| Trinidadian and Tobagonian | 47 | 0.1% |
| Turkish | 27 | 0.0% |
| Ukrainian | 349 | 0.6% |
| Venezuelan | 7 | 0.0% |
| Welsh | 632 | 1.0% |
| West Indian | 63 | 0.1% |
| Yugoslavian | 10 | 0.0% | View All 103 Rows |
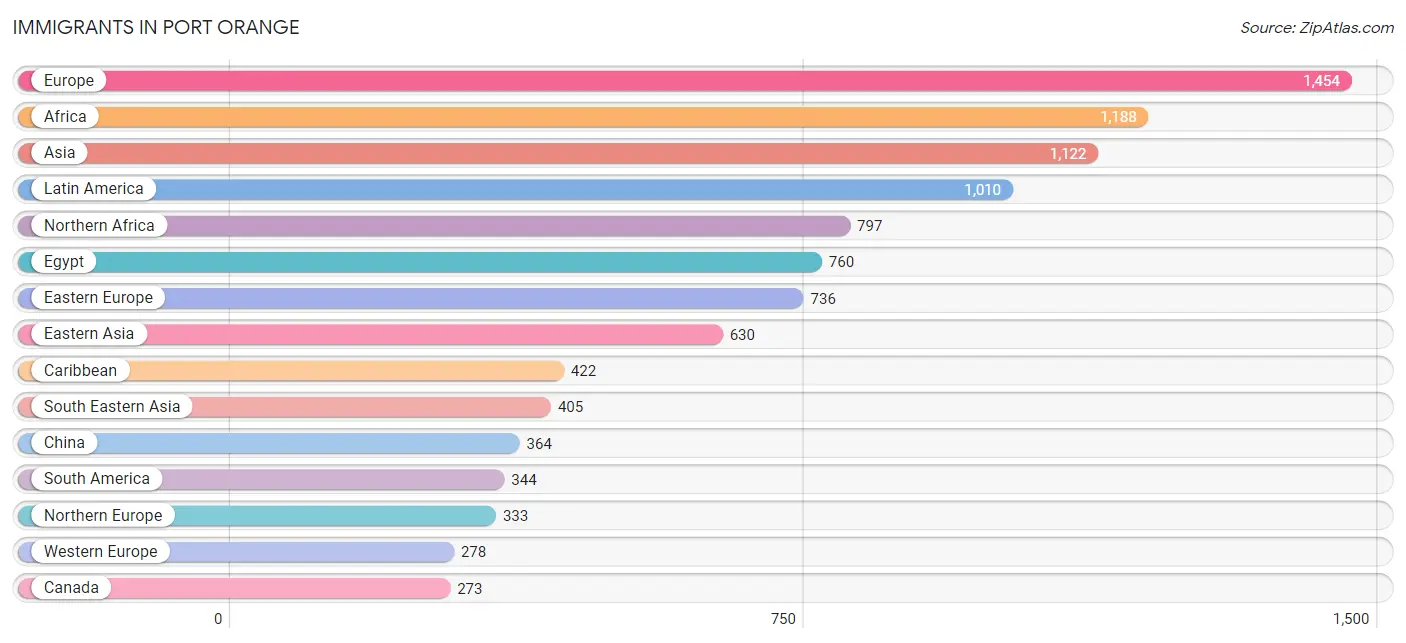
Immigrants in Port Orange
The most numerous immigrant groups reported in Port Orange came from Europe (1,454 | 2.3%), Africa (1,188 | 1.9%), Asia (1,122 | 1.8%), Latin America (1,010 | 1.6%), and Northern Africa (797 | 1.3%), together accounting for 8.9% of all Port Orange residents.
| Immigration Origin | # Population | % Population |
| Afghanistan | 15 | 0.0% |
| Africa | 1,188 | 1.9% |
| Argentina | 21 | 0.0% |
| Armenia | 3 | 0.0% |
| Asia | 1,122 | 1.8% |
| Australia | 59 | 0.1% |
| Brazil | 63 | 0.1% |
| Cambodia | 29 | 0.1% |
| Cameroon | 46 | 0.1% |
| Canada | 273 | 0.4% |
| Caribbean | 422 | 0.7% |
| Central America | 244 | 0.4% |
| China | 364 | 0.6% |
| Colombia | 79 | 0.1% |
| Costa Rica | 29 | 0.1% |
| Cuba | 96 | 0.2% |
| Czechoslovakia | 79 | 0.1% |
| Dominican Republic | 134 | 0.2% |
| Eastern Africa | 81 | 0.1% |
| Eastern Asia | 630 | 1.0% |
| Eastern Europe | 736 | 1.2% |
| Egypt | 760 | 1.2% |
| El Salvador | 34 | 0.1% |
| England | 183 | 0.3% |
| Ethiopia | 9 | 0.0% |
| Europe | 1,454 | 2.3% |
| France | 29 | 0.1% |
| Germany | 249 | 0.4% |
| Greece | 44 | 0.1% |
| Guyana | 69 | 0.1% |
| Honduras | 21 | 0.0% |
| Hungary | 187 | 0.3% |
| Iran | 51 | 0.1% |
| Ireland | 4 | 0.0% |
| Italy | 29 | 0.1% |
| Jamaica | 89 | 0.1% |
| Japan | 54 | 0.1% |
| Kenya | 38 | 0.1% |
| Korea | 212 | 0.3% |
| Latin America | 1,010 | 1.6% |
| Lebanon | 9 | 0.0% |
| Malaysia | 9 | 0.0% |
| Mexico | 160 | 0.3% |
| Middle Africa | 46 | 0.1% |
| Morocco | 37 | 0.1% |
| Nigeria | 223 | 0.4% |
| Northern Africa | 797 | 1.3% |
| Northern Europe | 333 | 0.5% |
| Oceania | 59 | 0.1% |
| Peru | 104 | 0.2% |
| Philippines | 154 | 0.3% |
| Poland | 103 | 0.2% |
| Portugal | 6 | 0.0% |
| Romania | 180 | 0.3% |
| Sierra Leone | 11 | 0.0% |
| South Africa | 20 | 0.0% |
| South America | 344 | 0.5% |
| South Central Asia | 66 | 0.1% |
| South Eastern Asia | 405 | 0.6% |
| Southern Europe | 107 | 0.2% |
| Spain | 28 | 0.0% |
| Taiwan | 117 | 0.2% |
| Trinidad and Tobago | 103 | 0.2% |
| Turkey | 9 | 0.0% |
| Ukraine | 163 | 0.3% |
| Venezuela | 8 | 0.0% |
| Vietnam | 213 | 0.3% |
| Western Africa | 244 | 0.4% |
| Western Asia | 21 | 0.0% |
| Western Europe | 278 | 0.4% | View All 70 Rows |
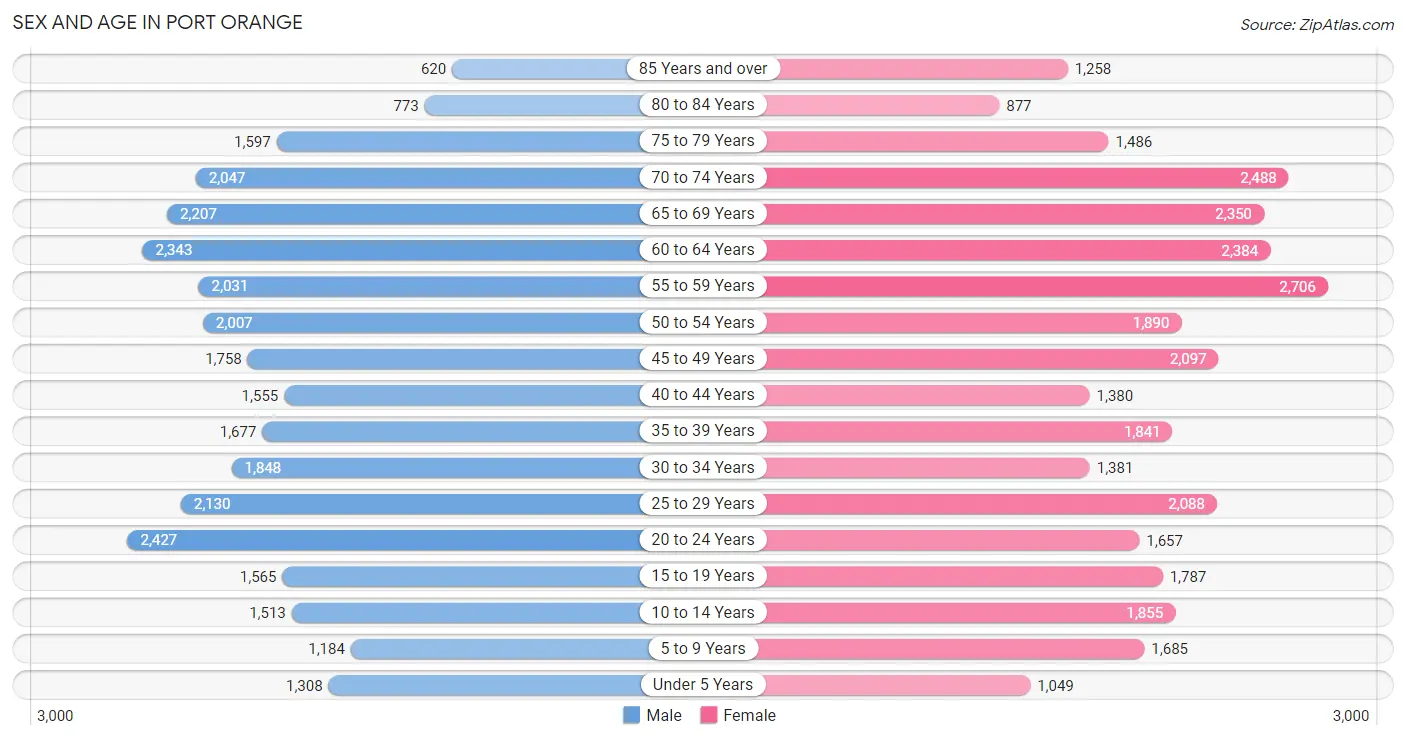
Sex and Age in Port Orange
Sex and Age in Port Orange
The most populous age groups in Port Orange are 20 to 24 Years (2,427 | 7.9%) for men and 55 to 59 Years (2,706 | 8.4%) for women.
| Age Bracket | Male | Female |
| Under 5 Years | 1,308 (4.3%) | 1,049 (3.3%) |
| 5 to 9 Years | 1,184 (3.9%) | 1,685 (5.2%) |
| 10 to 14 Years | 1,513 (5.0%) | 1,855 (5.8%) |
| 15 to 19 Years | 1,565 (5.1%) | 1,787 (5.5%) |
| 20 to 24 Years | 2,427 (7.9%) | 1,657 (5.1%) |
| 25 to 29 Years | 2,130 (7.0%) | 2,088 (6.5%) |
| 30 to 34 Years | 1,848 (6.0%) | 1,381 (4.3%) |
| 35 to 39 Years | 1,677 (5.5%) | 1,841 (5.7%) |
| 40 to 44 Years | 1,555 (5.1%) | 1,380 (4.3%) |
| 45 to 49 Years | 1,758 (5.8%) | 2,097 (6.5%) |
| 50 to 54 Years | 2,007 (6.6%) | 1,890 (5.9%) |
| 55 to 59 Years | 2,031 (6.6%) | 2,706 (8.4%) |
| 60 to 64 Years | 2,343 (7.7%) | 2,384 (7.4%) |
| 65 to 69 Years | 2,207 (7.2%) | 2,350 (7.3%) |
| 70 to 74 Years | 2,047 (6.7%) | 2,488 (7.7%) |
| 75 to 79 Years | 1,597 (5.2%) | 1,486 (4.6%) |
| 80 to 84 Years | 773 (2.5%) | 877 (2.7%) |
| 85 Years and over | 620 (2.0%) | 1,258 (3.9%) |
| Total | 30,590 (100.0%) | 32,259 (100.0%) |
Families and Households in Port Orange
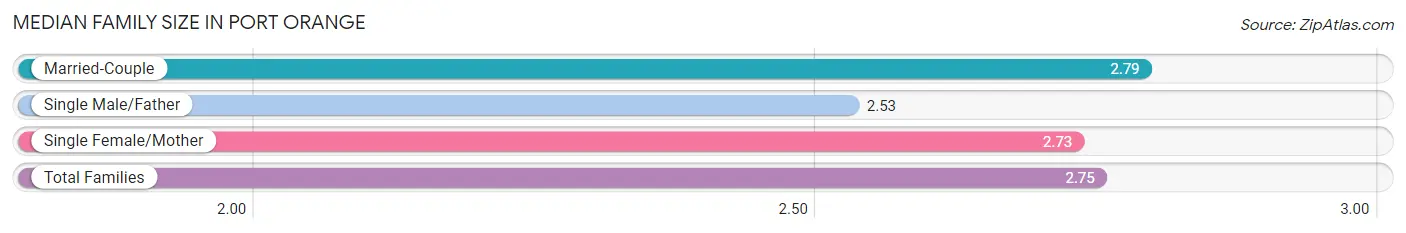
Median Family Size in Port Orange
The median family size in Port Orange is 2.75 persons per family, with married-couple families (12,317 | 74.4%) accounting for the largest median family size of 2.79 persons per family. On the other hand, single male/father families (1,474 | 8.9%) represent the smallest median family size with 2.53 persons per family.
| Family Type | # Families | Family Size |
| Married-Couple | 12,317 (74.4%) | 2.79 |
| Single Male/Father | 1,474 (8.9%) | 2.53 |
| Single Female/Mother | 2,757 (16.7%) | 2.73 |
| Total Families | 16,548 (100.0%) | 2.75 |
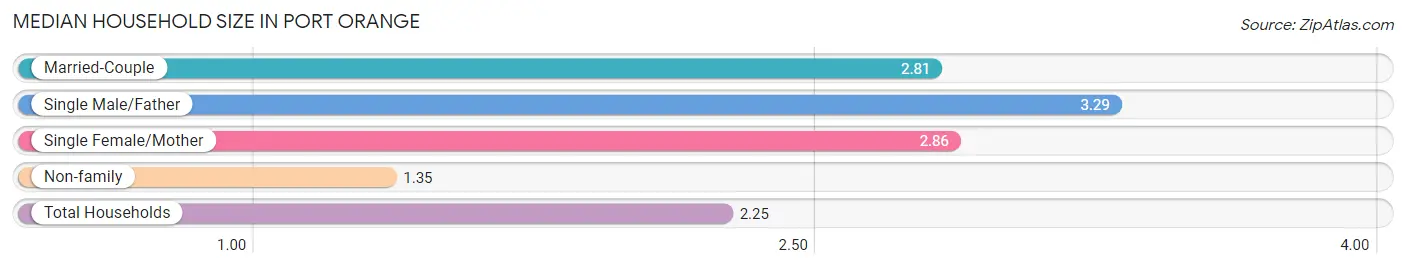
Median Household Size in Port Orange
The median household size in Port Orange is 2.25 persons per household, with single male/father households (1,474 | 5.3%) accounting for the largest median household size of 3.29 persons per household. non-family households (11,309 | 40.6%) represent the smallest median household size with 1.35 persons per household.
| Household Type | # Households | Household Size |
| Married-Couple | 12,317 (44.2%) | 2.81 |
| Single Male/Father | 1,474 (5.3%) | 3.29 |
| Single Female/Mother | 2,757 (9.9%) | 2.86 |
| Non-family | 11,309 (40.6%) | 1.35 |
| Total Households | 27,857 (100.0%) | 2.25 |
Household Size by Marriage Status in Port Orange
Out of a total of 27,857 households in Port Orange, 16,548 (59.4%) are family households, while 11,309 (40.6%) are nonfamily households. The most numerous type of family households are 2-person households, comprising 9,113, and the most common type of nonfamily households are 1-person households, comprising 8,634.
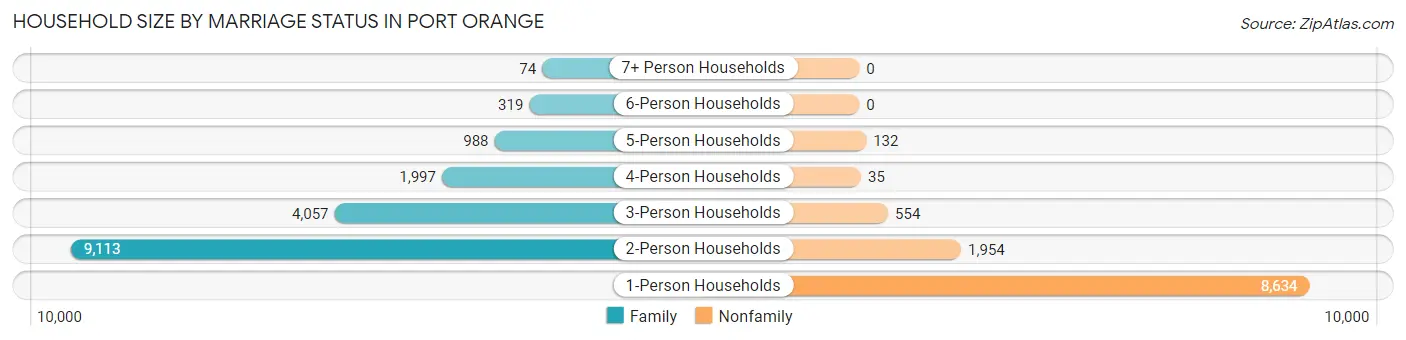
| Household Size | Family Households | Nonfamily Households |
| 1-Person Households | - | 8,634 (31.0%) |
| 2-Person Households | 9,113 (32.7%) | 1,954 (7.0%) |
| 3-Person Households | 4,057 (14.6%) | 554 (2.0%) |
| 4-Person Households | 1,997 (7.2%) | 35 (0.1%) |
| 5-Person Households | 988 (3.5%) | 132 (0.5%) |
| 6-Person Households | 319 (1.1%) | 0 (0.0%) |
| 7+ Person Households | 74 (0.3%) | 0 (0.0%) |
| Total | 16,548 (59.4%) | 11,309 (40.6%) |
Female Fertility in Port Orange
Fertility by Age in Port Orange
Average fertility rate in Port Orange is 36.0 births per 1,000 women. Women in the age bracket of 20 to 34 years have the highest fertility rate with 60.0 births per 1,000 women. Women in the age bracket of 20 to 34 years acount for 67.9% of all women with births.
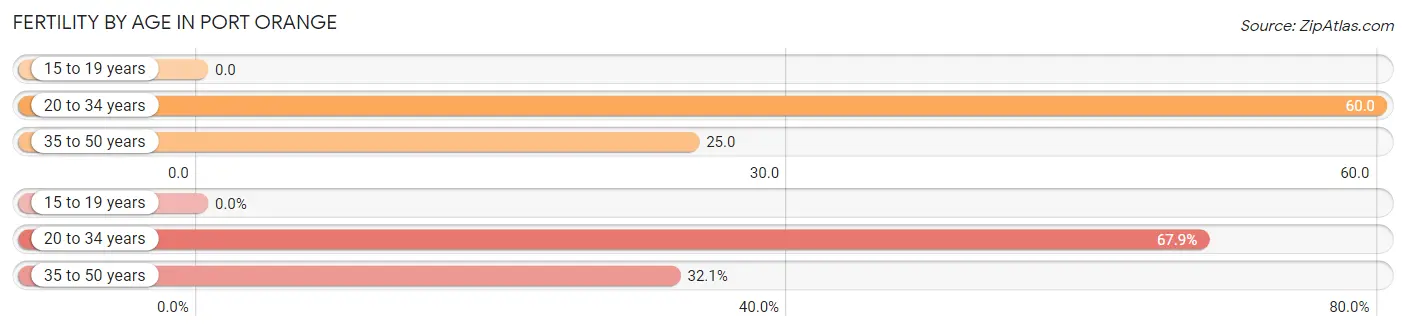
| Age Bracket | Women with Births | Births / 1,000 Women |
| 15 to 19 years | 0 (0.0%) | 0.0 |
| 20 to 34 years | 305 (67.9%) | 60.0 |
| 35 to 50 years | 144 (32.1%) | 25.0 |
| Total | 449 (100.0%) | 36.0 |
Fertility by Age by Marriage Status in Port Orange
52.1% of women with births (449) in Port Orange are married. The highest percentage of unmarried women with births falls into 20 to 34 years age bracket with 56.4% of them unmarried at the time of birth, while the lowest percentage of unmarried women with births belong to 35 to 50 years age bracket with 29.9% of them unmarried.
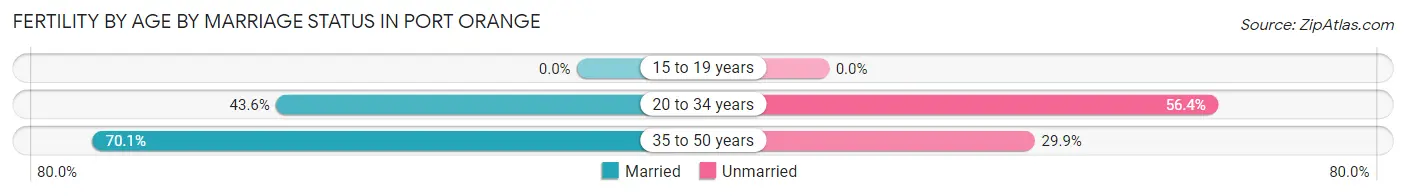
| Age Bracket | Married | Unmarried |
| 15 to 19 years | 0 (0.0%) | 0 (0.0%) |
| 20 to 34 years | 133 (43.6%) | 172 (56.4%) |
| 35 to 50 years | 101 (70.1%) | 43 (29.9%) |
| Total | 234 (52.1%) | 215 (47.9%) |
Fertility by Education in Port Orange
Average fertility rate in Port Orange is 36.0 births per 1,000 women. Women with the education attainment of college or associate's degree have the highest fertility rate of 54.0 births per 1,000 women, while women with the education attainment of high school diploma have the lowest fertility at 16.0 births per 1,000 women. Women with the education attainment of college or associate's degree represent 51.7% of all women with births.
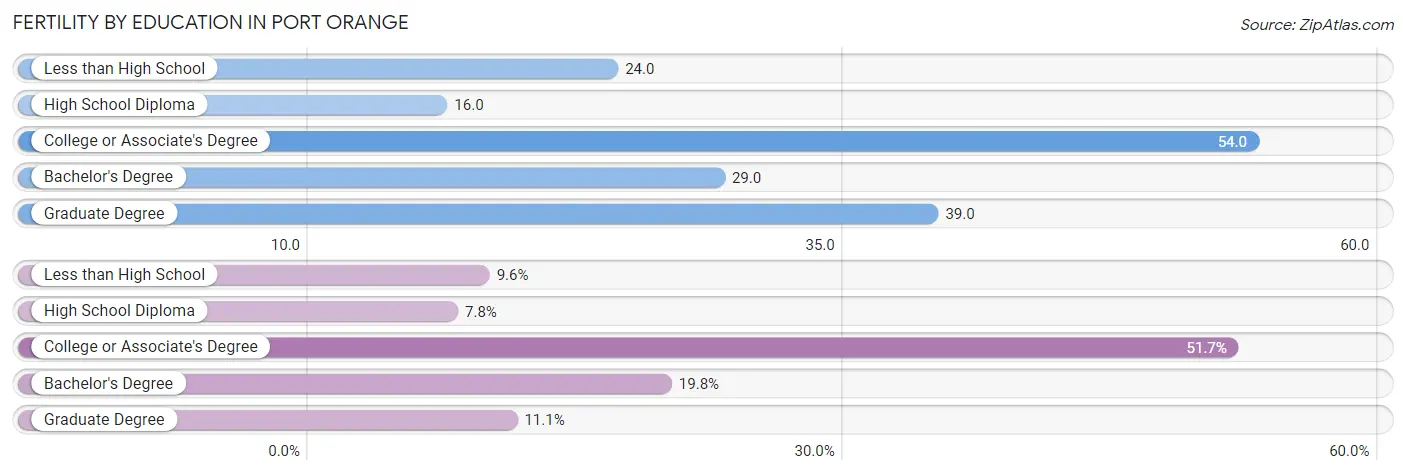
| Educational Attainment | Women with Births | Births / 1,000 Women |
| Less than High School | 43 (9.6%) | 24.0 |
| High School Diploma | 35 (7.8%) | 16.0 |
| College or Associate's Degree | 232 (51.7%) | 54.0 |
| Bachelor's Degree | 89 (19.8%) | 29.0 |
| Graduate Degree | 50 (11.1%) | 39.0 |
| Total | 449 (100.0%) | 36.0 |
Fertility by Education by Marriage Status in Port Orange
47.9% of women with births in Port Orange are unmarried. Women with the educational attainment of bachelor's degree are most likely to be married with 100.0% of them married at childbirth, while women with the educational attainment of less than high school are least likely to be married with 100.0% of them unmarried at childbirth.
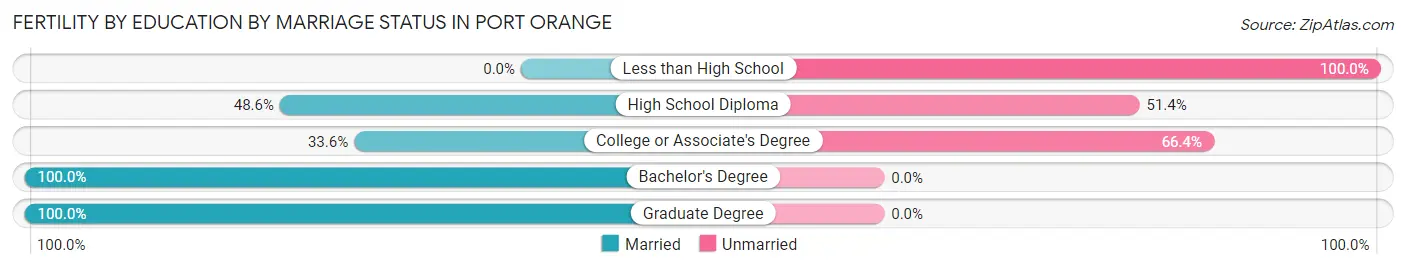
| Educational Attainment | Married | Unmarried |
| Less than High School | 0 (0.0%) | 43 (100.0%) |
| High School Diploma | 17 (48.6%) | 18 (51.4%) |
| College or Associate's Degree | 78 (33.6%) | 154 (66.4%) |
| Bachelor's Degree | 89 (100.0%) | 0 (0.0%) |
| Graduate Degree | 50 (100.0%) | 0 (0.0%) |
| Total | 234 (52.1%) | 215 (47.9%) |
Employment Characteristics in Port Orange
Employment by Class of Employer in Port Orange
Among the 28,810 employed individuals in Port Orange, private company employees (20,531 | 71.3%), local government employees (2,126 | 7.4%), and not-for-profit organizations (1,823 | 6.3%) make up the most common classes of employment.
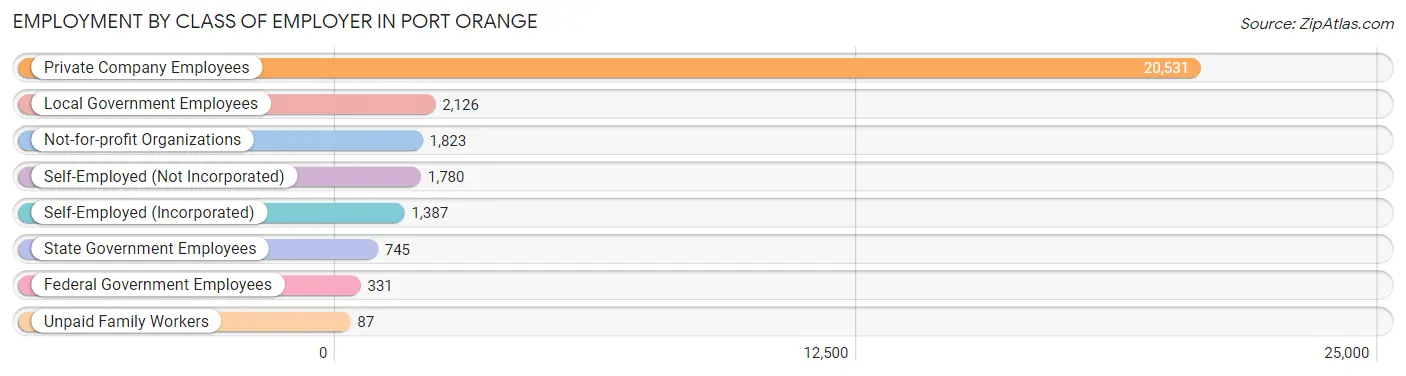
| Employer Class | # Employees | % Employees |
| Private Company Employees | 20,531 | 71.3% |
| Self-Employed (Incorporated) | 1,387 | 4.8% |
| Self-Employed (Not Incorporated) | 1,780 | 6.2% |
| Not-for-profit Organizations | 1,823 | 6.3% |
| Local Government Employees | 2,126 | 7.4% |
| State Government Employees | 745 | 2.6% |
| Federal Government Employees | 331 | 1.1% |
| Unpaid Family Workers | 87 | 0.3% |
| Total | 28,810 | 100.0% |
Employment Status by Age in Port Orange
According to the labor force statistics for Port Orange, out of the total population over 16 years of age (53,703), 56.7% or 30,450 individuals are in the labor force, with 3.9% or 1,188 of them unemployed. The age group with the highest labor force participation rate is 35 to 44 years, with 85.8% or 5,537 individuals in the labor force. Within the labor force, the 16 to 19 years age range has the highest percentage of unemployed individuals, with 6.3% or 64 of them being unemployed.
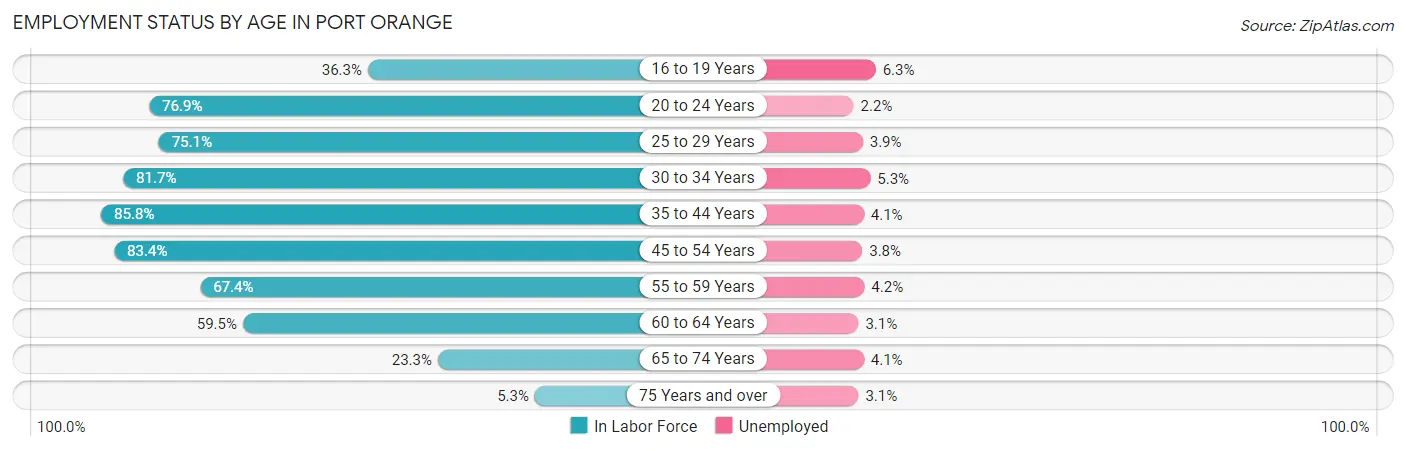
| Age Bracket | In Labor Force | Unemployed |
| 16 to 19 Years | 1,016 (36.3%) | 64 (6.3%) |
| 20 to 24 Years | 3,141 (76.9%) | 69 (2.2%) |
| 25 to 29 Years | 3,168 (75.1%) | 124 (3.9%) |
| 30 to 34 Years | 2,638 (81.7%) | 140 (5.3%) |
| 35 to 44 Years | 5,537 (85.8%) | 227 (4.1%) |
| 45 to 54 Years | 6,465 (83.4%) | 246 (3.8%) |
| 55 to 59 Years | 3,193 (67.4%) | 134 (4.2%) |
| 60 to 64 Years | 2,813 (59.5%) | 87 (3.1%) |
| 65 to 74 Years | 2,118 (23.3%) | 87 (4.1%) |
| 75 Years and over | 350 (5.3%) | 11 (3.1%) |
| Total | 30,450 (56.7%) | 1,188 (3.9%) |
Employment Status by Educational Attainment in Port Orange
According to labor force statistics for Port Orange, 76.5% of individuals (23,804) out of the total population between 25 and 64 years of age (31,116) are in the labor force, with 4.0% or 952 of them being unemployed. The group with the highest labor force participation rate are those with the educational attainment of bachelor's degree or higher, with 80.2% or 7,953 individuals in the labor force. Within the labor force, individuals with college / associate degree education have the highest percentage of unemployment, with 5.2% or 467 of them being unemployed.
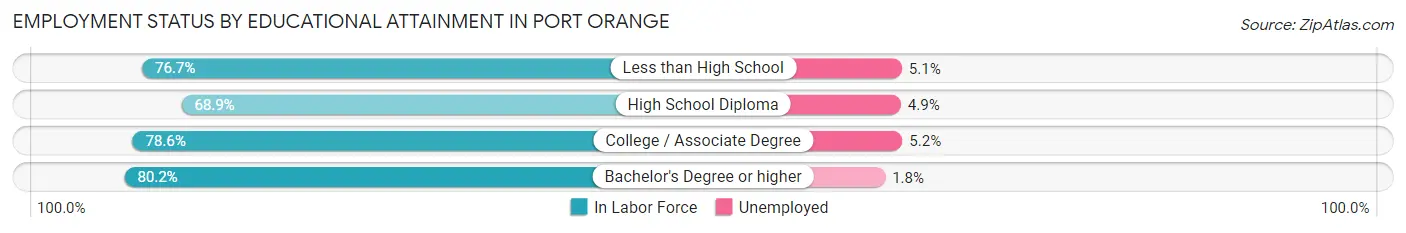
| Educational Attainment | In Labor Force | Unemployed |
| Less than High School | 1,425 (76.7%) | 95 (5.1%) |
| High School Diploma | 5,458 (68.9%) | 388 (4.9%) |
| College / Associate Degree | 8,976 (78.6%) | 594 (5.2%) |
| Bachelor's Degree or higher | 7,953 (80.2%) | 178 (1.8%) |
| Total | 23,804 (76.5%) | 1,245 (4.0%) |
Employment Occupations by Sex in Port Orange
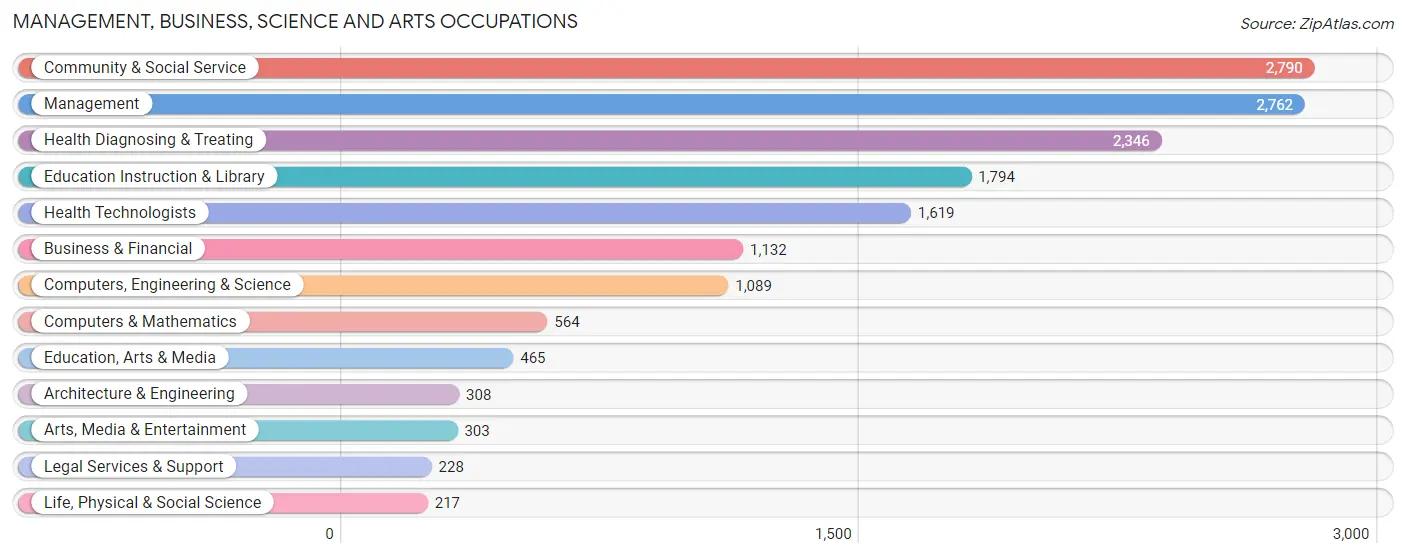
Management, Business, Science and Arts Occupations
The most common Management, Business, Science and Arts occupations in Port Orange are Community & Social Service (2,790 | 9.5%), Management (2,762 | 9.4%), Health Diagnosing & Treating (2,346 | 8.0%), Education Instruction & Library (1,794 | 6.1%), and Health Technologists (1,619 | 5.5%).
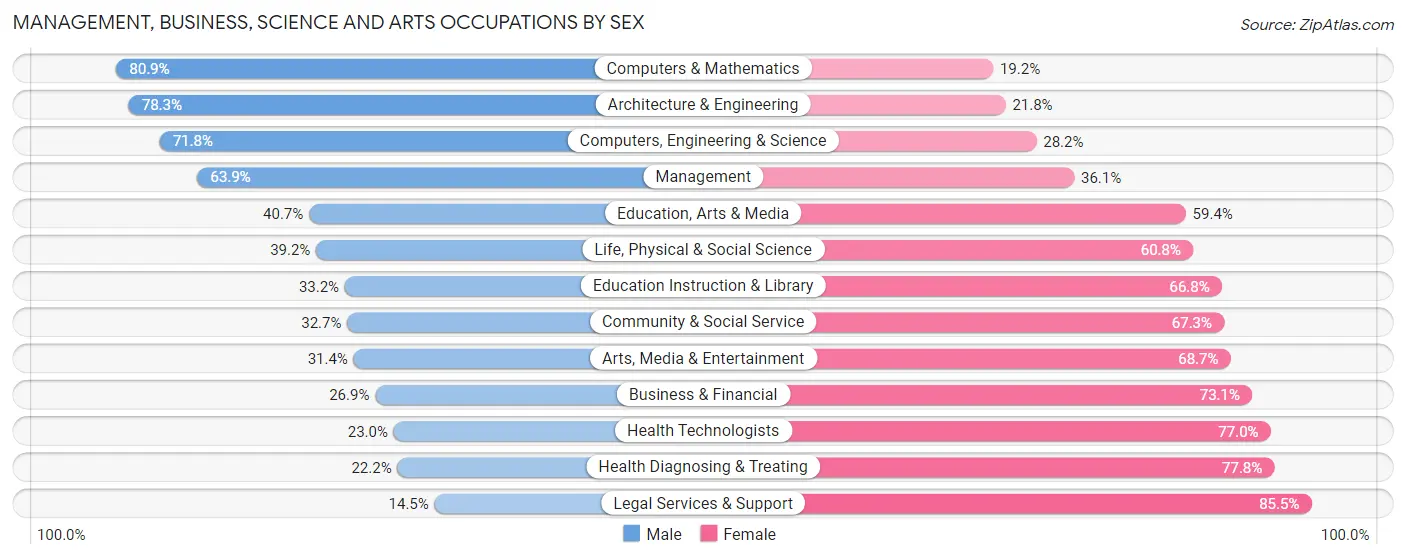
Management, Business, Science and Arts Occupations by Sex
Within the Management, Business, Science and Arts occupations in Port Orange, the most male-oriented occupations are Computers & Mathematics (80.8%), Architecture & Engineering (78.2%), and Computers, Engineering & Science (71.8%), while the most female-oriented occupations are Legal Services & Support (85.5%), Health Diagnosing & Treating (77.8%), and Health Technologists (77.0%).
| Occupation | Male | Female |
| Management | 1,766 (63.9%) | 996 (36.1%) |
| Business & Financial | 304 (26.9%) | 828 (73.1%) |
| Computers, Engineering & Science | 782 (71.8%) | 307 (28.2%) |
| Computers & Mathematics | 456 (80.8%) | 108 (19.2%) |
| Architecture & Engineering | 241 (78.2%) | 67 (21.7%) |
| Life, Physical & Social Science | 85 (39.2%) | 132 (60.8%) |
| Community & Social Service | 912 (32.7%) | 1,878 (67.3%) |
| Education, Arts & Media | 189 (40.6%) | 276 (59.4%) |
| Legal Services & Support | 33 (14.5%) | 195 (85.5%) |
| Education Instruction & Library | 595 (33.2%) | 1,199 (66.8%) |
| Arts, Media & Entertainment | 95 (31.4%) | 208 (68.6%) |
| Health Diagnosing & Treating | 521 (22.2%) | 1,825 (77.8%) |
| Health Technologists | 372 (23.0%) | 1,247 (77.0%) |
| Total (Category) | 4,285 (42.3%) | 5,834 (57.7%) |
| Total (Overall) | 15,335 (52.4%) | 13,909 (47.6%) |
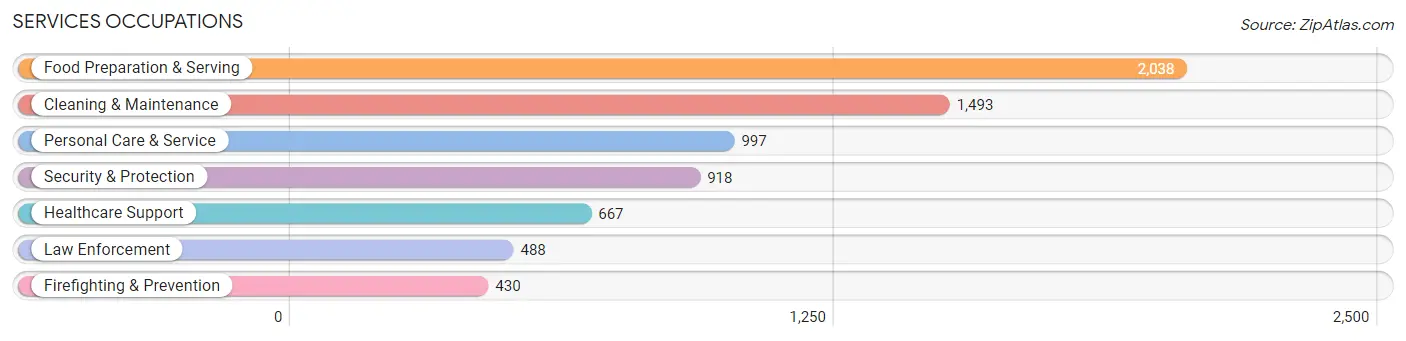
Services Occupations
The most common Services occupations in Port Orange are Food Preparation & Serving (2,038 | 7.0%), Cleaning & Maintenance (1,493 | 5.1%), Personal Care & Service (997 | 3.4%), Security & Protection (918 | 3.1%), and Healthcare Support (667 | 2.3%).
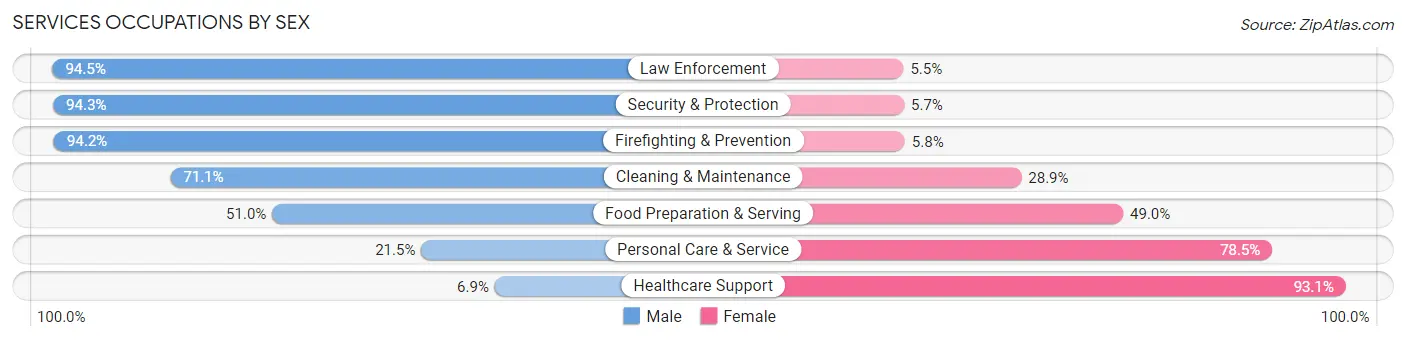
Services Occupations by Sex
Within the Services occupations in Port Orange, the most male-oriented occupations are Law Enforcement (94.5%), Security & Protection (94.3%), and Firefighting & Prevention (94.2%), while the most female-oriented occupations are Healthcare Support (93.1%), Personal Care & Service (78.5%), and Food Preparation & Serving (49.0%).
| Occupation | Male | Female |
| Healthcare Support | 46 (6.9%) | 621 (93.1%) |
| Security & Protection | 866 (94.3%) | 52 (5.7%) |
| Firefighting & Prevention | 405 (94.2%) | 25 (5.8%) |
| Law Enforcement | 461 (94.5%) | 27 (5.5%) |
| Food Preparation & Serving | 1,039 (51.0%) | 999 (49.0%) |
| Cleaning & Maintenance | 1,062 (71.1%) | 431 (28.9%) |
| Personal Care & Service | 214 (21.5%) | 783 (78.5%) |
| Total (Category) | 3,227 (52.8%) | 2,886 (47.2%) |
| Total (Overall) | 15,335 (52.4%) | 13,909 (47.6%) |
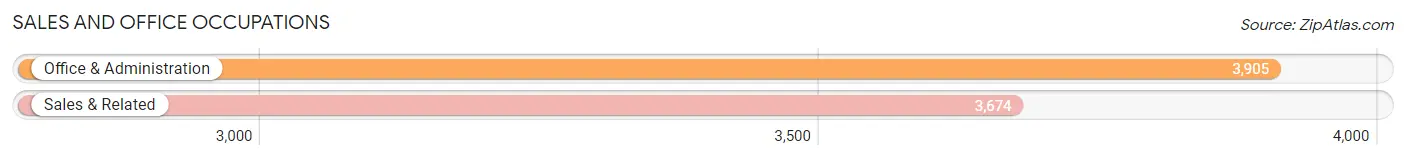
Sales and Office Occupations
The most common Sales and Office occupations in Port Orange are Office & Administration (3,905 | 13.4%), and Sales & Related (3,674 | 12.6%).
Sales and Office Occupations by Sex
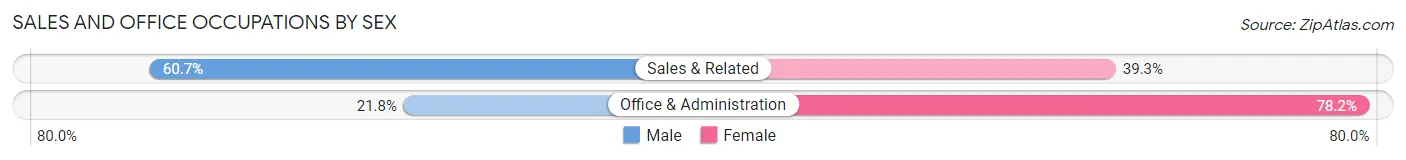
| Occupation | Male | Female |
| Sales & Related | 2,231 (60.7%) | 1,443 (39.3%) |
| Office & Administration | 852 (21.8%) | 3,053 (78.2%) |
| Total (Category) | 3,083 (40.7%) | 4,496 (59.3%) |
| Total (Overall) | 15,335 (52.4%) | 13,909 (47.6%) |
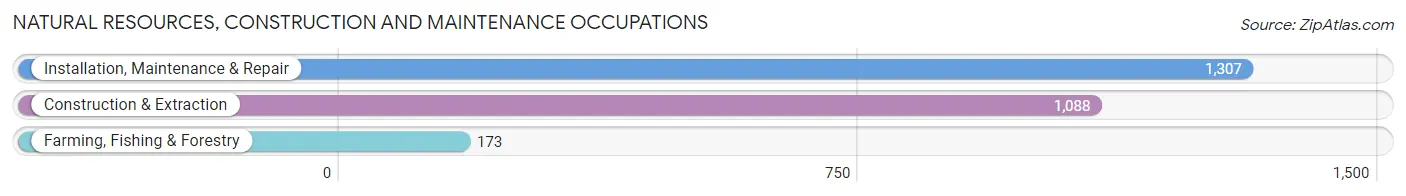
Natural Resources, Construction and Maintenance Occupations
The most common Natural Resources, Construction and Maintenance occupations in Port Orange are Installation, Maintenance & Repair (1,307 | 4.5%), Construction & Extraction (1,088 | 3.7%), and Farming, Fishing & Forestry (173 | 0.6%).
Natural Resources, Construction and Maintenance Occupations by Sex
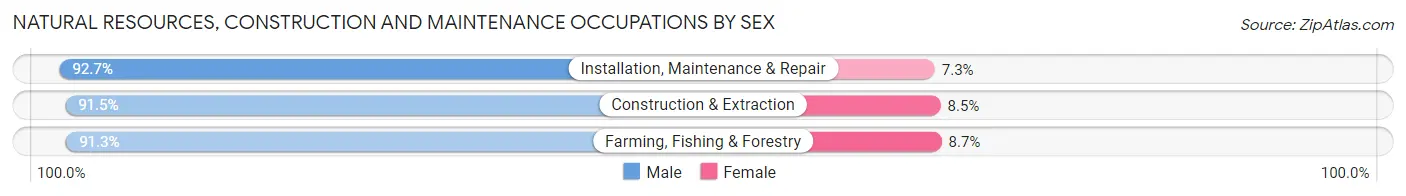
| Occupation | Male | Female |
| Farming, Fishing & Forestry | 158 (91.3%) | 15 (8.7%) |
| Construction & Extraction | 996 (91.5%) | 92 (8.5%) |
| Installation, Maintenance & Repair | 1,212 (92.7%) | 95 (7.3%) |
| Total (Category) | 2,366 (92.1%) | 202 (7.9%) |
| Total (Overall) | 15,335 (52.4%) | 13,909 (47.6%) |
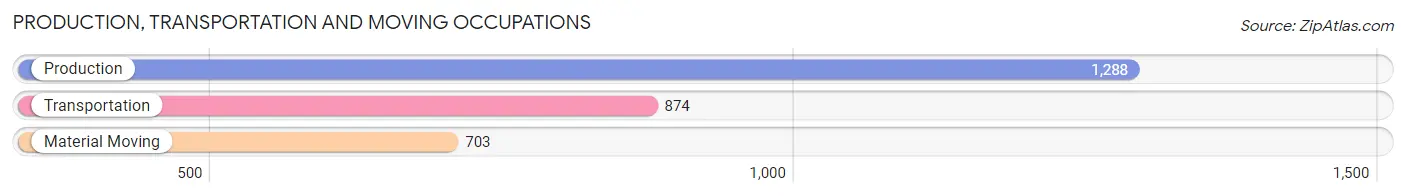
Production, Transportation and Moving Occupations
The most common Production, Transportation and Moving occupations in Port Orange are Production (1,288 | 4.4%), Transportation (874 | 3.0%), and Material Moving (703 | 2.4%).
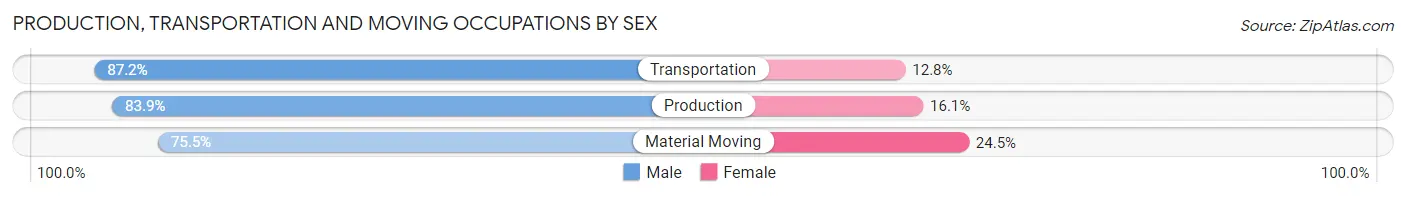
Production, Transportation and Moving Occupations by Sex
| Occupation | Male | Female |
| Production | 1,081 (83.9%) | 207 (16.1%) |
| Transportation | 762 (87.2%) | 112 (12.8%) |
| Material Moving | 531 (75.5%) | 172 (24.5%) |
| Total (Category) | 2,374 (82.9%) | 491 (17.1%) |
| Total (Overall) | 15,335 (52.4%) | 13,909 (47.6%) |
Employment Industries by Sex in Port Orange
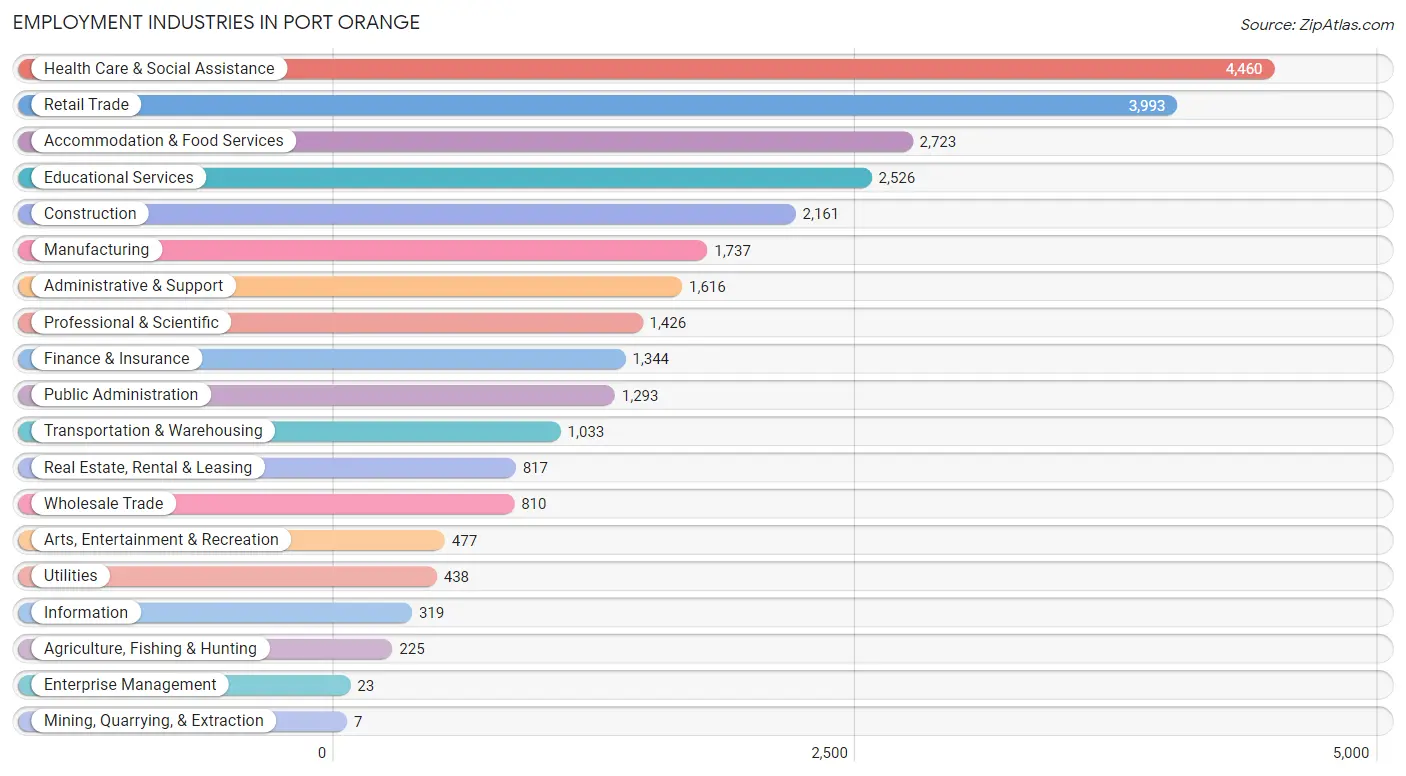
Employment Industries in Port Orange
The major employment industries in Port Orange include Health Care & Social Assistance (4,460 | 15.2%), Retail Trade (3,993 | 13.7%), Accommodation & Food Services (2,723 | 9.3%), Educational Services (2,526 | 8.6%), and Construction (2,161 | 7.4%).
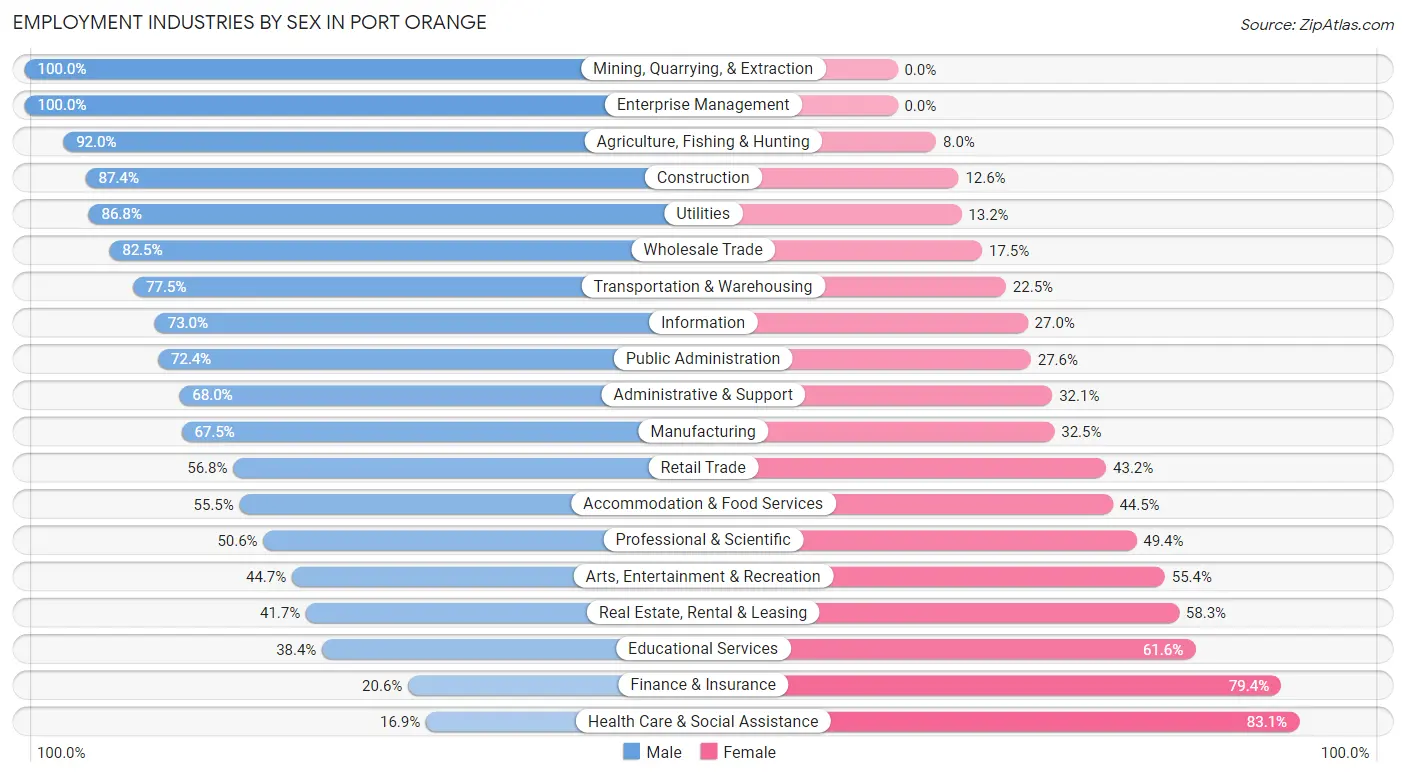
Employment Industries by Sex in Port Orange
The Port Orange industries that see more men than women are Mining, Quarrying, & Extraction (100.0%), Enterprise Management (100.0%), and Agriculture, Fishing & Hunting (92.0%), whereas the industries that tend to have a higher number of women are Health Care & Social Assistance (83.1%), Finance & Insurance (79.4%), and Educational Services (61.6%).
| Industry | Male | Female |
| Agriculture, Fishing & Hunting | 207 (92.0%) | 18 (8.0%) |
| Mining, Quarrying, & Extraction | 7 (100.0%) | 0 (0.0%) |
| Construction | 1,888 (87.4%) | 273 (12.6%) |
| Manufacturing | 1,173 (67.5%) | 564 (32.5%) |
| Wholesale Trade | 668 (82.5%) | 142 (17.5%) |
| Retail Trade | 2,268 (56.8%) | 1,725 (43.2%) |
| Transportation & Warehousing | 801 (77.5%) | 232 (22.5%) |
| Utilities | 380 (86.8%) | 58 (13.2%) |
| Information | 233 (73.0%) | 86 (27.0%) |
| Finance & Insurance | 277 (20.6%) | 1,067 (79.4%) |
| Real Estate, Rental & Leasing | 341 (41.7%) | 476 (58.3%) |
| Professional & Scientific | 721 (50.6%) | 705 (49.4%) |
| Enterprise Management | 23 (100.0%) | 0 (0.0%) |
| Administrative & Support | 1,098 (67.9%) | 518 (32.1%) |
| Educational Services | 970 (38.4%) | 1,556 (61.6%) |
| Health Care & Social Assistance | 754 (16.9%) | 3,706 (83.1%) |
| Arts, Entertainment & Recreation | 213 (44.7%) | 264 (55.3%) |
| Accommodation & Food Services | 1,511 (55.5%) | 1,212 (44.5%) |
| Public Administration | 936 (72.4%) | 357 (27.6%) |
| Total | 15,335 (52.4%) | 13,909 (47.6%) |
Education in Port Orange
School Enrollment in Port Orange
The most common levels of schooling among the 13,146 students in Port Orange are college / undergraduate (3,469 | 26.4%), high school (3,203 | 24.4%), and middle school (2,711 | 20.6%).
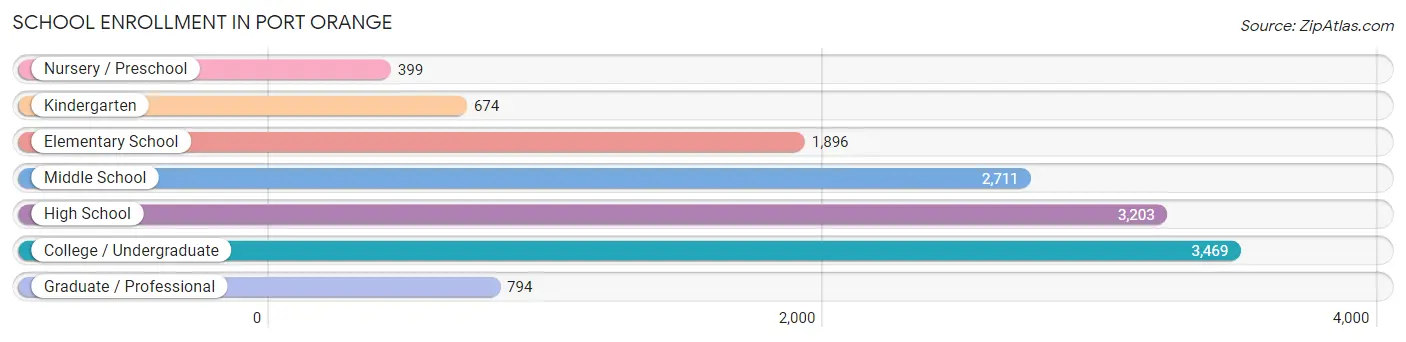
| School Level | # Students | % Students |
| Nursery / Preschool | 399 | 3.0% |
| Kindergarten | 674 | 5.1% |
| Elementary School | 1,896 | 14.4% |
| Middle School | 2,711 | 20.6% |
| High School | 3,203 | 24.4% |
| College / Undergraduate | 3,469 | 26.4% |
| Graduate / Professional | 794 | 6.0% |
| Total | 13,146 | 100.0% |
School Enrollment by Age by Funding Source in Port Orange
Out of a total of 13,146 students who are enrolled in schools in Port Orange, 3,247 (24.7%) attend a private institution, while the remaining 9,899 (75.3%) are enrolled in public schools. The age group of 3 to 4 year olds has the highest likelihood of being enrolled in private schools, with 147 (65.0% in the age bracket) enrolled. Conversely, the age group of 15 to 17 year olds has the lowest likelihood of being enrolled in a private school, with 2,101 (96.3% in the age bracket) attending a public institution.
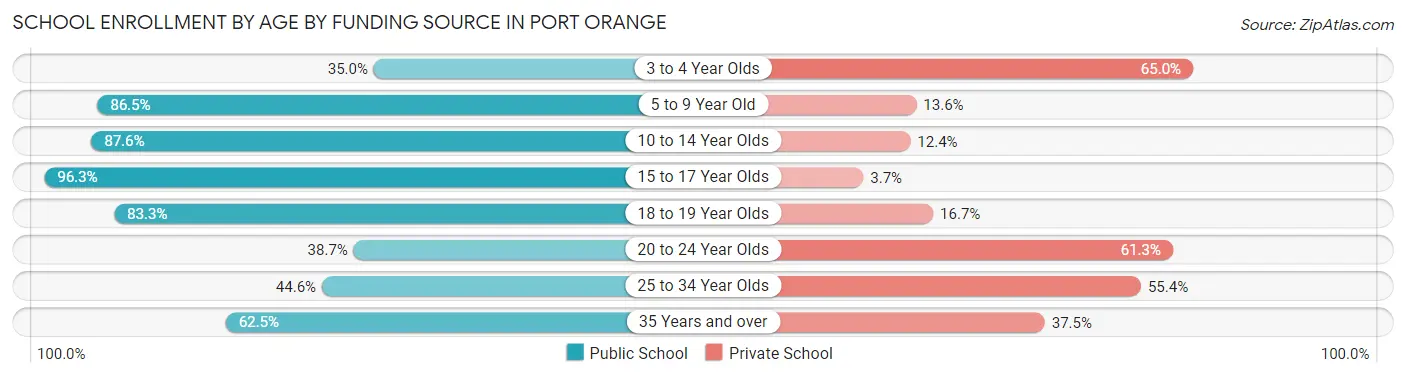
| Age Bracket | Public School | Private School |
| 3 to 4 Year Olds | 79 (35.0%) | 147 (65.0%) |
| 5 to 9 Year Old | 2,182 (86.5%) | 342 (13.6%) |
| 10 to 14 Year Olds | 2,881 (87.6%) | 409 (12.4%) |
| 15 to 17 Year Olds | 2,101 (96.3%) | 80 (3.7%) |
| 18 to 19 Year Olds | 860 (83.3%) | 172 (16.7%) |
| 20 to 24 Year Olds | 701 (38.7%) | 1,110 (61.3%) |
| 25 to 34 Year Olds | 518 (44.6%) | 643 (55.4%) |
| 35 Years and over | 576 (62.5%) | 345 (37.5%) |
| Total | 9,899 (75.3%) | 3,247 (24.7%) |
Educational Attainment by Field of Study in Port Orange
Business (4,105 | 27.9%), science & technology (1,896 | 12.9%), education (1,408 | 9.6%), arts & humanities (1,353 | 9.2%), and psychology (1,108 | 7.5%) are the most common fields of study among 14,719 individuals in Port Orange who have obtained a bachelor's degree or higher.
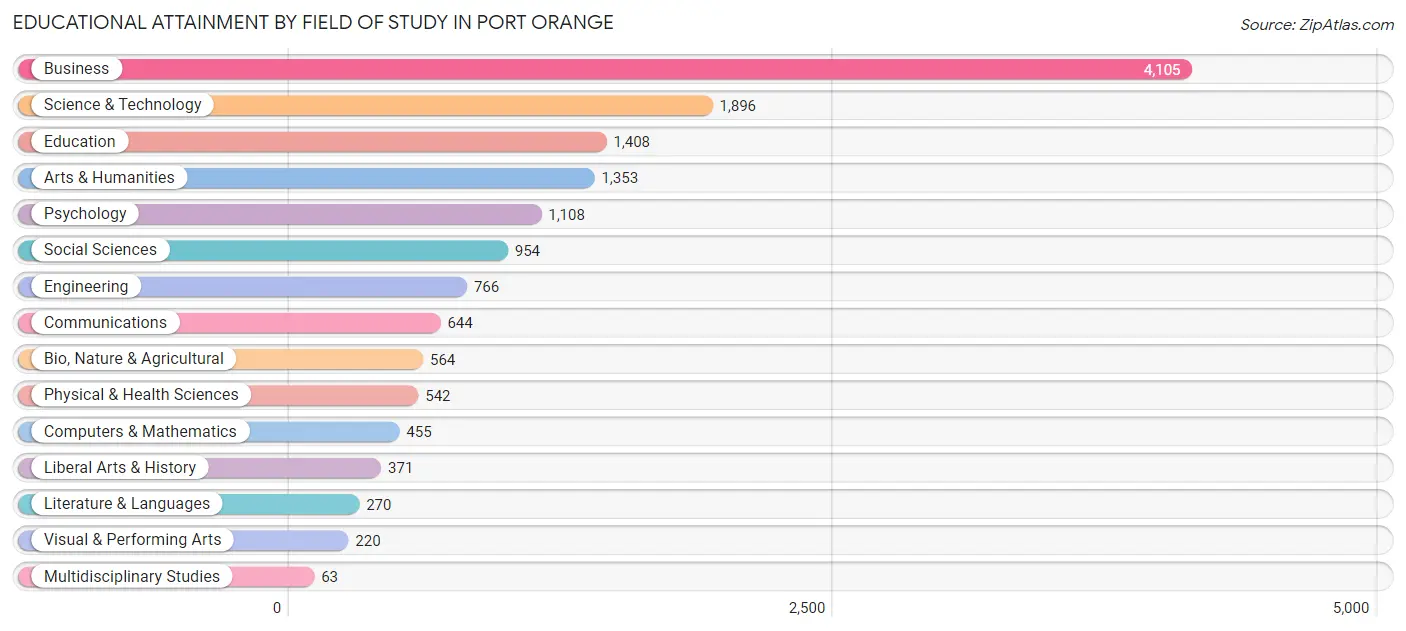
| Field of Study | # Graduates | % Graduates |
| Computers & Mathematics | 455 | 3.1% |
| Bio, Nature & Agricultural | 564 | 3.8% |
| Physical & Health Sciences | 542 | 3.7% |
| Psychology | 1,108 | 7.5% |
| Social Sciences | 954 | 6.5% |
| Engineering | 766 | 5.2% |
| Multidisciplinary Studies | 63 | 0.4% |
| Science & Technology | 1,896 | 12.9% |
| Business | 4,105 | 27.9% |
| Education | 1,408 | 9.6% |
| Literature & Languages | 270 | 1.8% |
| Liberal Arts & History | 371 | 2.5% |
| Visual & Performing Arts | 220 | 1.5% |
| Communications | 644 | 4.4% |
| Arts & Humanities | 1,353 | 9.2% |
| Total | 14,719 | 100.0% |
Transportation & Commute in Port Orange
Vehicle Availability by Sex in Port Orange
The most prevalent vehicle ownership categories in Port Orange are males with 2 vehicles (7,507, accounting for 49.4%) and females with 2 vehicles (6,760, making up 55.2%).
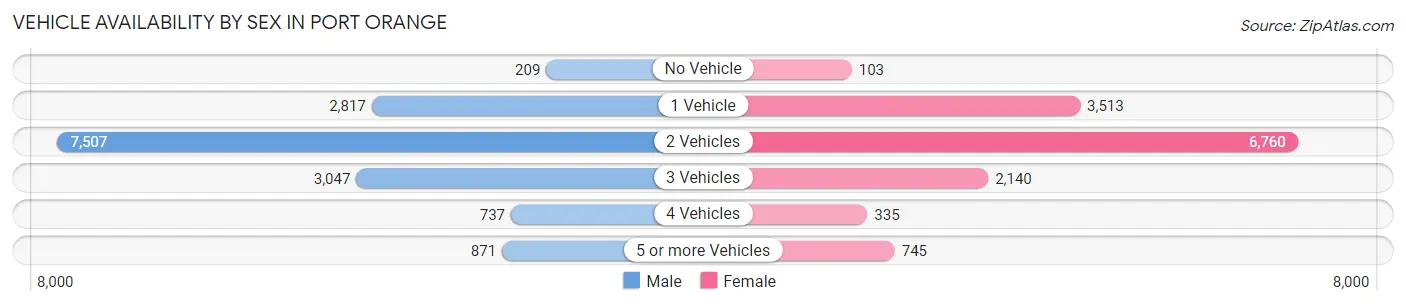
| Vehicles Available | Male | Female |
| No Vehicle | 209 (1.4%) | 103 (0.8%) |
| 1 Vehicle | 2,817 (18.5%) | 3,513 (25.8%) |
| 2 Vehicles | 7,507 (49.4%) | 6,760 (49.7%) |
| 3 Vehicles | 3,047 (20.1%) | 2,140 (15.7%) |
| 4 Vehicles | 737 (4.9%) | 335 (2.5%) |
| 5 or more Vehicles | 871 (5.7%) | 745 (5.5%) |
| Total | 15,188 (100.0%) | 13,596 (100.0%) |
Commute Time in Port Orange
The most frequently occuring commute durations in Port Orange are 15 to 19 minutes (5,255 commuters, 20.3%), 20 to 24 minutes (4,659 commuters, 18.0%), and 10 to 14 minutes (3,868 commuters, 14.9%).
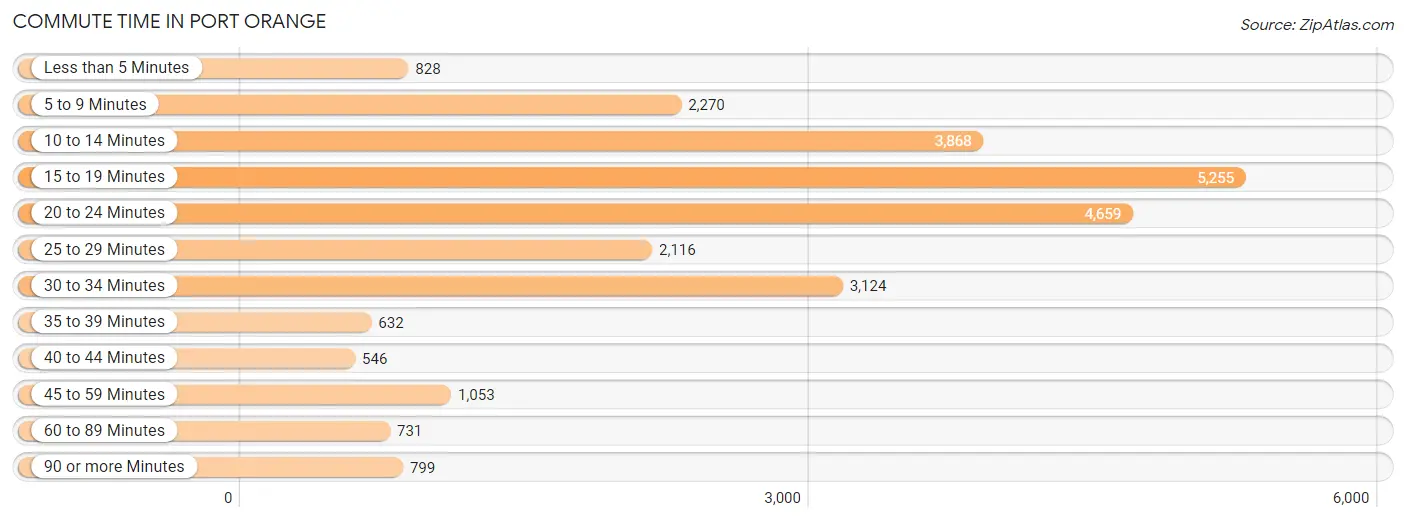
| Commute Time | # Commuters | % Commuters |
| Less than 5 Minutes | 828 | 3.2% |
| 5 to 9 Minutes | 2,270 | 8.8% |
| 10 to 14 Minutes | 3,868 | 14.9% |
| 15 to 19 Minutes | 5,255 | 20.3% |
| 20 to 24 Minutes | 4,659 | 18.0% |
| 25 to 29 Minutes | 2,116 | 8.2% |
| 30 to 34 Minutes | 3,124 | 12.1% |
| 35 to 39 Minutes | 632 | 2.4% |
| 40 to 44 Minutes | 546 | 2.1% |
| 45 to 59 Minutes | 1,053 | 4.1% |
| 60 to 89 Minutes | 731 | 2.8% |
| 90 or more Minutes | 799 | 3.1% |
Commute Time by Sex in Port Orange
The most common commute times in Port Orange are 15 to 19 minutes (2,730 commuters, 19.8%) for males and 15 to 19 minutes (2,525 commuters, 20.9%) for females.
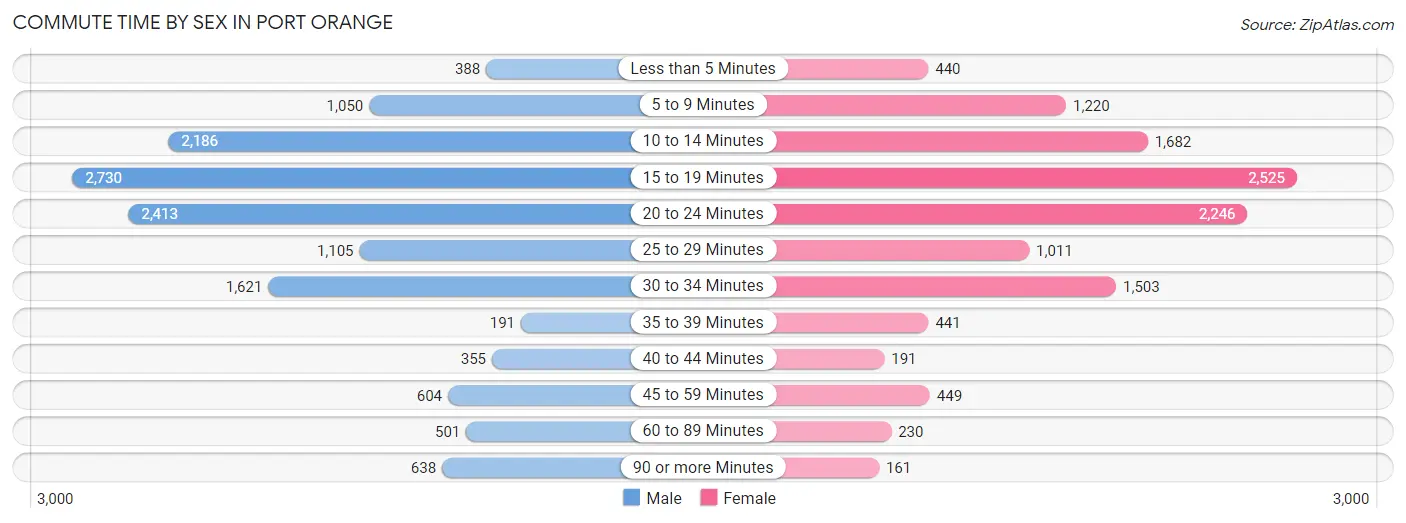
| Commute Time | Male | Female |
| Less than 5 Minutes | 388 (2.8%) | 440 (3.6%) |
| 5 to 9 Minutes | 1,050 (7.6%) | 1,220 (10.1%) |
| 10 to 14 Minutes | 2,186 (15.9%) | 1,682 (13.9%) |
| 15 to 19 Minutes | 2,730 (19.8%) | 2,525 (20.9%) |
| 20 to 24 Minutes | 2,413 (17.5%) | 2,246 (18.6%) |
| 25 to 29 Minutes | 1,105 (8.0%) | 1,011 (8.4%) |
| 30 to 34 Minutes | 1,621 (11.8%) | 1,503 (12.4%) |
| 35 to 39 Minutes | 191 (1.4%) | 441 (3.6%) |
| 40 to 44 Minutes | 355 (2.6%) | 191 (1.6%) |
| 45 to 59 Minutes | 604 (4.4%) | 449 (3.7%) |
| 60 to 89 Minutes | 501 (3.6%) | 230 (1.9%) |
| 90 or more Minutes | 638 (4.6%) | 161 (1.3%) |
Time of Departure to Work by Sex in Port Orange
The most frequent times of departure to work in Port Orange are 6:30 AM to 6:59 AM (2,071, 15.0%) for males and 7:00 AM to 7:29 AM (1,857, 15.3%) for females.
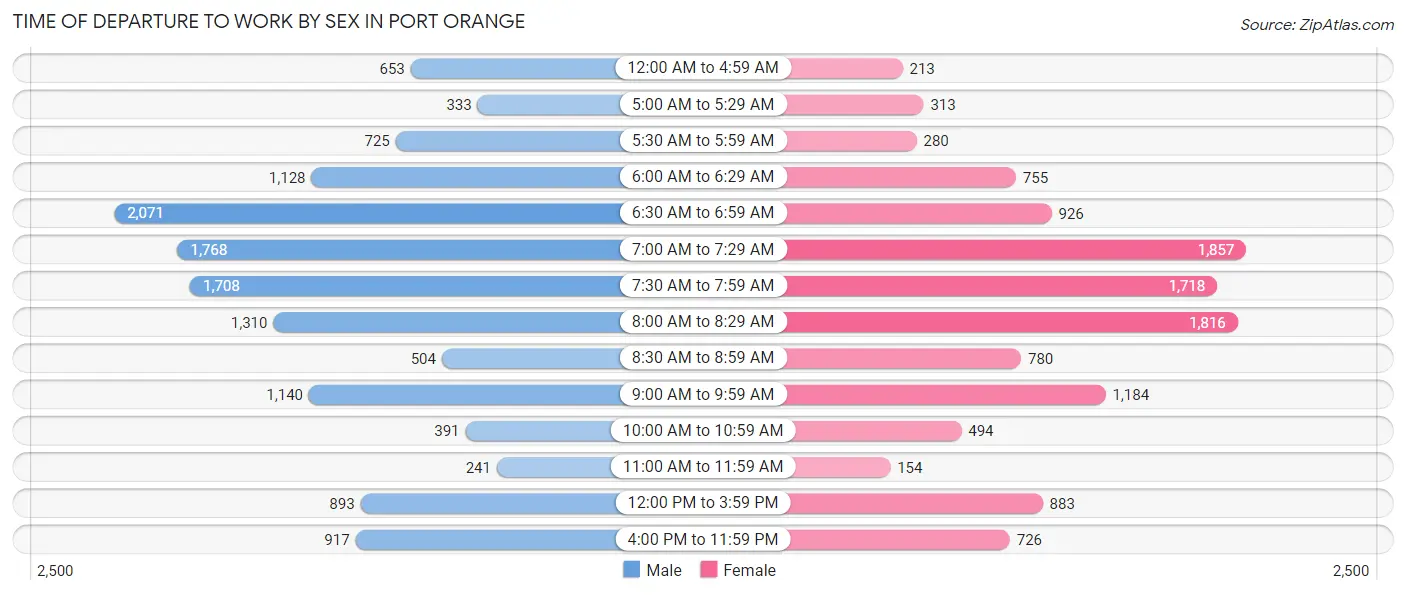
| Time of Departure | Male | Female |
| 12:00 AM to 4:59 AM | 653 (4.7%) | 213 (1.8%) |
| 5:00 AM to 5:29 AM | 333 (2.4%) | 313 (2.6%) |
| 5:30 AM to 5:59 AM | 725 (5.3%) | 280 (2.3%) |
| 6:00 AM to 6:29 AM | 1,128 (8.2%) | 755 (6.2%) |
| 6:30 AM to 6:59 AM | 2,071 (15.0%) | 926 (7.6%) |
| 7:00 AM to 7:29 AM | 1,768 (12.8%) | 1,857 (15.3%) |
| 7:30 AM to 7:59 AM | 1,708 (12.4%) | 1,718 (14.2%) |
| 8:00 AM to 8:29 AM | 1,310 (9.5%) | 1,816 (15.0%) |
| 8:30 AM to 8:59 AM | 504 (3.7%) | 780 (6.5%) |
| 9:00 AM to 9:59 AM | 1,140 (8.3%) | 1,184 (9.8%) |
| 10:00 AM to 10:59 AM | 391 (2.8%) | 494 (4.1%) |
| 11:00 AM to 11:59 AM | 241 (1.8%) | 154 (1.3%) |
| 12:00 PM to 3:59 PM | 893 (6.5%) | 883 (7.3%) |
| 4:00 PM to 11:59 PM | 917 (6.7%) | 726 (6.0%) |
| Total | 13,782 (100.0%) | 12,099 (100.0%) |
Housing Occupancy in Port Orange
Occupancy by Ownership in Port Orange
Of the total 27,857 dwellings in Port Orange, owner-occupied units account for 20,487 (73.5%), while renter-occupied units make up 7,370 (26.5%).
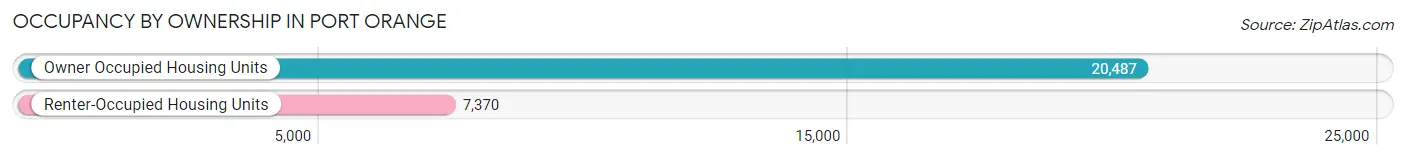
| Occupancy | # Housing Units | % Housing Units |
| Owner Occupied Housing Units | 20,487 | 73.5% |
| Renter-Occupied Housing Units | 7,370 | 26.5% |
| Total Occupied Housing Units | 27,857 | 100.0% |
Occupancy by Household Size in Port Orange
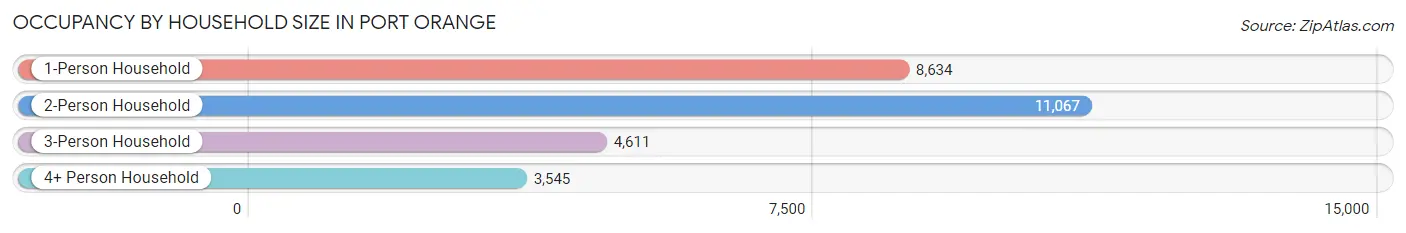
| Household Size | # Housing Units | % Housing Units |
| 1-Person Household | 8,634 | 31.0% |
| 2-Person Household | 11,067 | 39.7% |
| 3-Person Household | 4,611 | 16.6% |
| 4+ Person Household | 3,545 | 12.7% |
| Total Housing Units | 27,857 | 100.0% |
Occupancy by Ownership by Household Size in Port Orange
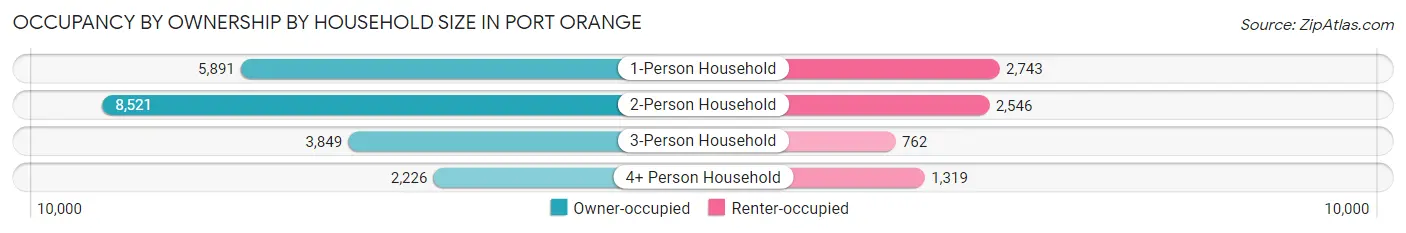
| Household Size | Owner-occupied | Renter-occupied |
| 1-Person Household | 5,891 (68.2%) | 2,743 (31.8%) |
| 2-Person Household | 8,521 (77.0%) | 2,546 (23.0%) |
| 3-Person Household | 3,849 (83.5%) | 762 (16.5%) |
| 4+ Person Household | 2,226 (62.8%) | 1,319 (37.2%) |
| Total Housing Units | 20,487 (73.5%) | 7,370 (26.5%) |
Occupancy by Educational Attainment in Port Orange
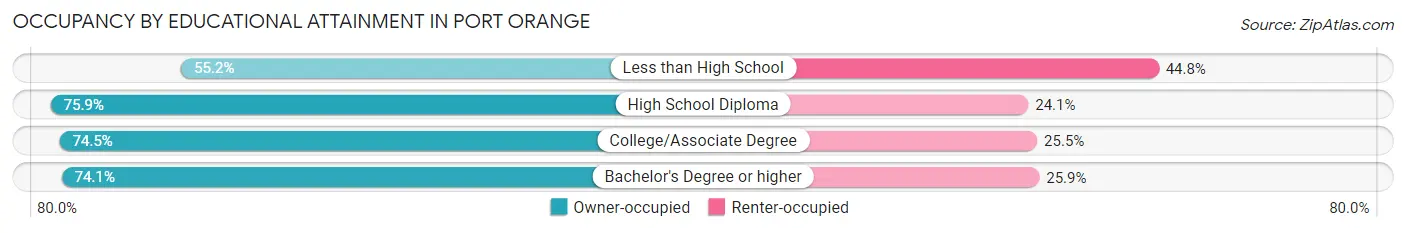
| Household Size | Owner-occupied | Renter-occupied |
| Less than High School | 930 (55.2%) | 755 (44.8%) |
| High School Diploma | 5,096 (75.9%) | 1,621 (24.1%) |
| College/Associate Degree | 8,432 (74.5%) | 2,890 (25.5%) |
| Bachelor's Degree or higher | 6,029 (74.1%) | 2,104 (25.9%) |
Occupancy by Age of Householder in Port Orange
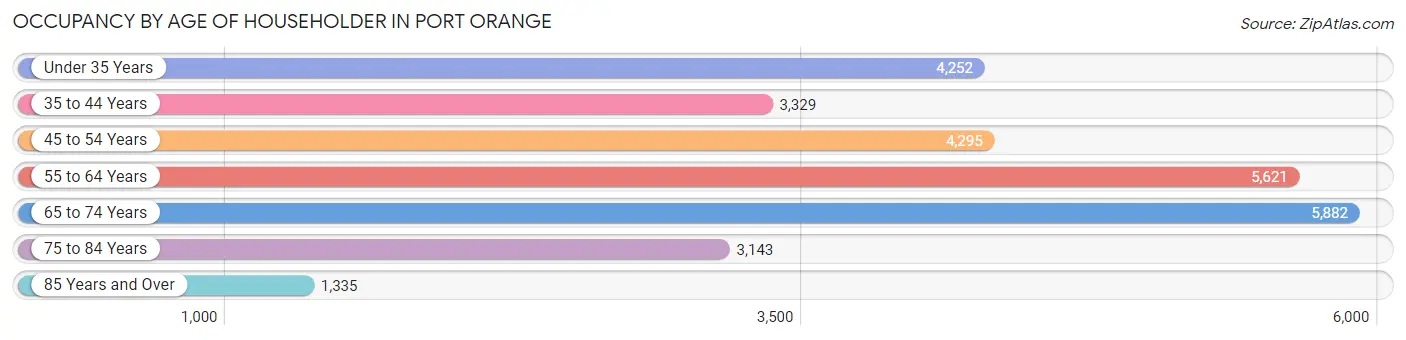
| Age Bracket | # Households | % Households |
| Under 35 Years | 4,252 | 15.3% |
| 35 to 44 Years | 3,329 | 11.9% |
| 45 to 54 Years | 4,295 | 15.4% |
| 55 to 64 Years | 5,621 | 20.2% |
| 65 to 74 Years | 5,882 | 21.1% |
| 75 to 84 Years | 3,143 | 11.3% |
| 85 Years and Over | 1,335 | 4.8% |
| Total | 27,857 | 100.0% |
Housing Finances in Port Orange
Median Income by Occupancy in Port Orange
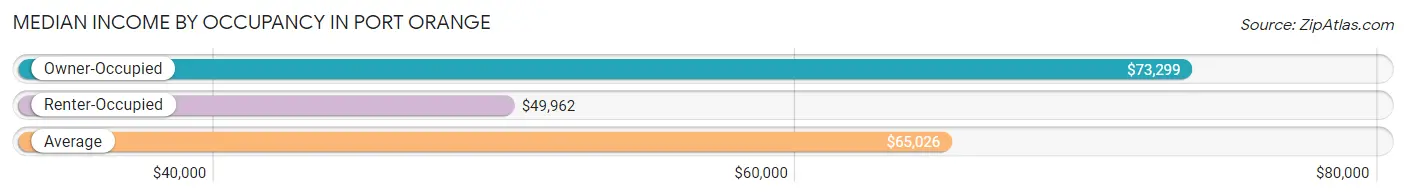
| Occupancy Type | # Households | Median Income |
| Owner-Occupied | 20,487 (73.5%) | $73,299 |
| Renter-Occupied | 7,370 (26.5%) | $49,962 |
| Average | 27,857 (100.0%) | $65,026 |
Occupancy by Householder Income Bracket in Port Orange
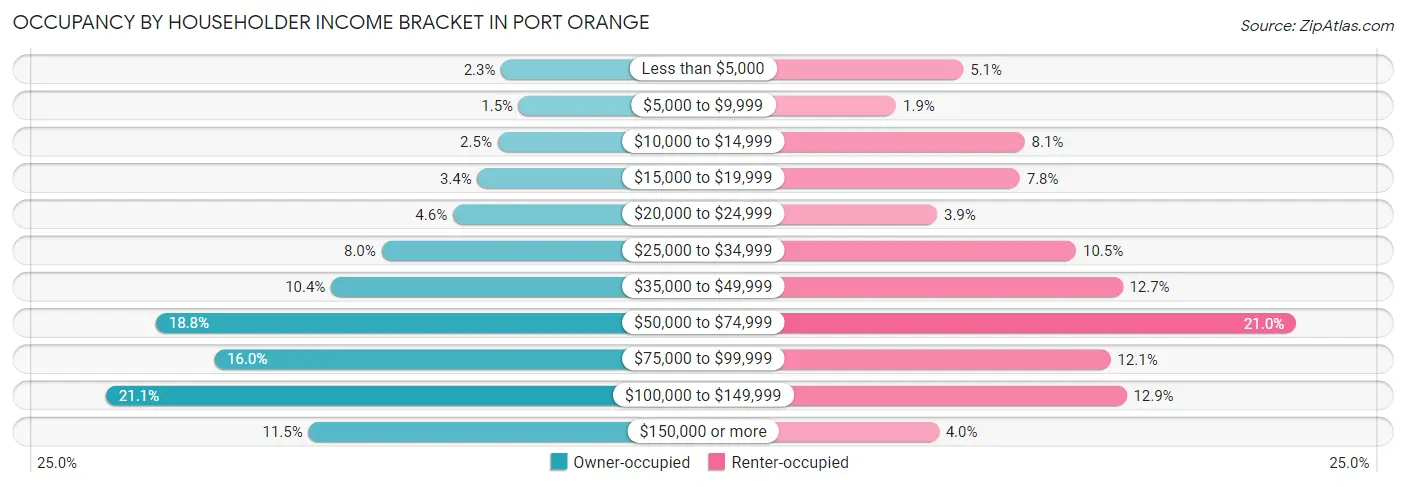
| Income Bracket | Owner-occupied | Renter-occupied |
| Less than $5,000 | 472 (2.3%) | 378 (5.1%) |
| $5,000 to $9,999 | 300 (1.5%) | 142 (1.9%) |
| $10,000 to $14,999 | 507 (2.5%) | 593 (8.1%) |
| $15,000 to $19,999 | 702 (3.4%) | 576 (7.8%) |
| $20,000 to $24,999 | 943 (4.6%) | 286 (3.9%) |
| $25,000 to $34,999 | 1,638 (8.0%) | 774 (10.5%) |
| $35,000 to $49,999 | 2,131 (10.4%) | 937 (12.7%) |
| $50,000 to $74,999 | 3,841 (18.8%) | 1,546 (21.0%) |
| $75,000 to $99,999 | 3,274 (16.0%) | 895 (12.1%) |
| $100,000 to $149,999 | 4,328 (21.1%) | 951 (12.9%) |
| $150,000 or more | 2,351 (11.5%) | 292 (4.0%) |
| Total | 20,487 (100.0%) | 7,370 (100.0%) |
Monthly Housing Cost Tiers in Port Orange
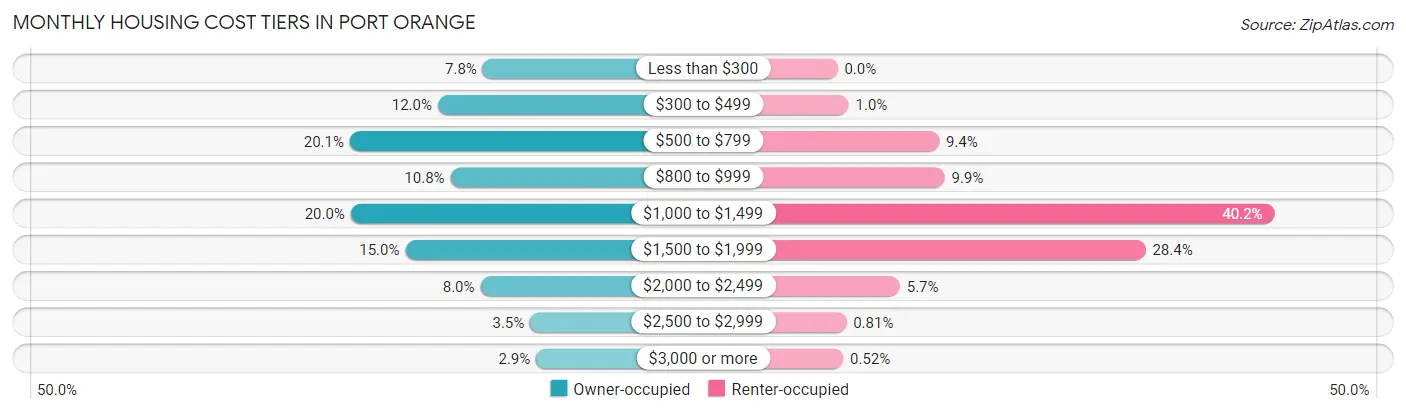
| Monthly Cost | Owner-occupied | Renter-occupied |
| Less than $300 | 1,605 (7.8%) | 0 (0.0%) |
| $300 to $499 | 2,451 (12.0%) | 76 (1.0%) |
| $500 to $799 | 4,110 (20.1%) | 689 (9.3%) |
| $800 to $999 | 2,212 (10.8%) | 727 (9.9%) |
| $1,000 to $1,499 | 4,093 (20.0%) | 2,965 (40.2%) |
| $1,500 to $1,999 | 3,063 (14.9%) | 2,090 (28.4%) |
| $2,000 to $2,499 | 1,648 (8.0%) | 423 (5.7%) |
| $2,500 to $2,999 | 708 (3.5%) | 60 (0.8%) |
| $3,000 or more | 597 (2.9%) | 38 (0.5%) |
| Total | 20,487 (100.0%) | 7,370 (100.0%) |
Physical Housing Characteristics in Port Orange
Housing Structures in Port Orange
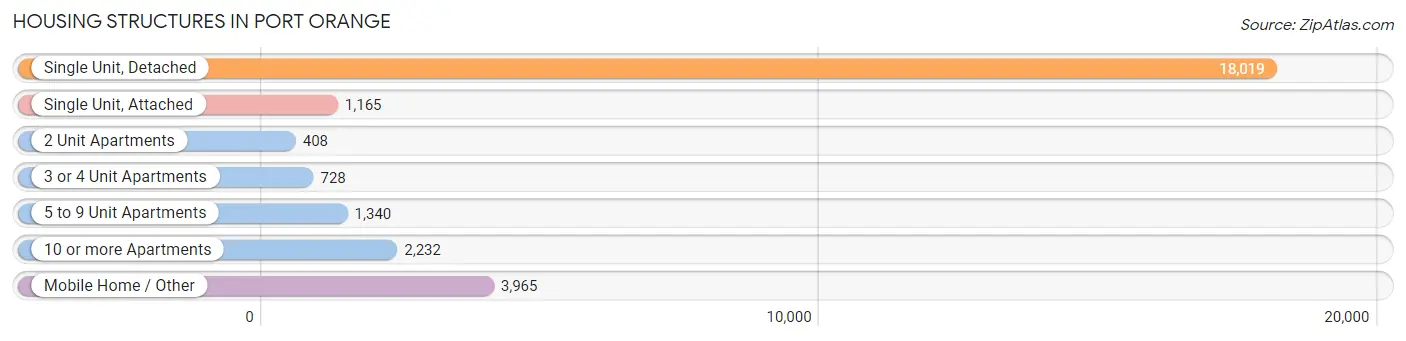
| Structure Type | # Housing Units | % Housing Units |
| Single Unit, Detached | 18,019 | 64.7% |
| Single Unit, Attached | 1,165 | 4.2% |
| 2 Unit Apartments | 408 | 1.5% |
| 3 or 4 Unit Apartments | 728 | 2.6% |
| 5 to 9 Unit Apartments | 1,340 | 4.8% |
| 10 or more Apartments | 2,232 | 8.0% |
| Mobile Home / Other | 3,965 | 14.2% |
| Total | 27,857 | 100.0% |
Housing Structures by Occupancy in Port Orange
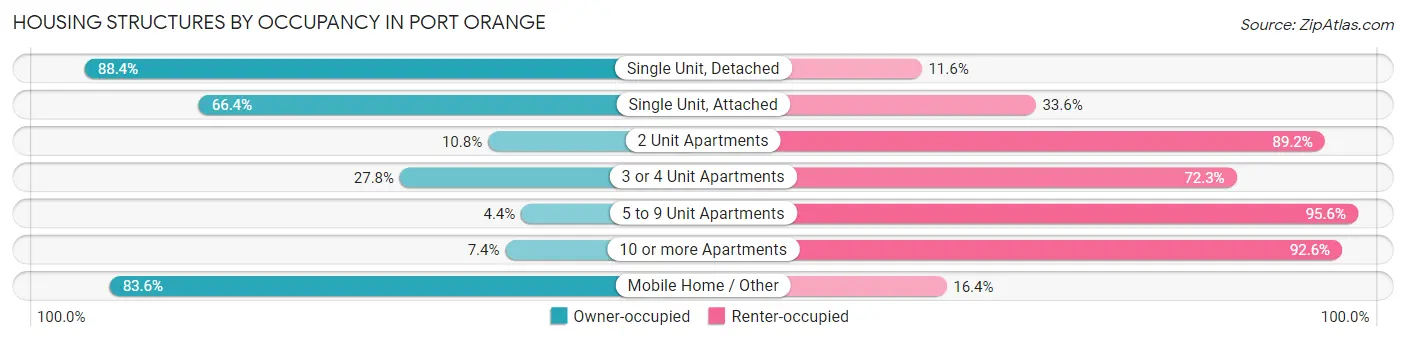
| Structure Type | Owner-occupied | Renter-occupied |
| Single Unit, Detached | 15,927 (88.4%) | 2,092 (11.6%) |
| Single Unit, Attached | 774 (66.4%) | 391 (33.6%) |
| 2 Unit Apartments | 44 (10.8%) | 364 (89.2%) |
| 3 or 4 Unit Apartments | 202 (27.8%) | 526 (72.3%) |
| 5 to 9 Unit Apartments | 59 (4.4%) | 1,281 (95.6%) |
| 10 or more Apartments | 166 (7.4%) | 2,066 (92.6%) |
| Mobile Home / Other | 3,315 (83.6%) | 650 (16.4%) |
| Total | 20,487 (73.5%) | 7,370 (26.5%) |
Housing Structures by Number of Rooms in Port Orange
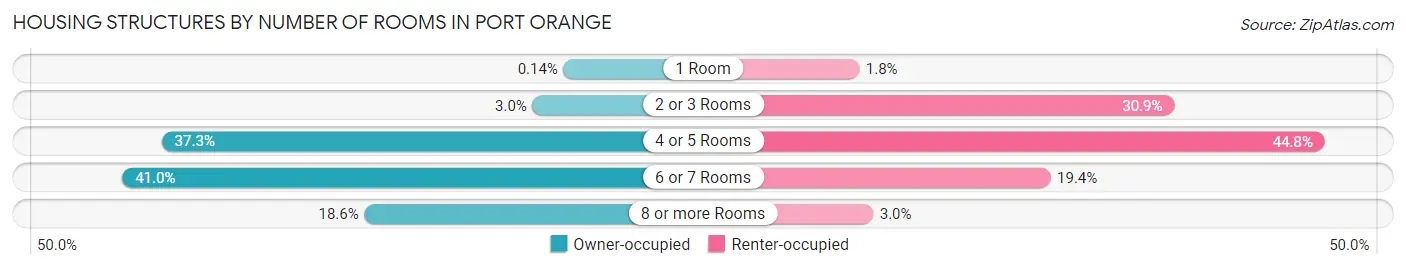
| Number of Rooms | Owner-occupied | Renter-occupied |
| 1 Room | 28 (0.1%) | 129 (1.8%) |
| 2 or 3 Rooms | 616 (3.0%) | 2,279 (30.9%) |
| 4 or 5 Rooms | 7,646 (37.3%) | 3,305 (44.8%) |
| 6 or 7 Rooms | 8,394 (41.0%) | 1,433 (19.4%) |
| 8 or more Rooms | 3,803 (18.6%) | 224 (3.0%) |
| Total | 20,487 (100.0%) | 7,370 (100.0%) |
Housing Structure by Heating Type in Port Orange
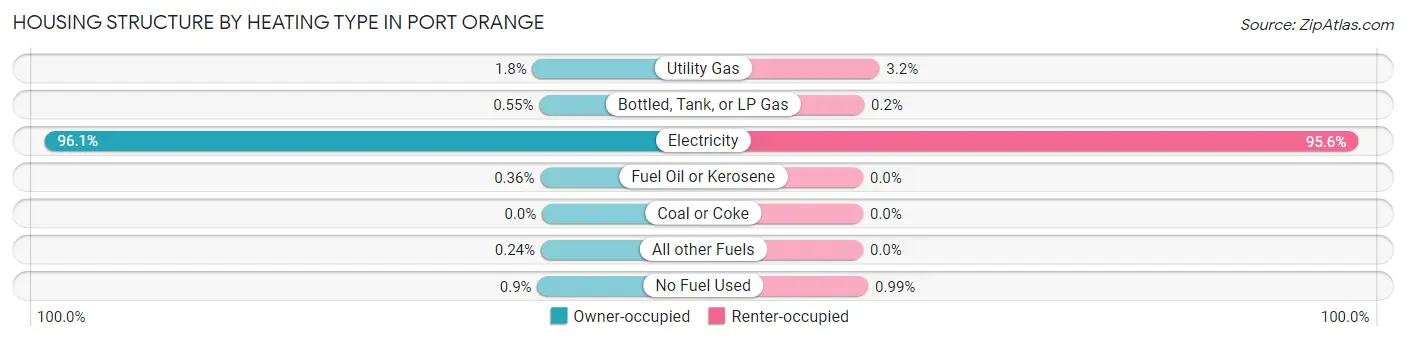
| Heating Type | Owner-occupied | Renter-occupied |
| Utility Gas | 375 (1.8%) | 233 (3.2%) |
| Bottled, Tank, or LP Gas | 112 (0.5%) | 15 (0.2%) |
| Electricity | 19,693 (96.1%) | 7,049 (95.6%) |
| Fuel Oil or Kerosene | 74 (0.4%) | 0 (0.0%) |
| Coal or Coke | 0 (0.0%) | 0 (0.0%) |
| All other Fuels | 49 (0.2%) | 0 (0.0%) |
| No Fuel Used | 184 (0.9%) | 73 (1.0%) |
| Total | 20,487 (100.0%) | 7,370 (100.0%) |
Household Vehicle Usage in Port Orange
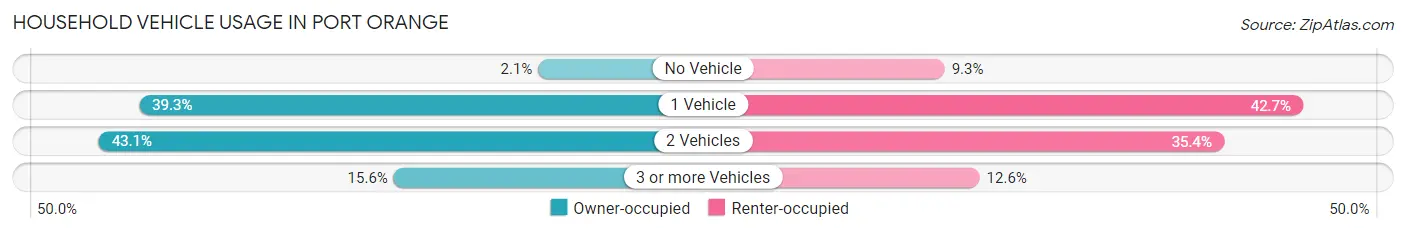
| Vehicles per Household | Owner-occupied | Renter-occupied |
| No Vehicle | 423 (2.1%) | 687 (9.3%) |
| 1 Vehicle | 8,053 (39.3%) | 3,150 (42.7%) |
| 2 Vehicles | 8,825 (43.1%) | 2,606 (35.4%) |
| 3 or more Vehicles | 3,186 (15.5%) | 927 (12.6%) |
| Total | 20,487 (100.0%) | 7,370 (100.0%) |
Real Estate & Mortgages in Port Orange
Real Estate and Mortgage Overview in Port Orange
| Characteristic | Without Mortgage | With Mortgage |
| Housing Units | 9,861 | 10,626 |
| Median Property Value | $221,700 | $286,700 |
| Median Household Income | $57,619 | $1,693 |
| Monthly Housing Costs | $561 | $540 |
| Real Estate Taxes | $1,946 | $308 |
Property Value by Mortgage Status in Port Orange
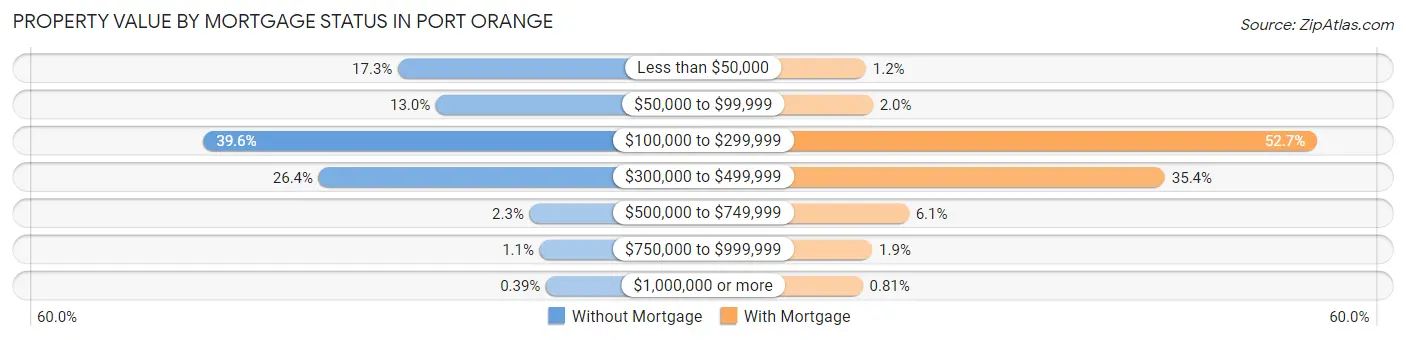
| Property Value | Without Mortgage | With Mortgage |
| Less than $50,000 | 1,707 (17.3%) | 125 (1.2%) |
| $50,000 to $99,999 | 1,280 (13.0%) | 208 (2.0%) |
| $100,000 to $299,999 | 3,902 (39.6%) | 5,603 (52.7%) |
| $300,000 to $499,999 | 2,600 (26.4%) | 3,756 (35.3%) |
| $500,000 to $749,999 | 224 (2.3%) | 646 (6.1%) |
| $750,000 to $999,999 | 110 (1.1%) | 202 (1.9%) |
| $1,000,000 or more | 38 (0.4%) | 86 (0.8%) |
| Total | 9,861 (100.0%) | 10,626 (100.0%) |
Household Income by Mortgage Status in Port Orange
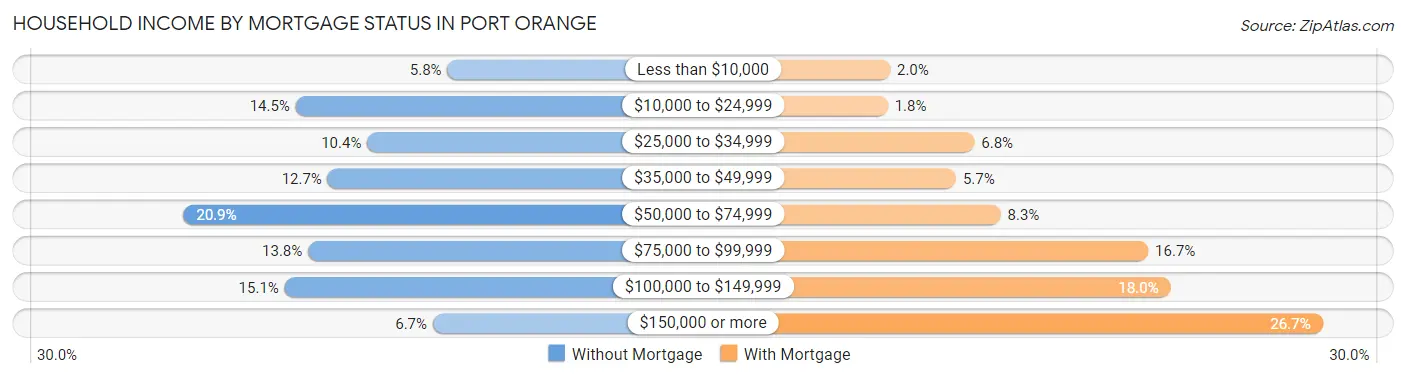
| Household Income | Without Mortgage | With Mortgage |
| Less than $10,000 | 576 (5.8%) | 209 (2.0%) |
| $10,000 to $24,999 | 1,431 (14.5%) | 196 (1.8%) |
| $25,000 to $34,999 | 1,028 (10.4%) | 721 (6.8%) |
| $35,000 to $49,999 | 1,250 (12.7%) | 610 (5.7%) |
| $50,000 to $74,999 | 2,064 (20.9%) | 881 (8.3%) |
| $75,000 to $99,999 | 1,361 (13.8%) | 1,777 (16.7%) |
| $100,000 to $149,999 | 1,493 (15.1%) | 1,913 (18.0%) |
| $150,000 or more | 658 (6.7%) | 2,835 (26.7%) |
| Total | 9,861 (100.0%) | 10,626 (100.0%) |
Property Value to Household Income Ratio in Port Orange
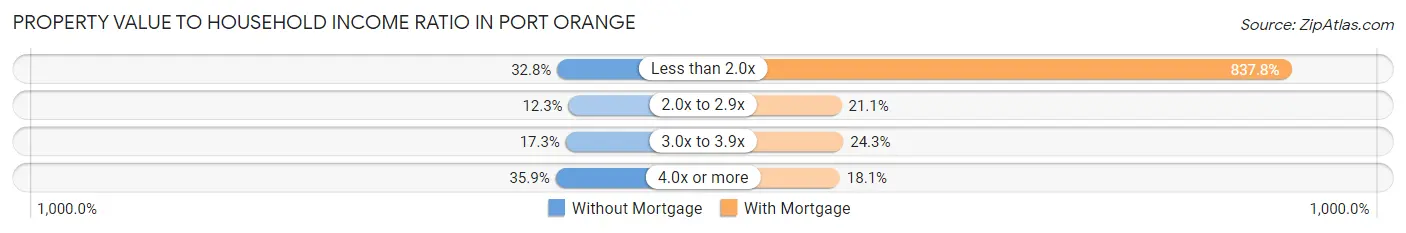
| Value-to-Income Ratio | Without Mortgage | With Mortgage |
| Less than 2.0x | 3,229 (32.8%) | 89,019 (837.7%) |
| 2.0x to 2.9x | 1,211 (12.3%) | 2,239 (21.1%) |
| 3.0x to 3.9x | 1,706 (17.3%) | 2,578 (24.3%) |
| 4.0x or more | 3,539 (35.9%) | 1,928 (18.1%) |
| Total | 9,861 (100.0%) | 10,626 (100.0%) |
Real Estate Taxes by Mortgage Status in Port Orange
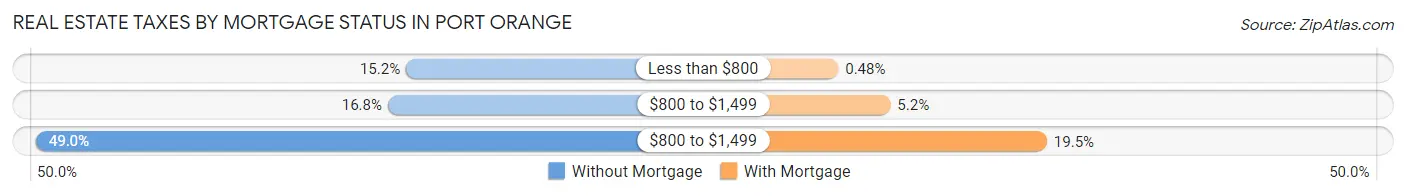
| Property Taxes | Without Mortgage | With Mortgage |
| Less than $800 | 1,496 (15.2%) | 51 (0.5%) |
| $800 to $1,499 | 1,660 (16.8%) | 557 (5.2%) |
| $800 to $1,499 | 4,829 (49.0%) | 2,075 (19.5%) |
| Total | 9,861 (100.0%) | 10,626 (100.0%) |
Health & Disability in Port Orange
Health Insurance Coverage by Age in Port Orange
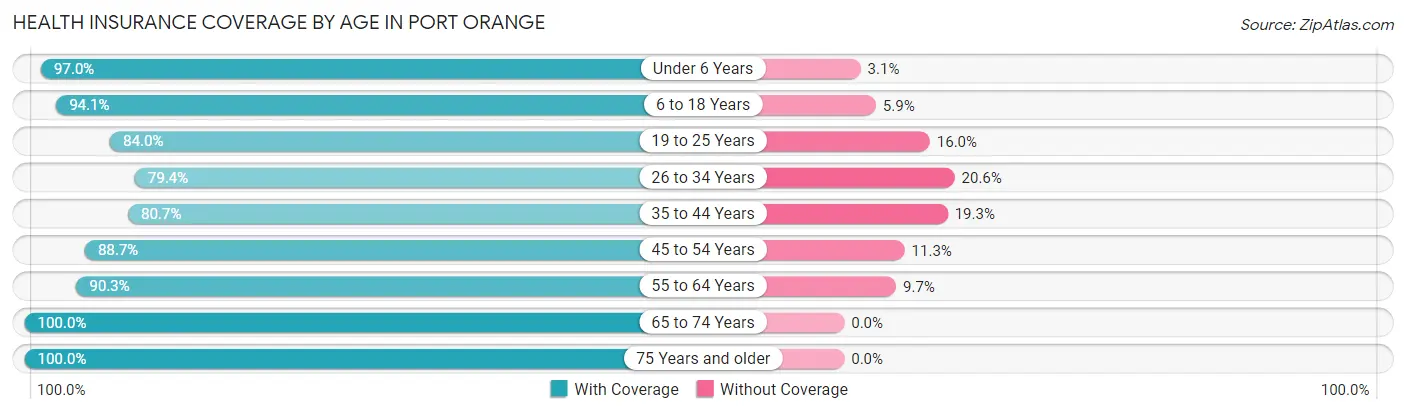
| Age Bracket | With Coverage | Without Coverage |
| Under 6 Years | 2,927 (97.0%) | 92 (3.0%) |
| 6 to 18 Years | 8,070 (94.1%) | 506 (5.9%) |
| 19 to 25 Years | 4,398 (84.0%) | 835 (16.0%) |
| 26 to 34 Years | 5,279 (79.4%) | 1,367 (20.6%) |
| 35 to 44 Years | 5,208 (80.7%) | 1,245 (19.3%) |
| 45 to 54 Years | 6,873 (88.7%) | 872 (11.3%) |
| 55 to 64 Years | 8,531 (90.3%) | 912 (9.7%) |
| 65 to 74 Years | 9,017 (100.0%) | 0 (0.0%) |
| 75 Years and older | 6,526 (100.0%) | 0 (0.0%) |
| Total | 56,829 (90.7%) | 5,829 (9.3%) |
Health Insurance Coverage by Citizenship Status in Port Orange
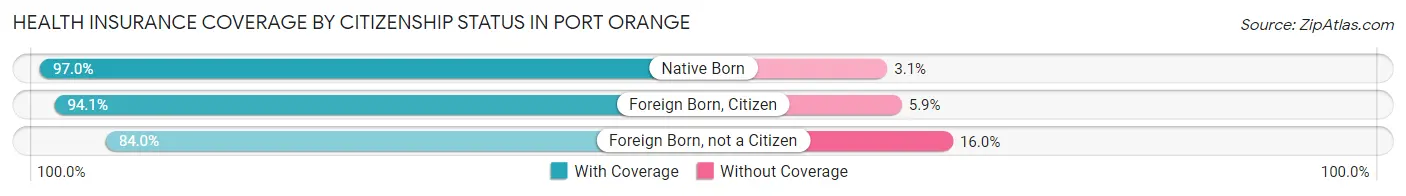
| Citizenship Status | With Coverage | Without Coverage |
| Native Born | 2,927 (97.0%) | 92 (3.0%) |
| Foreign Born, Citizen | 8,070 (94.1%) | 506 (5.9%) |
| Foreign Born, not a Citizen | 4,398 (84.0%) | 835 (16.0%) |
Health Insurance Coverage by Household Income in Port Orange
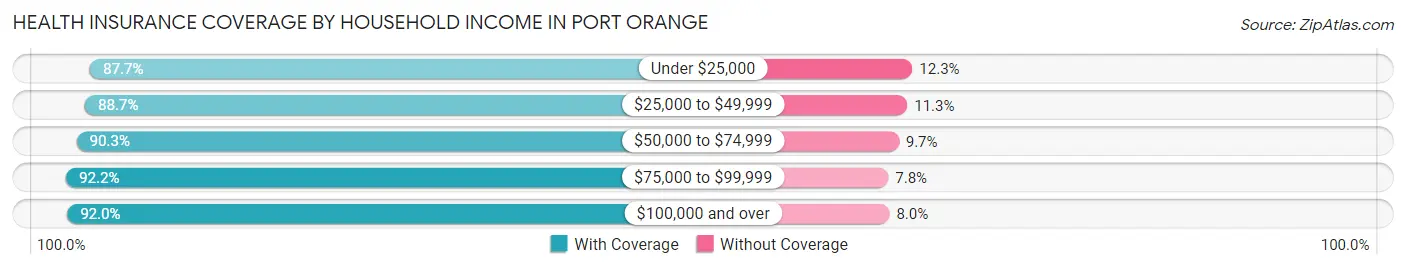
| Household Income | With Coverage | Without Coverage |
| Under $25,000 | 6,166 (87.7%) | 864 (12.3%) |
| $25,000 to $49,999 | 8,538 (88.7%) | 1,091 (11.3%) |
| $50,000 to $74,999 | 10,690 (90.3%) | 1,154 (9.7%) |
| $75,000 to $99,999 | 10,401 (92.2%) | 879 (7.8%) |
| $100,000 and over | 20,982 (92.0%) | 1,822 (8.0%) |
Public vs Private Health Insurance Coverage by Age in Port Orange
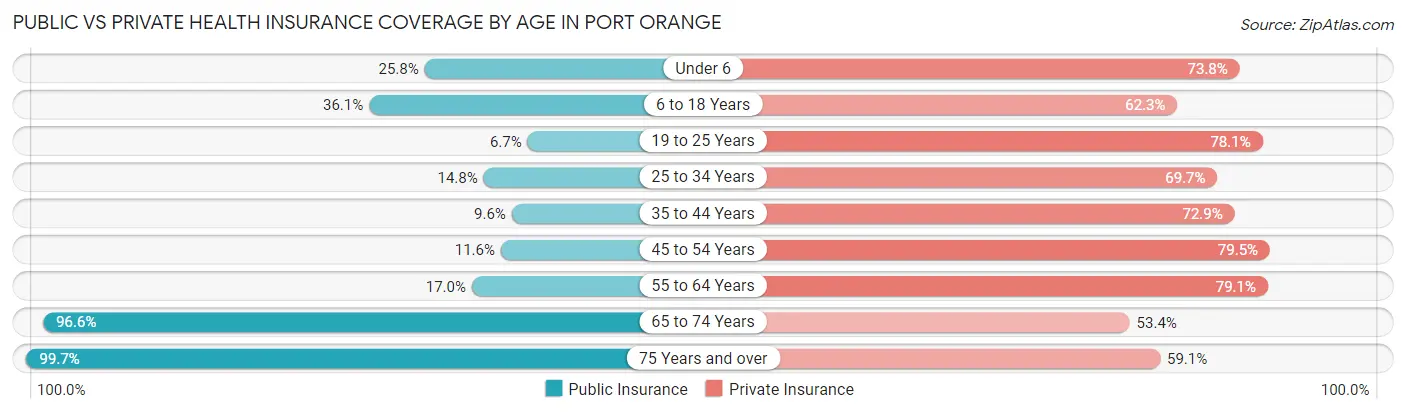
| Age Bracket | Public Insurance | Private Insurance |
| Under 6 | 778 (25.8%) | 2,229 (73.8%) |
| 6 to 18 Years | 3,093 (36.1%) | 5,340 (62.3%) |
| 19 to 25 Years | 348 (6.7%) | 4,086 (78.1%) |
| 25 to 34 Years | 985 (14.8%) | 4,632 (69.7%) |
| 35 to 44 Years | 619 (9.6%) | 4,704 (72.9%) |
| 45 to 54 Years | 899 (11.6%) | 6,154 (79.5%) |
| 55 to 64 Years | 1,605 (17.0%) | 7,466 (79.1%) |
| 65 to 74 Years | 8,709 (96.6%) | 4,818 (53.4%) |
| 75 Years and over | 6,504 (99.7%) | 3,855 (59.1%) |
| Total | 23,540 (37.6%) | 43,284 (69.1%) |
Disability Status by Sex by Age in Port Orange
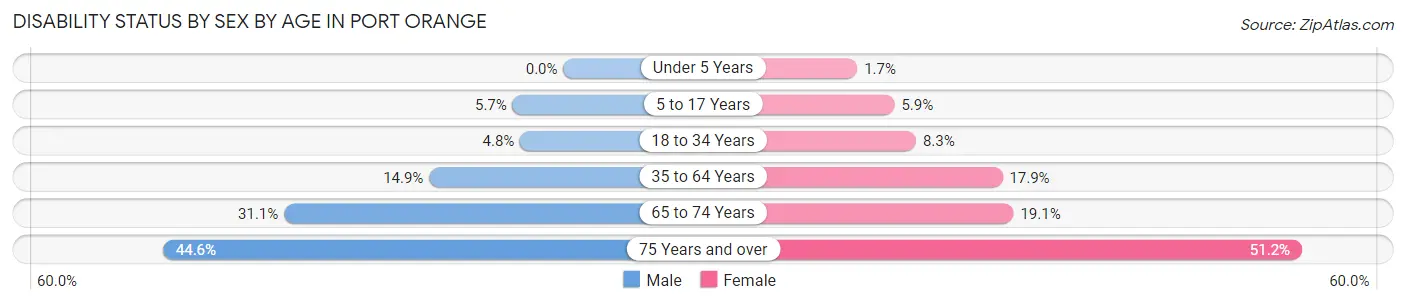
| Age Bracket | Male | Female |
| Under 5 Years | 0 (0.0%) | 18 (1.7%) |
| 5 to 17 Years | 213 (5.7%) | 273 (5.9%) |
| 18 to 34 Years | 332 (4.8%) | 479 (8.3%) |
| 35 to 64 Years | 1,695 (14.9%) | 2,200 (17.9%) |
| 65 to 74 Years | 1,311 (31.1%) | 918 (19.1%) |
| 75 Years and over | 1,329 (44.6%) | 1,817 (51.2%) |
Disability Class by Sex by Age in Port Orange
Disability Class: Hearing Difficulty
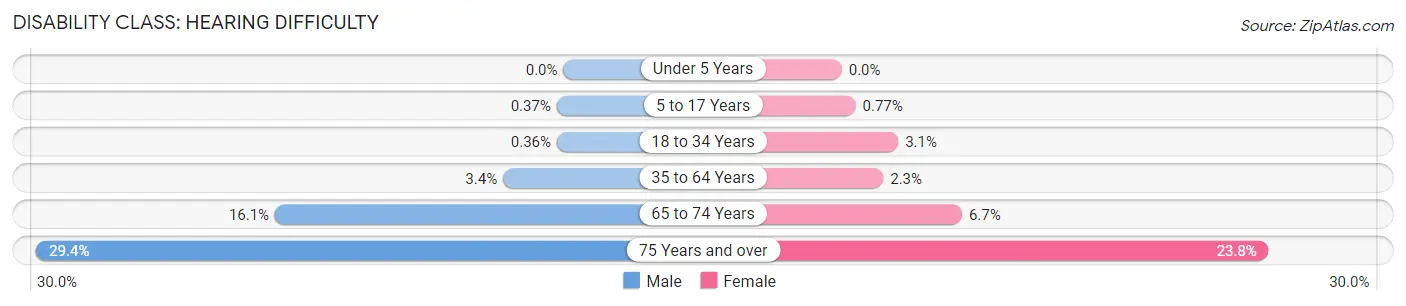
| Age Bracket | Male | Female |
| Under 5 Years | 0 (0.0%) | 0 (0.0%) |
| 5 to 17 Years | 14 (0.4%) | 36 (0.8%) |
| 18 to 34 Years | 25 (0.4%) | 182 (3.1%) |
| 35 to 64 Years | 381 (3.4%) | 284 (2.3%) |
| 65 to 74 Years | 677 (16.1%) | 321 (6.7%) |
| 75 Years and over | 875 (29.4%) | 843 (23.8%) |
Disability Class: Vision Difficulty
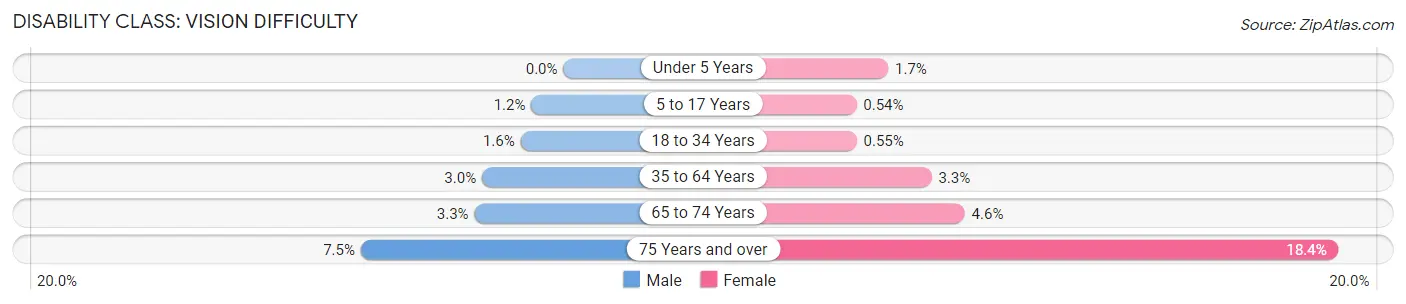
| Age Bracket | Male | Female |
| Under 5 Years | 0 (0.0%) | 18 (1.7%) |
| 5 to 17 Years | 45 (1.2%) | 25 (0.5%) |
| 18 to 34 Years | 110 (1.6%) | 32 (0.5%) |
| 35 to 64 Years | 343 (3.0%) | 410 (3.3%) |
| 65 to 74 Years | 139 (3.3%) | 219 (4.6%) |
| 75 Years and over | 224 (7.5%) | 654 (18.4%) |
Disability Class: Cognitive Difficulty
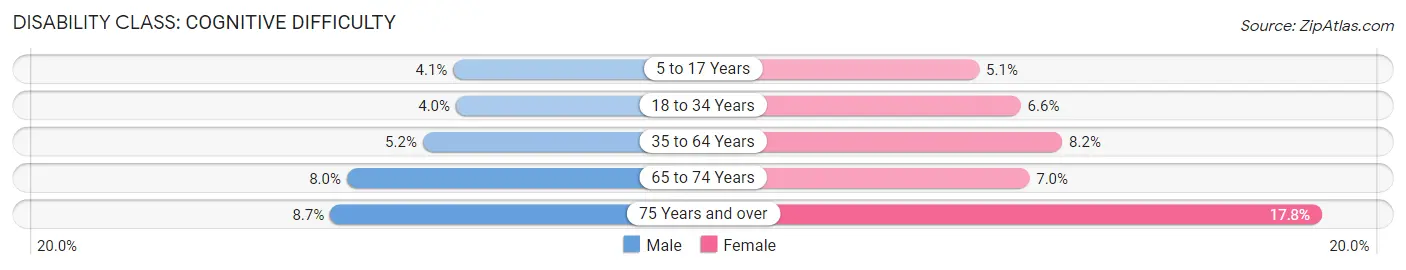
| Age Bracket | Male | Female |
| 5 to 17 Years | 154 (4.1%) | 237 (5.1%) |
| 18 to 34 Years | 275 (4.0%) | 385 (6.6%) |
| 35 to 64 Years | 592 (5.2%) | 1,006 (8.2%) |
| 65 to 74 Years | 339 (8.0%) | 334 (7.0%) |
| 75 Years and over | 258 (8.7%) | 632 (17.8%) |
Disability Class: Ambulatory Difficulty
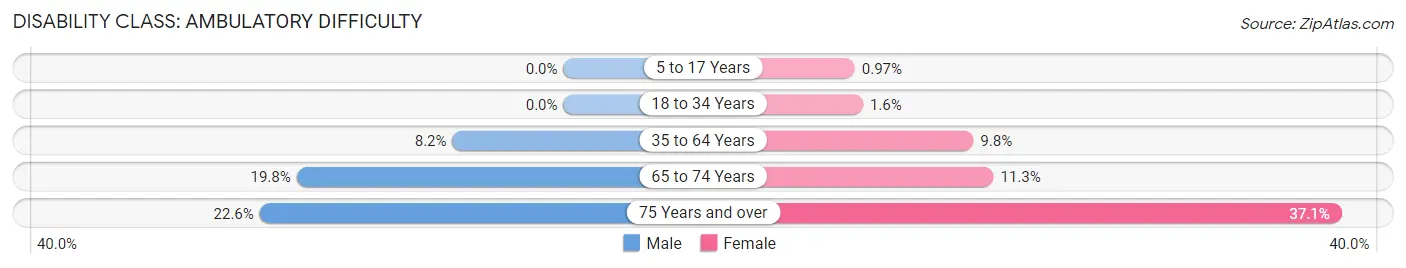
| Age Bracket | Male | Female |
| 5 to 17 Years | 0 (0.0%) | 45 (1.0%) |
| 18 to 34 Years | 0 (0.0%) | 91 (1.6%) |
| 35 to 64 Years | 935 (8.2%) | 1,201 (9.8%) |
| 65 to 74 Years | 835 (19.8%) | 541 (11.3%) |
| 75 Years and over | 672 (22.6%) | 1,316 (37.1%) |
Disability Class: Self-Care Difficulty
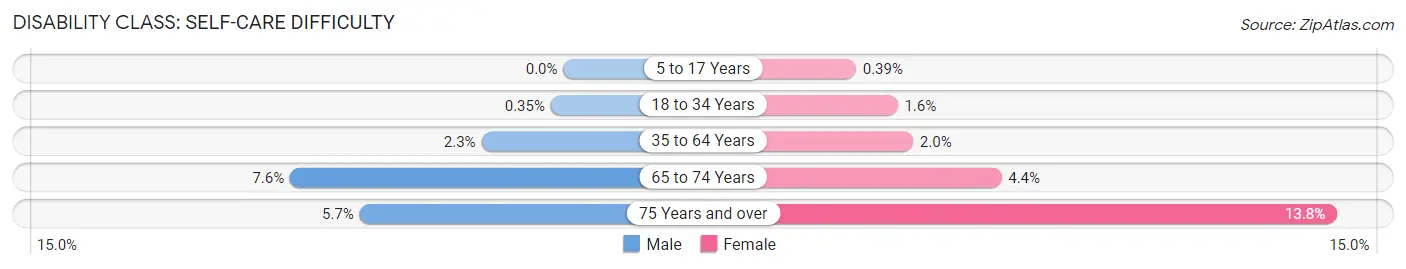
| Age Bracket | Male | Female |
| 5 to 17 Years | 0 (0.0%) | 18 (0.4%) |
| 18 to 34 Years | 24 (0.4%) | 90 (1.5%) |
| 35 to 64 Years | 259 (2.3%) | 243 (2.0%) |
| 65 to 74 Years | 321 (7.6%) | 213 (4.4%) |
| 75 Years and over | 169 (5.7%) | 489 (13.8%) |
Technology Access in Port Orange
Computing Device Access in Port Orange
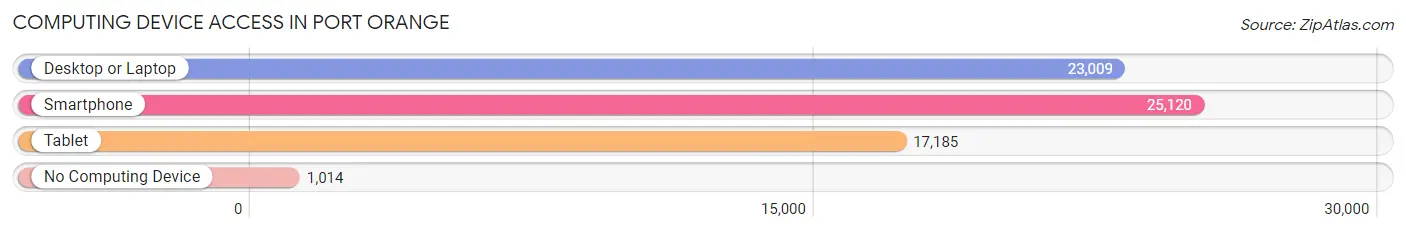
| Device Type | # Households | % Households |
| Desktop or Laptop | 23,009 | 82.6% |
| Smartphone | 25,120 | 90.2% |
| Tablet | 17,185 | 61.7% |
| No Computing Device | 1,014 | 3.6% |
| Total | 27,857 | 100.0% |
Internet Access in Port Orange
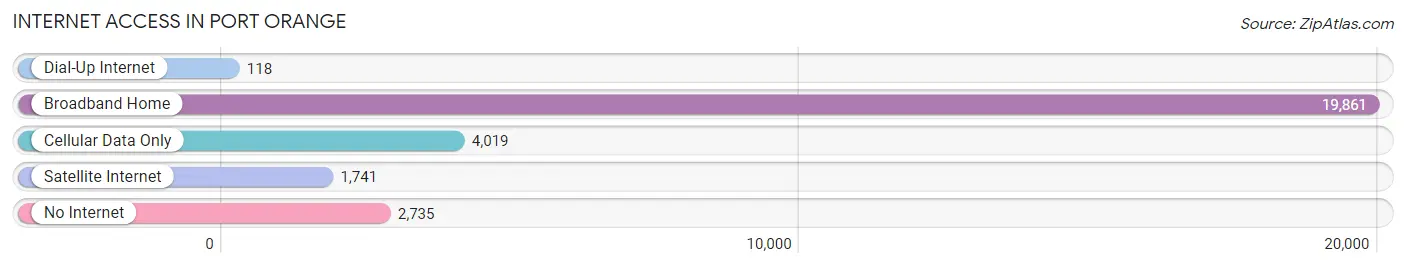
| Internet Type | # Households | % Households |
| Dial-Up Internet | 118 | 0.4% |
| Broadband Home | 19,861 | 71.3% |
| Cellular Data Only | 4,019 | 14.4% |
| Satellite Internet | 1,741 | 6.2% |
| No Internet | 2,735 | 9.8% |
| Total | 27,857 | 100.0% |
Port Orange Summary
History
Port Orange is a city located in Volusia County, Florida. It is situated on the Halifax River, just south of Daytona Beach. The city was founded in 1867 by John Milton Hawks, who named it after the orange groves that grew in the area. The city was incorporated in 1867 and has grown to a population of over 57,000 people.
Port Orange has a rich history that dates back to the early 1800s. The area was originally inhabited by the Timucuan Indians, who were later displaced by the Spanish. The Spanish established a mission in the area in the late 1700s, and the area was later settled by the British. The British established a trading post in the area in the early 1800s, and the area was later settled by the Americans.
The city of Port Orange was founded in 1867 by John Milton Hawks. Hawks was a former Confederate soldier who had served in the Civil War. He named the city after the orange groves that grew in the area. The city was incorporated in 1867 and has grown to a population of over 57,000 people.
Geography
Port Orange is located in Volusia County, Florida. It is situated on the Halifax River, just south of Daytona Beach. The city covers an area of approximately 24 square miles and is bordered by the cities of Daytona Beach, Ormond Beach, and New Smyrna Beach. The city is located in the Central Florida region and is part of the Deltona-Daytona Beach-Ormond Beach metropolitan area.
The city has a humid subtropical climate, with hot, humid summers and mild winters. The average temperature in the summer is around 90 degrees Fahrenheit, and the average temperature in the winter is around 60 degrees Fahrenheit. The city receives an average of 54 inches of rain per year.
Economy
Port Orange is a major economic center in the Central Florida region. The city is home to a variety of businesses, including retail stores, restaurants, and professional services. The city is also home to several large employers, including the Halifax Health Medical Center, the Volusia County School District, and the City of Port Orange.
The city is also home to several major industries, including aerospace, manufacturing, and tourism. The city is home to several major tourist attractions, including the Daytona International Speedway, the Daytona Beach Boardwalk, and the Ponce de Leon Inlet Lighthouse.
Demographics
As of the 2010 census, the population of Port Orange was 57,203. The racial makeup of the city was 79.2% White, 11.3% African American, 0.4% Native American, 2.2% Asian, 0.1% Pacific Islander, 4.2% from other races, and 2.7% from two or more races. Hispanic or Latino of any race were 11.3% of the population.
The median income for a household in the city was $45,945, and the median income for a family was $54,945. The per capita income for the city was $25,945. About 8.7% of families and 11.2% of the population were below the poverty line, including 15.2% of those under age 18 and 6.2% of those age 65 or over.
Common Questions
What is Per Capita Income in Port Orange?
Per Capita income in Port Orange is $35,528.
What is the Median Family Income in Port Orange?
Median Family Income in Port Orange is $84,851.
What is the Median Household income in Port Orange?
Median Household Income in Port Orange is $65,026.
What is Income or Wage Gap in Port Orange?
Income or Wage Gap in Port Orange is 25.4%.
Women in Port Orange earn 74.6 cents for every dollar earned by a man.
What is Family Income Deficit in Port Orange?
Family Income Deficit in Port Orange is $6,904.
Families that are below poverty line in Port Orange earn $6,904 less on average than the poverty threshold level.
What is Inequality or Gini Index in Port Orange?
Inequality or Gini Index in Port Orange is 0.40.
What is the Total Population of Port Orange?
Total Population of Port Orange is 62,849.
What is the Total Male Population of Port Orange?
Total Male Population of Port Orange is 30,590.
What is the Total Female Population of Port Orange?
Total Female Population of Port Orange is 32,259.
What is the Ratio of Males per 100 Females in Port Orange?
There are 94.83 Males per 100 Females in Port Orange.
What is the Ratio of Females per 100 Males in Port Orange?
There are 105.46 Females per 100 Males in Port Orange.
What is the Median Population Age in Port Orange?
Median Population Age in Port Orange is 46.5 Years.
What is the Average Family Size in Port Orange
Average Family Size in Port Orange is 2.8 People.
What is the Average Household Size in Port Orange
Average Household Size in Port Orange is 2.2 People.
How Large is the Labor Force in Port Orange?
There are 30,450 People in the Labor Forcein in Port Orange.
What is the Percentage of People in the Labor Force in Port Orange?
56.7% of People are in the Labor Force in Port Orange.
What is the Unemployment Rate in Port Orange?
Unemployment Rate in Port Orange is 3.9%.