South Bend, IN Map & Demographics
South Bend Map
South Bend Overview
$28,071
PER CAPITA INCOME
$61,974
AVG FAMILY INCOME
$49,056
AVG HOUSEHOLD INCOME
27.4%
WAGE / INCOME GAP [ % ]
72.6¢/ $1
WAGE / INCOME GAP [ $ ]
$11,956
FAMILY INCOME DEFICIT
0.49
INEQUALITY / GINI INDEX
103,084
TOTAL POPULATION
49,028
MALE POPULATION
54,056
FEMALE POPULATION
90.70
MALES / 100 FEMALES
110.26
FEMALES / 100 MALES
33.4
MEDIAN AGE
3.3
AVG FAMILY SIZE
2.5
AVG HOUSEHOLD SIZE
49,384
LABOR FORCE [ PEOPLE ]
63.1%
PERCENT IN LABOR FORCE
5.5%
UNEMPLOYMENT RATE
South Bend Area Codes
Income in South Bend
Income Overview in South Bend
Per Capita Income in South Bend is $28,071, while median incomes of families and households are $61,974 and $49,056 respectively.
| Characteristic | Number | Measure |
| Per Capita Income | 103,084 | $28,071 |
| Median Family Income | 22,358 | $61,974 |
| Mean Family Income | 22,358 | $79,875 |
| Median Household Income | 40,559 | $49,056 |
| Mean Household Income | 40,559 | $69,487 |
| Income Deficit | 22,358 | $11,956 |
| Wage / Income Gap (%) | 103,084 | 27.37% |
| Wage / Income Gap ($) | 103,084 | 72.63¢ per $1 |
| Gini / Inequality Index | 103,084 | 0.49 |
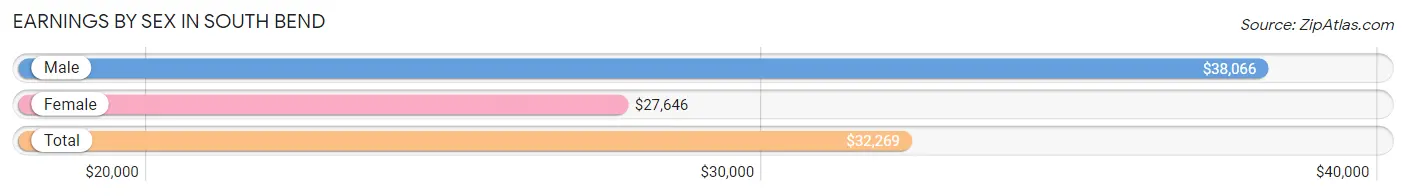
Earnings by Sex in South Bend
Average Earnings in South Bend are $32,269, $38,066 for men and $27,646 for women, a difference of 27.4%.
| Sex | Number | Average Earnings |
| Male | 26,200 (49.4%) | $38,066 |
| Female | 26,816 (50.6%) | $27,646 |
| Total | 53,016 (100.0%) | $32,269 |
Earnings by Sex by Income Bracket in South Bend
The most common earnings brackets in South Bend are $55,000 to $64,999 for men (2,313 | 8.8%) and $2,499 or less for women (2,152 | 8.0%).
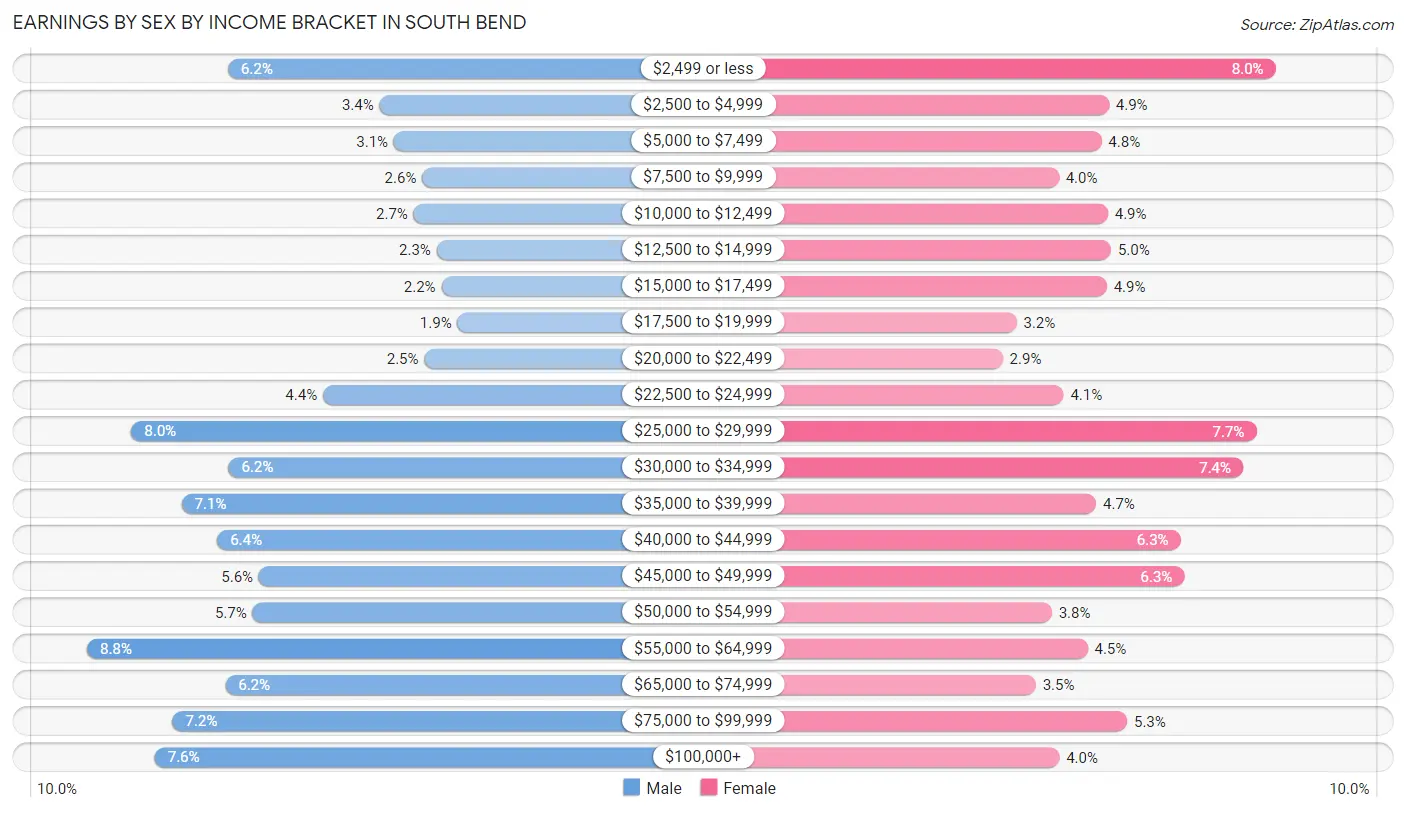
| Income | Male | Female |
| $2,499 or less | 1,621 (6.2%) | 2,152 (8.0%) |
| $2,500 to $4,999 | 878 (3.4%) | 1,317 (4.9%) |
| $5,000 to $7,499 | 808 (3.1%) | 1,279 (4.8%) |
| $7,500 to $9,999 | 667 (2.5%) | 1,064 (4.0%) |
| $10,000 to $12,499 | 710 (2.7%) | 1,312 (4.9%) |
| $12,500 to $14,999 | 597 (2.3%) | 1,327 (5.0%) |
| $15,000 to $17,499 | 575 (2.2%) | 1,307 (4.9%) |
| $17,500 to $19,999 | 496 (1.9%) | 854 (3.2%) |
| $20,000 to $22,499 | 657 (2.5%) | 782 (2.9%) |
| $22,500 to $24,999 | 1,155 (4.4%) | 1,089 (4.1%) |
| $25,000 to $29,999 | 2,097 (8.0%) | 2,057 (7.7%) |
| $30,000 to $34,999 | 1,619 (6.2%) | 1,991 (7.4%) |
| $35,000 to $39,999 | 1,849 (7.1%) | 1,253 (4.7%) |
| $40,000 to $44,999 | 1,673 (6.4%) | 1,676 (6.2%) |
| $45,000 to $49,999 | 1,471 (5.6%) | 1,694 (6.3%) |
| $50,000 to $54,999 | 1,502 (5.7%) | 1,029 (3.8%) |
| $55,000 to $64,999 | 2,313 (8.8%) | 1,210 (4.5%) |
| $65,000 to $74,999 | 1,635 (6.2%) | 948 (3.5%) |
| $75,000 to $99,999 | 1,895 (7.2%) | 1,407 (5.2%) |
| $100,000+ | 1,982 (7.6%) | 1,068 (4.0%) |
| Total | 26,200 (100.0%) | 26,816 (100.0%) |
Earnings by Sex by Educational Attainment in South Bend
Average earnings in South Bend are $42,930 for men and $31,779 for women, a difference of 26.0%. Men with an educational attainment of graduate degree enjoy the highest average annual earnings of $74,675, while those with less than high school education earn the least with $29,531. Women with an educational attainment of graduate degree earn the most with the average annual earnings of $53,743, while those with less than high school education have the smallest earnings of $19,974.
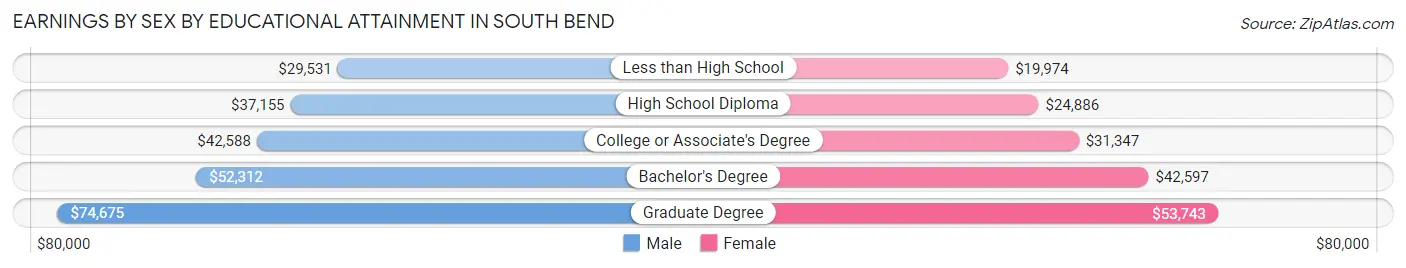
| Educational Attainment | Male Income | Female Income |
| Less than High School | $29,531 | $19,974 |
| High School Diploma | $37,155 | $24,886 |
| College or Associate's Degree | $42,588 | $31,347 |
| Bachelor's Degree | $52,312 | $42,597 |
| Graduate Degree | $74,675 | $53,743 |
| Total | $42,930 | $31,779 |
Family Income in South Bend
Family Income Brackets in South Bend
According to the South Bend family income data, there are 3,980 families falling into the $50,000 to $74,999 income range, which is the most common income bracket and makes up 17.8% of all families. Conversely, the $10,000 to $14,999 income bracket is the least frequent group with only 939 families (4.2%) belonging to this category.
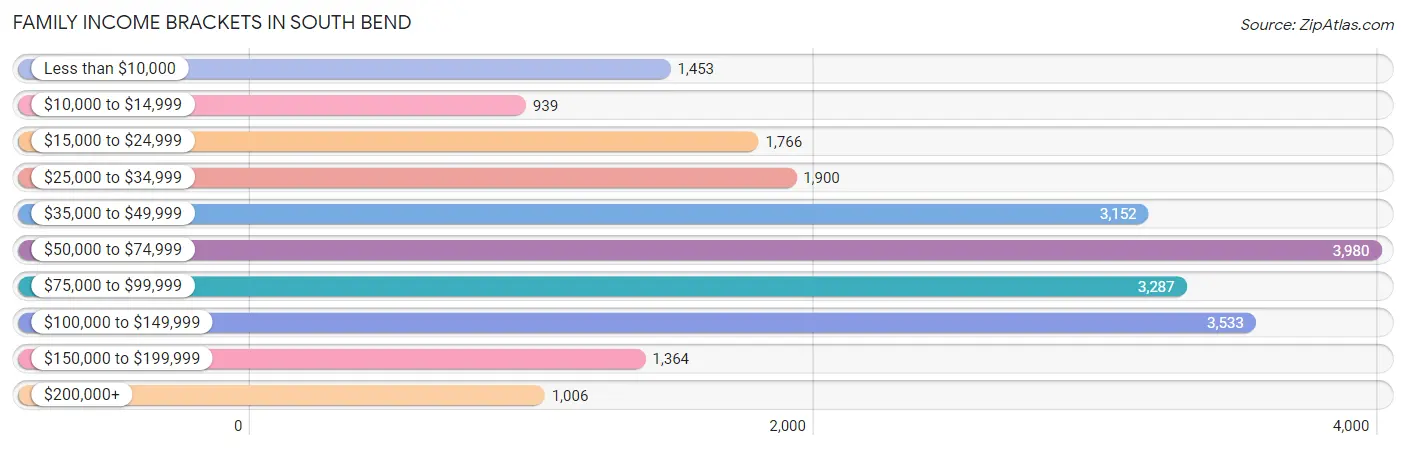
| Income Bracket | # Families | % Families |
| Less than $10,000 | 1,453 | 6.5% |
| $10,000 to $14,999 | 939 | 4.2% |
| $15,000 to $24,999 | 1,766 | 7.9% |
| $25,000 to $34,999 | 1,900 | 8.5% |
| $35,000 to $49,999 | 3,152 | 14.1% |
| $50,000 to $74,999 | 3,980 | 17.8% |
| $75,000 to $99,999 | 3,287 | 14.7% |
| $100,000 to $149,999 | 3,533 | 15.8% |
| $150,000 to $199,999 | 1,364 | 6.1% |
| $200,000+ | 1,006 | 4.5% |
Family Income by Famaliy Size in South Bend
7+ person families (554 | 2.5%) account for the highest median family income in South Bend with $73,375 per family, while 2-person families (10,704 | 47.9%) have the highest median income of $29,363 per family member.
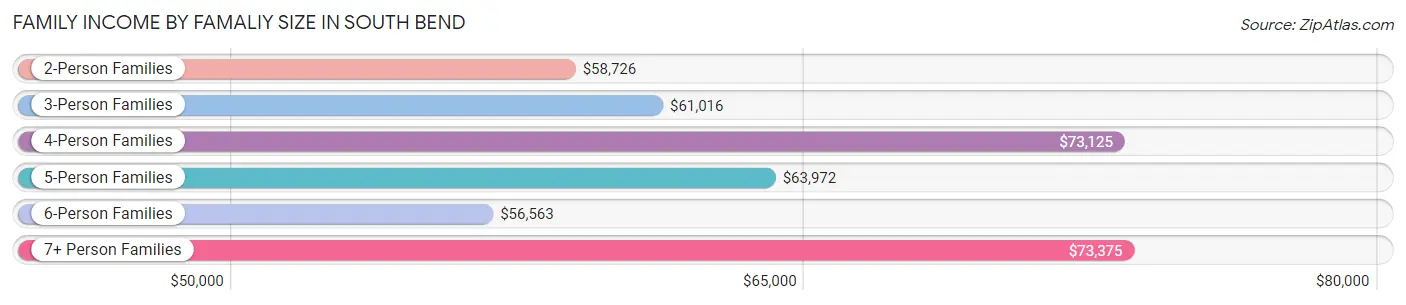
| Income Bracket | # Families | Median Income |
| 2-Person Families | 10,704 (47.9%) | $58,726 |
| 3-Person Families | 4,745 (21.2%) | $61,016 |
| 4-Person Families | 3,846 (17.2%) | $73,125 |
| 5-Person Families | 1,715 (7.7%) | $63,972 |
| 6-Person Families | 794 (3.5%) | $56,563 |
| 7+ Person Families | 554 (2.5%) | $73,375 |
| Total | 22,358 (100.0%) | $61,974 |
Family Income by Number of Earners in South Bend
The median family income in South Bend is $61,974, with families comprising 3+ earners (1,777) having the highest median family income of $110,750, while families with no earners (2,870) have the lowest median family income of $33,438, accounting for 8.0% and 12.8% of families, respectively.
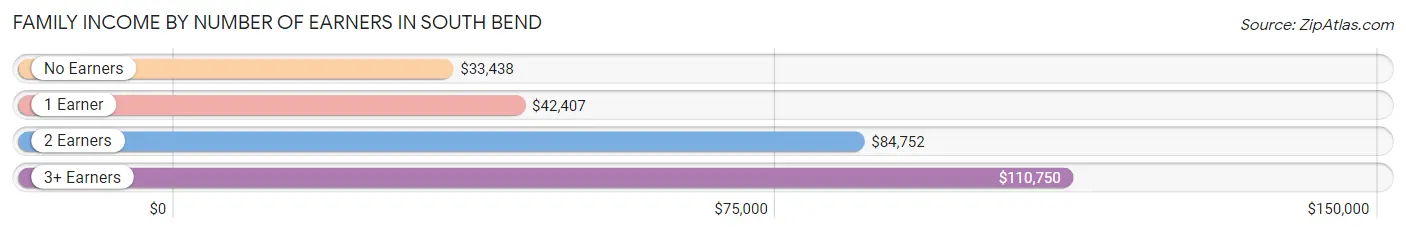
| Number of Earners | # Families | Median Income |
| No Earners | 2,870 (12.8%) | $33,438 |
| 1 Earner | 8,559 (38.3%) | $42,407 |
| 2 Earners | 9,152 (40.9%) | $84,752 |
| 3+ Earners | 1,777 (8.0%) | $110,750 |
| Total | 22,358 (100.0%) | $61,974 |
Household Income in South Bend
Household Income Brackets in South Bend
With 7,341 households falling in the category, the $50,000 to $74,999 income range is the most frequent in South Bend, accounting for 18.1% of all households. In contrast, only 1,257 households (3.1%) fall into the $200,000+ income bracket, making it the least populous group.
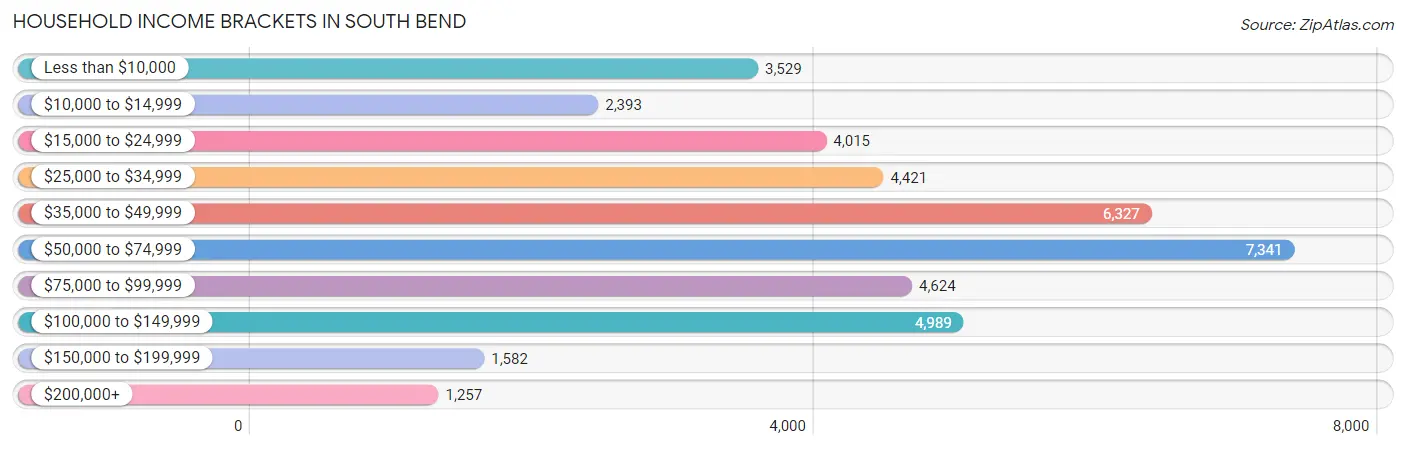
| Income Bracket | # Households | % Households |
| Less than $10,000 | 3,529 | 8.7% |
| $10,000 to $14,999 | 2,393 | 5.9% |
| $15,000 to $24,999 | 4,015 | 9.9% |
| $25,000 to $34,999 | 4,421 | 10.9% |
| $35,000 to $49,999 | 6,327 | 15.6% |
| $50,000 to $74,999 | 7,341 | 18.1% |
| $75,000 to $99,999 | 4,624 | 11.4% |
| $100,000 to $149,999 | 4,989 | 12.3% |
| $150,000 to $199,999 | 1,582 | 3.9% |
| $200,000+ | 1,257 | 3.1% |
Household Income by Householder Age in South Bend
The median household income in South Bend is $49,056, with the highest median household income of $55,931 found in the 45 to 64 years age bracket for the primary householder. A total of 13,464 households (33.2%) fall into this category. Meanwhile, the 15 to 24 years age bracket for the primary householder has the lowest median household income of $29,141, with 2,418 households (6.0%) in this group.
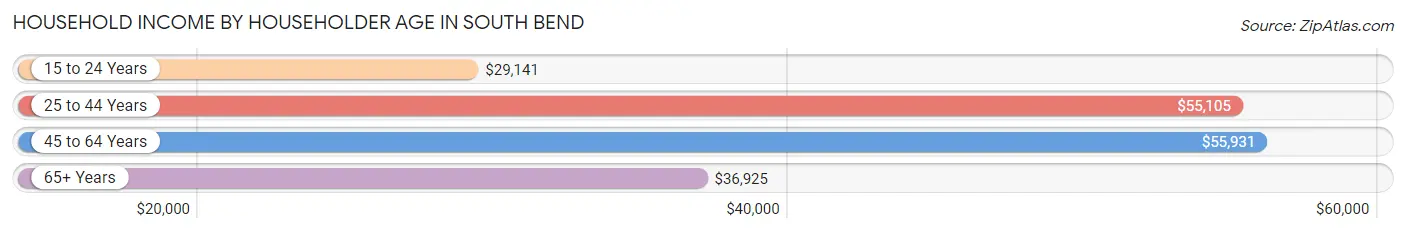
| Income Bracket | # Households | Median Income |
| 15 to 24 Years | 2,418 (6.0%) | $29,141 |
| 25 to 44 Years | 14,638 (36.1%) | $55,105 |
| 45 to 64 Years | 13,464 (33.2%) | $55,931 |
| 65+ Years | 10,039 (24.7%) | $36,925 |
| Total | 40,559 (100.0%) | $49,056 |
Poverty in South Bend
Income Below Poverty by Sex and Age in South Bend
With 20.2% poverty level for males and 24.6% for females among the residents of South Bend, 15 year old males and 18 to 24 year old females are the most vulnerable to poverty, with 366 males (40.2%) and 1,799 females (37.1%) in their respective age groups living below the poverty level.
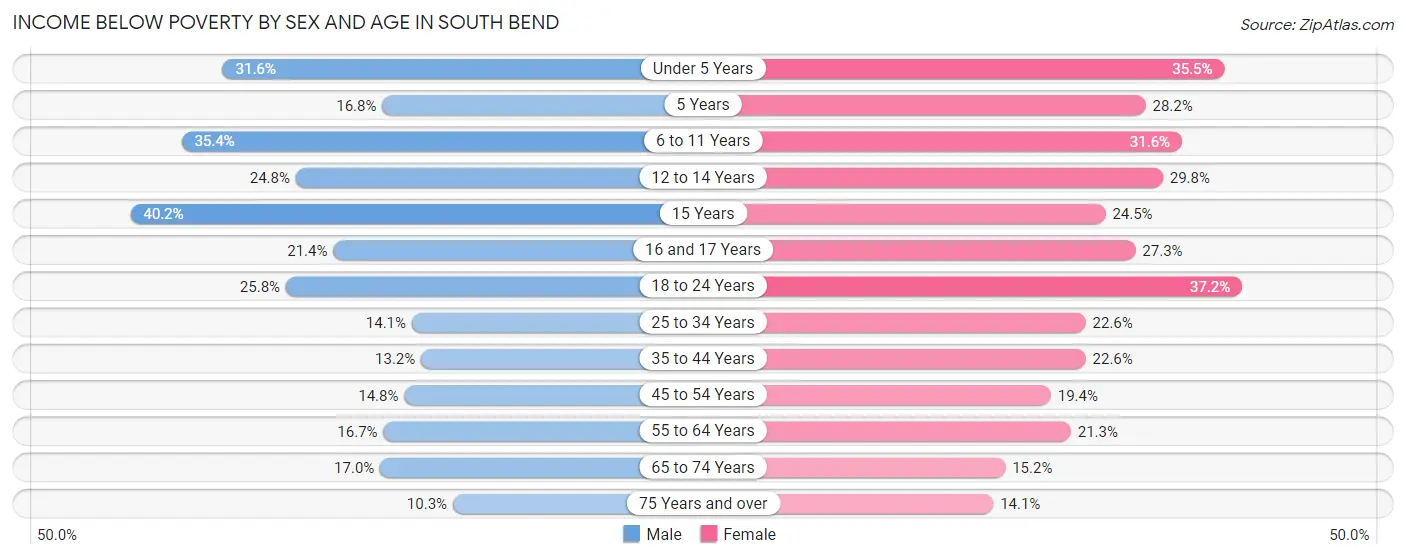
| Age Bracket | Male | Female |
| Under 5 Years | 1,063 (31.6%) | 1,415 (35.5%) |
| 5 Years | 170 (16.8%) | 210 (28.2%) |
| 6 to 11 Years | 1,544 (35.4%) | 1,438 (31.6%) |
| 12 to 14 Years | 577 (24.8%) | 734 (29.8%) |
| 15 Years | 366 (40.2%) | 196 (24.5%) |
| 16 and 17 Years | 306 (21.3%) | 393 (27.3%) |
| 18 to 24 Years | 1,260 (25.8%) | 1,799 (37.1%) |
| 25 to 34 Years | 1,003 (14.1%) | 1,856 (22.6%) |
| 35 to 44 Years | 769 (13.2%) | 1,586 (22.6%) |
| 45 to 54 Years | 795 (14.8%) | 1,143 (19.4%) |
| 55 to 64 Years | 898 (16.7%) | 1,102 (21.2%) |
| 65 to 74 Years | 659 (17.0%) | 677 (15.2%) |
| 75 Years and over | 171 (10.2%) | 494 (14.1%) |
| Total | 9,581 (20.2%) | 13,043 (24.6%) |
Income Above Poverty by Sex and Age in South Bend
According to the poverty statistics in South Bend, males aged 75 years and over and females aged 75 years and over are the age groups that are most secure financially, with 89.7% of males and 86.0% of females in these age groups living above the poverty line.
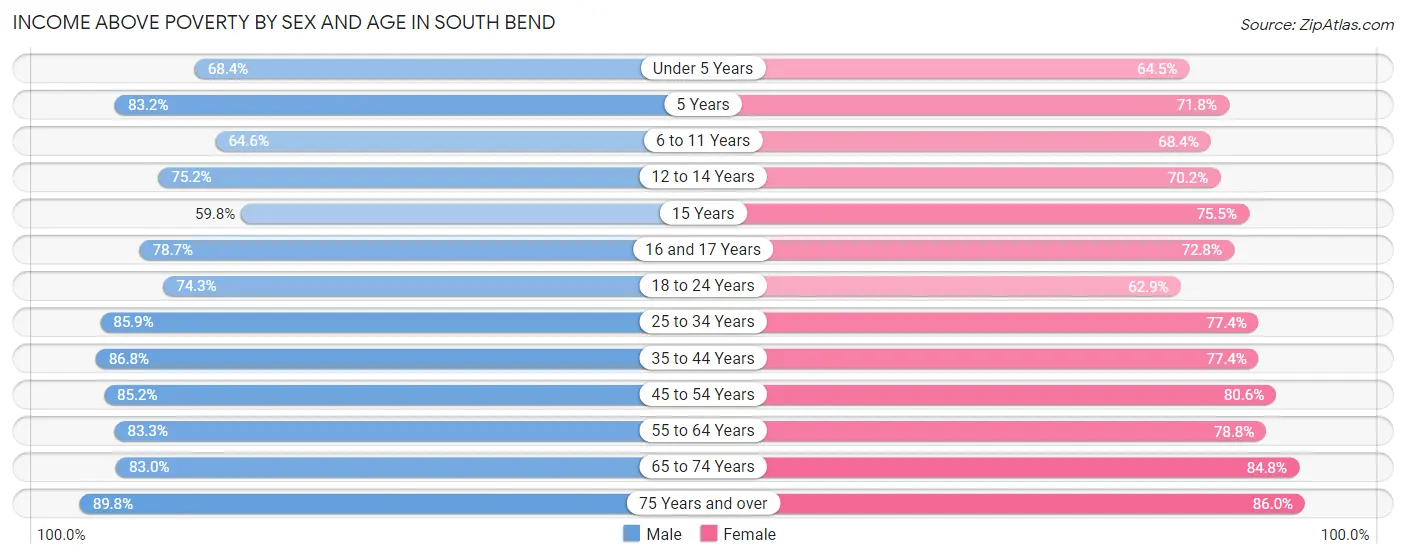
| Age Bracket | Male | Female |
| Under 5 Years | 2,299 (68.4%) | 2,571 (64.5%) |
| 5 Years | 842 (83.2%) | 535 (71.8%) |
| 6 to 11 Years | 2,813 (64.6%) | 3,118 (68.4%) |
| 12 to 14 Years | 1,747 (75.2%) | 1,730 (70.2%) |
| 15 Years | 545 (59.8%) | 605 (75.5%) |
| 16 and 17 Years | 1,127 (78.6%) | 1,049 (72.8%) |
| 18 to 24 Years | 3,634 (74.3%) | 3,043 (62.8%) |
| 25 to 34 Years | 6,130 (85.9%) | 6,345 (77.4%) |
| 35 to 44 Years | 5,056 (86.8%) | 5,421 (77.4%) |
| 45 to 54 Years | 4,593 (85.2%) | 4,748 (80.6%) |
| 55 to 64 Years | 4,478 (83.3%) | 4,084 (78.7%) |
| 65 to 74 Years | 3,217 (83.0%) | 3,786 (84.8%) |
| 75 Years and over | 1,498 (89.7%) | 3,023 (86.0%) |
| Total | 37,979 (79.8%) | 40,058 (75.4%) |
Income Below Poverty Among Married-Couple Families in South Bend
The poverty statistics for married-couple families in South Bend show that 6.6% or 860 of the total 13,043 families live below the poverty line. Families with 5 or more children have the highest poverty rate of 19.1%, comprising of 57 families. On the other hand, families with no children have the lowest poverty rate of 4.8%, which includes 354 families.
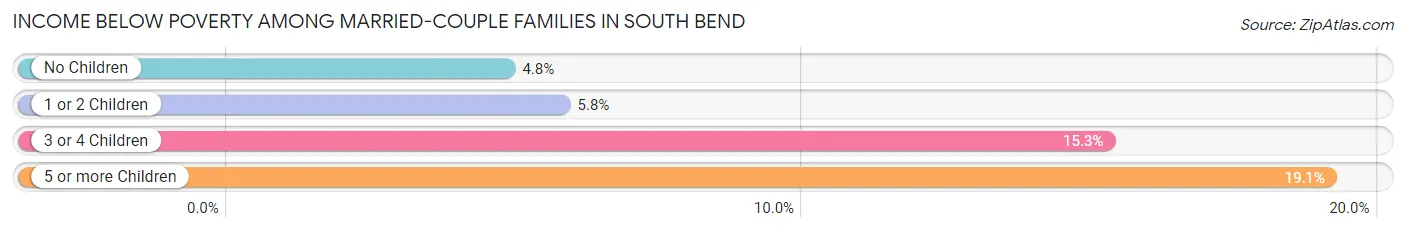
| Children | Above Poverty | Below Poverty |
| No Children | 6,970 (95.2%) | 354 (4.8%) |
| 1 or 2 Children | 3,762 (94.2%) | 231 (5.8%) |
| 3 or 4 Children | 1,210 (84.7%) | 218 (15.3%) |
| 5 or more Children | 241 (80.9%) | 57 (19.1%) |
| Total | 12,183 (93.4%) | 860 (6.6%) |
Income Below Poverty Among Single-Parent Households in South Bend
According to the poverty data in South Bend, 18.1% or 351 single-father households and 37.4% or 2,757 single-mother households are living below the poverty line. Among single-father households, those with 5 or more children have the highest poverty rate, with 37 households (100.0%) experiencing poverty. Likewise, among single-mother households, those with 3 or 4 children have the highest poverty rate, with 819 households (65.4%) falling below the poverty line.
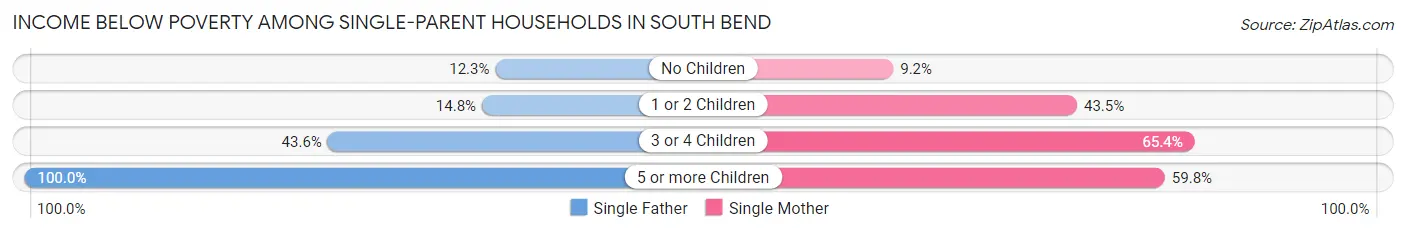
| Children | Single Father | Single Mother |
| No Children | 102 (12.3%) | 201 (9.2%) |
| 1 or 2 Children | 131 (14.8%) | 1,667 (43.5%) |
| 3 or 4 Children | 81 (43.5%) | 819 (65.4%) |
| 5 or more Children | 37 (100.0%) | 70 (59.8%) |
| Total | 351 (18.1%) | 2,757 (37.4%) |
Income Below Poverty Among Married-Couple vs Single-Parent Households in South Bend
The poverty data for South Bend shows that 860 of the married-couple family households (6.6%) and 3,108 of the single-parent households (33.4%) are living below the poverty level. Within the married-couple family households, those with 5 or more children have the highest poverty rate, with 57 households (19.1%) falling below the poverty line. Among the single-parent households, those with 5 or more children have the highest poverty rate, with 107 household (69.5%) living below poverty.
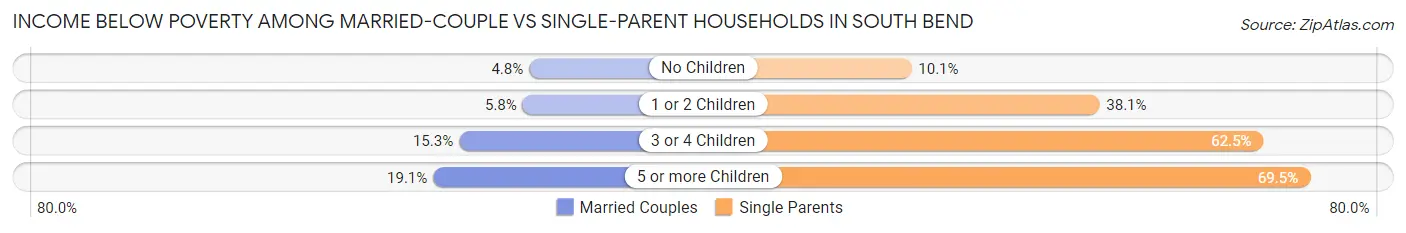
| Children | Married-Couple Families | Single-Parent Households |
| No Children | 354 (4.8%) | 303 (10.1%) |
| 1 or 2 Children | 231 (5.8%) | 1,798 (38.1%) |
| 3 or 4 Children | 218 (15.3%) | 900 (62.5%) |
| 5 or more Children | 57 (19.1%) | 107 (69.5%) |
| Total | 860 (6.6%) | 3,108 (33.4%) |
Race in South Bend
The most populous races in South Bend are White / Caucasian (57,611 | 55.9%), Black / African American (26,141 | 25.4%), and Hispanic or Latino (16,873 | 16.4%).
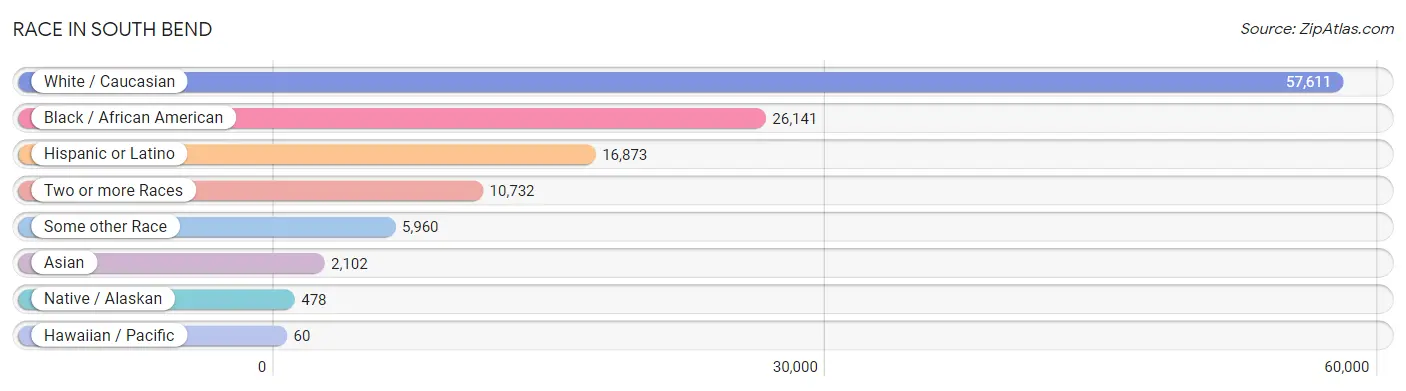
| Race | # Population | % Population |
| Asian | 2,102 | 2.0% |
| Black / African American | 26,141 | 25.4% |
| Hawaiian / Pacific | 60 | 0.1% |
| Hispanic or Latino | 16,873 | 16.4% |
| Native / Alaskan | 478 | 0.5% |
| White / Caucasian | 57,611 | 55.9% |
| Two or more Races | 10,732 | 10.4% |
| Some other Race | 5,960 | 5.8% |
| Total | 103,084 | 100.0% |
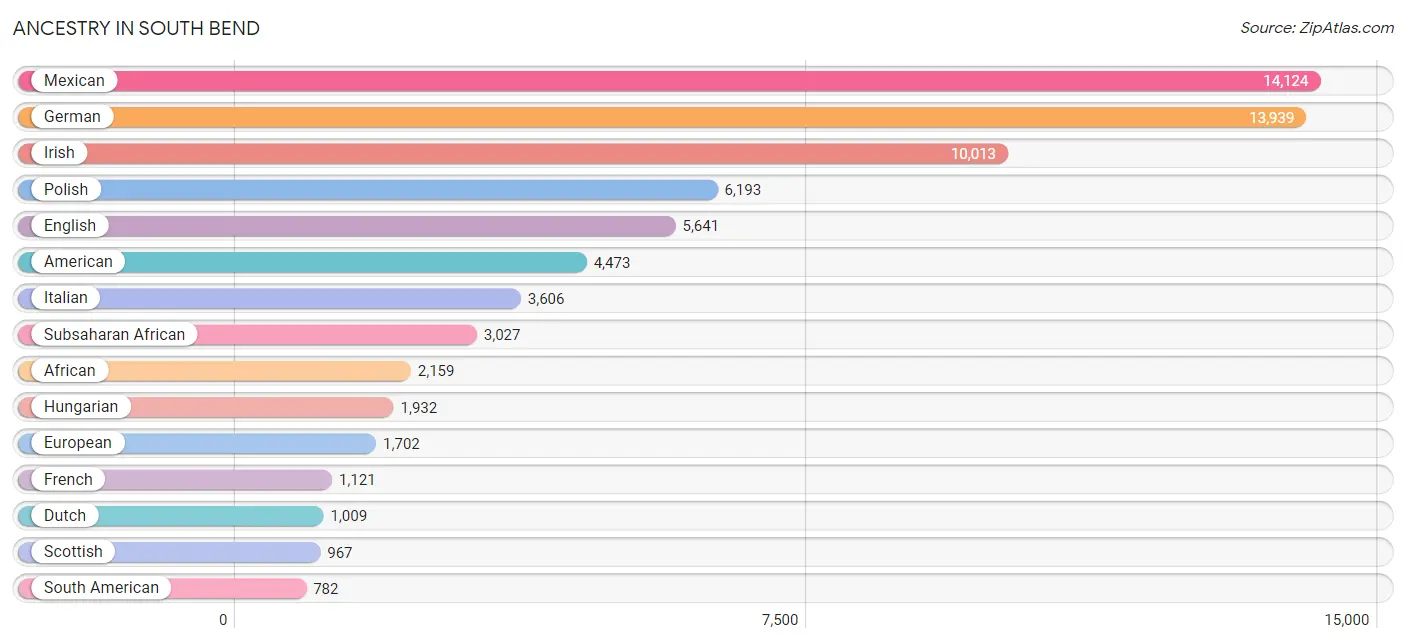
Ancestry in South Bend
The most populous ancestries reported in South Bend are Mexican (14,124 | 13.7%), German (13,939 | 13.5%), Irish (10,013 | 9.7%), Polish (6,193 | 6.0%), and English (5,641 | 5.5%), together accounting for 48.4% of all South Bend residents.
| Ancestry | # Population | % Population |
| African | 2,159 | 2.1% |
| American | 4,473 | 4.3% |
| Apache | 62 | 0.1% |
| Arab | 213 | 0.2% |
| Argentinean | 60 | 0.1% |
| Armenian | 47 | 0.1% |
| Assyrian / Chaldean / Syriac | 50 | 0.1% |
| Austrian | 198 | 0.2% |
| Basque | 3 | 0.0% |
| Belgian | 546 | 0.5% |
| Bermudan | 6 | 0.0% |
| Bhutanese | 132 | 0.1% |
| Blackfeet | 5 | 0.0% |
| Brazilian | 90 | 0.1% |
| British | 311 | 0.3% |
| Burmese | 336 | 0.3% |
| Cajun | 124 | 0.1% |
| Canadian | 98 | 0.1% |
| Cape Verdean | 11 | 0.0% |
| Carpatho Rusyn | 5 | 0.0% |
| Central American | 352 | 0.3% |
| Central American Indian | 41 | 0.0% |
| Cherokee | 249 | 0.2% |
| Cheyenne | 34 | 0.0% |
| Chilean | 73 | 0.1% |
| Chippewa | 55 | 0.1% |
| Choctaw | 29 | 0.0% |
| Colombian | 149 | 0.1% |
| Costa Rican | 23 | 0.0% |
| Croatian | 90 | 0.1% |
| Crow | 26 | 0.0% |
| Cuban | 175 | 0.2% |
| Czech | 223 | 0.2% |
| Czechoslovakian | 34 | 0.0% |
| Danish | 191 | 0.2% |
| Dominican | 67 | 0.1% |
| Dutch | 1,009 | 1.0% |
| Eastern European | 138 | 0.1% |
| Ecuadorian | 95 | 0.1% |
| English | 5,641 | 5.5% |
| Ethiopian | 57 | 0.1% |
| European | 1,702 | 1.7% |
| Finnish | 57 | 0.1% |
| French | 1,121 | 1.1% |
| French American Indian | 28 | 0.0% |
| French Canadian | 295 | 0.3% |
| German | 13,939 | 13.5% |
| Ghanaian | 55 | 0.1% |
| Greek | 266 | 0.3% |
| Guatemalan | 107 | 0.1% |
| Guyanese | 21 | 0.0% |
| Haitian | 32 | 0.0% |
| Honduran | 158 | 0.2% |
| Hungarian | 1,932 | 1.9% |
| Icelander | 8 | 0.0% |
| Indian (Asian) | 595 | 0.6% |
| Indonesian | 80 | 0.1% |
| Inupiat | 14 | 0.0% |
| Iranian | 18 | 0.0% |
| Iraqi | 11 | 0.0% |
| Irish | 10,013 | 9.7% |
| Iroquois | 3 | 0.0% |
| Israeli | 5 | 0.0% |
| Italian | 3,606 | 3.5% |
| Jamaican | 202 | 0.2% |
| Japanese | 40 | 0.0% |
| Jordanian | 54 | 0.1% |
| Kenyan | 217 | 0.2% |
| Korean | 507 | 0.5% |
| Laotian | 13 | 0.0% |
| Lebanese | 100 | 0.1% |
| Liberian | 30 | 0.0% |
| Lithuanian | 271 | 0.3% |
| Luxembourger | 25 | 0.0% |
| Malaysian | 9 | 0.0% |
| Maltese | 43 | 0.0% |
| Mexican | 14,124 | 13.7% |
| Mexican American Indian | 310 | 0.3% |
| Native Hawaiian | 13 | 0.0% |
| Navajo | 11 | 0.0% |
| Nigerian | 22 | 0.0% |
| Northern European | 68 | 0.1% |
| Norwegian | 641 | 0.6% |
| Pakistani | 68 | 0.1% |
| Palestinian | 18 | 0.0% |
| Paraguayan | 8 | 0.0% |
| Pennsylvania German | 179 | 0.2% |
| Peruvian | 47 | 0.1% |
| Polish | 6,193 | 6.0% |
| Portuguese | 32 | 0.0% |
| Potawatomi | 6 | 0.0% |
| Pueblo | 4 | 0.0% |
| Puerto Rican | 457 | 0.4% |
| Romanian | 79 | 0.1% |
| Russian | 305 | 0.3% |
| Salvadoran | 64 | 0.1% |
| Samoan | 8 | 0.0% |
| Scandinavian | 268 | 0.3% |
| Scotch-Irish | 746 | 0.7% |
| Scottish | 967 | 0.9% |
| Seminole | 21 | 0.0% |
| Serbian | 200 | 0.2% |
| Sierra Leonean | 31 | 0.0% |
| Sioux | 13 | 0.0% |
| Slavic | 144 | 0.1% |
| Slovak | 108 | 0.1% |
| Slovene | 19 | 0.0% |
| South African | 8 | 0.0% |
| South American | 782 | 0.8% |
| South American Indian | 10 | 0.0% |
| Spaniard | 290 | 0.3% |
| Spanish | 86 | 0.1% |
| Sri Lankan | 228 | 0.2% |
| Subsaharan African | 3,027 | 2.9% |
| Swedish | 615 | 0.6% |
| Swiss | 212 | 0.2% |
| Syrian | 5 | 0.0% |
| Thai | 396 | 0.4% |
| Tongan | 4 | 0.0% |
| Ukrainian | 120 | 0.1% |
| Uruguayan | 7 | 0.0% |
| Venezuelan | 343 | 0.3% |
| Vietnamese | 24 | 0.0% |
| Welsh | 346 | 0.3% |
| Yugoslavian | 48 | 0.1% |
| Zimbabwean | 284 | 0.3% | View All 126 Rows |
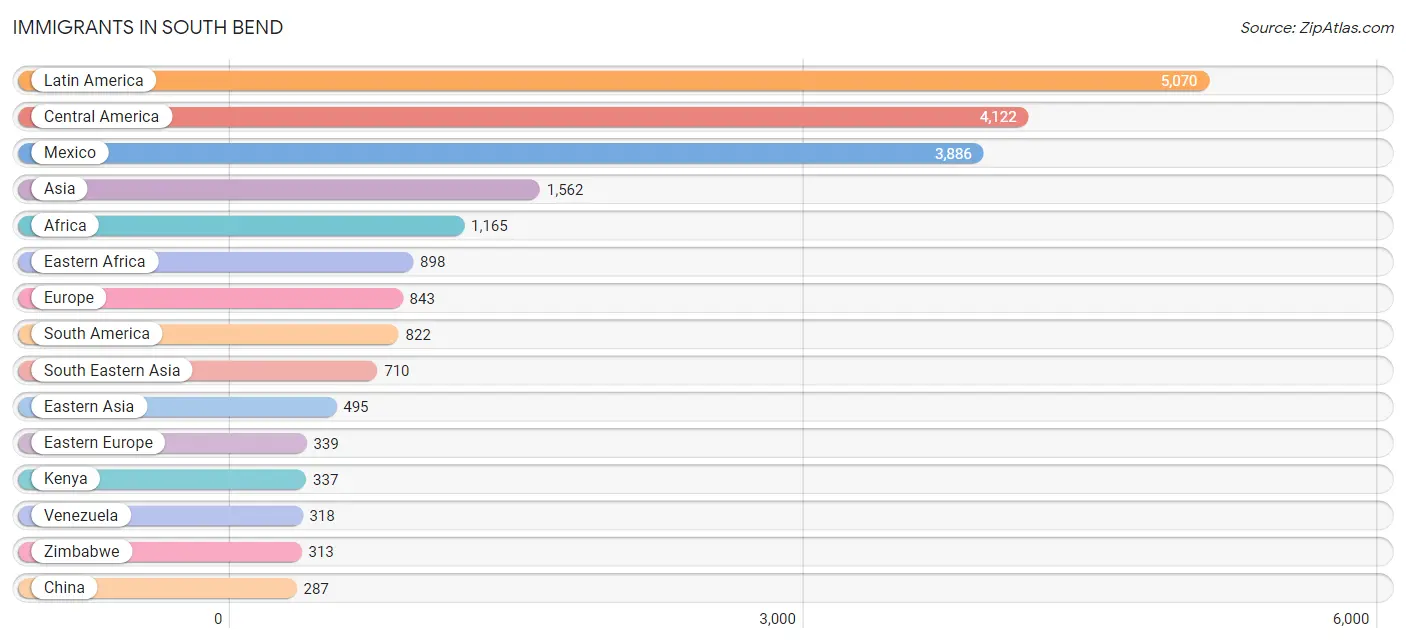
Immigrants in South Bend
The most numerous immigrant groups reported in South Bend came from Latin America (5,070 | 4.9%), Central America (4,122 | 4.0%), Mexico (3,886 | 3.8%), Asia (1,562 | 1.5%), and Africa (1,165 | 1.1%), together accounting for 15.3% of all South Bend residents.
| Immigration Origin | # Population | % Population |
| Africa | 1,165 | 1.1% |
| Argentina | 48 | 0.1% |
| Asia | 1,562 | 1.5% |
| Bangladesh | 24 | 0.0% |
| Belgium | 3 | 0.0% |
| Bolivia | 24 | 0.0% |
| Bosnia and Herzegovina | 21 | 0.0% |
| Brazil | 41 | 0.0% |
| Cambodia | 29 | 0.0% |
| Canada | 140 | 0.1% |
| Caribbean | 126 | 0.1% |
| Central America | 4,122 | 4.0% |
| Chile | 54 | 0.1% |
| China | 287 | 0.3% |
| Colombia | 96 | 0.1% |
| Congo | 18 | 0.0% |
| Costa Rica | 27 | 0.0% |
| Croatia | 20 | 0.0% |
| Cuba | 2 | 0.0% |
| Dominican Republic | 19 | 0.0% |
| Eastern Africa | 898 | 0.9% |
| Eastern Asia | 495 | 0.5% |
| Eastern Europe | 339 | 0.3% |
| Ecuador | 122 | 0.1% |
| Egypt | 8 | 0.0% |
| El Salvador | 23 | 0.0% |
| England | 38 | 0.0% |
| Ethiopia | 78 | 0.1% |
| Europe | 843 | 0.8% |
| France | 50 | 0.1% |
| Germany | 102 | 0.1% |
| Ghana | 15 | 0.0% |
| Greece | 32 | 0.0% |
| Guatemala | 41 | 0.0% |
| Guyana | 21 | 0.0% |
| Haiti | 20 | 0.0% |
| Honduras | 145 | 0.1% |
| Hungary | 145 | 0.1% |
| India | 213 | 0.2% |
| Iran | 18 | 0.0% |
| Ireland | 66 | 0.1% |
| Israel | 27 | 0.0% |
| Italy | 96 | 0.1% |
| Jamaica | 63 | 0.1% |
| Japan | 15 | 0.0% |
| Kenya | 337 | 0.3% |
| Korea | 193 | 0.2% |
| Laos | 9 | 0.0% |
| Latin America | 5,070 | 4.9% |
| Lebanon | 44 | 0.0% |
| Liberia | 30 | 0.0% |
| Mexico | 3,886 | 3.8% |
| Middle Africa | 70 | 0.1% |
| Moldova | 5 | 0.0% |
| Nepal | 7 | 0.0% |
| Netherlands | 26 | 0.0% |
| Nigeria | 49 | 0.1% |
| Northern Africa | 8 | 0.0% |
| Northern Europe | 183 | 0.2% |
| Pakistan | 12 | 0.0% |
| Peru | 29 | 0.0% |
| Philippines | 231 | 0.2% |
| Poland | 26 | 0.0% |
| Romania | 34 | 0.0% |
| Russia | 50 | 0.1% |
| Sierra Leone | 31 | 0.0% |
| Singapore | 5 | 0.0% |
| South Africa | 18 | 0.0% |
| South America | 822 | 0.8% |
| South Central Asia | 281 | 0.3% |
| South Eastern Asia | 710 | 0.7% |
| Southern Europe | 140 | 0.1% |
| Spain | 12 | 0.0% |
| Thailand | 145 | 0.1% |
| Ukraine | 38 | 0.0% |
| Uruguay | 61 | 0.1% |
| Venezuela | 318 | 0.3% |
| Vietnam | 219 | 0.2% |
| Western Africa | 138 | 0.1% |
| Western Asia | 76 | 0.1% |
| Western Europe | 181 | 0.2% |
| Zaire | 52 | 0.1% |
| Zimbabwe | 313 | 0.3% | View All 83 Rows |
Sex and Age in South Bend
Sex and Age in South Bend
The most populous age groups in South Bend are 10 to 14 Years (3,924 | 8.0%) for men and 25 to 29 Years (4,265 | 7.9%) for women.
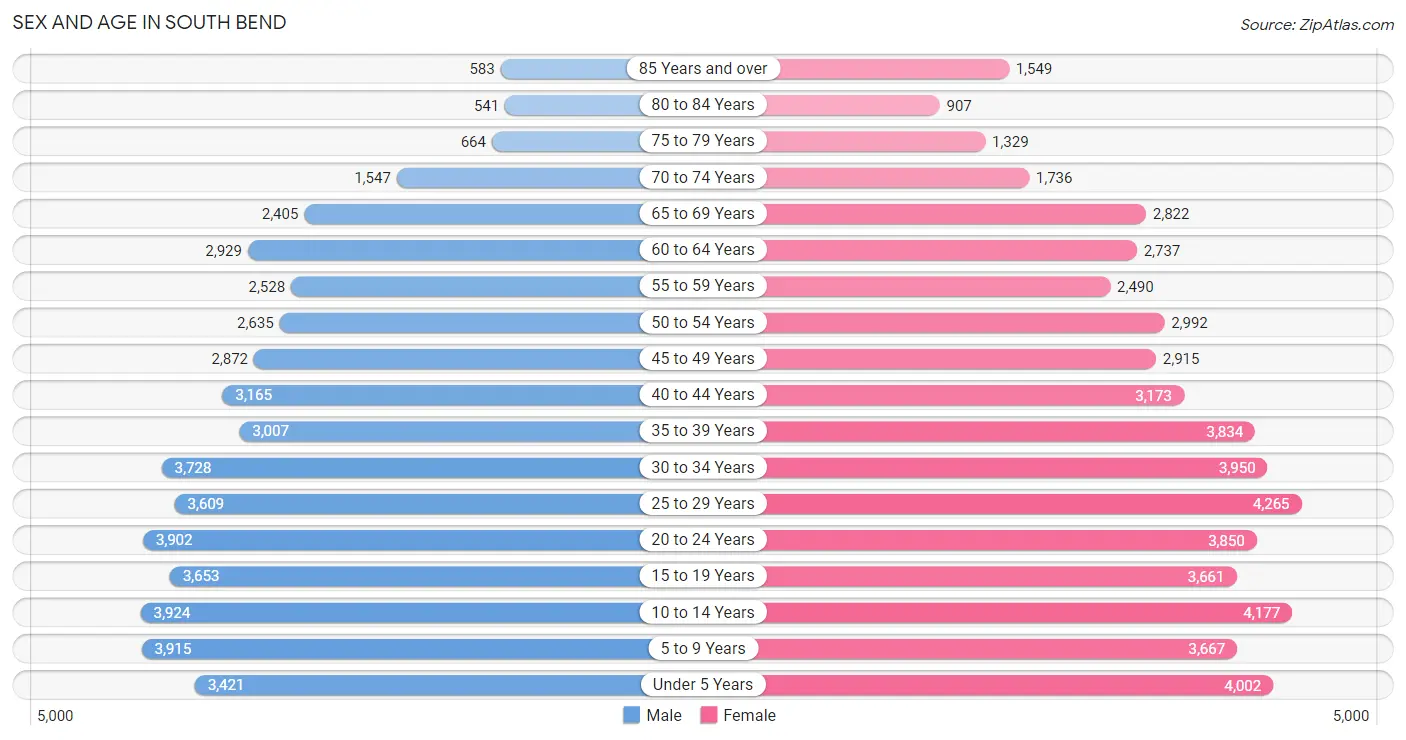
| Age Bracket | Male | Female |
| Under 5 Years | 3,421 (7.0%) | 4,002 (7.4%) |
| 5 to 9 Years | 3,915 (8.0%) | 3,667 (6.8%) |
| 10 to 14 Years | 3,924 (8.0%) | 4,177 (7.7%) |
| 15 to 19 Years | 3,653 (7.4%) | 3,661 (6.8%) |
| 20 to 24 Years | 3,902 (8.0%) | 3,850 (7.1%) |
| 25 to 29 Years | 3,609 (7.4%) | 4,265 (7.9%) |
| 30 to 34 Years | 3,728 (7.6%) | 3,950 (7.3%) |
| 35 to 39 Years | 3,007 (6.1%) | 3,834 (7.1%) |
| 40 to 44 Years | 3,165 (6.5%) | 3,173 (5.9%) |
| 45 to 49 Years | 2,872 (5.9%) | 2,915 (5.4%) |
| 50 to 54 Years | 2,635 (5.4%) | 2,992 (5.5%) |
| 55 to 59 Years | 2,528 (5.2%) | 2,490 (4.6%) |
| 60 to 64 Years | 2,929 (6.0%) | 2,737 (5.1%) |
| 65 to 69 Years | 2,405 (4.9%) | 2,822 (5.2%) |
| 70 to 74 Years | 1,547 (3.2%) | 1,736 (3.2%) |
| 75 to 79 Years | 664 (1.3%) | 1,329 (2.5%) |
| 80 to 84 Years | 541 (1.1%) | 907 (1.7%) |
| 85 Years and over | 583 (1.2%) | 1,549 (2.9%) |
| Total | 49,028 (100.0%) | 54,056 (100.0%) |
Families and Households in South Bend
Median Family Size in South Bend
The median family size in South Bend is 3.33 persons per family, with single female/mother families (7,380 | 33.0%) accounting for the largest median family size of 3.38 persons per family. On the other hand, single male/father families (1,935 | 8.6%) represent the smallest median family size with 2.90 persons per family.
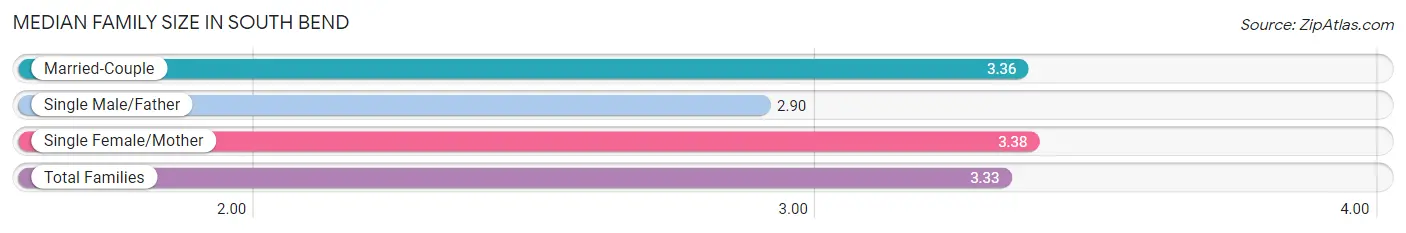
| Family Type | # Families | Family Size |
| Married-Couple | 13,043 (58.3%) | 3.36 |
| Single Male/Father | 1,935 (8.6%) | 2.90 |
| Single Female/Mother | 7,380 (33.0%) | 3.38 |
| Total Families | 22,358 (100.0%) | 3.33 |
Median Household Size in South Bend
The median household size in South Bend is 2.47 persons per household, with single female/mother households (7,380 | 18.2%) accounting for the largest median household size of 3.65 persons per household. non-family households (18,201 | 44.9%) represent the smallest median household size with 1.27 persons per household.
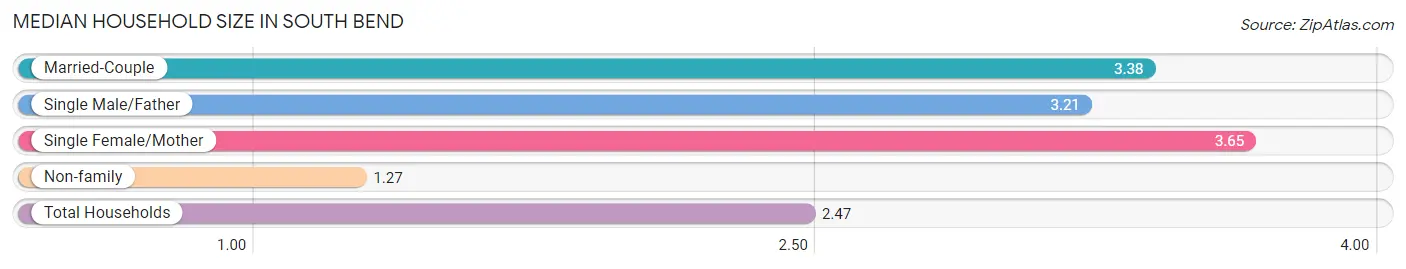
| Household Type | # Households | Household Size |
| Married-Couple | 13,043 (32.2%) | 3.38 |
| Single Male/Father | 1,935 (4.8%) | 3.21 |
| Single Female/Mother | 7,380 (18.2%) | 3.65 |
| Non-family | 18,201 (44.9%) | 1.27 |
| Total Households | 40,559 (100.0%) | 2.47 |
Household Size by Marriage Status in South Bend
Out of a total of 40,559 households in South Bend, 22,358 (55.1%) are family households, while 18,201 (44.9%) are nonfamily households. The most numerous type of family households are 2-person households, comprising 9,439, and the most common type of nonfamily households are 1-person households, comprising 14,894.
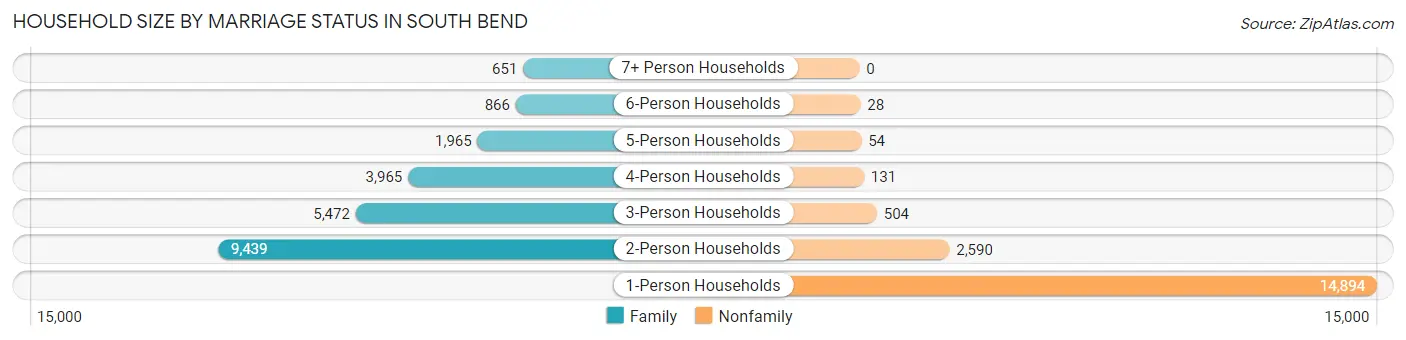
| Household Size | Family Households | Nonfamily Households |
| 1-Person Households | - | 14,894 (36.7%) |
| 2-Person Households | 9,439 (23.3%) | 2,590 (6.4%) |
| 3-Person Households | 5,472 (13.5%) | 504 (1.2%) |
| 4-Person Households | 3,965 (9.8%) | 131 (0.3%) |
| 5-Person Households | 1,965 (4.8%) | 54 (0.1%) |
| 6-Person Households | 866 (2.1%) | 28 (0.1%) |
| 7+ Person Households | 651 (1.6%) | 0 (0.0%) |
| Total | 22,358 (55.1%) | 18,201 (44.9%) |
Female Fertility in South Bend
Fertility by Age in South Bend
Average fertility rate in South Bend is 45.0 births per 1,000 women. Women in the age bracket of 20 to 34 years have the highest fertility rate with 69.0 births per 1,000 women. Women in the age bracket of 20 to 34 years acount for 70.6% of all women with births.
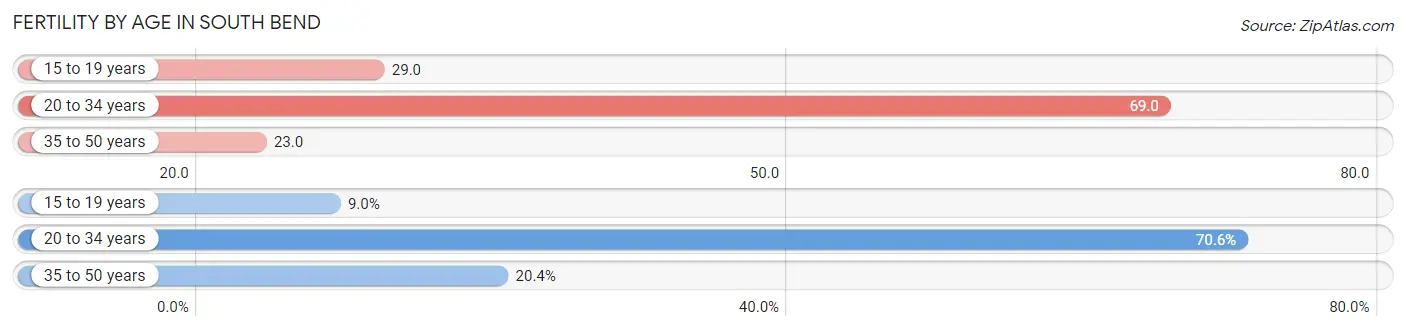
| Age Bracket | Women with Births | Births / 1,000 Women |
| 15 to 19 years | 107 (9.0%) | 29.0 |
| 20 to 34 years | 837 (70.6%) | 69.0 |
| 35 to 50 years | 242 (20.4%) | 23.0 |
| Total | 1,186 (100.0%) | 45.0 |
Fertility by Age by Marriage Status in South Bend
54.0% of women with births (1,186) in South Bend are married. The highest percentage of unmarried women with births falls into 15 to 19 years age bracket with 100.0% of them unmarried at the time of birth, while the lowest percentage of unmarried women with births belong to 35 to 50 years age bracket with 31.0% of them unmarried.
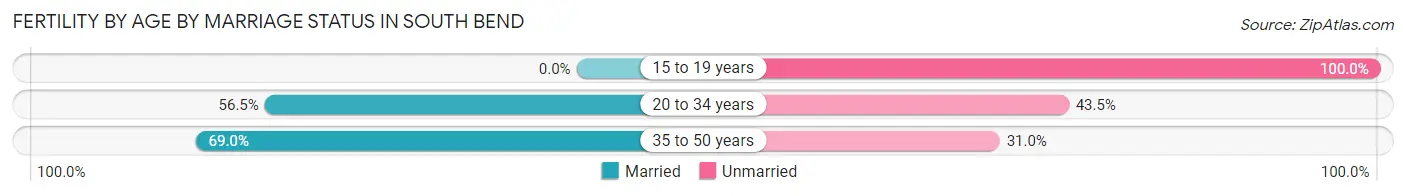
| Age Bracket | Married | Unmarried |
| 15 to 19 years | 0 (0.0%) | 107 (100.0%) |
| 20 to 34 years | 473 (56.5%) | 364 (43.5%) |
| 35 to 50 years | 167 (69.0%) | 75 (31.0%) |
| Total | 640 (54.0%) | 546 (46.0%) |
Fertility by Education in South Bend
Average fertility rate in South Bend is 45.0 births per 1,000 women. Women with the education attainment of high school diploma have the highest fertility rate of 59.0 births per 1,000 women, while women with the education attainment of less than high school have the lowest fertility at 29.0 births per 1,000 women. Women with the education attainment of high school diploma represent 31.7% of all women with births.
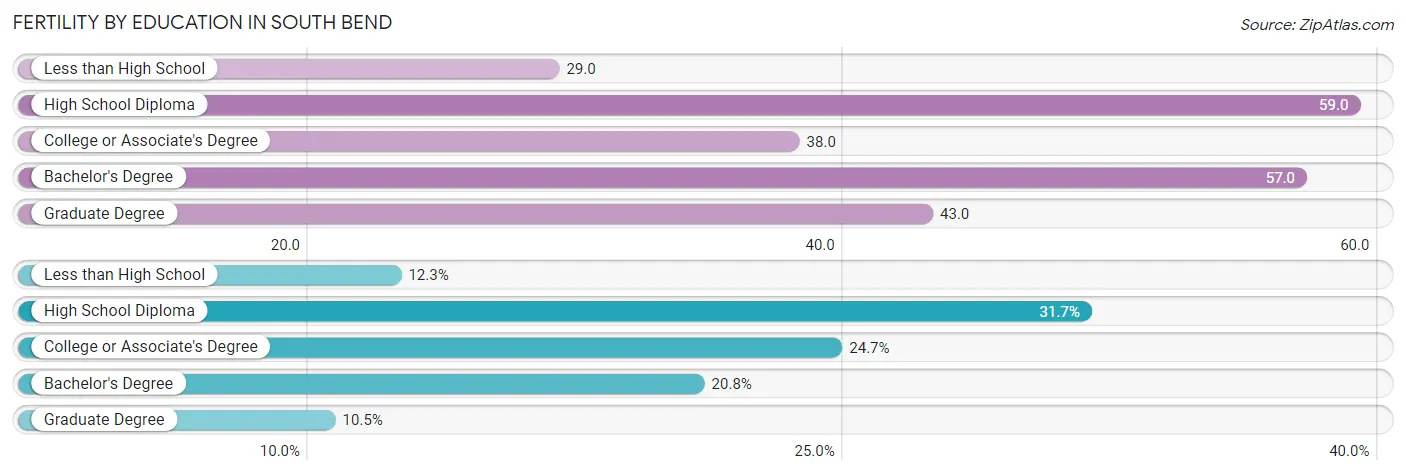
| Educational Attainment | Women with Births | Births / 1,000 Women |
| Less than High School | 146 (12.3%) | 29.0 |
| High School Diploma | 376 (31.7%) | 59.0 |
| College or Associate's Degree | 293 (24.7%) | 38.0 |
| Bachelor's Degree | 247 (20.8%) | 57.0 |
| Graduate Degree | 124 (10.5%) | 43.0 |
| Total | 1,186 (100.0%) | 45.0 |
Fertility by Education by Marriage Status in South Bend
46.0% of women with births in South Bend are unmarried. Women with the educational attainment of bachelor's degree are most likely to be married with 97.6% of them married at childbirth, while women with the educational attainment of less than high school are least likely to be married with 77.4% of them unmarried at childbirth.
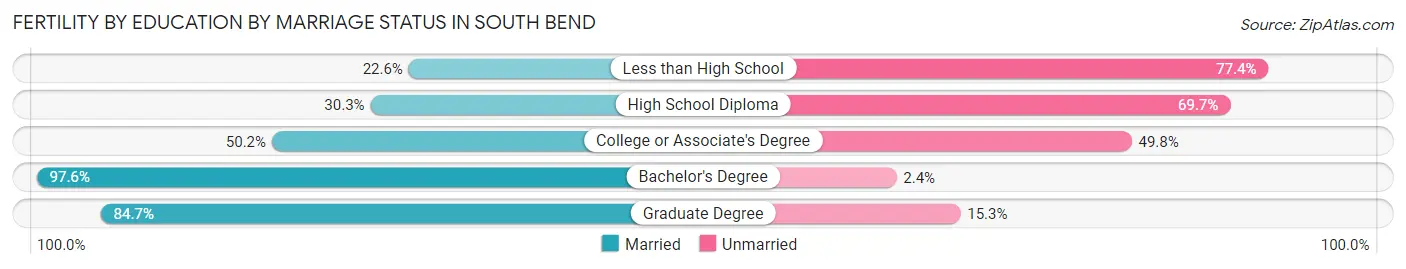
| Educational Attainment | Married | Unmarried |
| Less than High School | 33 (22.6%) | 113 (77.4%) |
| High School Diploma | 114 (30.3%) | 262 (69.7%) |
| College or Associate's Degree | 147 (50.2%) | 146 (49.8%) |
| Bachelor's Degree | 241 (97.6%) | 6 (2.4%) |
| Graduate Degree | 105 (84.7%) | 19 (15.3%) |
| Total | 640 (54.0%) | 546 (46.0%) |
Employment Characteristics in South Bend
Employment by Class of Employer in South Bend
Among the 45,456 employed individuals in South Bend, private company employees (31,038 | 68.3%), not-for-profit organizations (7,310 | 16.1%), and local government employees (2,508 | 5.5%) make up the most common classes of employment.
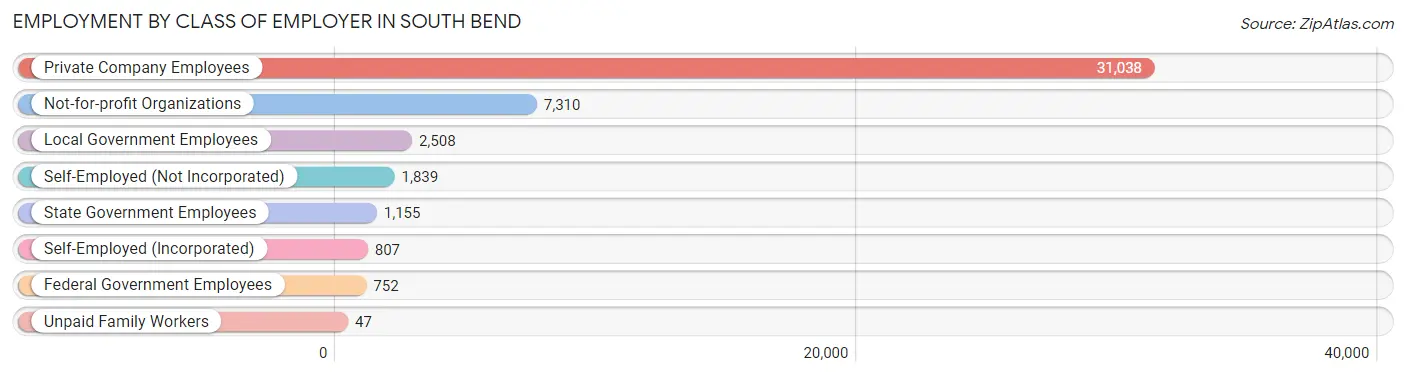
| Employer Class | # Employees | % Employees |
| Private Company Employees | 31,038 | 68.3% |
| Self-Employed (Incorporated) | 807 | 1.8% |
| Self-Employed (Not Incorporated) | 1,839 | 4.1% |
| Not-for-profit Organizations | 7,310 | 16.1% |
| Local Government Employees | 2,508 | 5.5% |
| State Government Employees | 1,155 | 2.5% |
| Federal Government Employees | 752 | 1.7% |
| Unpaid Family Workers | 47 | 0.1% |
| Total | 45,456 | 100.0% |
Employment Status by Age in South Bend
According to the labor force statistics for South Bend, out of the total population over 16 years of age (78,263), 63.1% or 49,384 individuals are in the labor force, with 5.5% or 2,716 of them unemployed. The age group with the highest labor force participation rate is 30 to 34 years, with 82.1% or 6,304 individuals in the labor force. Within the labor force, the 16 to 19 years age range has the highest percentage of unemployed individuals, with 15.2% or 396 of them being unemployed.
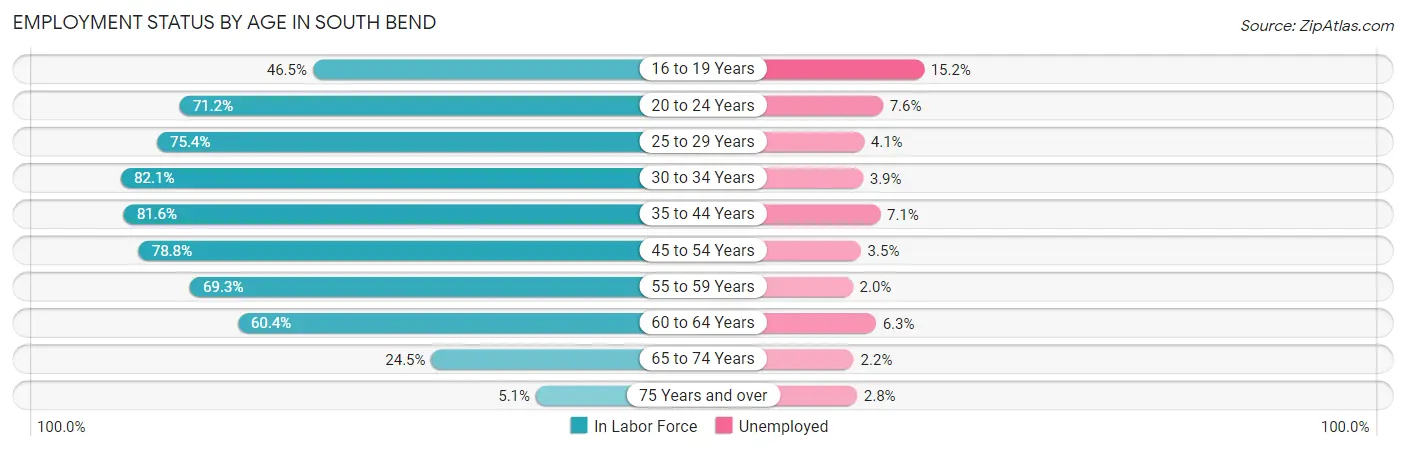
| Age Bracket | In Labor Force | Unemployed |
| 16 to 19 Years | 2,604 (46.5%) | 396 (15.2%) |
| 20 to 24 Years | 5,519 (71.2%) | 419 (7.6%) |
| 25 to 29 Years | 5,937 (75.4%) | 243 (4.1%) |
| 30 to 34 Years | 6,304 (82.1%) | 246 (3.9%) |
| 35 to 44 Years | 10,754 (81.6%) | 764 (7.1%) |
| 45 to 54 Years | 8,994 (78.8%) | 315 (3.5%) |
| 55 to 59 Years | 3,477 (69.3%) | 70 (2.0%) |
| 60 to 64 Years | 3,422 (60.4%) | 216 (6.3%) |
| 65 to 74 Years | 2,085 (24.5%) | 46 (2.2%) |
| 75 Years and over | 284 (5.1%) | 8 (2.8%) |
| Total | 49,384 (63.1%) | 2,716 (5.5%) |
Employment Status by Educational Attainment in South Bend
According to labor force statistics for South Bend, 76.5% of individuals (38,884) out of the total population between 25 and 64 years of age (50,829) are in the labor force, with 4.7% or 1,828 of them being unemployed. The group with the highest labor force participation rate are those with the educational attainment of bachelor's degree or higher, with 88.0% or 12,593 individuals in the labor force. Within the labor force, individuals with less than high school education have the highest percentage of unemployment, with 8.9% or 358 of them being unemployed.
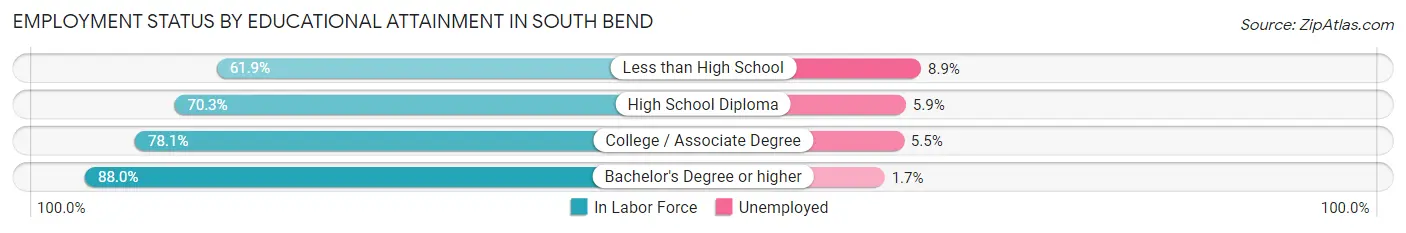
| Educational Attainment | In Labor Force | Unemployed |
| Less than High School | 4,027 (61.9%) | 579 (8.9%) |
| High School Diploma | 10,414 (70.3%) | 874 (5.9%) |
| College / Associate Degree | 11,870 (78.1%) | 836 (5.5%) |
| Bachelor's Degree or higher | 12,593 (88.0%) | 243 (1.7%) |
| Total | 38,884 (76.5%) | 2,389 (4.7%) |
Employment Occupations by Sex in South Bend
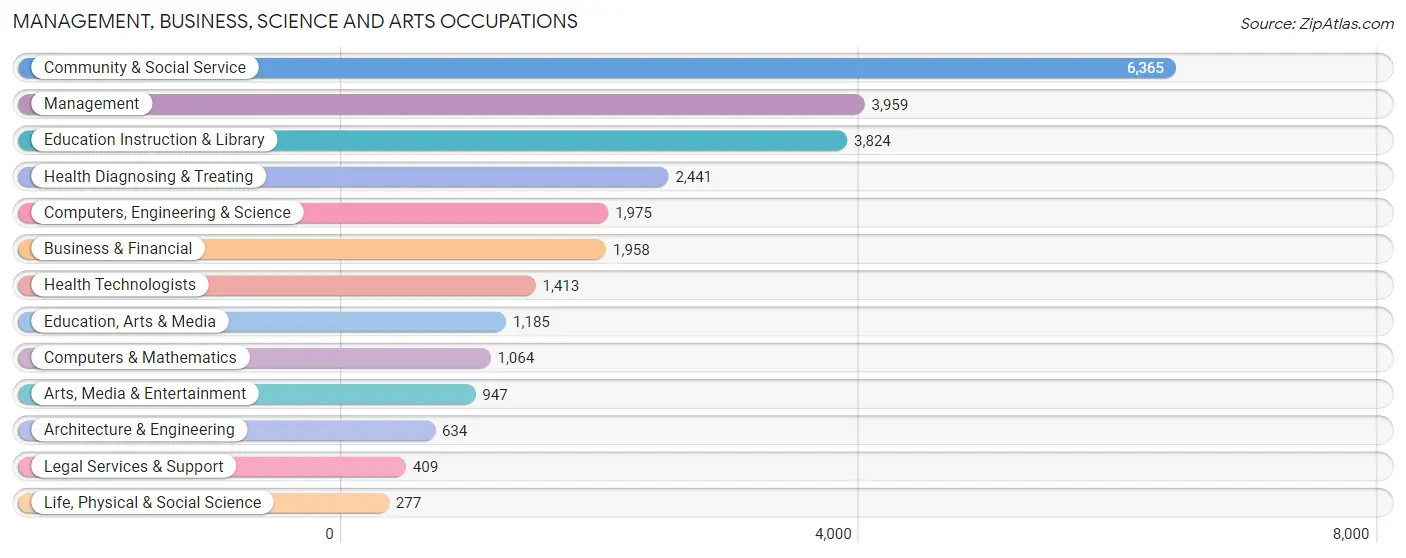
Management, Business, Science and Arts Occupations
The most common Management, Business, Science and Arts occupations in South Bend are Community & Social Service (6,365 | 13.7%), Management (3,959 | 8.5%), Education Instruction & Library (3,824 | 8.2%), Health Diagnosing & Treating (2,441 | 5.2%), and Computers, Engineering & Science (1,975 | 4.2%).
Management, Business, Science and Arts Occupations by Sex
Within the Management, Business, Science and Arts occupations in South Bend, the most male-oriented occupations are Computers & Mathematics (81.2%), Architecture & Engineering (80.8%), and Computers, Engineering & Science (74.2%), while the most female-oriented occupations are Health Technologists (85.9%), Health Diagnosing & Treating (83.5%), and Legal Services & Support (73.6%).
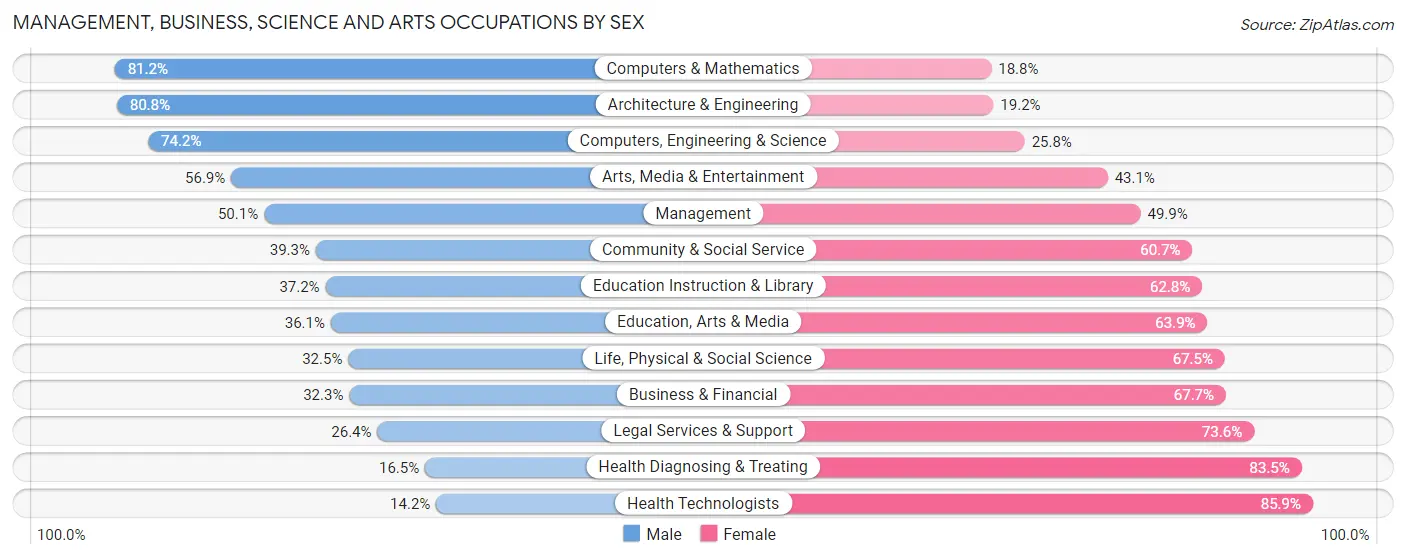
| Occupation | Male | Female |
| Management | 1,982 (50.1%) | 1,977 (49.9%) |
| Business & Financial | 632 (32.3%) | 1,326 (67.7%) |
| Computers, Engineering & Science | 1,466 (74.2%) | 509 (25.8%) |
| Computers & Mathematics | 864 (81.2%) | 200 (18.8%) |
| Architecture & Engineering | 512 (80.8%) | 122 (19.2%) |
| Life, Physical & Social Science | 90 (32.5%) | 187 (67.5%) |
| Community & Social Service | 2,499 (39.3%) | 3,866 (60.7%) |
| Education, Arts & Media | 428 (36.1%) | 757 (63.9%) |
| Legal Services & Support | 108 (26.4%) | 301 (73.6%) |
| Education Instruction & Library | 1,424 (37.2%) | 2,400 (62.8%) |
| Arts, Media & Entertainment | 539 (56.9%) | 408 (43.1%) |
| Health Diagnosing & Treating | 402 (16.5%) | 2,039 (83.5%) |
| Health Technologists | 200 (14.1%) | 1,213 (85.9%) |
| Total (Category) | 6,981 (41.8%) | 9,717 (58.2%) |
| Total (Overall) | 23,146 (49.6%) | 23,478 (50.4%) |
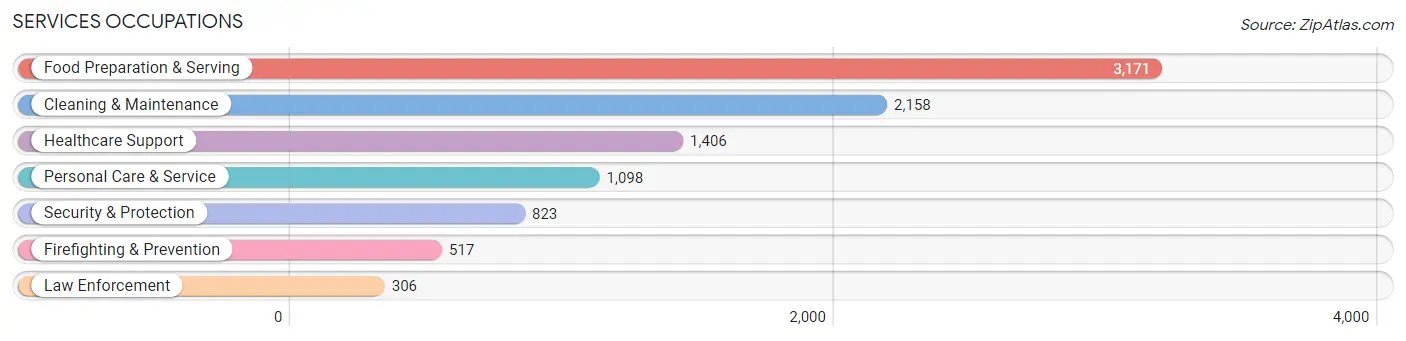
Services Occupations
The most common Services occupations in South Bend are Food Preparation & Serving (3,171 | 6.8%), Cleaning & Maintenance (2,158 | 4.6%), Healthcare Support (1,406 | 3.0%), Personal Care & Service (1,098 | 2.4%), and Security & Protection (823 | 1.8%).
Services Occupations by Sex
Within the Services occupations in South Bend, the most male-oriented occupations are Firefighting & Prevention (75.6%), Security & Protection (74.6%), and Law Enforcement (72.9%), while the most female-oriented occupations are Healthcare Support (85.4%), Personal Care & Service (81.4%), and Cleaning & Maintenance (57.0%).
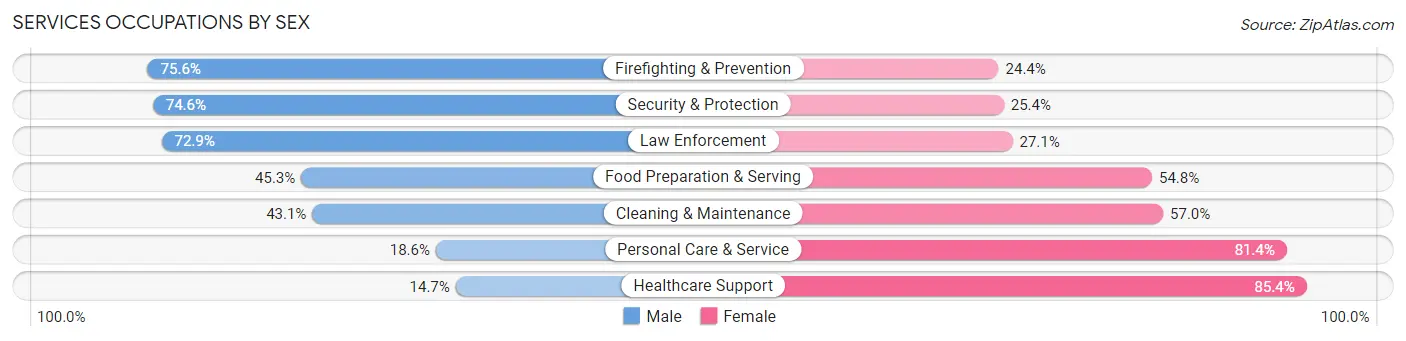
| Occupation | Male | Female |
| Healthcare Support | 206 (14.6%) | 1,200 (85.4%) |
| Security & Protection | 614 (74.6%) | 209 (25.4%) |
| Firefighting & Prevention | 391 (75.6%) | 126 (24.4%) |
| Law Enforcement | 223 (72.9%) | 83 (27.1%) |
| Food Preparation & Serving | 1,435 (45.3%) | 1,736 (54.7%) |
| Cleaning & Maintenance | 929 (43.0%) | 1,229 (57.0%) |
| Personal Care & Service | 204 (18.6%) | 894 (81.4%) |
| Total (Category) | 3,388 (39.1%) | 5,268 (60.9%) |
| Total (Overall) | 23,146 (49.6%) | 23,478 (50.4%) |
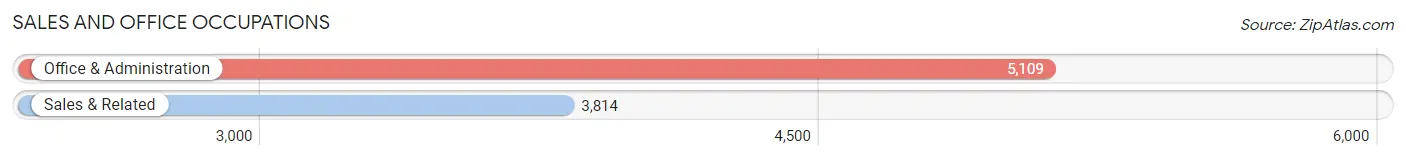
Sales and Office Occupations
The most common Sales and Office occupations in South Bend are Office & Administration (5,109 | 11.0%), and Sales & Related (3,814 | 8.2%).
Sales and Office Occupations by Sex
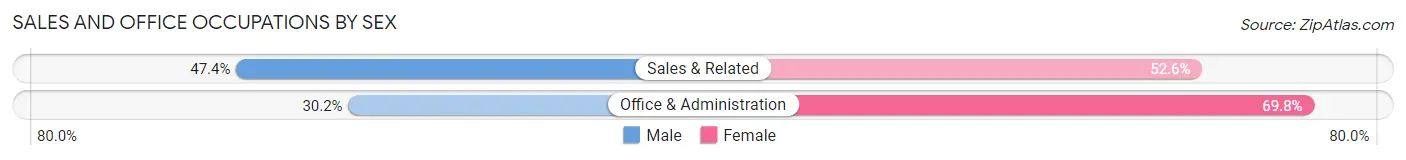
| Occupation | Male | Female |
| Sales & Related | 1,809 (47.4%) | 2,005 (52.6%) |
| Office & Administration | 1,542 (30.2%) | 3,567 (69.8%) |
| Total (Category) | 3,351 (37.6%) | 5,572 (62.5%) |
| Total (Overall) | 23,146 (49.6%) | 23,478 (50.4%) |
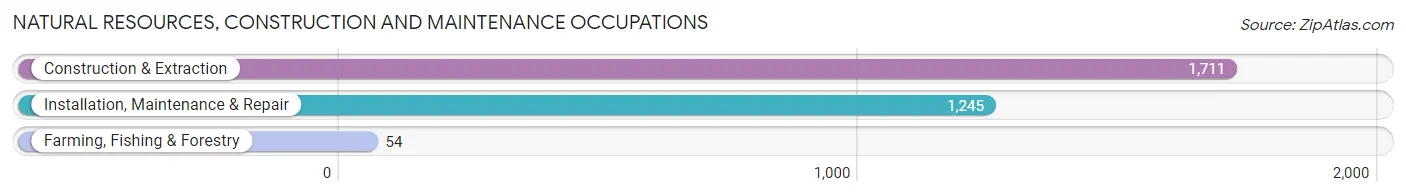
Natural Resources, Construction and Maintenance Occupations
The most common Natural Resources, Construction and Maintenance occupations in South Bend are Construction & Extraction (1,711 | 3.7%), Installation, Maintenance & Repair (1,245 | 2.7%), and Farming, Fishing & Forestry (54 | 0.1%).
Natural Resources, Construction and Maintenance Occupations by Sex
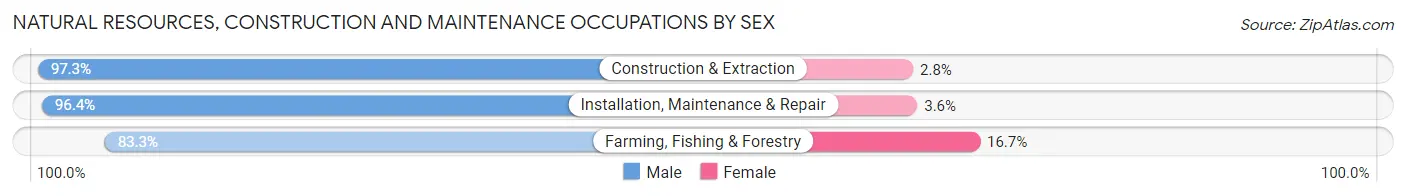
| Occupation | Male | Female |
| Farming, Fishing & Forestry | 45 (83.3%) | 9 (16.7%) |
| Construction & Extraction | 1,664 (97.3%) | 47 (2.8%) |
| Installation, Maintenance & Repair | 1,200 (96.4%) | 45 (3.6%) |
| Total (Category) | 2,909 (96.6%) | 101 (3.4%) |
| Total (Overall) | 23,146 (49.6%) | 23,478 (50.4%) |
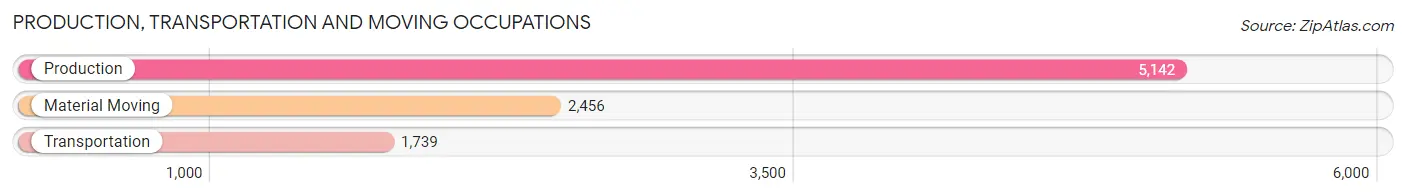
Production, Transportation and Moving Occupations
The most common Production, Transportation and Moving occupations in South Bend are Production (5,142 | 11.0%), Material Moving (2,456 | 5.3%), and Transportation (1,739 | 3.7%).
Production, Transportation and Moving Occupations by Sex
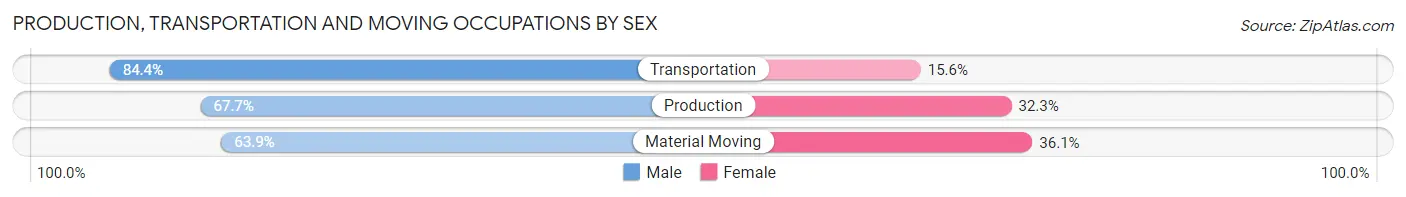
| Occupation | Male | Female |
| Production | 3,481 (67.7%) | 1,661 (32.3%) |
| Transportation | 1,467 (84.4%) | 272 (15.6%) |
| Material Moving | 1,569 (63.9%) | 887 (36.1%) |
| Total (Category) | 6,517 (69.8%) | 2,820 (30.2%) |
| Total (Overall) | 23,146 (49.6%) | 23,478 (50.4%) |
Employment Industries by Sex in South Bend
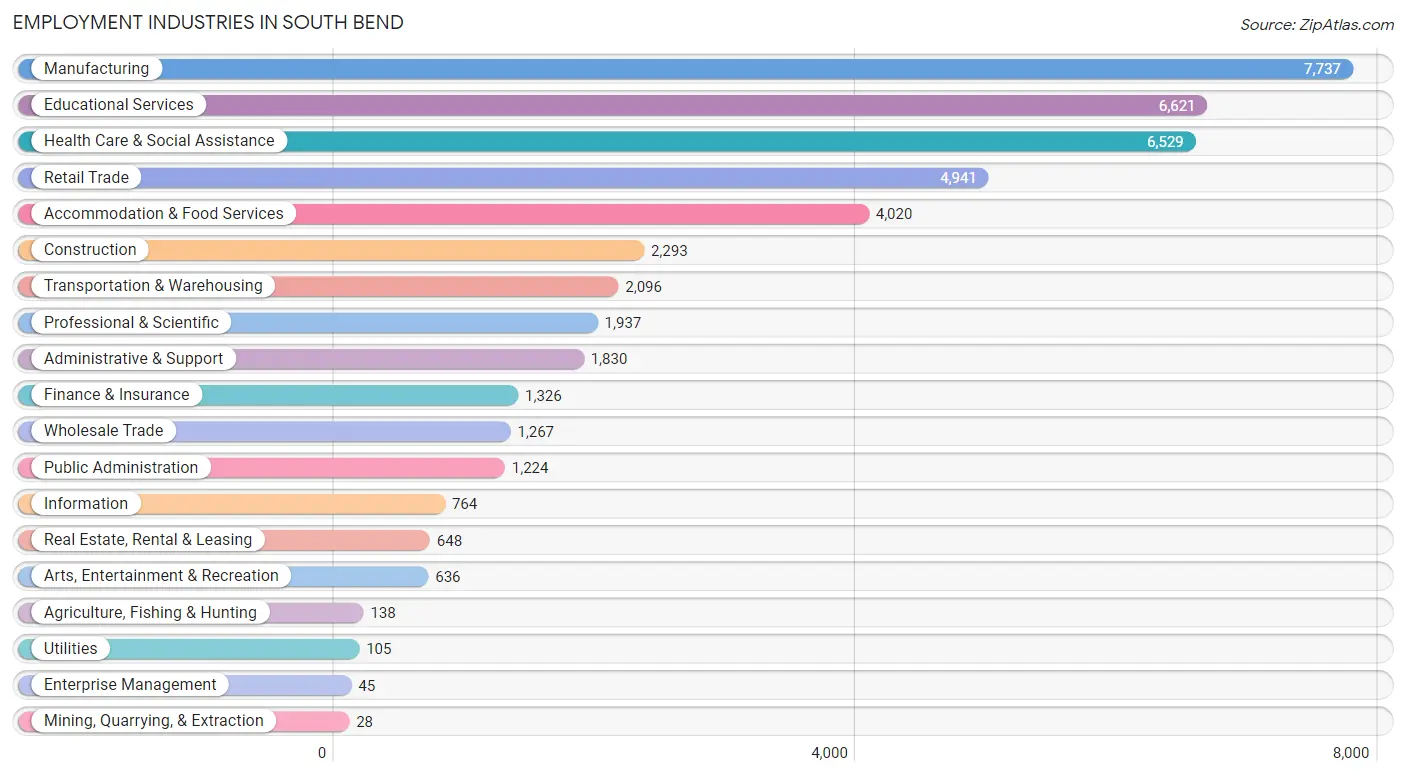
Employment Industries in South Bend
The major employment industries in South Bend include Manufacturing (7,737 | 16.6%), Educational Services (6,621 | 14.2%), Health Care & Social Assistance (6,529 | 14.0%), Retail Trade (4,941 | 10.6%), and Accommodation & Food Services (4,020 | 8.6%).
Employment Industries by Sex in South Bend
The South Bend industries that see more men than women are Mining, Quarrying, & Extraction (100.0%), Construction (93.6%), and Agriculture, Fishing & Hunting (80.4%), whereas the industries that tend to have a higher number of women are Enterprise Management (97.8%), Health Care & Social Assistance (80.8%), and Finance & Insurance (63.1%).
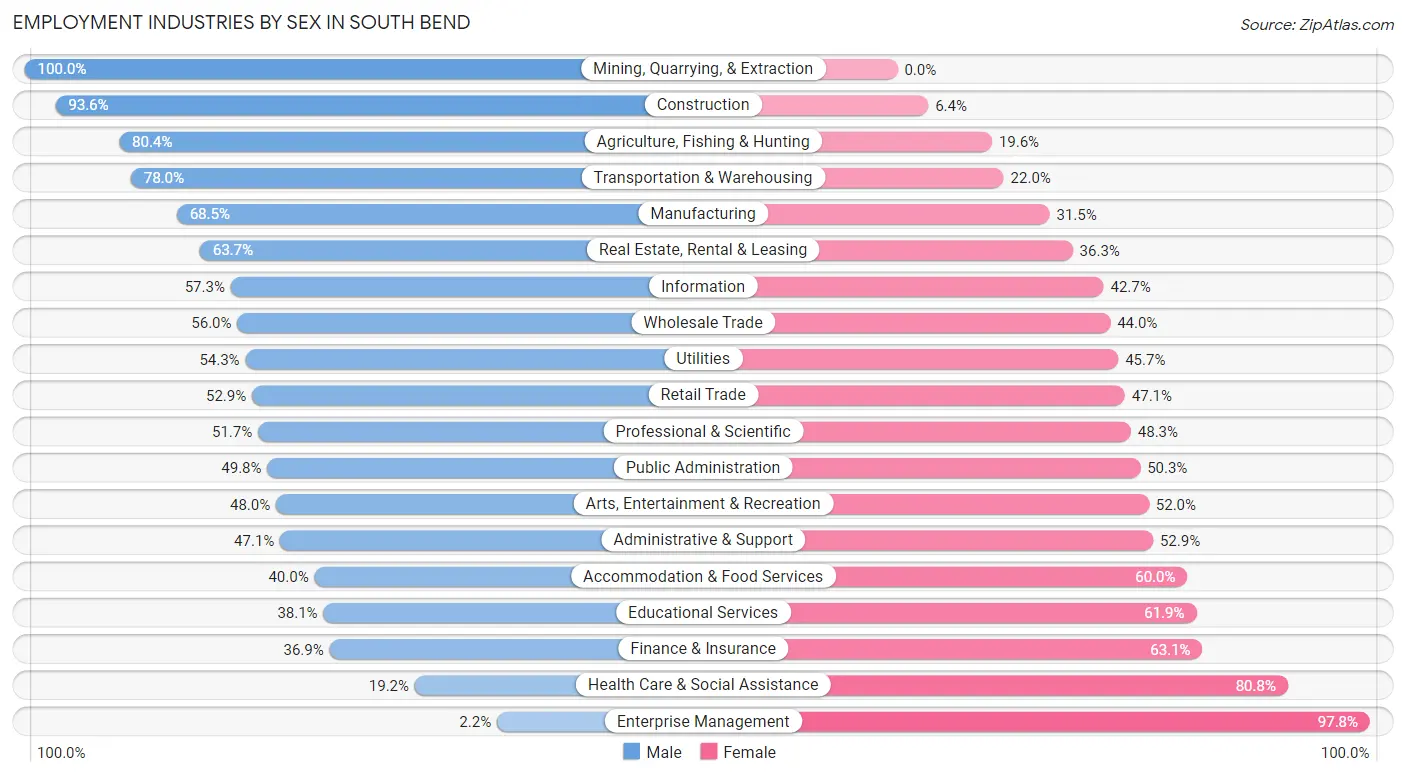
| Industry | Male | Female |
| Agriculture, Fishing & Hunting | 111 (80.4%) | 27 (19.6%) |
| Mining, Quarrying, & Extraction | 28 (100.0%) | 0 (0.0%) |
| Construction | 2,147 (93.6%) | 146 (6.4%) |
| Manufacturing | 5,301 (68.5%) | 2,436 (31.5%) |
| Wholesale Trade | 709 (56.0%) | 558 (44.0%) |
| Retail Trade | 2,615 (52.9%) | 2,326 (47.1%) |
| Transportation & Warehousing | 1,635 (78.0%) | 461 (22.0%) |
| Utilities | 57 (54.3%) | 48 (45.7%) |
| Information | 438 (57.3%) | 326 (42.7%) |
| Finance & Insurance | 489 (36.9%) | 837 (63.1%) |
| Real Estate, Rental & Leasing | 413 (63.7%) | 235 (36.3%) |
| Professional & Scientific | 1,001 (51.7%) | 936 (48.3%) |
| Enterprise Management | 1 (2.2%) | 44 (97.8%) |
| Administrative & Support | 862 (47.1%) | 968 (52.9%) |
| Educational Services | 2,525 (38.1%) | 4,096 (61.9%) |
| Health Care & Social Assistance | 1,255 (19.2%) | 5,274 (80.8%) |
| Arts, Entertainment & Recreation | 305 (48.0%) | 331 (52.0%) |
| Accommodation & Food Services | 1,608 (40.0%) | 2,412 (60.0%) |
| Public Administration | 609 (49.7%) | 615 (50.2%) |
| Total | 23,146 (49.6%) | 23,478 (50.4%) |
Education in South Bend
School Enrollment in South Bend
The most common levels of schooling among the 29,103 students in South Bend are middle school (6,849 | 23.5%), high school (5,834 | 20.1%), and elementary school (5,661 | 19.5%).
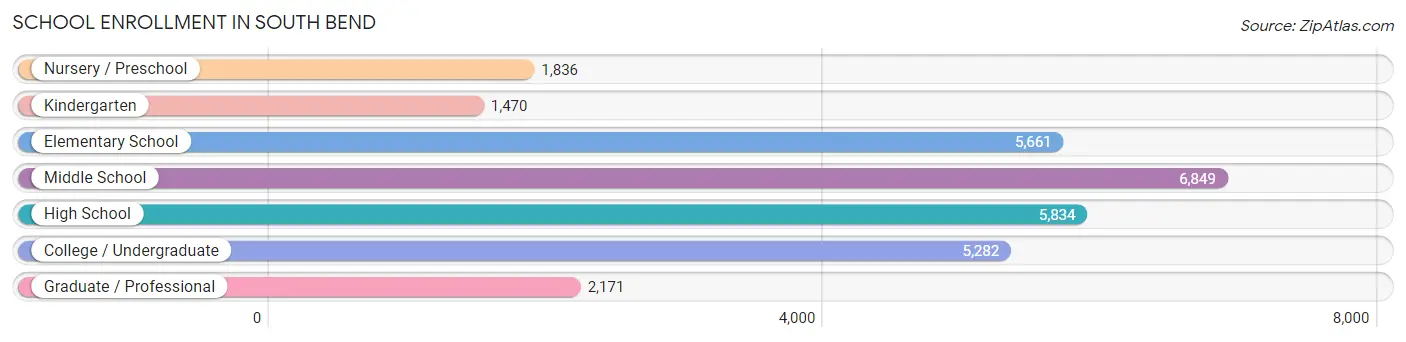
| School Level | # Students | % Students |
| Nursery / Preschool | 1,836 | 6.3% |
| Kindergarten | 1,470 | 5.1% |
| Elementary School | 5,661 | 19.5% |
| Middle School | 6,849 | 23.5% |
| High School | 5,834 | 20.1% |
| College / Undergraduate | 5,282 | 18.1% |
| Graduate / Professional | 2,171 | 7.5% |
| Total | 29,103 | 100.0% |
School Enrollment by Age by Funding Source in South Bend
Out of a total of 29,103 students who are enrolled in schools in South Bend, 7,974 (27.4%) attend a private institution, while the remaining 21,129 (72.6%) are enrolled in public schools. The age group of 3 to 4 year olds has the highest likelihood of being enrolled in private schools, with 722 (61.2% in the age bracket) enrolled. Conversely, the age group of 15 to 17 year olds has the lowest likelihood of being enrolled in a private school, with 3,747 (84.7% in the age bracket) attending a public institution.
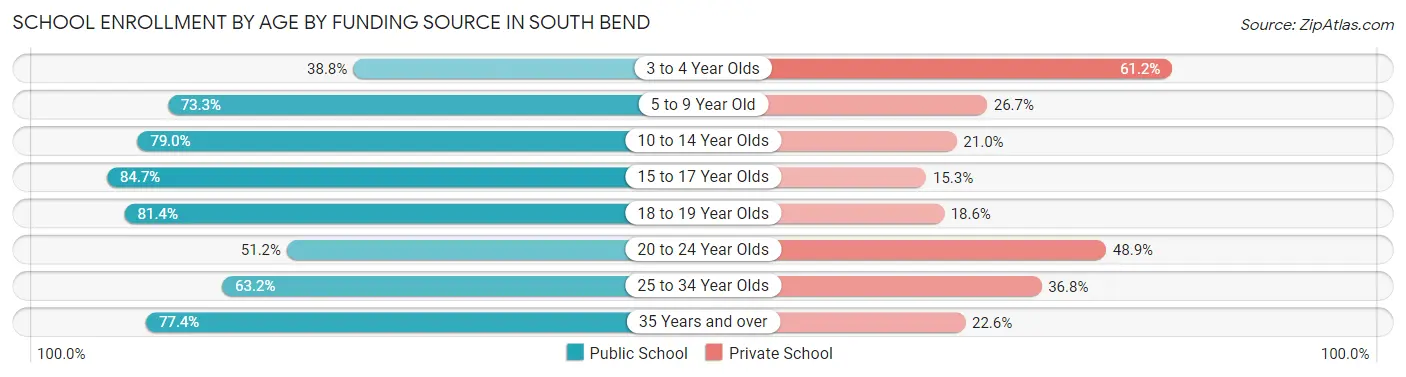
| Age Bracket | Public School | Private School |
| 3 to 4 Year Olds | 458 (38.8%) | 722 (61.2%) |
| 5 to 9 Year Old | 5,138 (73.3%) | 1,868 (26.7%) |
| 10 to 14 Year Olds | 6,289 (79.0%) | 1,672 (21.0%) |
| 15 to 17 Year Olds | 3,747 (84.7%) | 679 (15.3%) |
| 18 to 19 Year Olds | 1,424 (81.4%) | 326 (18.6%) |
| 20 to 24 Year Olds | 1,696 (51.1%) | 1,620 (48.8%) |
| 25 to 34 Year Olds | 1,415 (63.2%) | 824 (36.8%) |
| 35 Years and over | 948 (77.4%) | 277 (22.6%) |
| Total | 21,129 (72.6%) | 7,974 (27.4%) |
Educational Attainment by Field of Study in South Bend
Business (3,625 | 17.5%), liberal arts & history (2,585 | 12.5%), education (2,532 | 12.3%), social sciences (1,994 | 9.7%), and science & technology (1,831 | 8.9%) are the most common fields of study among 20,659 individuals in South Bend who have obtained a bachelor's degree or higher.
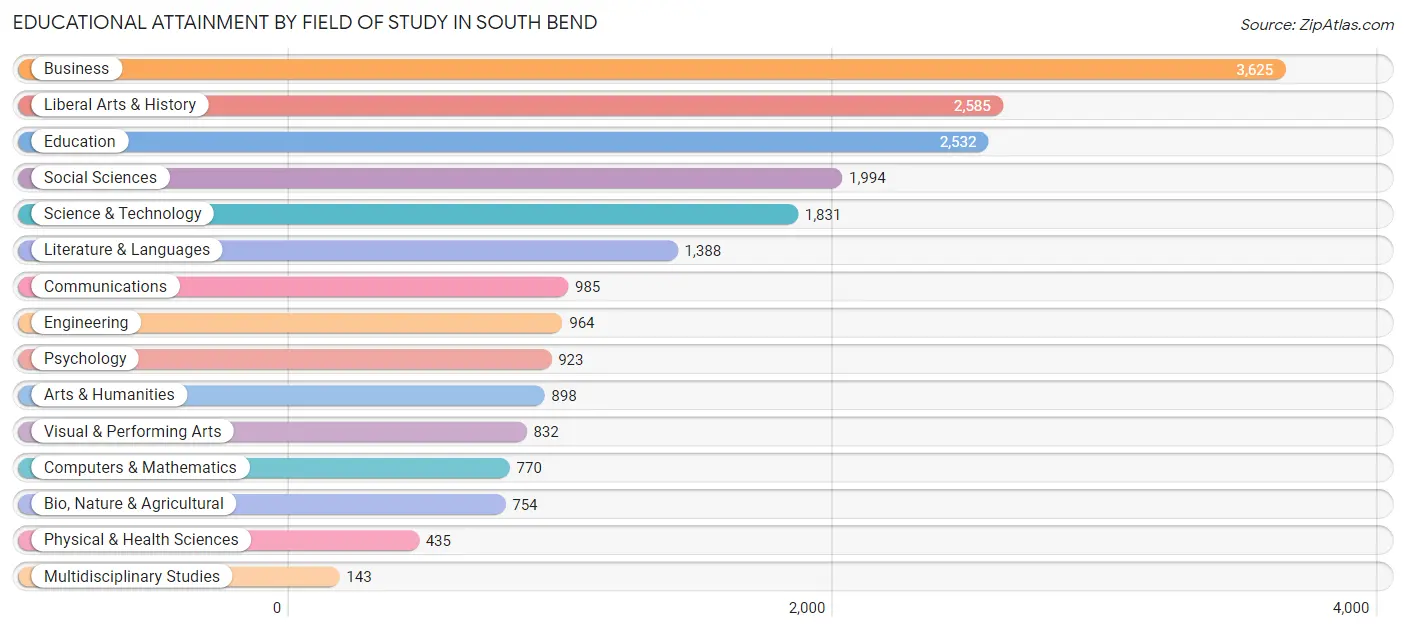
| Field of Study | # Graduates | % Graduates |
| Computers & Mathematics | 770 | 3.7% |
| Bio, Nature & Agricultural | 754 | 3.6% |
| Physical & Health Sciences | 435 | 2.1% |
| Psychology | 923 | 4.5% |
| Social Sciences | 1,994 | 9.7% |
| Engineering | 964 | 4.7% |
| Multidisciplinary Studies | 143 | 0.7% |
| Science & Technology | 1,831 | 8.9% |
| Business | 3,625 | 17.5% |
| Education | 2,532 | 12.3% |
| Literature & Languages | 1,388 | 6.7% |
| Liberal Arts & History | 2,585 | 12.5% |
| Visual & Performing Arts | 832 | 4.0% |
| Communications | 985 | 4.8% |
| Arts & Humanities | 898 | 4.3% |
| Total | 20,659 | 100.0% |
Transportation & Commute in South Bend
Vehicle Availability by Sex in South Bend
The most prevalent vehicle ownership categories in South Bend are males with 2 vehicles (10,638, accounting for 47.1%) and females with 2 vehicles (9,421, making up 47.4%).
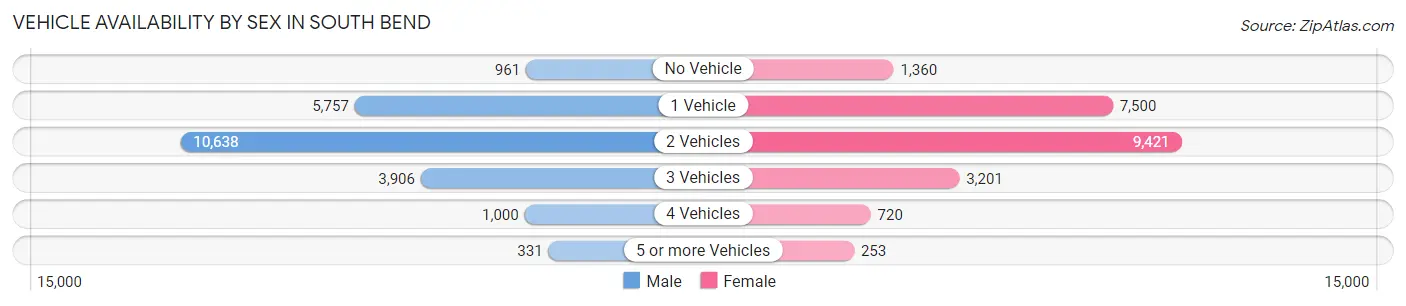
| Vehicles Available | Male | Female |
| No Vehicle | 961 (4.3%) | 1,360 (6.1%) |
| 1 Vehicle | 5,757 (25.5%) | 7,500 (33.4%) |
| 2 Vehicles | 10,638 (47.1%) | 9,421 (42.0%) |
| 3 Vehicles | 3,906 (17.3%) | 3,201 (14.3%) |
| 4 Vehicles | 1,000 (4.4%) | 720 (3.2%) |
| 5 or more Vehicles | 331 (1.5%) | 253 (1.1%) |
| Total | 22,593 (100.0%) | 22,455 (100.0%) |
Commute Time in South Bend
The most frequently occuring commute durations in South Bend are 15 to 19 minutes (8,649 commuters, 20.9%), 10 to 14 minutes (7,687 commuters, 18.6%), and 5 to 9 minutes (5,966 commuters, 14.4%).
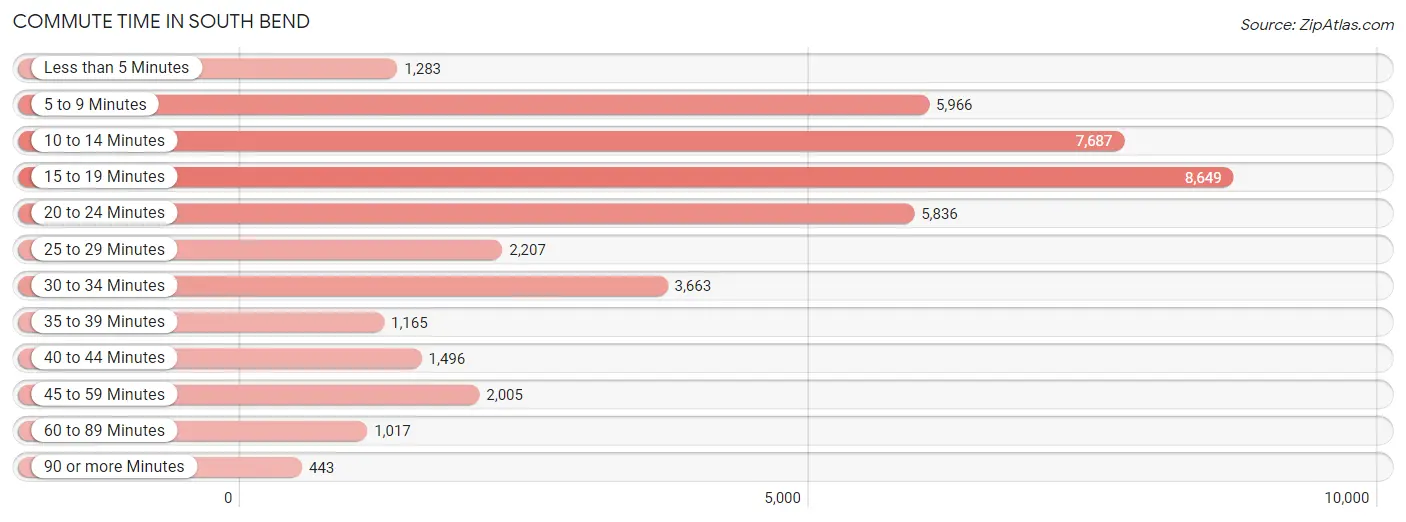
| Commute Time | # Commuters | % Commuters |
| Less than 5 Minutes | 1,283 | 3.1% |
| 5 to 9 Minutes | 5,966 | 14.4% |
| 10 to 14 Minutes | 7,687 | 18.6% |
| 15 to 19 Minutes | 8,649 | 20.9% |
| 20 to 24 Minutes | 5,836 | 14.1% |
| 25 to 29 Minutes | 2,207 | 5.3% |
| 30 to 34 Minutes | 3,663 | 8.8% |
| 35 to 39 Minutes | 1,165 | 2.8% |
| 40 to 44 Minutes | 1,496 | 3.6% |
| 45 to 59 Minutes | 2,005 | 4.8% |
| 60 to 89 Minutes | 1,017 | 2.5% |
| 90 or more Minutes | 443 | 1.1% |
Commute Time by Sex in South Bend
The most common commute times in South Bend are 15 to 19 minutes (3,838 commuters, 18.1%) for males and 15 to 19 minutes (4,811 commuters, 23.8%) for females.
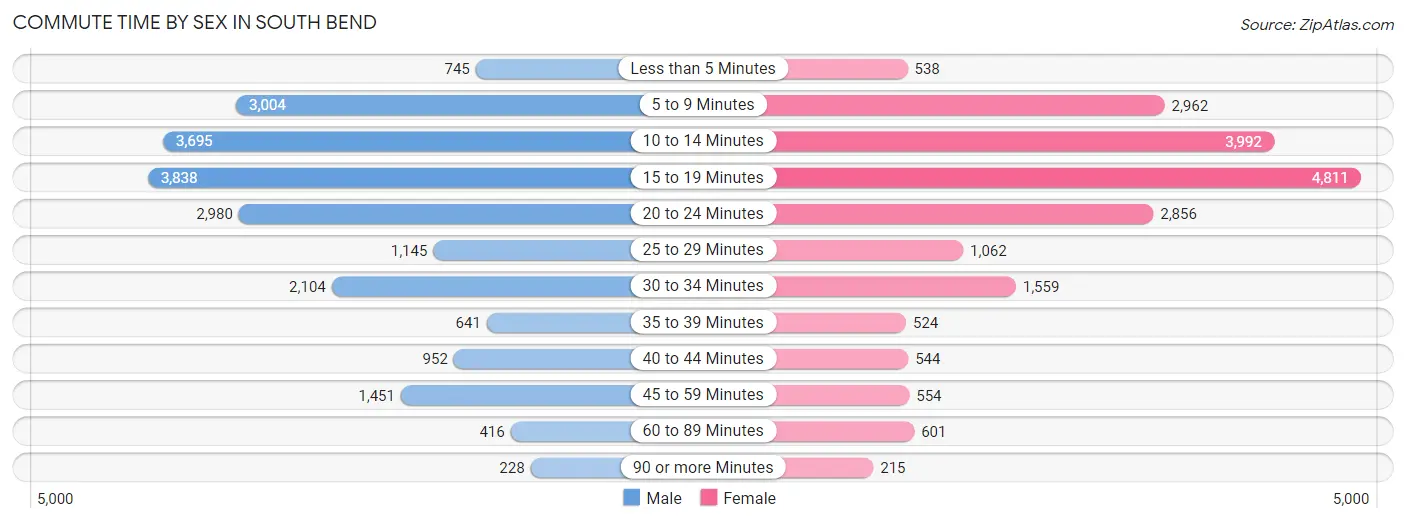
| Commute Time | Male | Female |
| Less than 5 Minutes | 745 (3.5%) | 538 (2.7%) |
| 5 to 9 Minutes | 3,004 (14.2%) | 2,962 (14.6%) |
| 10 to 14 Minutes | 3,695 (17.4%) | 3,992 (19.7%) |
| 15 to 19 Minutes | 3,838 (18.1%) | 4,811 (23.8%) |
| 20 to 24 Minutes | 2,980 (14.1%) | 2,856 (14.1%) |
| 25 to 29 Minutes | 1,145 (5.4%) | 1,062 (5.2%) |
| 30 to 34 Minutes | 2,104 (9.9%) | 1,559 (7.7%) |
| 35 to 39 Minutes | 641 (3.0%) | 524 (2.6%) |
| 40 to 44 Minutes | 952 (4.5%) | 544 (2.7%) |
| 45 to 59 Minutes | 1,451 (6.8%) | 554 (2.7%) |
| 60 to 89 Minutes | 416 (2.0%) | 601 (3.0%) |
| 90 or more Minutes | 228 (1.1%) | 215 (1.1%) |
Time of Departure to Work by Sex in South Bend
The most frequent times of departure to work in South Bend are 7:30 AM to 7:59 AM (2,776, 13.1%) for males and 7:30 AM to 7:59 AM (3,116, 15.4%) for females.
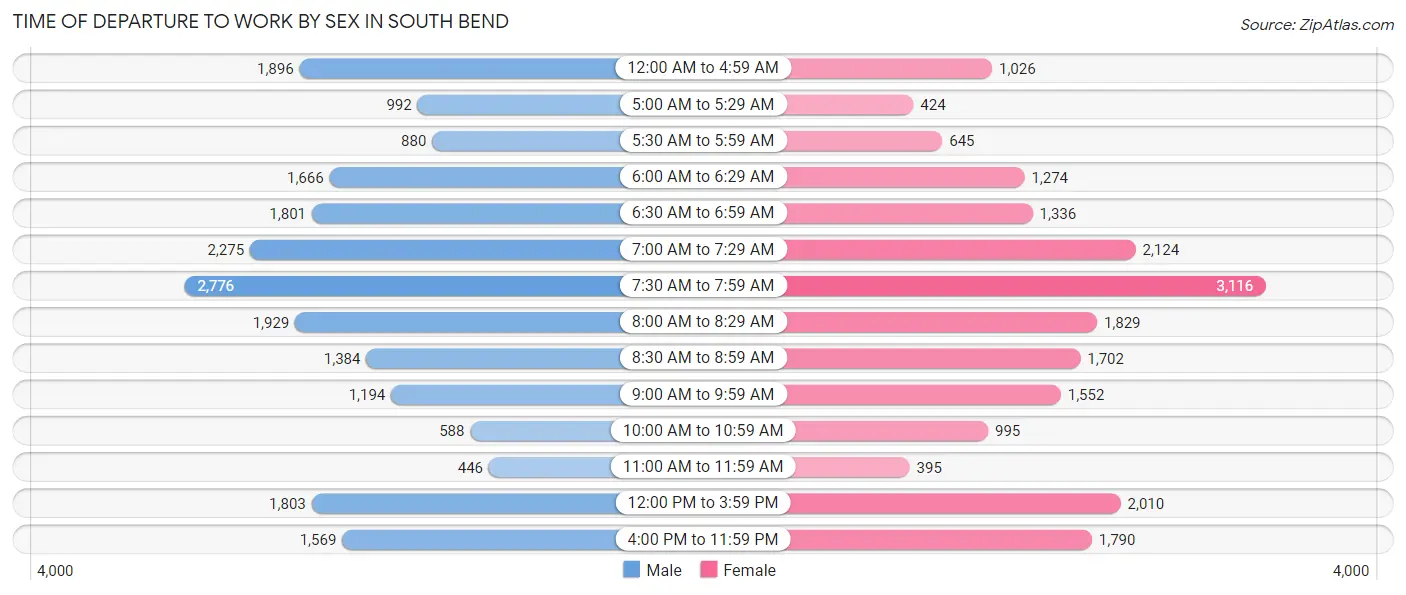
| Time of Departure | Male | Female |
| 12:00 AM to 4:59 AM | 1,896 (8.9%) | 1,026 (5.1%) |
| 5:00 AM to 5:29 AM | 992 (4.7%) | 424 (2.1%) |
| 5:30 AM to 5:59 AM | 880 (4.2%) | 645 (3.2%) |
| 6:00 AM to 6:29 AM | 1,666 (7.9%) | 1,274 (6.3%) |
| 6:30 AM to 6:59 AM | 1,801 (8.5%) | 1,336 (6.6%) |
| 7:00 AM to 7:29 AM | 2,275 (10.7%) | 2,124 (10.5%) |
| 7:30 AM to 7:59 AM | 2,776 (13.1%) | 3,116 (15.4%) |
| 8:00 AM to 8:29 AM | 1,929 (9.1%) | 1,829 (9.0%) |
| 8:30 AM to 8:59 AM | 1,384 (6.5%) | 1,702 (8.4%) |
| 9:00 AM to 9:59 AM | 1,194 (5.6%) | 1,552 (7.7%) |
| 10:00 AM to 10:59 AM | 588 (2.8%) | 995 (4.9%) |
| 11:00 AM to 11:59 AM | 446 (2.1%) | 395 (1.9%) |
| 12:00 PM to 3:59 PM | 1,803 (8.5%) | 2,010 (9.9%) |
| 4:00 PM to 11:59 PM | 1,569 (7.4%) | 1,790 (8.8%) |
| Total | 21,199 (100.0%) | 20,218 (100.0%) |
Housing Occupancy in South Bend
Occupancy by Ownership in South Bend
Of the total 40,559 dwellings in South Bend, owner-occupied units account for 23,731 (58.5%), while renter-occupied units make up 16,828 (41.5%).
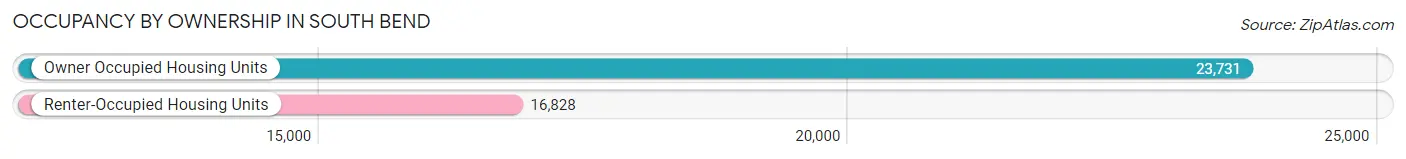
| Occupancy | # Housing Units | % Housing Units |
| Owner Occupied Housing Units | 23,731 | 58.5% |
| Renter-Occupied Housing Units | 16,828 | 41.5% |
| Total Occupied Housing Units | 40,559 | 100.0% |
Occupancy by Household Size in South Bend
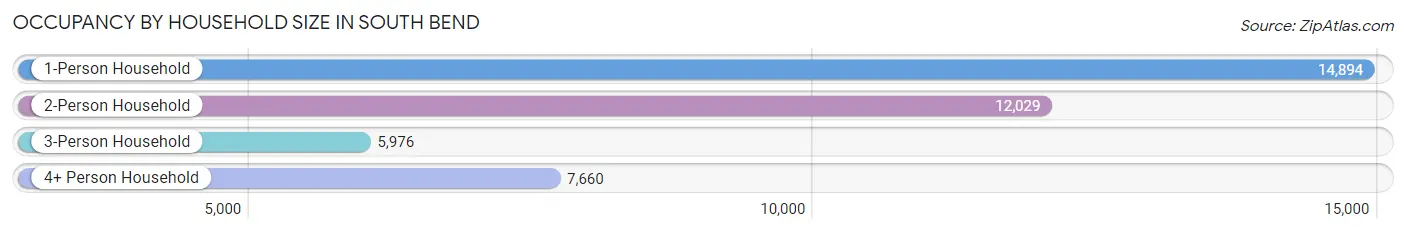
| Household Size | # Housing Units | % Housing Units |
| 1-Person Household | 14,894 | 36.7% |
| 2-Person Household | 12,029 | 29.7% |
| 3-Person Household | 5,976 | 14.7% |
| 4+ Person Household | 7,660 | 18.9% |
| Total Housing Units | 40,559 | 100.0% |
Occupancy by Ownership by Household Size in South Bend
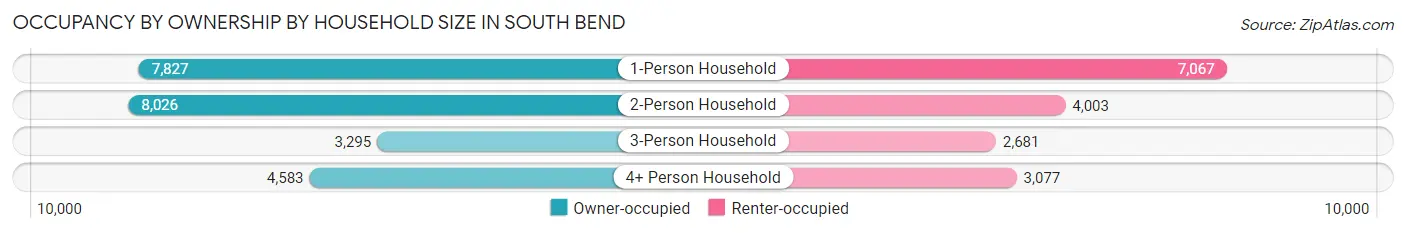
| Household Size | Owner-occupied | Renter-occupied |
| 1-Person Household | 7,827 (52.5%) | 7,067 (47.4%) |
| 2-Person Household | 8,026 (66.7%) | 4,003 (33.3%) |
| 3-Person Household | 3,295 (55.1%) | 2,681 (44.9%) |
| 4+ Person Household | 4,583 (59.8%) | 3,077 (40.2%) |
| Total Housing Units | 23,731 (58.5%) | 16,828 (41.5%) |
Occupancy by Educational Attainment in South Bend
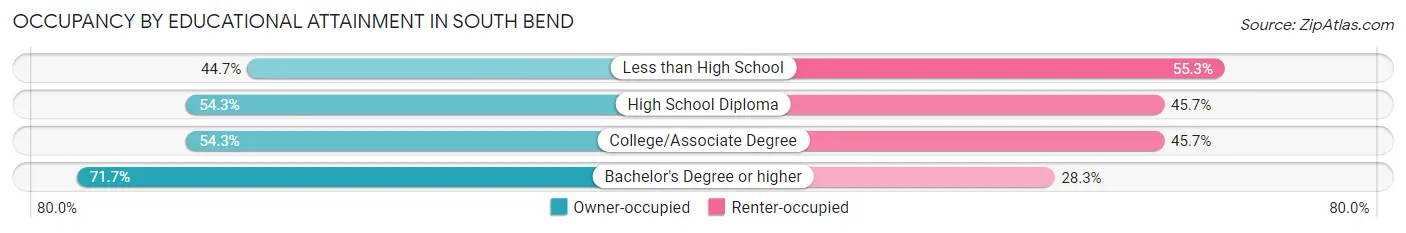
| Household Size | Owner-occupied | Renter-occupied |
| Less than High School | 2,036 (44.7%) | 2,518 (55.3%) |
| High School Diploma | 6,226 (54.3%) | 5,231 (45.7%) |
| College/Associate Degree | 6,674 (54.3%) | 5,611 (45.7%) |
| Bachelor's Degree or higher | 8,795 (71.7%) | 3,468 (28.3%) |
Occupancy by Age of Householder in South Bend
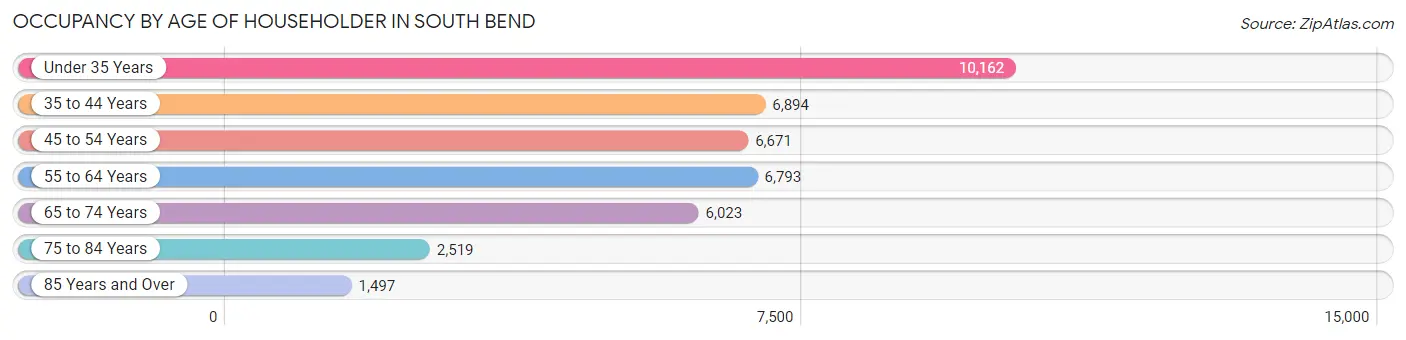
| Age Bracket | # Households | % Households |
| Under 35 Years | 10,162 | 25.1% |
| 35 to 44 Years | 6,894 | 17.0% |
| 45 to 54 Years | 6,671 | 16.5% |
| 55 to 64 Years | 6,793 | 16.8% |
| 65 to 74 Years | 6,023 | 14.8% |
| 75 to 84 Years | 2,519 | 6.2% |
| 85 Years and Over | 1,497 | 3.7% |
| Total | 40,559 | 100.0% |
Housing Finances in South Bend
Median Income by Occupancy in South Bend
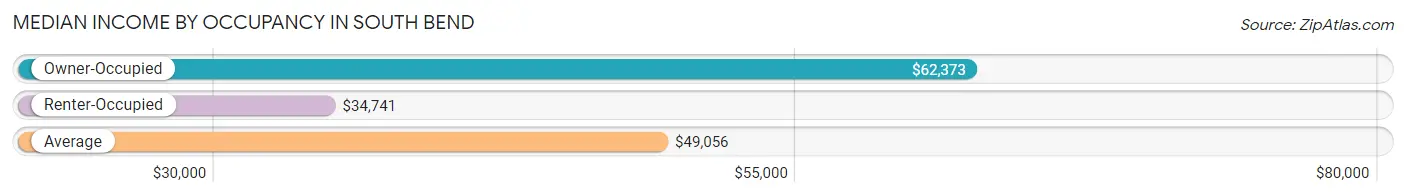
| Occupancy Type | # Households | Median Income |
| Owner-Occupied | 23,731 (58.5%) | $62,373 |
| Renter-Occupied | 16,828 (41.5%) | $34,741 |
| Average | 40,559 (100.0%) | $49,056 |
Occupancy by Householder Income Bracket in South Bend
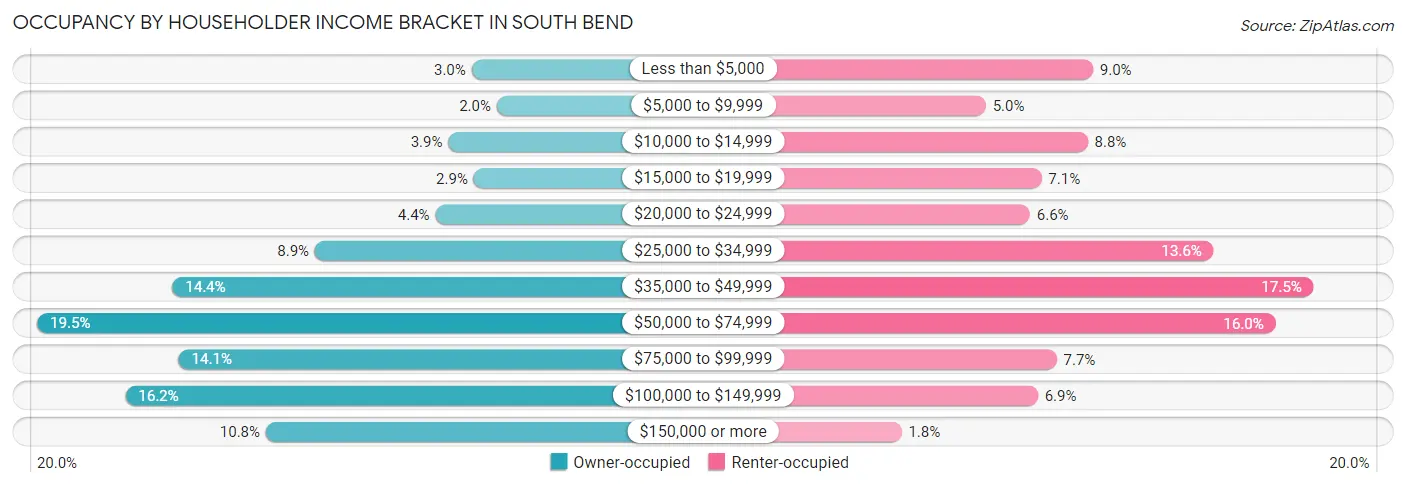
| Income Bracket | Owner-occupied | Renter-occupied |
| Less than $5,000 | 704 (3.0%) | 1,521 (9.0%) |
| $5,000 to $9,999 | 477 (2.0%) | 834 (5.0%) |
| $10,000 to $14,999 | 916 (3.9%) | 1,488 (8.8%) |
| $15,000 to $19,999 | 685 (2.9%) | 1,192 (7.1%) |
| $20,000 to $24,999 | 1,032 (4.3%) | 1,118 (6.6%) |
| $25,000 to $34,999 | 2,121 (8.9%) | 2,295 (13.6%) |
| $35,000 to $49,999 | 3,409 (14.4%) | 2,937 (17.4%) |
| $50,000 to $74,999 | 4,633 (19.5%) | 2,692 (16.0%) |
| $75,000 to $99,999 | 3,353 (14.1%) | 1,289 (7.7%) |
| $100,000 to $149,999 | 3,836 (16.2%) | 1,168 (6.9%) |
| $150,000 or more | 2,565 (10.8%) | 294 (1.8%) |
| Total | 23,731 (100.0%) | 16,828 (100.0%) |
Monthly Housing Cost Tiers in South Bend
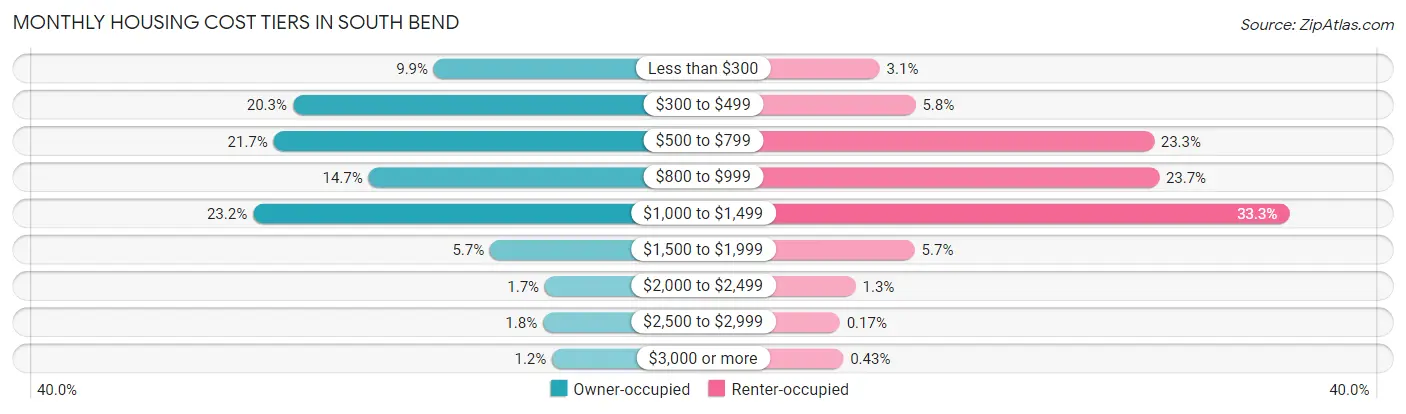
| Monthly Cost | Owner-occupied | Renter-occupied |
| Less than $300 | 2,341 (9.9%) | 524 (3.1%) |
| $300 to $499 | 4,806 (20.3%) | 967 (5.8%) |
| $500 to $799 | 5,139 (21.7%) | 3,921 (23.3%) |
| $800 to $999 | 3,482 (14.7%) | 3,985 (23.7%) |
| $1,000 to $1,499 | 5,502 (23.2%) | 5,599 (33.3%) |
| $1,500 to $1,999 | 1,358 (5.7%) | 958 (5.7%) |
| $2,000 to $2,499 | 398 (1.7%) | 225 (1.3%) |
| $2,500 to $2,999 | 433 (1.8%) | 29 (0.2%) |
| $3,000 or more | 272 (1.1%) | 72 (0.4%) |
| Total | 23,731 (100.0%) | 16,828 (100.0%) |
Physical Housing Characteristics in South Bend
Housing Structures in South Bend
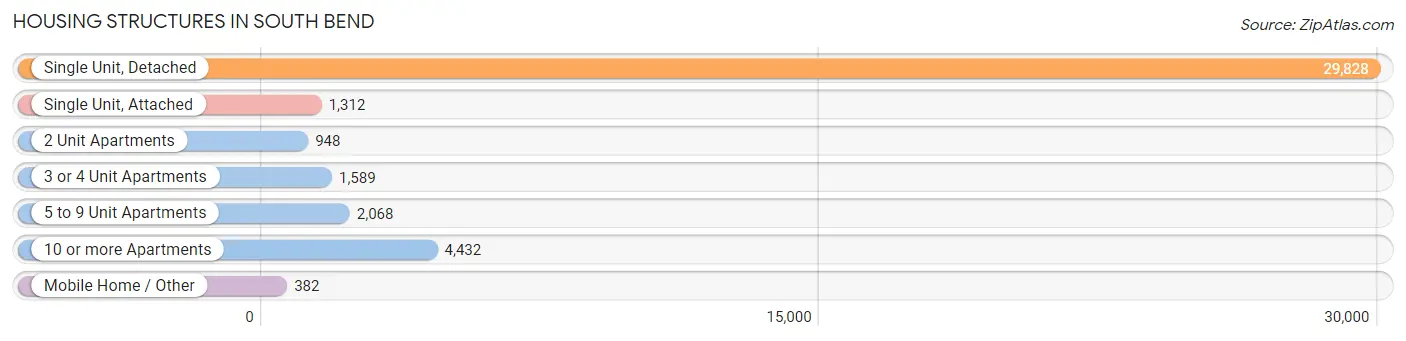
| Structure Type | # Housing Units | % Housing Units |
| Single Unit, Detached | 29,828 | 73.5% |
| Single Unit, Attached | 1,312 | 3.2% |
| 2 Unit Apartments | 948 | 2.3% |
| 3 or 4 Unit Apartments | 1,589 | 3.9% |
| 5 to 9 Unit Apartments | 2,068 | 5.1% |
| 10 or more Apartments | 4,432 | 10.9% |
| Mobile Home / Other | 382 | 0.9% |
| Total | 40,559 | 100.0% |
Housing Structures by Occupancy in South Bend
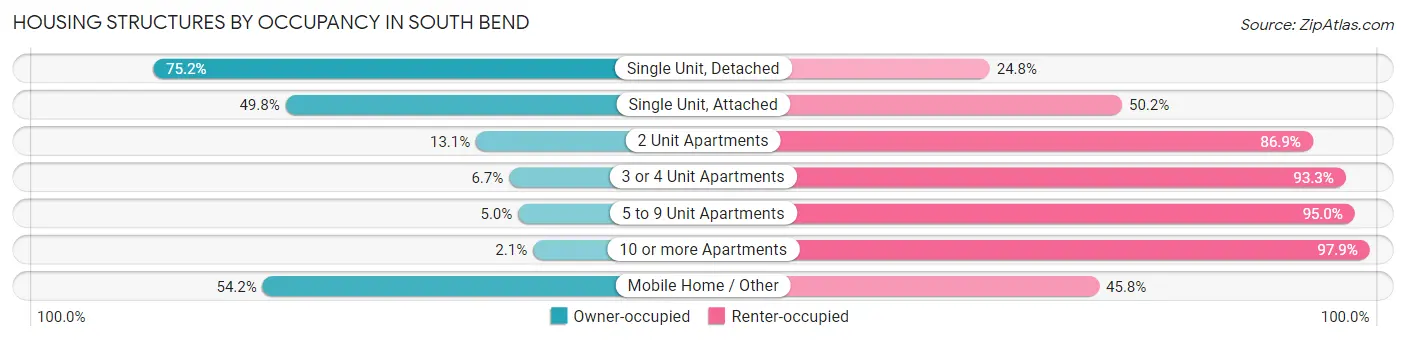
| Structure Type | Owner-occupied | Renter-occupied |
| Single Unit, Detached | 22,443 (75.2%) | 7,385 (24.8%) |
| Single Unit, Attached | 653 (49.8%) | 659 (50.2%) |
| 2 Unit Apartments | 124 (13.1%) | 824 (86.9%) |
| 3 or 4 Unit Apartments | 107 (6.7%) | 1,482 (93.3%) |
| 5 to 9 Unit Apartments | 103 (5.0%) | 1,965 (95.0%) |
| 10 or more Apartments | 94 (2.1%) | 4,338 (97.9%) |
| Mobile Home / Other | 207 (54.2%) | 175 (45.8%) |
| Total | 23,731 (58.5%) | 16,828 (41.5%) |
Housing Structures by Number of Rooms in South Bend
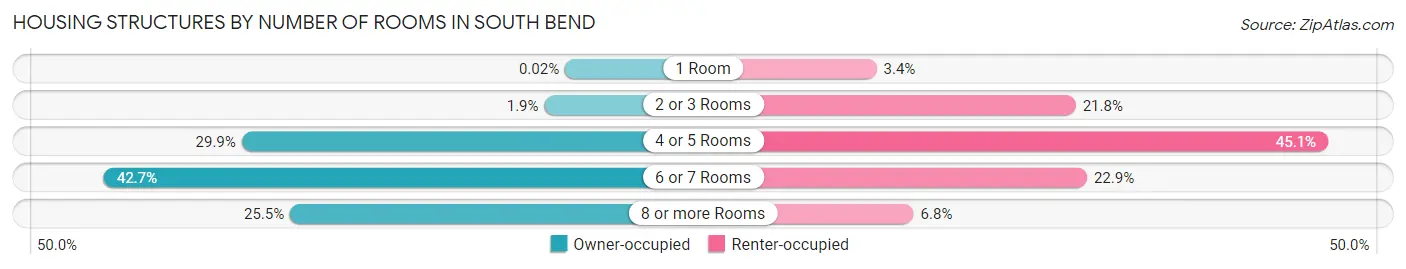
| Number of Rooms | Owner-occupied | Renter-occupied |
| 1 Room | 4 (0.0%) | 571 (3.4%) |
| 2 or 3 Rooms | 458 (1.9%) | 3,670 (21.8%) |
| 4 or 5 Rooms | 7,102 (29.9%) | 7,594 (45.1%) |
| 6 or 7 Rooms | 10,127 (42.7%) | 3,846 (22.9%) |
| 8 or more Rooms | 6,040 (25.5%) | 1,147 (6.8%) |
| Total | 23,731 (100.0%) | 16,828 (100.0%) |
Housing Structure by Heating Type in South Bend
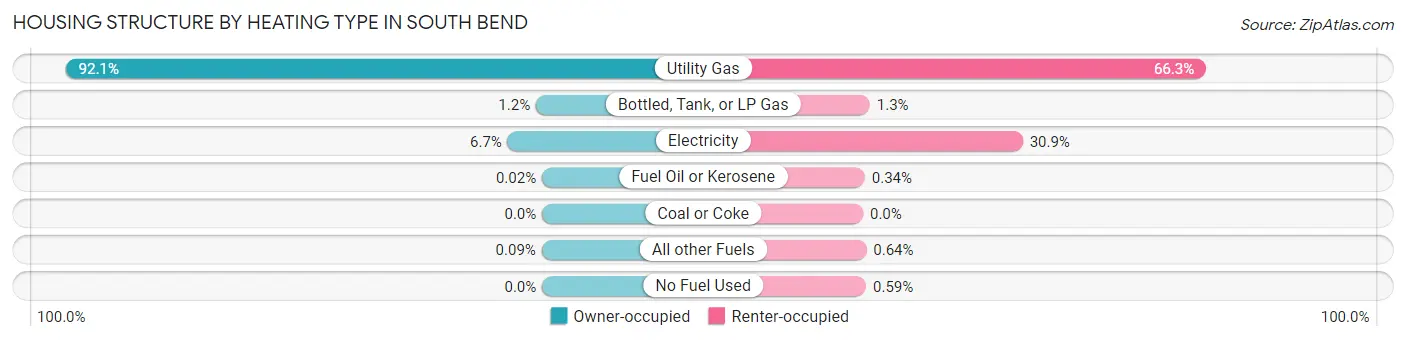
| Heating Type | Owner-occupied | Renter-occupied |
| Utility Gas | 21,848 (92.1%) | 11,152 (66.3%) |
| Bottled, Tank, or LP Gas | 279 (1.2%) | 221 (1.3%) |
| Electricity | 1,578 (6.7%) | 5,191 (30.8%) |
| Fuel Oil or Kerosene | 5 (0.0%) | 58 (0.3%) |
| Coal or Coke | 0 (0.0%) | 0 (0.0%) |
| All other Fuels | 21 (0.1%) | 107 (0.6%) |
| No Fuel Used | 0 (0.0%) | 99 (0.6%) |
| Total | 23,731 (100.0%) | 16,828 (100.0%) |
Household Vehicle Usage in South Bend
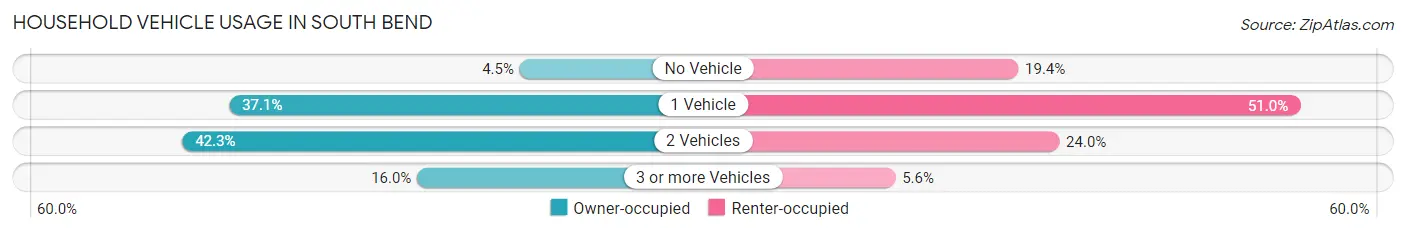
| Vehicles per Household | Owner-occupied | Renter-occupied |
| No Vehicle | 1,076 (4.5%) | 3,264 (19.4%) |
| 1 Vehicle | 8,805 (37.1%) | 8,577 (51.0%) |
| 2 Vehicles | 10,048 (42.3%) | 4,039 (24.0%) |
| 3 or more Vehicles | 3,802 (16.0%) | 948 (5.6%) |
| Total | 23,731 (100.0%) | 16,828 (100.0%) |
Real Estate & Mortgages in South Bend
Real Estate and Mortgage Overview in South Bend
| Characteristic | Without Mortgage | With Mortgage |
| Housing Units | 9,971 | 13,760 |
| Median Property Value | $91,200 | $125,100 |
| Median Household Income | $49,767 | $1,649 |
| Monthly Housing Costs | $415 | $237 |
| Real Estate Taxes | $1,026 | $405 |
Property Value by Mortgage Status in South Bend
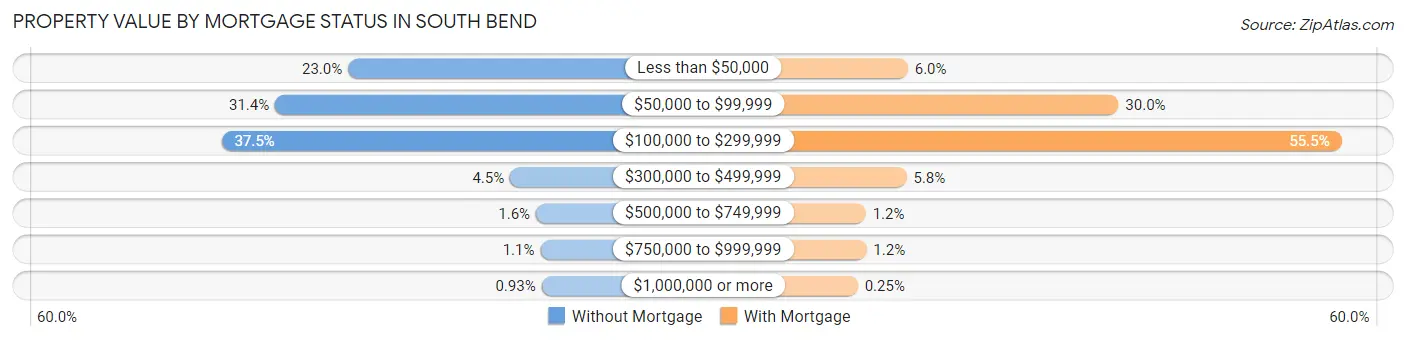
| Property Value | Without Mortgage | With Mortgage |
| Less than $50,000 | 2,297 (23.0%) | 821 (6.0%) |
| $50,000 to $99,999 | 3,129 (31.4%) | 4,133 (30.0%) |
| $100,000 to $299,999 | 3,739 (37.5%) | 7,641 (55.5%) |
| $300,000 to $499,999 | 451 (4.5%) | 802 (5.8%) |
| $500,000 to $749,999 | 156 (1.6%) | 159 (1.2%) |
| $750,000 to $999,999 | 106 (1.1%) | 170 (1.2%) |
| $1,000,000 or more | 93 (0.9%) | 34 (0.3%) |
| Total | 9,971 (100.0%) | 13,760 (100.0%) |
Household Income by Mortgage Status in South Bend
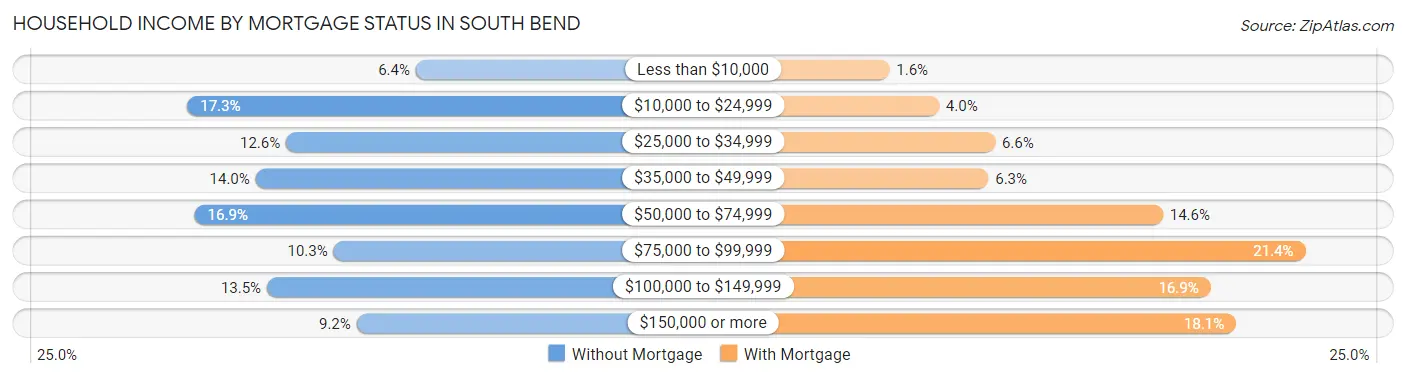
| Household Income | Without Mortgage | With Mortgage |
| Less than $10,000 | 635 (6.4%) | 221 (1.6%) |
| $10,000 to $24,999 | 1,720 (17.2%) | 546 (4.0%) |
| $25,000 to $34,999 | 1,251 (12.6%) | 913 (6.6%) |
| $35,000 to $49,999 | 1,396 (14.0%) | 870 (6.3%) |
| $50,000 to $74,999 | 1,685 (16.9%) | 2,013 (14.6%) |
| $75,000 to $99,999 | 1,026 (10.3%) | 2,948 (21.4%) |
| $100,000 to $149,999 | 1,342 (13.5%) | 2,327 (16.9%) |
| $150,000 or more | 916 (9.2%) | 2,494 (18.1%) |
| Total | 9,971 (100.0%) | 13,760 (100.0%) |
Property Value to Household Income Ratio in South Bend
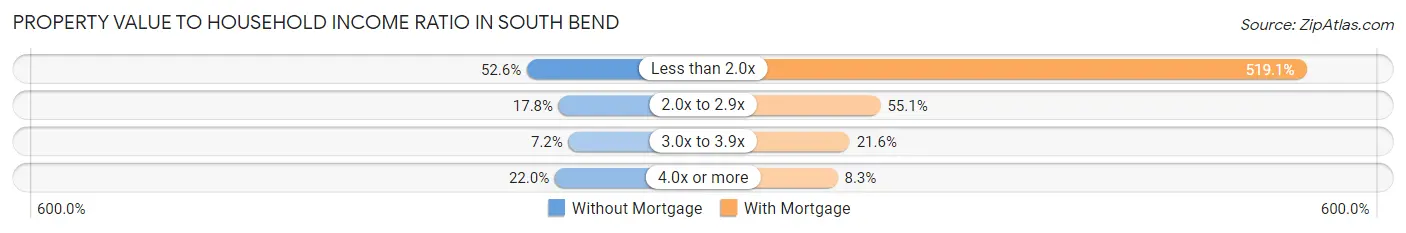
| Value-to-Income Ratio | Without Mortgage | With Mortgage |
| Less than 2.0x | 5,242 (52.6%) | 71,427 (519.1%) |
| 2.0x to 2.9x | 1,779 (17.8%) | 7,580 (55.1%) |
| 3.0x to 3.9x | 716 (7.2%) | 2,970 (21.6%) |
| 4.0x or more | 2,197 (22.0%) | 1,136 (8.3%) |
| Total | 9,971 (100.0%) | 13,760 (100.0%) |
Real Estate Taxes by Mortgage Status in South Bend
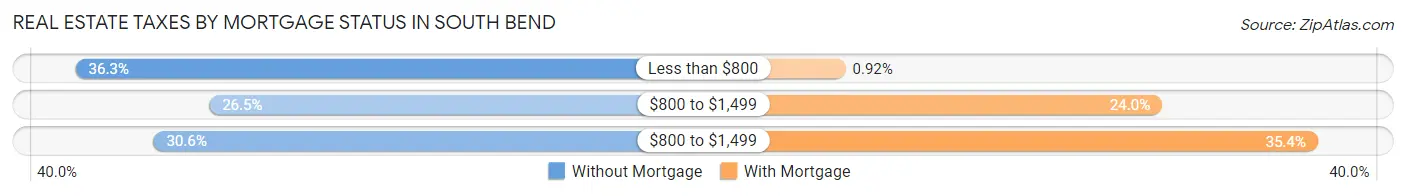
| Property Taxes | Without Mortgage | With Mortgage |
| Less than $800 | 3,616 (36.3%) | 127 (0.9%) |
| $800 to $1,499 | 2,643 (26.5%) | 3,307 (24.0%) |
| $800 to $1,499 | 3,049 (30.6%) | 4,872 (35.4%) |
| Total | 9,971 (100.0%) | 13,760 (100.0%) |
Health & Disability in South Bend
Health Insurance Coverage by Age in South Bend
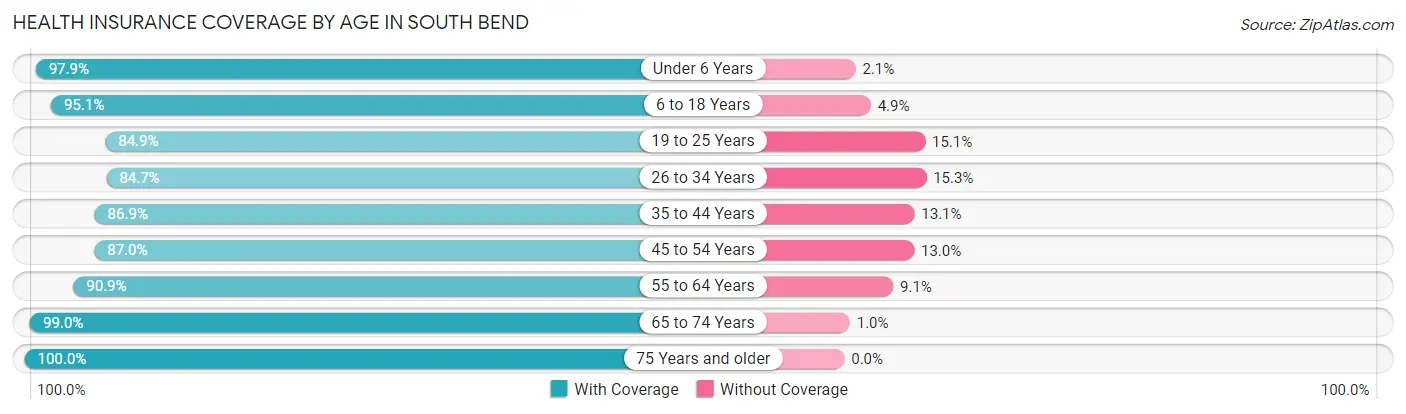
| Age Bracket | With Coverage | Without Coverage |
| Under 6 Years | 9,012 (97.9%) | 191 (2.1%) |
| 6 to 18 Years | 18,779 (95.1%) | 973 (4.9%) |
| 19 to 25 Years | 9,079 (84.9%) | 1,610 (15.1%) |
| 26 to 34 Years | 11,648 (84.7%) | 2,099 (15.3%) |
| 35 to 44 Years | 11,157 (86.9%) | 1,678 (13.1%) |
| 45 to 54 Years | 9,814 (87.0%) | 1,466 (13.0%) |
| 55 to 64 Years | 9,605 (90.9%) | 962 (9.1%) |
| 65 to 74 Years | 8,254 (99.0%) | 85 (1.0%) |
| 75 Years and older | 5,186 (100.0%) | 0 (0.0%) |
| Total | 92,534 (91.1%) | 9,064 (8.9%) |
Health Insurance Coverage by Citizenship Status in South Bend
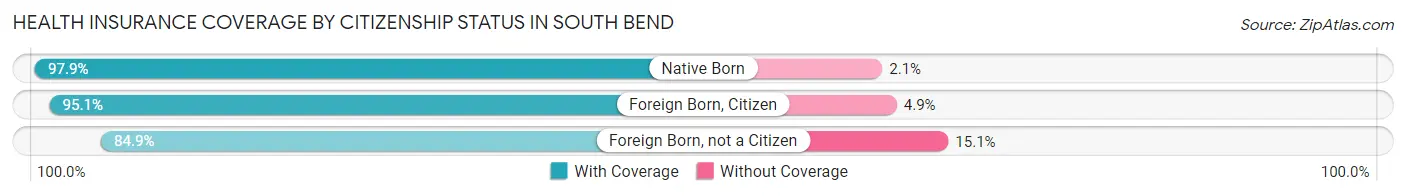
| Citizenship Status | With Coverage | Without Coverage |
| Native Born | 9,012 (97.9%) | 191 (2.1%) |
| Foreign Born, Citizen | 18,779 (95.1%) | 973 (4.9%) |
| Foreign Born, not a Citizen | 9,079 (84.9%) | 1,610 (15.1%) |
Health Insurance Coverage by Household Income in South Bend
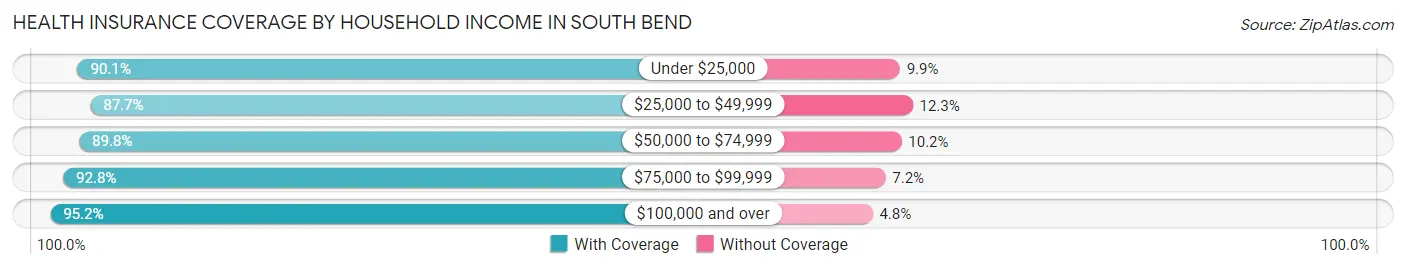
| Household Income | With Coverage | Without Coverage |
| Under $25,000 | 17,226 (90.1%) | 1,896 (9.9%) |
| $25,000 to $49,999 | 20,773 (87.7%) | 2,920 (12.3%) |
| $50,000 to $74,999 | 17,372 (89.8%) | 1,977 (10.2%) |
| $75,000 to $99,999 | 12,929 (92.8%) | 1,008 (7.2%) |
| $100,000 and over | 23,011 (95.2%) | 1,162 (4.8%) |
Public vs Private Health Insurance Coverage by Age in South Bend
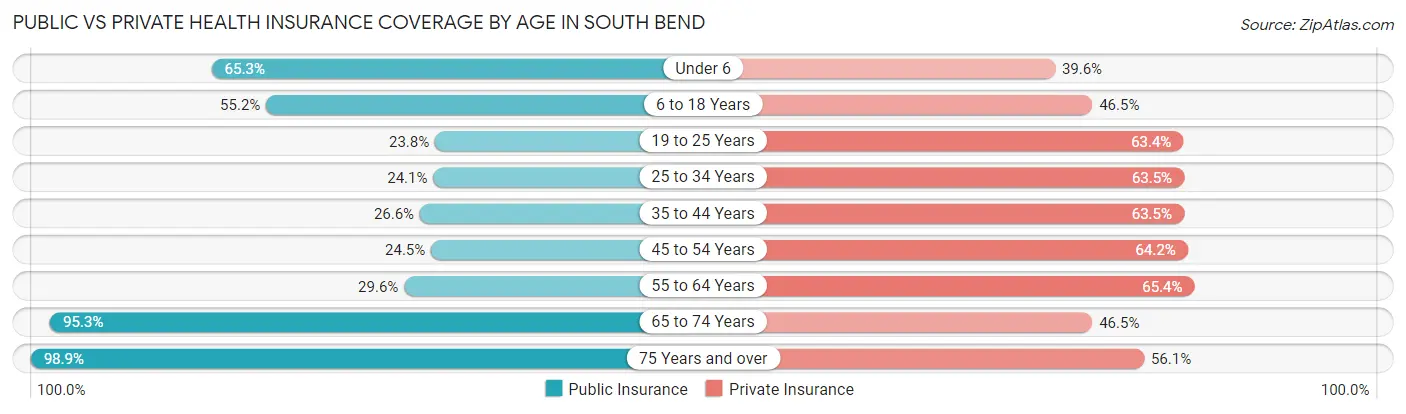
| Age Bracket | Public Insurance | Private Insurance |
| Under 6 | 6,008 (65.3%) | 3,641 (39.6%) |
| 6 to 18 Years | 10,895 (55.2%) | 9,182 (46.5%) |
| 19 to 25 Years | 2,546 (23.8%) | 6,773 (63.4%) |
| 25 to 34 Years | 3,319 (24.1%) | 8,729 (63.5%) |
| 35 to 44 Years | 3,417 (26.6%) | 8,147 (63.5%) |
| 45 to 54 Years | 2,768 (24.5%) | 7,241 (64.2%) |
| 55 to 64 Years | 3,123 (29.5%) | 6,915 (65.4%) |
| 65 to 74 Years | 7,945 (95.3%) | 3,876 (46.5%) |
| 75 Years and over | 5,127 (98.9%) | 2,909 (56.1%) |
| Total | 45,148 (44.4%) | 57,413 (56.5%) |
Disability Status by Sex by Age in South Bend
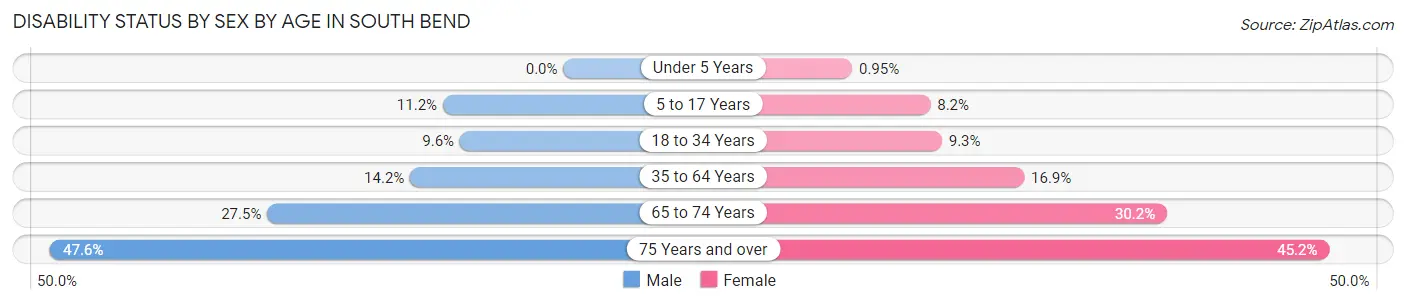
| Age Bracket | Male | Female |
| Under 5 Years | 0 (0.0%) | 38 (0.9%) |
| 5 to 17 Years | 1,138 (11.2%) | 828 (8.2%) |
| 18 to 34 Years | 1,176 (9.6%) | 1,249 (9.3%) |
| 35 to 64 Years | 2,361 (14.2%) | 3,059 (16.9%) |
| 65 to 74 Years | 1,065 (27.5%) | 1,347 (30.2%) |
| 75 Years and over | 795 (47.6%) | 1,591 (45.2%) |
Disability Class by Sex by Age in South Bend
Disability Class: Hearing Difficulty
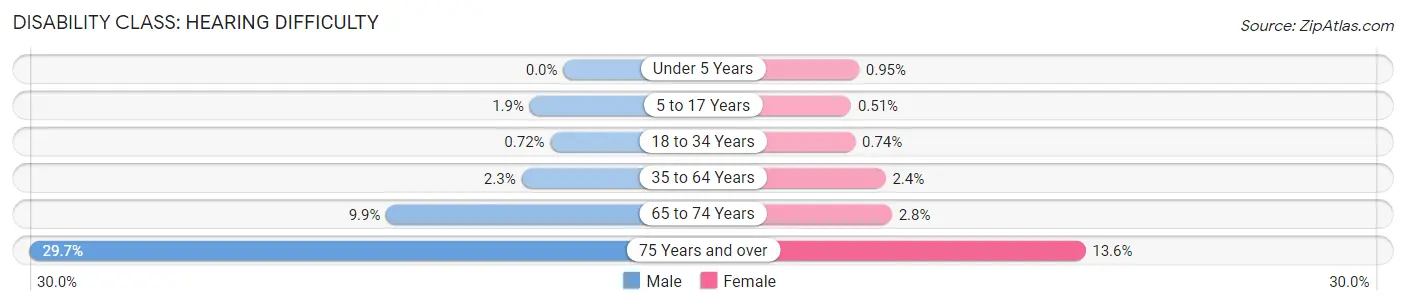
| Age Bracket | Male | Female |
| Under 5 Years | 0 (0.0%) | 38 (0.9%) |
| 5 to 17 Years | 190 (1.9%) | 51 (0.5%) |
| 18 to 34 Years | 88 (0.7%) | 99 (0.7%) |
| 35 to 64 Years | 387 (2.3%) | 439 (2.4%) |
| 65 to 74 Years | 382 (9.9%) | 124 (2.8%) |
| 75 Years and over | 496 (29.7%) | 477 (13.6%) |
Disability Class: Vision Difficulty
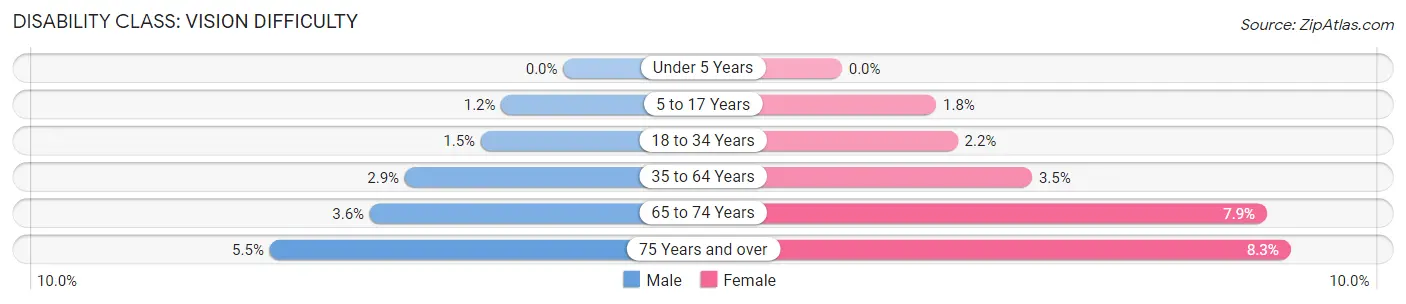
| Age Bracket | Male | Female |
| Under 5 Years | 0 (0.0%) | 0 (0.0%) |
| 5 to 17 Years | 117 (1.1%) | 176 (1.8%) |
| 18 to 34 Years | 187 (1.5%) | 290 (2.1%) |
| 35 to 64 Years | 488 (2.9%) | 639 (3.5%) |
| 65 to 74 Years | 139 (3.6%) | 352 (7.9%) |
| 75 Years and over | 91 (5.4%) | 293 (8.3%) |
Disability Class: Cognitive Difficulty
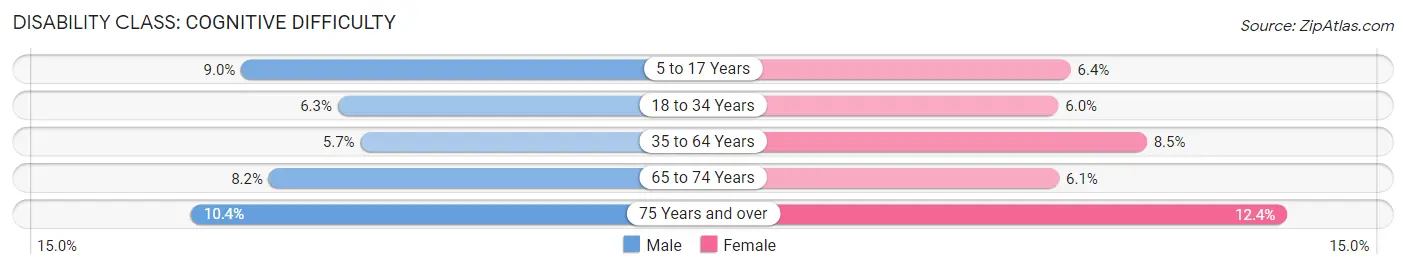
| Age Bracket | Male | Female |
| 5 to 17 Years | 913 (9.0%) | 642 (6.4%) |
| 18 to 34 Years | 769 (6.3%) | 812 (6.0%) |
| 35 to 64 Years | 937 (5.7%) | 1,536 (8.5%) |
| 65 to 74 Years | 318 (8.2%) | 270 (6.0%) |
| 75 Years and over | 173 (10.4%) | 436 (12.4%) |
Disability Class: Ambulatory Difficulty
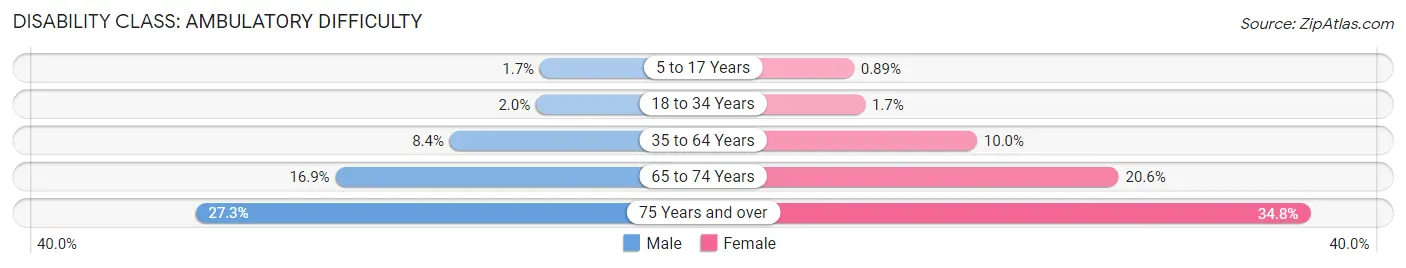
| Age Bracket | Male | Female |
| 5 to 17 Years | 177 (1.7%) | 90 (0.9%) |
| 18 to 34 Years | 249 (2.0%) | 232 (1.7%) |
| 35 to 64 Years | 1,399 (8.4%) | 1,813 (10.0%) |
| 65 to 74 Years | 656 (16.9%) | 917 (20.5%) |
| 75 Years and over | 456 (27.3%) | 1,223 (34.8%) |
Disability Class: Self-Care Difficulty
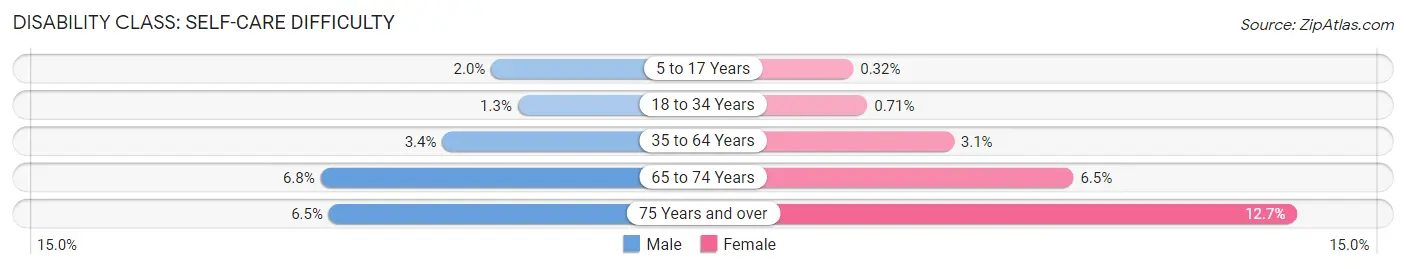
| Age Bracket | Male | Female |
| 5 to 17 Years | 205 (2.0%) | 32 (0.3%) |
| 18 to 34 Years | 156 (1.3%) | 95 (0.7%) |
| 35 to 64 Years | 559 (3.4%) | 564 (3.1%) |
| 65 to 74 Years | 262 (6.8%) | 288 (6.5%) |
| 75 Years and over | 109 (6.5%) | 446 (12.7%) |
Technology Access in South Bend
Computing Device Access in South Bend
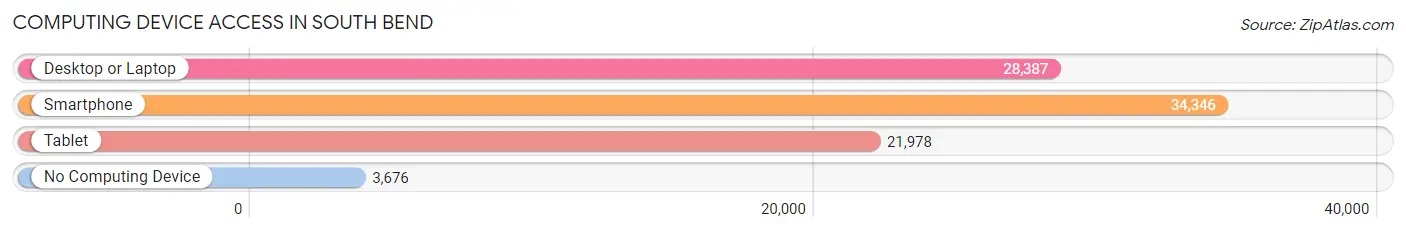
| Device Type | # Households | % Households |
| Desktop or Laptop | 28,387 | 70.0% |
| Smartphone | 34,346 | 84.7% |
| Tablet | 21,978 | 54.2% |
| No Computing Device | 3,676 | 9.1% |
| Total | 40,559 | 100.0% |
Internet Access in South Bend
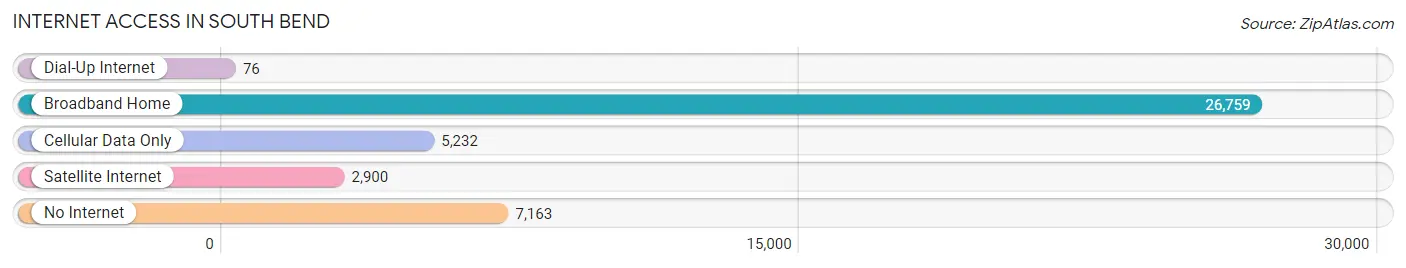
| Internet Type | # Households | % Households |
| Dial-Up Internet | 76 | 0.2% |
| Broadband Home | 26,759 | 66.0% |
| Cellular Data Only | 5,232 | 12.9% |
| Satellite Internet | 2,900 | 7.1% |
| No Internet | 7,163 | 17.7% |
| Total | 40,559 | 100.0% |
South Bend Summary
South Bend, Indiana is a city located in St. Joseph County, in the northern part of the state. It is the fourth-largest city in Indiana, with a population of over 101,000 people. The city is situated on the St. Joseph River, near the Michigan border. South Bend is home to the University of Notre Dame, as well as several other colleges and universities.
History
South Bend was founded in 1820 by fur traders, who named the settlement after the St. Joseph River. The city was incorporated in 1865, and quickly grew to become a major industrial center. During the late 19th and early 20th centuries, South Bend was home to several large manufacturing companies, including the Studebaker Corporation, which produced automobiles, and the Oliver Chilled Plow Works, which produced farm equipment.
The city was also home to a large African-American population, which was largely concentrated in the city’s west side. This population was largely the result of the Great Migration, when African-Americans moved from the South to the North in search of better economic opportunities.
Geography
South Bend is located in the northern part of Indiana, near the Michigan border. The city is situated on the St. Joseph River, and is surrounded by several smaller towns and villages. The city is located in a region known as the Michiana region, which includes the cities of Elkhart, Mishawaka, and Goshen.
The city has a total area of 36.2 square miles, of which 35.7 square miles is land and 0.5 square miles is water. The city is located in a humid continental climate zone, with hot summers and cold winters.
Economy
South Bend’s economy is largely based on manufacturing and healthcare. The city is home to several large manufacturing companies, including AM General, Honeywell, and Bosch. The city is also home to several healthcare providers, including Memorial Hospital, St. Joseph Regional Medical Center, and the University of Notre Dame.
The city is also home to several educational institutions, including the University of Notre Dame, Indiana University South Bend, and Ivy Tech Community College. The city is also home to several cultural attractions, including the South Bend Museum of Art, the South Bend Civic Theatre, and the South Bend Symphony Orchestra.
Demographics
As of the 2010 census, South Bend had a population of 101,168 people. The racial makeup of the city was 68.2% White, 25.2% African American, 0.4% Native American, 1.7% Asian, 0.1% Pacific Islander, 1.7% from other races, and 2.7% from two or more races. Hispanic or Latino of any race were 5.3% of the population.
The median income for a household in the city was $35,902, and the median income for a family was $45,919. The per capita income for the city was $20,945. About 17.2% of families and 21.3% of the population were below the poverty line, including 30.2% of those under age 18 and 9.2% of those age 65 or over.
Common Questions
What is Per Capita Income in South Bend?
Per Capita income in South Bend is $28,071.
What is the Median Family Income in South Bend?
Median Family Income in South Bend is $61,974.
What is the Median Household income in South Bend?
Median Household Income in South Bend is $49,056.
What is Income or Wage Gap in South Bend?
Income or Wage Gap in South Bend is 27.4%.
Women in South Bend earn 72.6 cents for every dollar earned by a man.
What is Family Income Deficit in South Bend?
Family Income Deficit in South Bend is $11,956.
Families that are below poverty line in South Bend earn $11,956 less on average than the poverty threshold level.
What is Inequality or Gini Index in South Bend?
Inequality or Gini Index in South Bend is 0.49.
What is the Total Population of South Bend?
Total Population of South Bend is 103,084.
What is the Total Male Population of South Bend?
Total Male Population of South Bend is 49,028.
What is the Total Female Population of South Bend?
Total Female Population of South Bend is 54,056.
What is the Ratio of Males per 100 Females in South Bend?
There are 90.70 Males per 100 Females in South Bend.
What is the Ratio of Females per 100 Males in South Bend?
There are 110.26 Females per 100 Males in South Bend.
What is the Median Population Age in South Bend?
Median Population Age in South Bend is 33.4 Years.
What is the Average Family Size in South Bend
Average Family Size in South Bend is 3.3 People.
What is the Average Household Size in South Bend
Average Household Size in South Bend is 2.5 People.
How Large is the Labor Force in South Bend?
There are 49,384 People in the Labor Forcein in South Bend.
What is the Percentage of People in the Labor Force in South Bend?
63.1% of People are in the Labor Force in South Bend.
What is the Unemployment Rate in South Bend?
Unemployment Rate in South Bend is 5.5%.